Embed Size (px)
Citation preview

ZS: Toronto | +1 416 777 5100
Hotel Sales
Incentives Practice Research – Summary
April 17th, 2015 This report is solely for the use of all direct recipients. No part of it may be circulated, quoted
or reproduced for distribution to any third party without prior written approval of ZS Associates
and The Hospitality Sales & Marketing Association International (HSMAI) Foundation.
HSMAI: McLean, VA | +1 703 506 3280
DRAFT—NOT FOR DISTRIBUTION
Impact where it matters

− 2 − © 2015 ZS Associates | CONFIDENTIAL | HSMAI 2014 Hotel Sales IPR v1.0
ZS Associates and The Hospitality Sales & Marketing Association International (HSMAI)
Foundation are pleased to present this summary of the inaugural edition of the Sales Incentives
Practice Research for the hotel industry. This is the first data-validated compensation design
survey for the hotel industry.
Our goal in undertaking this project is to provide information to hotel leaders interested in
understanding common practices in incentive plan design and levels of satisfaction from users.
We hope this study will help provide guidance for your 2016 compensation planning.
If you have any questions or comments, please contact Tony Yeung
<[email protected]> or Juli Jones <[email protected]>.
Best Regards,
This report is published by ZS Associates, Inc. and The Hospitality Sales & Marketing Association International (HSMAI) Foundation and contains information based on input from companies or
individuals engaged in the development or management of sales compensation plans
Introduction

− 3 − © 2015 ZS Associates | CONFIDENTIAL | HSMAI 2014 Hotel Sales IPR v1.0
Contents
Methodology. . . . . . . . . . . . . . . . . . . . . . . . . . . . . . . . . . . . . . . . . . . . . . . . . . . . . . . . . . . . . 4 Placeholder
Executive Summary. . . . . . . . . . . . . . . . . . . . . . . . . . . . . . . . . . . . . . . . . . . . . . . . . . . . . . . 7 Placeholder
− 4 − © 2015 ZS Associates | CONFIDENTIAL | HSMAI 2014 Hotel Sales IPR v1.0
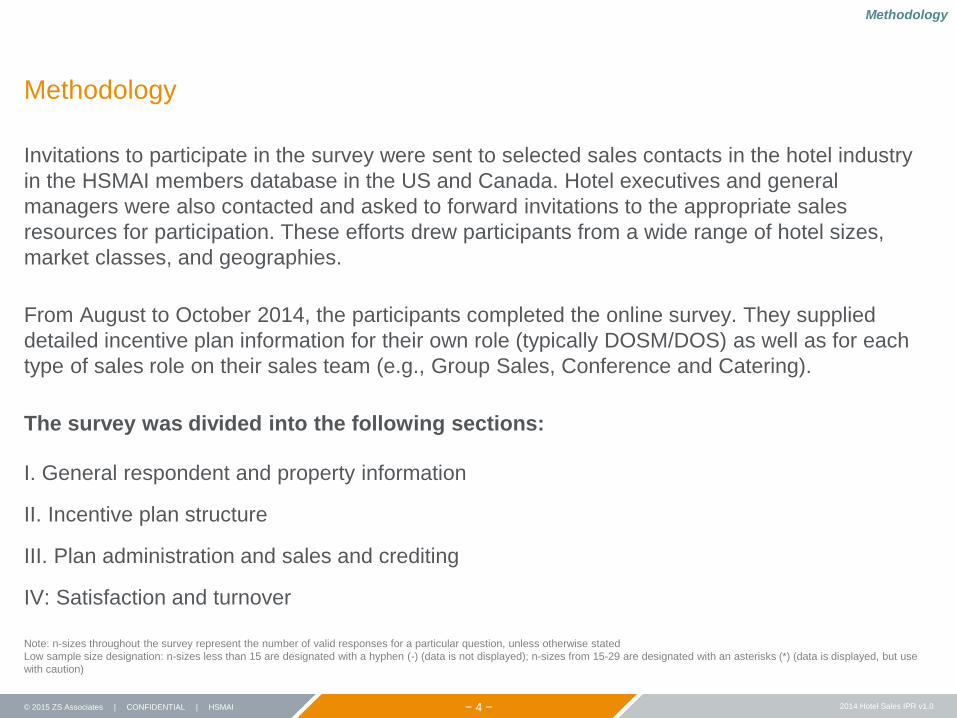
Methodology
Invitations to participate in the survey were sent to selected sales contacts in the hotel industry
in the HSMAI members database in the US and Canada. Hotel executives and general
managers were also contacted and asked to forward invitations to the appropriate sales
resources for participation. These efforts drew participants from a wide range of hotel sizes,
market classes, and geographies.
From August to October 2014, the participants completed the online survey. They supplied
detailed incentive plan information for their own role (typically DOSM/DOS) as well as for each
type of sales role on their sales team (e.g., Group Sales, Conference and Catering).
The survey was divided into the following sections:
I. General respondent and property information
II. Incentive plan structure
III. Plan administration and sales and crediting
IV: Satisfaction and turnover
Note: n-sizes throughout the survey represent the number of valid responses for a particular question, unless otherwise stated
Low sample size designation: n-sizes less than 15 are designated with a hyphen (-) (data is not displayed); n-sizes from 15-29 are designated with an asterisks (*) (data is displayed, but use
with caution)
Methodology

− 5 − © 2015 ZS Associates | CONFIDENTIAL | HSMAI 2014 Hotel Sales IPR v1.0
Respondent Job Title Description Sample
Size
Current
Position
Current
Hotel
Overall Hotel
Experience
Director of Sales and
Marketing Oversees sales and marketing functions 85 5.4 6.7 21.4
Director of Sales Oversees sales function 34 3.9 5.8 17.8
Sales Manager Primary responsibility is direct selling, often with
other managerial duties 42 3.9 5.0 17.0
General Manager Oversees all aspects of hotel operations 12 5.4 6.5 23.7
Other* Job title other than those described above 27 5.3 7.6 22.5
Total Respondents 200 4.8 6.3 20.2
Values in years
Respondent Experience by Job Title and Sample Size
Methodology
Q1. Please enter your approximate years of professional experience.
Q2. What is your current job title?
Results are compiled with inputs from 200 experienced managers describing
their own incentive plans as well as the plans of their sales teams

− 6 − © 2015 ZS Associates | CONFIDENTIAL | HSMAI 2014 Hotel Sales IPR v1.0
Methodology
* For reporting purposes, Large Group Sales, Sales Group Sales / Executive Meeting Managers, and General Group Sales have been grouped together as “Group Sales”
Note: Each respondent was able to report the incentive plan details separately for each sales segment present in their hotel; the sales segment responses are equally weighted; that is, each
response for a sales segment counts as one response, regardless of the actual number of sales people or size of a particular property; this prevents distortion towards large teams and
properties
Q2: Job Title; Q3: Which of the following statements best describe the respondent’s position?
Sales Roles Description # of Incentive Plans
Described
Sa
les
Ma
na
ge
me
nt DOSM Oversees sales and marketing functions 75
DOS Oversees sales function 26
Sales Management (No Direct
Reports) DOSM or DOS title with no direct reports 16
Sa
les
Te
am
Sales Manager Primary responsibility is direct selling, often with other managerial duties 38
Large Group Sales* Focuses on groups that book large blocks of rooms for one or more nights (no catering sales)
105
Small Group Sales / Executive Meeting Managers*
Focuses on groups that book blocks of rooms generally for a single day event (e.g., wedding, prom, etc.) and may include catering sales
101
General Group Sales* Focused on any group, regardless of the size of booking, and could include catering sales
76
Transient Sales Focused on selling rack, corporate, corporate negotiated, package, permanent guests, government, leisure, or foreign traveler rates
105
Hybrid Sales Focused on selling rooms to both group and transient customers 27
Conference & Catering Focused primarily on selling conference space and/or catering services 115
General Sales Sells every service provided by the hotel with no specialization 39
Sales Segment Descriptions and Sample Size
Respondents were categorized into sales roles based on primary
responsibilities; 723 unique incentive plan descriptions were collected

− 7 − © 2015 ZS Associates | CONFIDENTIAL | HSMAI 2014 Hotel Sales IPR v1.0
Executive Summary

− 8 − © 2015 ZS Associates | CONFIDENTIAL | HSMAI 2014 Hotel Sales IPR v1.0
The Hotel Incentives Practices Study
provides a clear picture of:
− Incentive plan design
− Plan administration practices
− Perceived issues and opportunities
1. Continued requirement to ensure that overall
compensation levels are competitive, both
within the industry and outside
2. Increased pay-for-performance, to better
reward top performers
– Higher plan upside and downside risk, with
greater focus on metrics within an individual
salesperson’s control
3. Improved performance reporting, to increase
plan motivational impact
– More frequent and readily available
performance tracking tools for individual sellers
4. More accurate sales goals, to better reflect
performance expectations
Many common practices exist across the
hotel industry, particularly overall plan
structure and performance metrics
The industry is faced with low overall
satisfaction with current incentive plan
practices, most notably driven by:
− Dissatisfaction with overall pay levels
− Low payout upside and overall pay for
performance
− Stretch sales goals
− Limited performance reporting and plan
administration enablement
Key Findings
The Hotel Incentives Practices Study suggests some important opportunities
for sales leaders
Executive Summary
Opportunities for the Hotel Industry

− 9 − © 2015 ZS Associates | CONFIDENTIAL | HSMAI 2014 Hotel Sales IPR v1.0
Goal-based incentive plans dominate the hotel industry, and are typically
determined by 3 or fewer metrics
Revenue (either Rooms or Total Hotel Revenue) is the most common
performance metric across all sales roles, although:
– Sales leaders’ (DOSMs, DOSs) plans often contain a hotel profit component
– Catering and Conference Services salespeople’s plans often contain F&B
component
Incentive plans almost always include minimum performance thresholds
More than half of sales managers and team members report an absolute cap on
their incentive payout
Sales team high performers only earn ~1.5x higher incentive pay than average
performers, whereas other industries typically pay a difference of 3x or more
Plan Structure
Plan
Administration ~2/3 of respondents manage incentive administration processes on-property,
while others are managed at the brand / corporate level
Payouts are typically made ~6 weeks after the end of the performance period
Performance reporting is generally poor; a majority of respondents stated that
they manually monitor their performance relative to the incentive plan
Executive Summary
Sales plans are typically goal-based, with both minimum performance
thresholds and absolute payout caps

− 10 − © 2015 ZS Associates | CONFIDENTIAL | HSMAI 2014 Hotel Sales IPR v1.0
Overall satisfaction with current incentive plans is low
– Average Net Promoter Score* was -26.5%, which indicates that most respondents
are unlikely to recommend their current plan to others
The respondents find several aspects as important for plan satisfaction, but
largely find their companies’ effectiveness of each aspect to be low
However, key opportunity areas have been identified for aspects that
significantly drive incentive plan satisfaction but are rated as low on
companies’ current level of effectiveness:
− Widen differential-earning: Set payout levels for highly motivating and equitable
incentive plans whereby the true stars consistently earn more than the lower
performers
− Set effective goals: Ensure that quotas are set to be realistic, accurate and
achievable for most of the sales team
− Set competitive pay levels: Regularly benchmark pay levels of the competition
and align base and incentive pay accordingly
Executive Summary
Overall satisfaction with incentive plans is low, but key opportunities have
been identified to improve satisfaction
Plan
Satisfaction
*Net Promoter Score is calculated by [% of total Promoters - % of total Detractors]
Q34. Pretend that you are giving a recommendation to a friend of a colleague who is managing a hotel similar to your own, how likely are you to recommend that your company’s
incentive plan be used at their property? Assume there are no competitive considerations. (0 = Not at all likely, 10 = Extremely likely)

− 11 − © 2015 ZS Associates | CONFIDENTIAL | HSMAI 2014 Hotel Sales IPR v1.0
Sales Management Sales Team Conf. Services &
Catering
Dominant Plan Components*
Goal-based (74%)
MBO** (Management by
Objectives) (32%)
Goal-based (83%)
MBO** (20%)
Goal-based (82%)
MBO** (19%)
Primary Performance Metrics*
Room Night Revenue (36%) Total Hotel Revenue (39%) Total Hotel Revenue (51%)
Total Hotel Revenue (26%) Room Night Revenue (32%) Food and Beverage Revenue
(32%)
Gross Operating Profit (20%) Room Nights (10%) Room Night Revenue (9%)
% of plans that use minimum
thresholds 91% 95% 96%
% of plans that use caps or
decelerators 64% 62% 59%
Target Incentive (% of Base
Pay) 20% 22% 19%
Actual Incentive (% of Base
Pay) 16% 18% 14%
Top-to-average performer
incentive pay ratio 2.9x 1.5x 1.4x
% of Potential Payout Achieved 80% 82% 74%
Executive Summary
*Note: Some metric values do not sum to 100%; respondents can choose all that apply
** MBO: Management by Objectives (based on qualitative goals that are periodically evaluated for completion)
Plan structures are overall very similar, only subtle differences were
observed between the common structures and metrics of each group

− 12 − © 2015 ZS Associates | CONFIDENTIAL | HSMAI 2014 Hotel Sales IPR v1.0
46.0%
34.5%
19.5%
Detractors(0 - 6)
Passives(7 - 8)
Promoters(9 - 10)
# of respondents (n=200)
Net Promoter Score (NPS)*:
- 26.5%
Executive Summary
NPS: The likelihood that someone would
recommend their current plan
Respondents receiving a higher level of
compensation are more likely to recommend their
plans
Compensation issues were identified as the most
challenging sales compensation issues:
– Competitiveness of pay
– Adequate upside opportunity
However, several non-compensation issues were
also listed as challenges for many properties:
– Quota-setting fairness
– Sales forecast accuracy
– Effective administration
*Net Promoter Score is calculated by [% of total Promoters - % of total Detractors]
Q34. Pretend that you are giving a recommendation to a friend of a colleague who is managing a hotel similar to your own, how likely are you to recommend that your company’s
incentive plan be used at their property? Assume there are no competitive considerations. (0 = Not at all likely, 10 = Extremely likely)
% of total Promoters (19.5%)
− % of total Detractors (46.0%)
Net Promoter Score (-26.5%)
Extremely
likely
Not at
all likely
There is dissatisfaction with current incentive practices, with total
compensation levels stated as the biggest driver
Likelihood to Recommend Current Incentive
Plan

− 13 − © 2015 ZS Associates | CONFIDENTIAL | HSMAI 2014 Hotel Sales IPR v1.0
0.3
0.4
0.5
0.6
0.7
5% 15% 25% 35%
Opportunity for Improvement
However, differential earning, competitive pay and effective goals are key
opportunity areas to increase plan satisfaction
* “Low firm effectiveness” denotes responses “Not at all effective” or “Slightly effective” (1/2 on 5-point scale)
Q34. Pretend that you are giving a recommendation to a friend of a colleague who is managing a hotel similar to your own, how likely are you to recommend that your
company’s incentive plan be used at their property? Assume there are no competitive considerations.
Q39. Sales force satisfaction: How effective do you believe your company is at doing this?
Derived Drivers of Satisfaction vs. Improvement Opportunities
De
rive
d Im
po
rta
nc
e
Co
rre
lation
of F
irm
Eff
ective
ne
ss
to P
lan S
atisfa
ction
% of Respondents Rating Low Firm Effectiveness*
Differential Earning
Competitive Pay
Work/Life
Balance
Effective Goals
Recognition
Programs
Learning and
Development Career
Opportunities
Communication of Strategy
Executive
Leadership Team
Hotel Leadership
Position
Areas of significant
drivers of incentive
plan satisfaction as
well as areas that can
be most improved
compared to firms’
current level of
effectiveness
# of respondents (n=200)
Highly important to
satisfaction
High opportunity for
improvement
Less important to
satisfaction
Low opportunity for
improvement
Higher importance to
satisfaction, firms currently
not as effective
Higher importance to
satisfaction, firms currently
somewhat effective
Lower importance to
satisfaction, firms currently
not as effective
Lower importance to
satisfaction, firms currently
somewhat effective
Executive Summary