Embed Size (px)
Citation preview

2013
www.jll.com/hospitality
Hotel Investment Outlook

“ Globally, hotel operating fundamentals are poised to remain strong in 2013, but regional variances will persist. We forecast global deal volume of $33 billion, in line with the most recent three-year average. Hampering transactional growth, however, are economic pressures in a number of the world’s mature economies. Still, we expect that the global hotel investment market will be flush with equity capital that will support transactional activity. This publication provides a comprehensive analysis of the global hotel investment market, revealing key drivers of investment, emerging trends, markets to watch and investment opportunities in major markets across the globe. We hope you will find the report informative.”
Mark Wynne-Smith Global CEO
Jones Lang LaSalle’s Hotels & Hospitality Group serves as the hospitality industry’s global leader in real estate services for luxury, upscale, select service and budget hotels; timeshare and fractional ownership properties; convention centers; mixed-use developments and other hospitality properties. The firm’s more than 265 dedicated hotel and hospitality experts partner with investors and owner/operators around the globe to support and shape investment strategies that deliver maximum value throughout the entire lifecycle of an asset. In the last five years, the team completed more transactions than any other hotels and hospitality real estate advisor in the world totaling nearly US$25 billion, while also completing approximately 4,000 advisory and valuation assignments. The group’s hotels and hospitality specialists provide independent and expert advice to clients, backed by industry-leading research.
For more news, videos and research from Jones Lang LaSalle’s Hotels & Hospitality Group, please visit: www.jll.com/hospitality

Contributors
Table of contents
Arthur de Haast Chairman
Mark Wynne-Smith Global CEO
Arthur Adler CEO, Americas
Jon Hubbard CEO, Northern Europe
Christoph Härle CEO, Continental Europe
Craig Collins CEO, Australasia
Scott Hetherington CEO, Asia
David Green-Morgan Global Capital Markets Research Director
Karen Wales Executive Vice President, Research, Asia Pacific
Lauro Ferroni Vice President, Research, Americas
Josef Filser Associate, Research, EMEA
Global overview ...............................................................2
Americas ..........................................................................8
EMEA ............................................................................16
Asia Pacific ....................................................................24
Sources and methodology .............................................32

Global overview

January 2013 | Hotel Investment Outlook 3
Highlights• Global hotel transactions reached $31.8 billion in 2012,
a 5% decrease on 2011. For 2013 we are expecting a slight improvement to $33 billion, despite continued economic uncertainties, with activity supported by the primary investment markets of the U.S., U.K., France, Germany, Japan and Australia.
• Private equity players, sovereign wealth funds and family conglomerates together with REITs are set to dominate buying activity in 2013. Debt financing, while improving considerably in the U.S., will remain constrained across Europe where refinancing challenges will trigger a number of sales.
• Cross-border capital accounted for 30% of global hotel investment in 2012, trending above the recent average and driven by strong outbound capital flows from Asia and the Middle East. Improving transparency will continue to aid cross-border decision making.
• Prime assets in the world’s largest cities will garner the most investor interest, improving pricing. Hotels in secondary markets will see more sluggish interest until seller expectations reset.
• Globally, hotel operating fundamentals are poised to remain strong in 2013, but regional variances will persist.
Hotel transaction volume forecast snapshot
Source: Jones Lang LaSalle
US$ billions 2012E 2013F TrendAmericas $17.5 $18.5
EMEA $11.0 $11.0
Asia Pacific $3.3 $3.5
Global total $31.8 $33.0

4 Hotel Investment Outlook | January 2013
Steady deal pace in 2012
Primary markets led a steady pace of deal activity in the hotel investment arena during 2012. While the year was tougher than initially hoped, the pace of transactions endured and some signs of revival continue to feature in the debt markets.
That said, economic headwinds kept a lid on overall global volume improvement. Specifically, growth was tempered by the slowdown in emerging markets, as well as concerns about the U.S. debt ceiling and Eurozone woes. Total transactions reached $31.8 billion, a 5% softening on 2011 levels. While the Americas region held steady at $17.5 billion, Europe, Middle East and Africa (EMEA) and Asia Pacific slowed down by 10% and 30%, posting deal volumes of $11 billion and $3.3 billion, respectively.
Continued momentum in 2013
In 2013, we forecast global deal volume of $33 billion, in line with the most recent three-year average. Hampering transactional growth, however, are economic pressures in a number of the world’s mature economies, along with long-term ownership structures in emerging markets, particularly in Asia. Still, we expect that the global hotel investment market will be flush with equity capital that will support transactional activity.
In the Americas, investment volume is expected to see some upside, reaching $18.5 billion. In EMEA, new sources of debt and stable trading fundamentals will maintain deal pace at a projected $11 billion, with investment activity driven by debt restructuring deals. Hotel real estate in vast parts of Asia remains closely held, which constrains overall liquidity. The region’s volumes are expected to mark a slight uptick to $3.5 billion in 2013, with activity concentrated in Australia and Japan.
Our forecasts are based on how key drivers of transactions volume—such as cost of capital, industry fundamentals, share prices of listed investment vehicles and the overall ownership composition—are expected to perform in 2013.
Economic forecast shows long road ahead
In many regards, global commercial property markets have bucked wider economic trends. Their capital values, hotel trading fundamentals and rents are all generally improving against a backdrop of downward revisions to economic growth. Given the amount of stimulus injected into the world economy, growth rates for 2013 to 2015 should be well above the current levels. In fact, it looks as though it will take until 2015 for growth to match 2010 levels. This implies that the changes occurring are more structural than cyclical, which has a profound impact on investment strategies moving forward.
Austerity will continue to be a drag on growth with little prospect of relief in most of the major developed economies. Government debt as a proportion of GDP is highest in Japan, Italy, France, the U.S. and the U.K., with a big impact on these countries’ economic prospects. The bright spot for Europe is that the governments have started to take action, whereas in the U.S. and Japan, policymakers continue to stall on decisive action.
Real GDP growth forecast by major region
Source: IHS Global Insight
-1.0% 0.0% 1.0% 3.0% 5.0% 7.0%2.0% 4.0% 6.0%
Australasia
Asia
Sub-Saharan Africa
Middle East and North Africa
Emerging Europe
Eurozone
Latin America
U.S. and Canada
World average
2014F2013F2012
Global hotel transaction volume 1998 - 2013F
Source: Jones Lang LaSalle
0
20
40
60
80
100
120
140
1998
1999
2000
2001
2002
2003
2004
2005
2006
2007
2008
2009
2010
2011
2012
E
2013
F
Asia Pacific EMEA Americas Global
Volum
e ($B
illion
s)

January 2013 | Hotel Investment Outlook 5
Herd mentality and the gap
The hotel market is mirroring wider commercial property markets in that secure investments are chosen over higher yielding opportunities. Investors have seen prime assets in top locations trade the best during various economic cycles and these will therefore continue to be the most sought-after properties. We expect this to continue as long as uncertainty is evident, especially in Western Europe, and to a degree in the U.S., resulting in some “herd mentality” amongst investors.
Secondary markets are a different story, featuring a wide pricing gap between sellers and buyers. Investors remain cautious about timing and are reluctant to become overexposed. This will constrain deal volume in Europe, in particular. The short term appears cautiously optimistic for U.S. markets, and upside exists if owners/inadvertent owners such as lenders accept lower pricing. Asia’s investment landscape remains tightly held; investors need to be prepared to consider all markets and hotel asset types if they wish to build scale.
Private equity fronts a strong bench of buyers
Hotel buyers will remain engaged in 2013, with a strong bench of buyer groups. Counter-cyclical buyers such as private equity investors in the U.S. and Europe, along with conglomerates in Southeast Asia, will lead the pack, seizing opportunities to acquire rare assets in displaced capital markets. Given their significant buying power and risk tolerance in a volatile environment, they are in position to achieve opportunistic returns.
REITs, who have a lower risk profile, will continue to make headline acquisitions in 2013, seeking to diversify their portfolios, particularly in North America and some markets across Europe. In Asia Pacific, the successful listing of two new hotel REITs in Singapore and more planned for 2013 is likely to result in higher volumes by these groups.
Sovereign wealth funds from Qatar and Abu Dhabi, as well as emerging capital from China and Indonesia will also scour the globe for trophy opportunities. To a lesser extent, U.S.-based private equity funds will make selective bids in targeted regions.
On the sell-side, inadvertent owners such as banks and receivers will drive a significant share of product to market. Private equity firms and institutional investors are also expected to liquidate some previous acquisitions, either to divest select non-core assets or to fund life maturities.
Cross-border investments rise
The rise in movement of global capital is driven by opportunistic purchases of assets which rarely come to market, as well as investors yearning for diversification of currency, geography, political policy and economics.
Cross-border capital accounted for 30% of global hotel investment in 2012, trending above the recent average and driven by strong outbound capital flow from the Middle East and Asia. Sovereign wealth funds and family conglomerates are the key investment vehicles which will export capital in 2013. It is expected that cross-border capital will continue to flow and possibly accelerate in 2013.
Re-emergence of debt and new players
Debt liquidity is still constrained, but should be at its highest level in 2013 since 2007, notwithstanding regional variances. Large banks, traditionally key providers of real estate debt financing, still don’t have sufficient capacity to lend significant sources of new money, but are reducing their exposure to bad loans.
The U.S. debt markets are strongly re-emerging, driven by commercial mortgage-backed securities (CMBS) lenders, who will continue to drive pricing, terms and accessibility. Balance sheet lenders are more selective with regard to asset quality, market and sponsorship, but are frequently able to provide the floating rate loan structures typically favoured by hotel owners. In EMEA, debt remains difficult to secure but there are signs of improvement, and we expect to see more liquidity in 2013. Across Asia Pacific, debt is not a factor except in Japan where a high proportion of CMBS loans still need to be worked out.
Other forms of debt financing are required to fill the gap, and various alternative groups, including sovereign wealth funds, insurance companies and mutual funds, have entered the real estate lending space by providing senior debt. Longer term, the debt environment in Europe is likely to more closely resemble that which exists in the U.S. as regulations make lending more attractive, particularly for insurers.
Over the longer term, the growing influence of emerging markets is likely to be felt through increasing savings rates which will find their way into the property market, and eventually the hotel market, by pension fund investors.
Government debt as % of GDP through 2014F
Source: IHS Global Insight
0%
50%
100%
150%
200%
250%
Austr
alia
Braz
il
China
Fran
ce
Germ
any
India
Italy
Japa
n
Unite
dKi
ngdo
m
U.S.
2012 2013F 2014F

6 Hotel Investment Outlook | January 2013
Hotel operating fundamentals galvanize outlook
Hotel operating fundamentals are generally holding strong, and in some cases are outperforming expectations, given economic pressures, which underscores the attractiveness of high quality, income producing hotel real estate as an asset class.
At the forefront of growth in revenue per available room (RevPAR) in 2013 are the world’s gateway cities and resource-rich countries. Markets that will see the most growth in demand and average room rates are those that are pursued by global travellers, along with those that are benefiting from demand due to the countries’ rising middle class. That said, the pace of growth will be below the bounce-back years of 2010 and 2011 in many markets.
Real estate market cultivates transparency
Market transparency, measured by availability of data, overall legal framework and governance of listed vehicles, for instance, has posted increases globally over the past two years, as surveyed in the Jones Lang LaSalle Real Estate Transparency Index.
Overall, these worldwide improvements are expected to have a positive effect on transaction volumes and cross-border capital flows. The destinations of foreign capital are generally highly liquid, transparent and secure markets. Increased transparency will be a key driver for the future of the industry as a whole.
Success playbook
As previous cycles provide few clues to what lies ahead in the next few years, investors look to new indicators to calculate investment roadmaps. While markets around the world continue to cultivate transparency and interdependence becomes more prevalent, the deal arena is increasingly globalised and therefore, a bigger playing field. Economic challenges are having a worldwide impact on how and with whom investors conduct deals. At the same time, the availability of data and information is expanding, increasing decision-making capacity.
Unexpected events, such as political unrest and natural disasters, seem to have become the norm. During this period of uncertainty and rapidly changing dynamics, greater flexibility will continue to be demanded from investors and all market participants. The ability to react to change will feature as a success indicator. In the future, victories will be predicated by players who adopt a culture and business model that incorporates effective risk assessment, strategic agility and flexible action.
4%
41%
3%
67%11%
25%
26%
22%
5%
77%
2% 16%
9%
100%
34%
61%
100%
North AmericaLatin AmericaEuropeMiddle EastAfricaAsiaAustralasiaGlobal
1%
Flow of capital around the globe in 2012
Proportion of investment within each region by source of capital
‘% global investment’ refers to transactions funded by private equity funds and investment banks that raise capital across a number of countries globally. Absence of arrow connecting two regions indicates that no cross-border investment was tracked in 2012. Percentages of each of the regions add up to 100%. Source: Jones Lang LaSalle
Region Domestic Intra-Regional Off-Shore GlobalNorth America 65% 2% 8% 26%Latin America 20% 14% 41% 25%Europe 47% 14% 27% 11%Middle East 75% 25% 0% 0%Asia 51% 49% 0% 0%Australasia 21% 1% 78% 0%

January 2013 | Hotel Investment Outlook 7
Global Real Estate Transparency - Composite Index, 2012
*Denotes new market added in 2012. Markets that appear tied have slightly different scores at higher levels of precision. Source: Jones Lang LaSalle, LaSalle Investment Management
Transparency Level
2012 Composite Rank Market 2012 Composite
Score
High
1 United States 1.262 United Kingdom 1.333 Australia 1.364 Netherlands 1.385 New Zealand 1.486 Canada 1.567 France 1.578 Finland 1.579 Sweden 1.6610 Switzerland 1.67
Tran
spar
ent
11 Hong Kong 1.7612 Germany 1.8013 Singapore 1.8514 Denmark 1.8615 Ireland 1.9616 Spain 2.0617 Belgium 2.0718 Norway 2.0819 Poland 2.1120 Italy 2.1621 South Africa 2.1822 Austria 2.2223 Malaysia 2.3224 Czech Republic 2.3425 Japan 2.3926 Hungary 2.5327 Brazil - Tier 1 2.5428 Portugal 2.54
Semi
29 Taiwan 2.6030 Brazil - Tier 2* 2.7531 Turkey 2.7632 China - Tier 1 2.8333 Greece 2.8434 Israel 2.8535 Philippines 2.8636 Slovakia 2.9037 Russia - Tier 1 2.9038 Indonesia 2.9239 Thailand 2.9440 Romania 2.9641 South Korea 2.9642 Puerto Rico* 2.9643 Mexico 2.9744 Russia - Tier 2 2.9845 Chile 3.0146 China - Tier 2 3.0447 UAE - Dubai 3.0548 India - Tier 1 3.0749 India - Tier 2 3.0850 India - Tier 3 3.15
Transparency Level
2012 Composite Rank Market 2012 Composite
Score
Semi
51 Croatia 3.1652 UAE - Abu Dhabi 3.2353 Macau 3.2754 Russia - Tier 3 3.2855 China - Tier 3 3.3156 Botswana* 3.3657 Bulgaria 3.4158 Argentina 3.4259 Mauritius* 3.4360 Cayman Islands* 3.4561 Ukraine 3.4662 Slovenia 3.5063 Bahrain 3.6264 Saudi Arabia 3.6365 Kenya* 3.7066 Lebanon 3.7567 Kuwait 3.76
Low
68 Vietnam 3.7669 Serbia* 3.7870 Costa Rica 3.7971 Bahamas* 3.8172 Qatar 3.8273 Jamaica* 3.8574 Oman 3.8575 Panama 3.8776 Morocco 3.8877 Egypt 3.8878 Zambia* 3.9379 Peru 3.9580 Jordan 3.9781 Uruguay 4.0482 Colombia 4.0583 Kazakhstan 4.0984 Dominican Republic 4.1585 Honduras* 4.2086 Guatemala* 4.20
Opaq
ue
87 Venezuela 4.2388 Mongolia* 4.3189 Tunisia 4.3890 Ghana* 4.4191 Iraq* 4.4492 Pakistan 4.4893 Algeria 4.4994 Belarus 4.5295 Angola* 4.5796 Nigeria* 4.5897 Sudan 4.59
Global Real Estate Transparency Index
Jones Lang LaSalle’s Global Real Estate Transparency Index is updated every two years and quantifies real estate market transparency across over 97 markets worldwide. The Index aims to help real estate investors, corporate occupiers and retailers understand important differences when transacting, owning and operating in foreign markets.

Americas

January 2013 | Hotel Investment Outlook 9
Highlights• Healthy and growing operating fundamentals, an
abundance of equity capital and an ever improving debt market will support a buoyant market for hotel trades in 2013.
• Transactions volume for the year is expected to reach $18.5 billion, continuing a moderate increase on 2012 levels.
• Our transaction volume forecast is based on the expected performance of key deal drivers in 2013. Among the factors which have shown high correlations to deal flow are availability and cost of capital, industry supply and demand fundamentals, REITs’ stock prices, the size and number of assets being brought to market and the overall hotel ownership composition, all of which—notwithstanding some risk—are moving in favor of an attractive environment for buying and selling.
• Private equity funds unleashed some $7 billion of capital in 2012 for hotel investments making them the largest net buyers. We expect this trend to continue in 2013. Together with REITs, we expect private equity buyers to comprise as much as 70% of total acquisition volume across the Americas.

10 Hotel Investment Outlook | January 2013
Positive momentum bucks volatility hangover
Hotel real estate investors unlocked capital and aggressively bid on hotel assets throughout 2012, with hotel investment volume holding steady at $17.5 billion in the Americas. Transactions pace cruised at a stable momentum throughout the year, driven by private equity funds and real estate investment trusts (REITs). Debt returned to the market in a meaningful way, and is showing indications that it will continue its strong recovery.
In addition to the sale of hotel assets, performing and non-performing hotel debt also traded at substantial levels which, if fully quantifiable, would show even greater total lodging transaction volume for the year.
Macro-economic pressures persist, and the Eurozone crisis and debt ceiling debate in the U.S. have kept a lid on higher economic growth, but as the future comes more into focus, economic growth will be poised to accelerate. This will further underpin fundamentals in the hotel real estate market.
Healthy and growing operating fundamentals, an abundance of equity capital and an ever improving debt market will support a buoyant market for hotel trades in 2013. Transactions volume for the year is expected to reach $18.5 billion, continuing a moderate increase on 2012 levels. This figure refers to asset sales and does not include note and loan sales, deed-in-lieu transfers, and the like.
Our transaction volume forecast is based on the expected performance of key deal drivers in 2013. Among the factors which have shown high correlations to deal flow are availability and cost of capital, industry supply and demand fundamentals, REITs’ stock prices, the size and number of assets being brought to market and the overall hotel ownership composition, all of which—notwithstanding some risk—are moving in favor of an attractive environment for buying and selling. The U.S. will retain its position as the most liquid hotel investment market in the world.
Fundamentals continue with vigour in 2013
We expect hotel operating fundamentals to maintain healthy growth in the U.S. in 2013, with revenue per available room (RevPAR) gains ranging from 6% to 7%. In the absence of any major demand shocks, corporate and group business is expected to continue to improve, and leisure travel will continue to rise in 2013.
Among the markets which will lead the growth are San Francisco, Los Angeles, Houston, Chicago, New York and Hawaii. Washington, D.C., where growth stagnated in 2012, should see a lift in 2013 due to the presidential inauguration and more travel to the city as public and private sector groups strengthen ties with the administration.
Also underpinning the market’s performance is the fact that supply increases will (again) be below the long-term average in 2013. Over the past 20 years, periods of below-average supply growth have coincided with above-average RevPAR growth and we expect this to feature as a trend in 2013 as well. Demand growth is expected to outstrip supply increases which will give a lift to occupancy rates and spur pricing power.
Americas hotel development pipeline through 2014F
Source: Smith Travel Research, Jones Lang LaSalle
2011 base stock 2012 additions 2013 additions 2014 additions
0
10,000
20,000
30,000
40,000
50,000
60,000
70,000
80,000
90,000
Chica
go
Los A
ngele
s
Miam
i
New
York
San F
ranc
isco
Was
hingto
n D.C
.
Toro
nto
Vanc
ouve
r
Mexic
o City
Rio d
e Jan
eiro
Sao P
aulo
Numb
er of
room
s (ur
ban a
rea)
Americas hotel transaction volume 1998 - 2013F
Source: Jones Lang LaSalle
Single asset transactions Portfolio transactions
0
10
20
30
40
50
60
1998
1999
2000
2001
2002
2003
2004
2005
2006
2007
2008
2009
2010
2011
2012
E
2013
F
Volum
e ($B
illion
s)

January 2013 | Hotel Investment Outlook 11
Private equity buyers lead the pack
Private equity funds unleashed some $7 billion of capital in 2012 for hotel investments making them the largest net buyers. We expect this trend to continue in 2013. Together with REITs, we expect private equity buyers to comprise as much as 70% of total acquisition volume across the Americas.
Private equity players will become increasingly active in both primary and secondary U.S. markets, benefiting from increasing debt levels. We estimate that private equity funds have a buying capacity—with leverage—of up to $45 billion for hotels over the next several years. Private equity investors will both target single assets and several needle-moving large select service portfolios (up to 100+ hotels), as well as merger and acquisitions plays.
REITs, on the other hand, have a penchant for branded institutional quality assets with in-place cash flow in the country’s 15 largest urban centres. REITs will largely target single-asset acquisitions or small portfolios with up to four to five hotels.
The exact force of REITs will depend on their share prices and ability to raise capital. While REITs have been on an acquisitions run again since mid-2012 as their stock valuations increased, they do face risk in 2013, and had generally lowered guidance during late 2012.
Debt swells to a six-year high
Another driving force which will shape the hotel investment market in 2013 is the strong re-emergence of hotel financing. Driven primarily by commercial mortgage-backed securities (CMBS) but including a diverse group of lenders such as domestic and off-shore commercial banks, insurance companies, debt funds and mortgage REITs, we expect debt liquidity to be at the highest level since 2007.
Balance sheet lenders are more selective with regard to asset quality, market and sponsorship, but are frequently able to provide the floating rate loan structures typically favoured by hotel owners. The formidable return of the CMBS market in 2012 had the twofold effect of dramatically improving pricing and terms for borrowers, while also drawing other lenders into the hospitality space.
While debt liquidity is nowhere near the previous peak and lenders continue to be selective, early indications are that hotels will remain a targeted asset class for lenders as they offer high yield relative to other real estate and fixed income classes in terms of risk profile.
Two types of sellers
In 2013, sellers will be motivated by different factors. At the one end of the spectrum, owners of high-quality, performing assets in gateway markets will face significant buyer interest from private equity funds, REITs, and in the case of gateway markets, off-shore investors.
This competitive bidding, driven in part by the scarcity of this type of product on the market, will push up capital values and drive down yields, resulting in favourable opportunities for sellers. Quality assets with in-place cash flow will be best positioned to transact in 2013 and we expect the average asset price of single assets to tick up during the course of the year.
Americas 2012 buyer seller net shift analysis
^Net shift = the difference between the respective group’s market share as a buyer and its market share as a seller. A positive net shift indicates group was net buyer; a negative net shift indicates net seller during 2012 Source: Jones Lang LaSalle
-30% -20% -10% 0% 10% 20% 30%
Receiver
REITs (public and private)
Investment fund/Private equity
Institutional investor
Hotel operator
HNWI
Developer/Property company
Corporates
Net shift^
Americas average single-asset deal size 1998 - 2013F
Source: Jones Lang LaSalle
0
10
20
30
40
50
60
1998
1999
2000
2001
2002
2003
2004
2005
2006
2007
2008
2009
2010
2011
2012
E
2013
F
US$ (
Millio
ns)

12 Hotel Investment Outlook | January 2013
On the other end of the spectrum are the sellers who continue to be pressured to sell due to debt service repayment issues or looming loan maturities. Owners may also be moved to sell in cases where they are unwilling or unable to invest capital for needed property improvements. In addition, lenders are taking a more aggressive stance with troubled loans, showing a greater willingness to foreclose as well as sell notes and real estate owned properties.
Pricing of assets in secondary and tertiary markets that are subject to brand and management encumbrances will be under pressure in 2013 and these assets will face a smaller audience of buyers. Resort assets could become an interesting play in 2013 as group meeting business continues to improve and leisure travel remains strong. Further, resort development will continue to be sparse, providing significant runway for demand increases to result in improved operating performance.
Pricing for these types of assets will be well below the levels which the higher quality prime assets will garner. Nonetheless, they often present solid opportunities and strong current returns that will appeal to a segment of the market that is chasing current yield.
2013: The great deleveraging?
The U.S. market continues to face a significant amount of CMBS loan maturities over the next several years. The unpaid balance of hotel CMBS loans with initial maturity dates through 2013 totals $19 billion, according to Morningstar, LLC. While asset values and the debt markets have rebounded sufficiently to bail out some troubled borrowers, many owners are still seeking ways to delay near-term maturities in hopes of further recovery.
However, lenders, and in particular subordinate lenders, have shown increased willingness to foreclose on loans in default, or to sell their positions to others poised to exercise rights and remedies. This has resulted in fewer extensions and more situations where borrowers are trying to delay foreclosure actions by negotiating in the courts or promising to repay the loans if given a bit of breathing room.
Consequently, particularly for hotel assets, 2013 could very well mark the beginning of the long-awaited “great deleveraging”—a period with significant call to action in terms of hotel loans. Following years of extensions, flexibility and workouts, the debt will eventually have to get dealt with, and it will be through sales and recapitalizations, which will represent an unprecedented reshuffling of loans and capital in the market.
Off-shore demand
Middle Eastern and Asian investors will continue to actively pursue opportunities in the country’s gateway markets. The U.S. saw $800 million in inbound capital from these two investment groups, and we expect the incoming volume to increase to approximately $1 billion in 2013.
The most active Middle Eastern investors in the U.S. are those from Abu Dhabi, Qatar and Kuwait. From Asia, the key investors are those from China and Southeast Asia, though conglomerates from India have their eye on several U.S. assets as well. Collectively, these investors’ motivation is political, economic and currency diversification, and the fact that hotel assets typically act as a hedge against inflation, as rate growth outpaces inflation. European investors, on the other hand, are expected to be quiet as they sort out economic difficulty at home.
Canada’s hotel transaction activity has not recovered to the same degree as it has in the U.S., though Toronto saw several large transactions in 2012. While Canada benefits from a relatively healthy demand outlook, investors in the market have retained a domestic focus. Sellers of Canadian assets have not attracted bids from U.S. REITs and face a narrower buying audience. The relatively limited stock of hotels available for sale will continue to hamper a large uptick of deal volume in 2013.
Hotel market cycle 2013 – North America
Source: Jones Lang LaSalle
RevPARgrowthslowing
RevPARfalling
RevPARrising
RevPARdeclineslowing
Vancouver
Chicago
Washington, D.C.
Los Angeles
Toronto
New York
San FranciscoMiami

January 2013 | Hotel Investment Outlook 13
Mexico moves to bright spot
With its emerging middle class driving an economic rebound, Mexico’s gross domestic product is expected to grow by 4% annually over the next several years. Overall, the country’s lodging market and tourism infrastructure is the most sophisticated in all of Latin America in terms of the proportion of international-grade hotel stock. The country’s key hotel markets are performing well and visitor levels in Cancun, Los Cabos and Mexico City are exceeding previous peak levels.
The country’s narco-violence marks a stark contrast to its otherwise healthy fundamentals. As a result, the country will struggle to keep optimism in check. The key international tourist destinations have largely been spared negative headlines in the last year, which bodes well for the future.
Mexico’s hotel transactions market had been defined by illiquidity as of late, though deal flow picked up to approximately $400 million in 2012, driven by several single asset transactions. Signs point to an ongoing pick-up in transactional activity in Mexico. The year 2013 should bring several more sales of prime assets, along with forced sales. Prime assets will garner strong investor interest; struggling assets will face a limited buyer audience, unless they are unencumbered by brand and management.
Buyers will be comprised of opportunistic investors and hotel brands making strategic plays in order to enter certain markets. That said, the number of active investors will remain below previous peak levels. Though the transactions environment will see some improvement, the primary growth opportunity for investors lies in the expansion of the country’s network of branded limited service hotels to service the country’s middle class.
Caribbean Islands: more deal flow
The Caribbean will experience an improvement in demand fundamentals in 2013 barring significant economic deterioration in the region’s key source markets. Markets with above-average fundamentals include the Dominican Republic, Jamaica, the Cayman Islands and Aruba. The region’s hotel operations remain susceptible to changes to airlift, hurricanes, and high energy costs. The all-inclusive sector has led the recovery, and we expect the luxury market to show more signs of regaining in 2013.
With the bulk of large resorts in the Caribbean having been financed by high levels of debt and many featuring a struggling residential component, any sales activity will be driven by owners who are forced to sell due to default, etc. Other assets which may transact are stalled development projects.
In 2013, we expect to see several more existing large resorts, particularly in the upscale and luxury sectors, changing ownership/control via debt restructuring. The buyer audience for distressed resorts will be limited to rescue capital. Performing assets, on the other hand, are less likely to trade in 2013 because pricing remains below potential.
Inter-regional capital dominates Central America
Like the Caribbean, Costa Rican resort markets experienced a wave of development during the past seven years with many properties encompassing residential units. Given its stable political environment, healthy economic fundamentals and the newly expanded Liberia airport, Costa Rica will again be on the radar of investors and we expect several projects to be revitalized in the medium term.
However, this rests on equity injections, a re-tooling of joint ventures and confirmation that Costa Rica’s source markets remain on a solid path to economic recovery. Within Central America, Costa Rica is the only market which is likely to attract U.S. investor interest.
Panama, on the other hand, is in the domain of intra-regional investors, such as capital sources from Colombia and Venezuela. Demand sources for Panama differ as well; hotel development has largely been concentrated in Panama City and as such caters to urban, and not resort demand. Investor interest will remain tempered in 2013, though the Panama Canal, which is undergoing expansion, represents future upside.
Policy interest rates for major Americas economies
Source: IHS Global Insight
0%
5%
10%
15%
2008 2009 2010 2011 2012E 2013F 2014F
Polic
y inte
rest
rate
Canada United States Mexico Brazil
14 Hotel Investment Outlook | January 2013
South America’s dramatic transformation
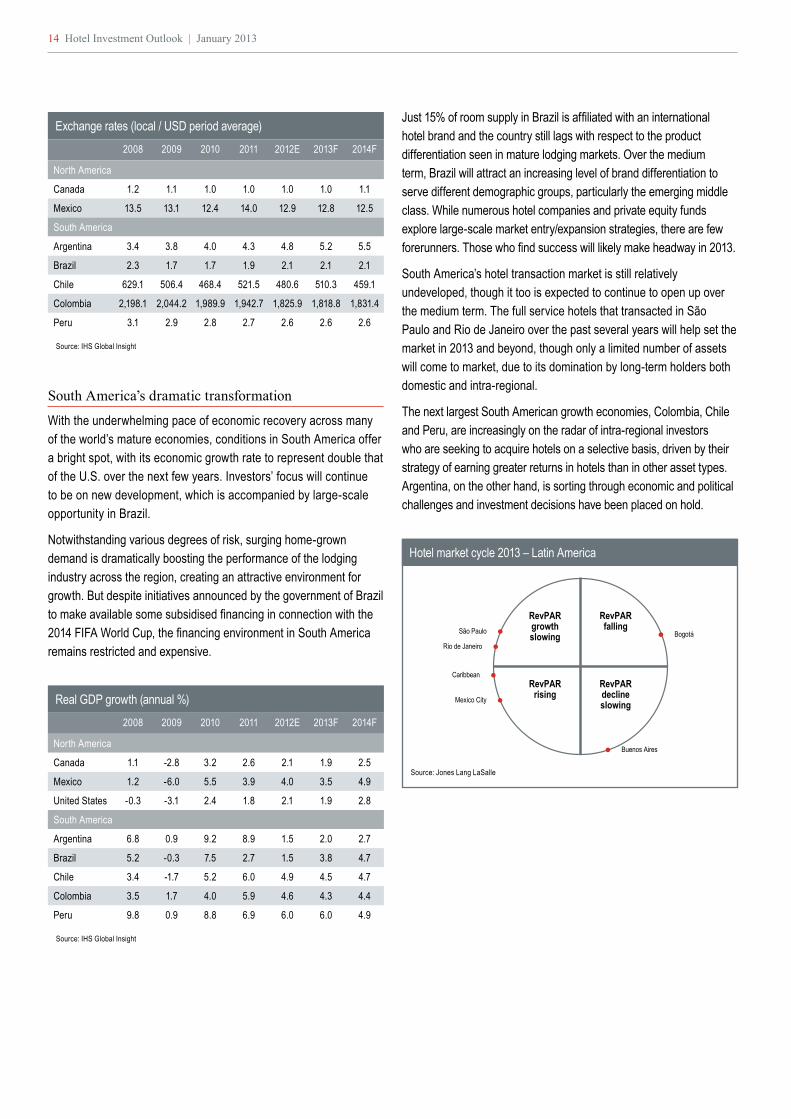
With the underwhelming pace of economic recovery across many of the world’s mature economies, conditions in South America offer a bright spot, with its economic growth rate to represent double that of the U.S. over the next few years. Investors’ focus will continue to be on new development, which is accompanied by large-scale opportunity in Brazil.
Notwithstanding various degrees of risk, surging home-grown demand is dramatically boosting the performance of the lodging industry across the region, creating an attractive environment for growth. But despite initiatives announced by the government of Brazil to make available some subsidised financing in connection with the 2014 FIFA World Cup, the financing environment in South America remains restricted and expensive.
Just 15% of room supply in Brazil is affiliated with an international hotel brand and the country still lags with respect to the product differentiation seen in mature lodging markets. Over the medium term, Brazil will attract an increasing level of brand differentiation to serve different demographic groups, particularly the emerging middle class. While numerous hotel companies and private equity funds explore large-scale market entry/expansion strategies, there are few forerunners. Those who find success will likely make headway in 2013.
South America’s hotel transaction market is still relatively undeveloped, though it too is expected to continue to open up over the medium term. The full service hotels that transacted in São Paulo and Rio de Janeiro over the past several years will help set the market in 2013 and beyond, though only a limited number of assets will come to market, due to its domination by long-term holders both domestic and intra-regional.
The next largest South American growth economies, Colombia, Chile and Peru, are increasingly on the radar of intra-regional investors who are seeking to acquire hotels on a selective basis, driven by their strategy of earning greater returns in hotels than in other asset types. Argentina, on the other hand, is sorting through economic and political challenges and investment decisions have been placed on hold.
Hotel market cycle 2013 – Latin America
Source: Jones Lang LaSalle
RevPARgrowthslowing
RevPARfalling
RevPARrising
RevPARdeclineslowing
Buenos Aires
Caribbean
São Paulo
Rio de Janeiro
Mexico City
Bogotá
Real GDP growth (annual %)
Source: IHS Global Insight
2008 2009 2010 2011 2012E 2013F 2014F
North America
Canada 1.1 -2.8 3.2 2.6 2.1 1.9 2.5
Mexico 1.2 -6.0 5.5 3.9 4.0 3.5 4.9
United States -0.3 -3.1 2.4 1.8 2.1 1.9 2.8
South America
Argentina 6.8 0.9 9.2 8.9 1.5 2.0 2.7
Brazil 5.2 -0.3 7.5 2.7 1.5 3.8 4.7
Chile 3.4 -1.7 5.2 6.0 4.9 4.5 4.7
Colombia 3.5 1.7 4.0 5.9 4.6 4.3 4.4
Peru 9.8 0.9 8.8 6.9 6.0 6.0 4.9
Exchange rates (local / USD period average)
Source: IHS Global Insight
2008 2009 2010 2011 2012E 2013F 2014F
North America
Canada 1.2 1.1 1.0 1.0 1.0 1.0 1.1
Mexico 13.5 13.1 12.4 14.0 12.9 12.8 12.5
South America
Argentina 3.4 3.8 4.0 4.3 4.8 5.2 5.5
Brazil 2.3 1.7 1.7 1.9 2.1 2.1 2.1
Chile 629.1 506.4 468.4 521.5 480.6 510.3 459.1
Colombia 2,198.1 2,044.2 1,989.9 1,942.7 1,825.9 1,818.8 1,831.4
Peru 3.1 2.9 2.8 2.7 2.6 2.6 2.6

January 2013 | Hotel Investment Outlook 15
Colombia is witnessing a considerable amount of development by local investors, with little direct activity from the U.S. The country’s stable economy, large population, greatly improved business environment and government tax incentives have led to a considerable amount of new supply. Investors have grown more cautious about a potential temporary oversupply, but the longer-term outlook looks bright as demand continues to grow.
Chile has long enjoyed macroeconomic stability, an open business environment and consequently, relatively sophisticated capital markets.
Peru has also followed pro-growth policies that have resulted in the country posting the highest sustained economic growth rates in all of South America. This, together with Peru’s rich cultural heritage has increased its commercial and tourism appeal; thus hotel demand should continue its upswing in 2013. Lima has seen a lesser degree of institutional-grade hotel development. The market still lacks the depth of international hotel brands seen in other South American capitals and the market will be receptive to new development.

EMEA

January 2013 | Hotel Investment Outlook 17
Highlights• Despite the economic challenges in Europe, hotel
investment volumes in EMEA in 2013 are anticipated to hold up and are forecasted at roughly $11 billion.
• Although the economic situation in Europe will remain complex, several indicators give cause for optimism and could lead to an improvement in investor confidence in 2013.
• Positive signs include the emergence of new sources of debt in the form of debt funds and alternative lenders such as insurance companies which are entering the hotel arena. The hotel investment market will also benefit from a narrowing pricing gap for secondary assets between buyers and sellers.
• Sellers’ pricing expectations have already become more realistic, especially in provincial U.K. and Ireland where prices have been adjusted and we expect other European markets to follow suit.
• Operating results are also holding up comparatively well and some gateway markets are likely to see a further rise in RevPAR due to the continued growth in global travel and tourism.

18 Hotel Investment Outlook | January 2013
Transaction activity moderated in 2012
In 2012, the hotel investment market in Europe, Middle East and Africa (EMEA) moderated as transaction volumes slowed by 10% year on year to $11 billion. Investor sentiment was negatively affected by the ongoing uncertainty surrounding the sovereign debt crisis, the continuing limited availability of debt and high costs of financing new acquisitions. Closing deals in 2012 was very difficult.
Transaction activity was concentrated on the key gateway markets in Europe that had weathered the economic headwinds surprisingly well. Highly diversified markets such as London, Paris, Amsterdam, and key German cities, posted robust trading fundamentals and witnessed aggressive pricing for quality properties in the prime locations.
Assets in secondary locations evoked limited interest due to lower growth in trading fundamentals and investors’ perception of higher risk. Investors remained uncertain of future trading in these markets, which are more heavily reliant on fragile domestic and corporate markets. Pricing for regional assets was therefore more opportunistic and a number of assets sold significantly below their guide price. Hotels in stable secondary cities in Germany were an exception. These assets, often sold under long term leases or with vacant possession, attracted a lot attention and were predominantly sold to high net worth individuals (HNWIs) and institutional investors.
The majority of transaction activity occurred in Western and Northern Europe with nearly no activity in Central and Eastern Europe (CEE). There was virtually no debt availability for hotel acquisitions in this emerging region and the economic and political outlook in some of the countries remains uncertain. Nonetheless, Poland, one of the most stable economies in Europe, received significant buyer interest especially for good quality product in Warsaw.
Despite the economic challenges in Europe, hotel investment volumes in EMEA in 2013 are anticipated to hold up and are forecasted at roughly $11 billion. Although the economic situation in Europe will remain complex, several indicators give cause for optimism and could lead to an improvement in investor confidence in 2013.
Positive signs include the emergence of new sources of debt in the form of debt funds and alternative lenders such as insurance companies which are entering the hotel arena. The hotel investment market will also benefit from a narrowing pricing gap for secondary assets between buyers and sellers. Sellers’ pricing expectations have already become more realistic, especially in provincial U.K. and Ireland where prices have been adjusted and we expect other European markets to follow suit. Operating results are also holding up comparatively well and some gateway markets are likely to see a further rise in RevPAR due to the continued growth in global travel and tourism.
New debt funds and insurance companies on the scene
In 2013, we anticipate an improvement in the debt markets as new alternative lenders such as insurance companies and pension funds start to fill the funding gap left by the retreat of more traditional lending banks. These investors have struggled to get decent returns from government bonds and are increasing their allocation to higher yielding real estate investments.
Furthermore, a number of debt funds have been raised. StarFin by Starwood Capital, for example, aims to take advantage of financing opportunities by providing investors with debt capital to help refinance existing loans. GE Capital Real Estate Europe has also targeted to build a $5 billion U.K. loan portfolio within the next four to five years.
EMEA average single-asset deal size 1998 - 2013F
Source: Jones Lang LaSalle
0
10
20
30
40
50
60
70
1998
1999
2000
2001
2002
2003
2004
2005
2006
2007
2008
2009
2010
2011
2012
E
2013
F
$US
(Milli
ons)
EMEA hotel transaction volumes 1998 - 2013F
Source: Jones Lang LaSalle
Single asset transactions Portfolio transactions
0
10
5
20
15
25
30
1998
1999
2000
2001
2002
2003
2004
2005
2006
2007
2008
2009
2010
2011
2012
E
2013
F
Volum
e ($B
illion
s)

January 2013 | Hotel Investment Outlook 19
In addition, mezzanine lenders will help plug the financing gap and we have witnessed increasing activity from lenders such as Blackstone, Starwood Capital and Duet, encouraged by higher returns on their debt provisions than senior lenders. Bank lending is also predicted to improve and a few banks have reopened their credit lines in the second half of 2012.
This improving picture is likely to be the first stage in a return to more normalized debt markets, which in time will help refocus transactional activity, although these alternative sources of debt are typically more expensive than traditional banks.
Trading fundamentals to remain stable in 2013
The consensus in the investment community is that trading fundamentals in EMEA will remain stable with further growth in revenue per available room (RevPAR) expected for key gateway cities in Northern and Western Europe and the Middle East.
In Europe, operating results are anticipated to remain robust in key cities such as Munich, Paris, Vienna, and Barcelona. These markets will disproportionally benefit from the continued expansion of inbound tourism from BRIC countries (Brazil, Russia, India and China) and markets in Asia and South America. An exception will be hotels in London where an Olympic ‘hangover’ and a significant increase in supply will likely result in a flattening or contraction in RevPAR in 2013.
Hotels in Southern Europe that are more heavily reliant on domestic or corporate demand and, therefore, more dependent on their local economies, will continue to struggle in the short term. Economies in Southern Europe are forecast to remain in recession and Tourism Economics predicts a decline in international arrivals in this region in 2013. Some of these hotels could, therefore, very well experience a stagnation or a decline in average room rates and occupancy levels when compared to 2012.
Real GDP growth (annual %)
Source: IHS Global Insight
2008 2009 2010 2011 2012E 2013F 2014F
Western Europe
France -0.2 -3.1 1.6 1.7 0.1 0.0 0.5
Germany 0.8 -5.1 4.0 3.1 1.0 0.9 1.1
Italy -1.2 -5.5 1.8 0.6 -2.0 -1.2 -0.4
Netherlands 1.8 -3.7 1.6 1.1 -1.0 -0.4 0.5
Spain 0.9 -3.7 -0.3 0.4 -1.3 -1.5 -0.7
U.K. -1.0 -4.0 1.8 0.9 -0.1 1.1 1.5
Central & Eastern Europe
Czech Republic
2.9 -4.4 2.3 1.9 -1.0 0.3 1.8
Hungary 0.7 -6.7 1.3 1.6 -1.5 -0.6 1.4
Poland 5.1 1.6 3.9 4.3 1.8 1.0 2.8
Romania 7.3 -7.1 -1.3 2.5 0.5 1.2 2.7
Russia 5.2 -7.8 4.3 4.3 3.6 3.4 4.0
Turkey 0.7 -4.8 9.2 8.5 2.5 4.0 3.9
MENA
Morocco 5.6 4.8 3.6 5.0 2.5 3.9 4.6
Oman 13.1 3.9 5.0 5.0 4.4 4.0 4.3
Qatar 25.4 8.6 16.7 14.8 4.5 4.3 4.7
UAE 3.2 -4.8 1.3 4.2 4.2 2.0 2.7
Exchange rates (local / USD period average)
Source: IHS Global Insight
2008 2009 2010 2011 2012E 2013F 2014F
Western Europe
Eurozone 0.7 0.7 0.8 0.7 0.8 0.8 0.8
Sweden 6.6 7.7 7.2 6.5 6.8 6.6 7.1
Switzerland 1.1 1.1 1.0 0.9 0.9 0.9 1.0
U.K. 0.5 0.6 0.6 0.6 0.6 0.6 0.6
Central & Eastern Europe
Czech Republic
17.1 19.1 19.1 17.7 19.6 19.2 20.2
Hungary 172.1 202.3 207.9 201.1 224.9 230.5 256.7
Poland 2.4 3.1 3.0 3.0 3.3 3.2 3.3
Romania 2.5 3.0 3.2 3.0 3.5 3.3 3.3
Russia 24.9 31.7 30.4 29.4 31.1 31.0 29.9
Turkey 1.3 1.6 1.5 1.7 1.8 1.8 1.9
MENA
Morocco 7.8 8.1 8.4 8.1 8.6 8.8 9.2
Oman 0.4 0.4 0.4 0.4 0.4 0.4 0.4
Qatar 3.6 3.6 3.6 3.6 3.6 3.6 3.6
Saudi Arabia 3.8 3.8 3.8 3.8 3.8 3.8 3.8
Hotel market cycle 2013 - Europe
Source: Jones Lang LaSalle
RevPARgrowthslowing
RevPARfalling
RevPARrising
RevPARdeclineslowing
Budapest
Prague
Dublin
MoscowSt. Petersburg
Copenhagen, Warsaw, KrakowVienna
Munich, ParisDusseldorf
Istanbul
Berlin, Hamburg,Amsterdam, Regional U.K., London
Barcelona,Frankfurt
Madrid
Rome
Milan
Heathrow
Cologne
Brussels, Geneva, Zurich, Gatwick
Lisbon

20 Hotel Investment Outlook | January 2013
Hotel demand had recovered impressively in the Middle East since the Arab Spring, led by hotels in Dubai which recorded high occupancy levels, with RevPAR moving towards its peak of 2008.
For 2013, we expect a further improvement in trading performance in the UAE on the back of continued growth in international arrivals. Dubai, the ‘safe haven’ of the region, is expected to achieve a further growth in RevPAR whereas hotels in Abu Dhabi will continue to recover from an oversupply situation.
Saudi Arabia will also achieve improved performance linked to new infrastructure projects driven by public spending policy. We anticipate performance to remain constrained in Bahrain due to the ongoing local tensions.
Trading performance in North Africa will further stabilise in 2013 as tourists return to countries such as Egypt, Morocco and Tunisia. Occupancy in Cairo will further recover, although room rates are likely to remain at low levels due to very competitive market conditions. Dynamic growth in trading performance is also anticipated for sub-Saharan Africa, especially for growing tourist destinations such as Tanzania and Kenya.
Asian and Middle Eastern investors to drive cross-border deals
In 2012, Middle Eastern investors were one of the most active buyers of hotel real estate, acquiring assets with a total value of $1.7 billion or about 15% of total investment volumes in EMEA. In 2013, we expect Middle Eastern investors predominantly from the United Arab Emirates (UAE) and Qatar to remain one of the most active buyers of European hotel real estate. These cash rich investors, primarily HNWIs and sovereign wealth funds, will remain keen to diversify into upscale assets in core markets and are likely to place in excess of $100 million in equity in each of a number of major deals. These investments often reflect non-economic factors such as pride or prestige of ownership and are more focused on long term capital preservation than short term cash flow.
Asian investors, although coming from a lower base, have also been active, and we expect hotel operators and developers, particularly from Singapore and Malaysia, to continue purchasing upscale hotels in key European markets. We also anticipate Chinese investors to increase their cross-border investments into Europe as they switch their attention from domestic investments to strategic assets in advanced economies.
U.K. to remain the most liquid market
The U.K. is anticipated to remain the most liquid market in EMEA, driven by buoyant investment activity in London, which remains a target for risk-averse overseas investors wishing to avoid Euro exposure.
The London hotel market has proven to be resilient with average occupancy levels predicted to stay close to 80%. Demand for upscale properties will remain strong and keep prices at record levels with yields for these type of assets within a range of 2% and 5%.
In regional U.K., investment activity will be driven by a combination of a large amount of product being offered for sale and a narrowing price expectation gap between buyers and sellers. Many of these properties will come from distressed situations, and for the right buyer, will deliver a healthy yield.
France is likely to achieve second place in terms of investment volume in 2013. Single asset transactions will be driven by Paris, which similar to London, attracts a large number of overseas investors. A combination of limited supply for sale and high demand will result in aggressive pricing.
In regional France, we anticipate some activity, mainly in the budget segment, as hotel operators continue to pursue an asset light strategy. These assets, likely to be trading as part of a portfolio, will come on the radar of institutional investors seeking more stable returns and also will attract the attention of some private equity investors looking to own and operate properties in secondary markets under franchise agreements.
Hotel market cycle 2013 - MENA
Source: Jones Lang LaSalle
RevPARgrowthslowing
RevPARfalling
RevPARrising
RevPARdeclineslowing
Muscat
Cape Town
Dubai
Johannesburg
Jeddah, Amman
Kuwait
Cairo, Manama
Beirut
Riyadh
Doha
Abu Dhabi
January 2013 | Hotel Investment Outlook 21
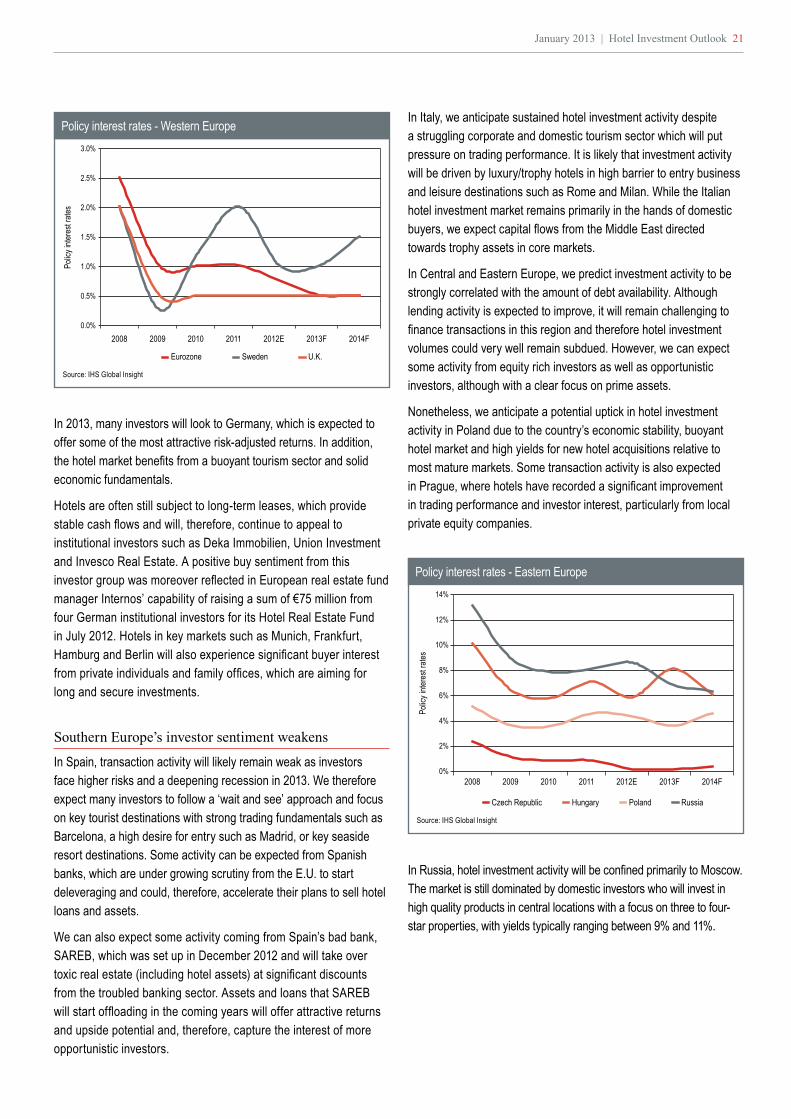
In 2013, many investors will look to Germany, which is expected to offer some of the most attractive risk-adjusted returns. In addition, the hotel market benefits from a buoyant tourism sector and solid economic fundamentals.
Hotels are often still subject to long-term leases, which provide stable cash flows and will, therefore, continue to appeal to institutional investors such as Deka Immobilien, Union Investment and Invesco Real Estate. A positive buy sentiment from this investor group was moreover reflected in European real estate fund manager Internos’ capability of raising a sum of €75 million from four German institutional investors for its Hotel Real Estate Fund in July 2012. Hotels in key markets such as Munich, Frankfurt, Hamburg and Berlin will also experience significant buyer interest from private individuals and family offices, which are aiming for long and secure investments.
Southern Europe’s investor sentiment weakens
In Spain, transaction activity will likely remain weak as investors face higher risks and a deepening recession in 2013. We therefore expect many investors to follow a ‘wait and see’ approach and focus on key tourist destinations with strong trading fundamentals such as Barcelona, a high desire for entry such as Madrid, or key seaside resort destinations. Some activity can be expected from Spanish banks, which are under growing scrutiny from the E.U. to start deleveraging and could, therefore, accelerate their plans to sell hotel loans and assets.
We can also expect some activity coming from Spain’s bad bank, SAREB, which was set up in December 2012 and will take over toxic real estate (including hotel assets) at significant discounts from the troubled banking sector. Assets and loans that SAREB will start offloading in the coming years will offer attractive returns and upside potential and, therefore, capture the interest of more opportunistic investors.
In Italy, we anticipate sustained hotel investment activity despite a struggling corporate and domestic tourism sector which will put pressure on trading performance. It is likely that investment activity will be driven by luxury/trophy hotels in high barrier to entry business and leisure destinations such as Rome and Milan. While the Italian hotel investment market remains primarily in the hands of domestic buyers, we expect capital flows from the Middle East directed towards trophy assets in core markets.
In Central and Eastern Europe, we predict investment activity to be strongly correlated with the amount of debt availability. Although lending activity is expected to improve, it will remain challenging to finance transactions in this region and therefore hotel investment volumes could very well remain subdued. However, we can expect some activity from equity rich investors as well as opportunistic investors, although with a clear focus on prime assets.
Nonetheless, we anticipate a potential uptick in hotel investment activity in Poland due to the country’s economic stability, buoyant hotel market and high yields for new hotel acquisitions relative to most mature markets. Some transaction activity is also expected in Prague, where hotels have recorded a significant improvement in trading performance and investor interest, particularly from local private equity companies.
In Russia, hotel investment activity will be confined primarily to Moscow. The market is still dominated by domestic investors who will invest in high quality products in central locations with a focus on three to four-star properties, with yields typically ranging between 9% and 11%.
Policy interest rates - Western Europe
Source: IHS Global Insight
Eurozone Sweden U.K.
0.0%
0.5%
1.0%
1.5%
2.0%
2.5%
3.0%
2008 2009 2010 2011 2012E 2013F 2014F
Polic
y inte
rest
rates
Policy interest rates - Eastern Europe
Source: IHS Global Insight
Czech Republic Hungary Poland Russia
0%
2%
4%
6%
8%
10%
12%
14%
2008 2009 2010 2011 2012E 2013F 2014F
Polic
y inte
rest
rates

22 Hotel Investment Outlook | January 2013
Tempered deal activity in the Middle East and Africa
Similar to previous years, we expect no significant investment activity in the Middle East and Africa as investors prefer to build rather than acquire existing hotels. The investment market in the Middle East will remain very opaque with most buyers being local development companies or HNWIs. Dubai will be an exception with evidence of some investor interest outside the Gulf Cooperation Council (GCC) countries.
In Africa, some activity is expected in Morocco, the most mature hotel market in North Africa. Domestic investors, primarily local funds and HNWIs, could acquire hotels in key cities such as Casablanca or Marrakesh, although will likely avoid more volatile seaside resort destinations.
Sub Saharan Africa: development hot spot
Hotel development activity in Europe will remain restrained in 2013 in light of continued funding difficulties for new projects. Exceptions are in strong markets such as London that still have a significant amount of hotels in the development pipeline although a large number of these projects are conversions or part of mixed use development schemes. New and popular lifestyle/boutique brands such as Motel One, Citizen M, Indigo and Aloft are also increasing their presence in core markets.
EMEA hotel development pipeline through 2014F
2011 base stock 2012 additions 2013 additions 2014 additions
0
20,000
40,000
60,000
80,000
100,000
120,000
140,000
Numb
er of
room
s
Source: Jones Lang LaSalle
EMEA 2012 buyer seller net shift analysis
^Net shift = the difference between the respective group’s market share as a buyer and its market share as a seller. A positive net shift indicates group was net buyer; a negative net shift indicates net seller during 2012 Source: Jones Lang LaSalle
-15% -10% -5% 0% 5% 10% 15%
Sovereign wealth fund
Receiver
REIT
Investment fund/Private equity
Institutional investor
Hotel operator
HNWI
Developer/Property company
Corporates
Net shift^

January 2013 | Hotel Investment Outlook 23
In the Middle East, development activity will pace ahead with financing often provided by public funds. The region is expected to open 150 new hotels in 2013 with the majority opening in Saudi Arabia and the United Arab Emirates. Nonetheless, development activity has started to slow down in Dubai as the market is nearing maturity.
One of the development hot spots is expected to be Sub Saharan Africa, which has politically stabilized in some regions and started to restore investor confidence. Many of these emerging economies, such as Ghana and Nigeria, are seeing strong economic growth due to an abundance of natural resources and the benefit from growing levels of direct foreign investments from the U.S., Europe and China.
We believe that these countries will offer much growth potential especially in terms of business tourism and, therefore, will attract a growing amount of international hotel operators that would like to expand into these emerging markets. Development activity will be supported by improved accessibility to financing due to the recent creation of African hotel funds with capital provided by African and international investors. However, risks remain very high and strong relationships with local development companies and governmental institutions are critical when entering these markets.

Asia Pacific

January 2013 | Hotel Investment Outlook 25
Highlights• Asia Pacific transaction volumes are projected to record
a slight uptick in 2013 to reach $3.5 billion with the lion’s share of deals in Australia and Japan. The gap between buyer and seller pricing expectations which emerged in 2012 will continue to feature in 2013.
• Inter-regional capital will remain active in Asia Pacific’s hotel investment market in 2013. The successful listing of two new hotel REITs in 2012 and more planned for 2013 is likely to result in higher volumes by these groups, for whom diversification is crucial. REITs have been willing to consider assets in secondary locations to ensure overall viability.
• Australia remains a target for cross-border capital with interest from Asian groups in prime hotels still exceptionally strong and selective interest from new capital sources such as the Middle East and China.
• As operating companies digest an oversupply of luxury rooms in major cities in China, the mid-market will be an exciting space to watch over the next five years.
• Investment benchmarks are being established in India. The dynamics in 2013 will favour both buyers and developers with a slowdown in development activity and more opportunities to acquire.
• Transaction volumes in Japan are expected to improve with trading performance returning to pre-quake levels. The market offers significant leverage opportunities with interest rates at near zero and lenders more willing to originate non-recourse loans.
• Thailand has emerged as one of the region’s hotel investment hot spots with more deals expected in Phuket and Bangkok in 2013. The introduction of a new REIT law is also expected to increase liquidity in the hotel and property investment market.

26 Hotel Investment Outlook | January 2013
Volumes fall short
Hotel trade activity slowed in 2012, reducing 30% to $3.3 billion, as investor valour gave way to opportunistic play. Australia dominated deal flow, whereas bank inaction in Japan and a noticeable absence of sales in Asia’s key gateways were the major contributors to lower than anticipated transaction volumes against a backdrop of investor conservatism.
For 2013, Asia Pacific hotel transaction volumes are projected to reach $3.5 billion, slightly above the 2012 volume but below the short-run average of $4.1 billion. Australia and Japan will see the lion’s share of investment dollars, but with pockets of activity across the rest of the region. Availability of stock in the key gateways and the willingness of sellers to close deals through transparent processes in emerging markets will dictate the overall investment landscape in 2013.
The gap between buyer and seller pricing expectations, which emerged in 2012 after the strong appreciation of assets over the past four years, will also remain a feature in 2013. While the long-term fundamentals for Asia Pacific hotel markets remain strong – wealthier travelling middle class, improved connectivity, rapid urbanisation, rising education, high savings rate and lower taxes – there has been a subtle softening in trading performance across the region, tempering investor enthusiasm.
With such low levels of established product available for sale, investors continue to consider development in order to achieve sufficient scale across the region. Asia remains the global hotel development hot spot with supply increases projected to average 5.5% per annum across 23 major markets over the next two years although commencements have slowed in India, South East Asia and China as cities suffer indigestion following significant new hotel openings in recent years.
Development in the region’s two most liquid hotel investment markets – Australia and Japan – continues to be held back by the cost versus value equation. Therefore, low levels of new supply will continue to be an attractive driver for global investment capital.
Borders blur as capital moves across the map
Intra-regional capital will remain active in Asia Pacific’s hotel investment market in 2013, accounting for an estimated 70% of the total transaction volume and underpinned by some large-scale deals in Australia and Japan. In order to be successful in the world’s growth engine, investors need to be prepared to do deals where assets are offered. In 2012, this resulted in higher transaction volumes in the Indian Ocean and Thailand, but in 2013 we also expect investment in Indochina, Indonesia and India to come to the fore.
Investment will continue to be opportunistic rather than strategic, with investors targeting markets which represent value or where there is a positive growth story. Investors are looking at the expansion of Low Cost Carrier (LCCs) networks and where tourism infrastructure is being developed. These markets are the focus for their flags and for capital growth.
However, with only 70 transactions occurring on average each year over the past decade, visibility of investment metrics is generally low and the extent of liquidity a concern, particularly for institutional and global capital. The exceptions are Australia and Japan. Domestic and regional capital is likely to dominate where real estate transparency remains opaque.
Asia Pacific hotel development pipeline through 2014F
*Branded hotel stock only Source: Jones Lang LaSalle
2011 base stock 2012 additions 2013 additions 2014 additions
0
20,000
40,000
60,000
80,000
100,000
120,000
Sydn
ey
Melbo
urne
Auck
land
Beijin
g*
Shan
ghai*
Hong
Kon
g
Mumb
ai*
New
Delhi
*
Jaka
rta Bali
Toky
o
Osak
a
Sing
apor
e
Bang
kok
Phuk
et
Ho C
hi Mi
nh C
ity
Numb
er of
room
s
Asia Pacific hotel transaction volume 1998 to 2013F
Source: Jones Lang LaSalle
Single asset transactions Portfolio transactions
0
3
6
9
12
1998
1999
2000
2001
2002
2003
2004
2005
2006
2007
2008
2009
2010
2011
2012
E
2013
F
Volum
e ($B
illion
s)

January 2013 | Hotel Investment Outlook 27
Two new hotel REITs and more to come
With the listing of two new hotel REITs in Singapore in 2012 and more in the making, cross-border investment and expanding liquidity will characterise the region over the coming years.
Diversification is a key component for REITs, limiting exposure to any one segment or geography. While such structures can be prohibitive for the acquisition of larger hotel real estate, REITs have been willing to consider assets in secondary locations in Japan and Australia to ensure overall viability, while also being yield accretive, and given the limited number of investment opportunities available in Asia.
Notwithstanding, REITs are generally more risk averse as they are marked to market daily and therefore subject to changes in sentiment in accordance with the external environment. While the global economy remains under pressure, movements in the political arena, which impacted in 2012, have now been resolved with the Chinese and U.S. presidential elections both held in November 2012.
REITs now exist in many countries across the region and are permitted to invest offshore in Australia, Hong Kong, Malaysia, Singapore and South Korea, and to a lesser degree in Taiwan and the Philippines. The imminent passing of REIT legislation in Thailand will also allow offshore investment. Therefore, regional REITs are likely to remain net buyers of Asia Pacific hotel real estate over the next few years.
We do not expect to see a major shift in the buyer profile in 2013. Investment will continue to be dominated by the aforementioned REITs, as well as Asian family companies, owner operators and possibly the re-emergence of opportunity funds in Japan.
Asia Pacific cross-border capital 1998 to 2013F
Source: Jones Lang LaSalle
Asia Australasia Proportion of Asia Pacific total volume
0
3
6
9
12
2000
2001
2002
2003
2004
2005
2006
2007
2008
2009
2010
2011
2012
E
2013
F
Volum
e ($B
illion
s)
0%
10%
20%
30%
40%
50%
60%
70%
80%
Total
prop
ortio
n of c
ross
-bor
der in
vestm
ent
Asia Pacific 2012 buyer and seller net shift analysis
^Net shift = the difference between the respective group’s market share as a buyer and its market share as a seller. A positive net shift indicates group was net buyer; a negative net shift indicates net seller during 2012 Source: Jones Lang LaSalle
-50% -40% -30% -20% -10% 0% 10% 20% 30%
Other
Sovereign Wealth Fund
Receiver
REIT
Investment fund/Private equity
Institutional investor
Hotel operator
HNWI
Developer/Property company
Corporates
Net shift^
Real GDP growth (annual %)
Source: IHS Global Insight
2008 2009 2010 2011 2012E 2013F 2014F
North Asia and India
China PRC 9.6% 9.2% 10.5% 9.3% 7.6% 7.8% 8.3%
Hong Kong 2.1% -2.5% 6.8% 4.9% 1.8% 3.7% 4.6%
India 4.9% 7.1% 9.6% 6.9% 5.1% 5.8% 6.9%
Japan -1.1% -5.5% 4.6% -0.7% 1.7% 0.3% 2.0%
South Korea 2.3% 0.3% 6.3% 3.6% 2.1% 2.0% 3.6%
Taiwan 0.7% -1.8% 10.7% 4.0% 1.2% 3.3% 4.4%
South East Asia
Indonesia 6.0% 4.6% 6.2% 6.5% 6.2% 6.1% 6.1%
Malaysia 4.8% -1.5% 7.2% 5.1% 4.8% 4.3% 4.8%
Philippines 4.2% 1.1% 7.6% 3.7% 4.9% 4.7% 4.9%
Singapore 1.7% -1.0% 14.8% 4.9% 2.0% 2.9% 4.0%
Thailand 2.5% -2.3% 7.8% 0.1% 5.4% 3.6% 4.5%
Vietnam 6.2% 5.3% 6.9% 5.9% 5.1% 5.3% 5.9%
Pacific
Australia 2.5% 1.4% 2.5% 2.1% 3.4% 2.3% 2.9%
New Zealand -0.6% -0.2% 0.9% 0.5% 1.8% 2.7% 2.8%
Fiji 1.0% -1.3% -0.2% 2.0% 1.2% 1.7% 1.9%

28 Hotel Investment Outlook | January 2013
Pockets of bank-driven sales
As in 2012, sellers in 2013 will primarily include investment funds, institutions, and corporate companies who are restructuring their portfolios to free up equity to make strategic investments elsewhere. Asia Pacific hotel real estate is predominantly owned by large Asian family companies, many of whom are inter-generational investors with assets held over the very long term (30-50 years). These investors are well-capitalised.
Japan, and to a lesser extent Thailand and India, are the markets where bank action is likely to be a factor. In Japan the extent of CMBS, to be refinanced in the next 12-18 months, will likely result in more asset disposals. Corporates are also selling non-core assets as debt terms on major assets come up for renewal. Having been extended in 2011, the loan moratorium act will expire in 2013. Under this act, Japanese financial service agencies protected small and mid-sized companies who were struggling to refinance corporate loans. The challenge for owners will be refinancing at the 2006-07 values which are on their books.
In Thailand (Bangkok) and India, trading has come under pressure from the weight of new supply. This is resulting in a greater focus on non-performing or underperforming loans, thereby motivating asset sales. On the whole, however, structured receivership sales will remain limited across the region.
Pricing gap amps challenges
The pricing gap between buyers and sellers has widened with some sellers reticent to accept the changed outlook. Growth rates have softened, yet some markets in Southeast Asia and Australia are trading above previous peaks, making the extent to which to underwrite further growth unclear.
In Japan, trading performance has recovered much better than anticipated in the wake of the 2011 earthquake. With interest rates at near zero and lenders more willing to originate non-recourse loans to hotels, the market offers significant leverage opportunities, driving down yields and pushing prices up. Transaction evidence remains limited however with sales in 2012 primarily undertaken by Japanese corporates and REITs and with few sales in excess of $50 million.
The dynamic trading environment and lack of liquidity in emerging markets also presents challenges for potential investors. Hotel valuations in China remain low with cash flows under pressure given the oversupply in many markets. Yields are also given little regard as Chinese real estate is typically evaluated on a cost per square meter basis and these two metrics continue to diverge.
The environment in India is more positive. With a few deals completing in 2012 and the expectation of more to come in 2013, investment benchmarks are being established. This includes both trading assets and those which are in the latter stages of development, as well as land cited for hotel development. This will provide greater clarity for investors to evaluate pricing and explore opportunities through a formal process. Improved transparency and visibility of the market will also result in higher capital inflows, thereby providing a free kick in terms of capital growth.
Asia Pacific average single asset deal size 1998 to 2013F
Source: Jones Lang LaSalle
0
10
20
30
40
50
60
1998
1999
2000
2001
2002
2003
2004
2005
2006
2007
2008
2009
2010
2011
2012
E
2013
F
US$ (
Millio
ns)
Exchange rates (local / USD, period average)
Source: IHS Global Insight
2008 2009 2010 2011 2012E 2013F 2014F
North Asia and India
China PRC 6.8 6.8 6.6 6.3 6.3 6.3 6.1
Hong Kong 7.8 7.8 7.8 7.8 7.8 7.8 7.8
India 48.5 46.7 44.8 53.3 53.9 52.4 51.5
Japan 90.8 92.1 81.5 77.7 78.2 77.7 75.0
South Korea 1,259.5 1,164.5 1,134.8 1,153.3 1,102.8 1,005.4 980.4
Taiwan 32.9 32.0 30.4 30.3 29.2 28.8 28.2
South East Asia
Indonesia 10,950 9,400 8,991 9,068 9,577 9,833 9,626
Malaysia 3.5 3.4 3.1 3.2 3.1 3.0 3.0
Philippines 47.5 46.4 43.9 43.9 41.2 41.1 41.0
Singapore 1.4 1.4 1.3 1.3 1.2 1.2 1.2
Thailand 34.9 33.3 30.2 31.7 30.7 31.5 30.4
Vietnam 16,977 17,941 19,503 20,828 20,870 21,662 22,639
Pacific
Australia 1.4 1.1 1.0 1.0 1.0 1.0 1.0
New Zealand 1.7 1.4 1.3 1.3 1.2 1.3 1.3
Fiji 1.8 1.9 1.8 1.8 1.8 1.9 1.9

January 2013 | Hotel Investment Outlook 29
Australian investment pace moderates
2012 provides a good barometer for the Australian hotel investment landscape in 2013. Transaction volumes are projected to reach AU$1.0 billion, reflecting a slight moderation compared to 2012 when volumes recorded the third highest annual total on record. Similarly, a number of large transactions will underpin overall volumes. However, the number of sales will rank below historic norms with low levels of liquidity in regional centres and key leisure markets.
Whilst Australia has had the complete focus of many active buyer groups over the past couple of years, increasingly assets will need to compete on a global scale as the ‘great deleveraging’ gains pace. For now, Australia remains a target for cross-border capital with interest from Asian groups in prime hotels still exceptionally strong and selective interest from new capital sources like the Middle East and China. Regional REIT players will also continue to make acquisitions whilst balancing portfolios. Many offshore groups have the added bonus of relationship banking or corporate finance, which means they are not held back by the conservative debt facilities and lengthy approval processes, boosting buying power.
China’s development slows
China’s most uncertain leadership transition in decades has impacted the overall pace of hotel investment activity across China as opinion has become splintered about the direction and speed of the region’s economic powerhouse.
The incumbent government was largely inactive during the second half of the year and is expected to remain so until March 2013 as the new government transitions into power and policies are moved forward. Whilst some developments have progressed, it has been at a lower speed than in recent years, as access to debt and equity capital has become more challenging. This has enabled the private equity and real estate funds to become active again, primarily by offering preferred equity and mezzanine financing. On the whole, foreign investment remains very subdued with limited direct hotel investment, even on a speculative basis.
As operating companies digest an oversupply of luxury rooms in major cities while trying to emulate the success of the budget sector, China’s mid-market will be the most exciting space over the next five years. The mid-segment is currently under-represented from a brand and investment-grade product perspective, however, rising incomes and a wealthier travelling middle class all point to significant opportunity.
Operators are also increasingly looking to Tier 4 and 5 cities for new opportunities as they look to familiarise brand-conscious Chinese consumers with their stable of high-end hotels, even if rates are depressed and the management fees are low. Examples of Tier 4 and 5 cities where international brands have been developed include Anshan in Liaoning province and Dali in Yunnan province.
Policy interest rates – Australia and New Zealand
Source: IHS Global Insight
Australia New Zealand
0%
2%
4%
6%
2008 2009 2010 2011 2012E 2013F 2014F
Polic
y inte
rest
rate
Hotel market cycle 2013 – Australia and New Zealand
Source: Jones Lang LaSalle
RevPARgrowthslowing
RevPARfalling
RevPARrising
RevPARdeclineslowing
Adelaide
Fiji
Brisbane, Perth, Canberra, Melbourne, SydneyCairns, Gold Coast
Wellington,Auckland
Hotel market cycle 2013 – North Asia and India
Source: Jones Lang LaSalle
RevPARgrowthslowing
RevPARfalling
RevPARrising
RevPARdeclineslowingBeijing, Osaka
TokyoNew Delhi, Murnbai,Banglore, Shanghai
Guangzhou
Okinawa
Hong Kong, Macau
Seoul, Taipei

30 Hotel Investment Outlook | January 2013
India’s power shift
The balance of power has shifted in India’s hotel investment market with the dynamics in 2013 favouring both buyers and developers with a slowdown in development activity and more opportunities to acquire. The exuberance which was evident in 2007 has also softened while demand catches up with supply.
Trading performance declined in some Indian markets through 2012 and is expected to moderate further in 2013. Sellers include the closed-end real estate funds, which were established four to five years ago, as well as real estate investors who have expanded into hotels without a fully developed appreciation of the complexities of the sector. Sellers are more motivated but only time will tell if they are willing to meet the market. While the pricing appears reasonable, the rarity of transactions means that Indian hotel real estate is expensive and consequently a gap between buyer and seller expectations still exists.
The buyer profile is more diverse with recent transactions completed by high net worth individuals (HNWIs) and real estate investment funds with an Indian focus. Competition is increasing with a higher level of enquiry from regional REIT players, domestic operators and local developers. Many believe that the market has reached a sufficient level of maturity and that the temporary trading lull provides a unique window to acquire.
While debt is available for the right project, banks remain cautious about lending to the sector and onerous terms continue to act as a stranglehold on the sector’s development. Any fundamental shift would therefore see liquidity increase.
Time to address the distress in Japan
The outlook for Japan’s hotel investment market has improved with trading performance in most markets back to pre-quake levels by summer 2012, driven by strong domestic corporate and leisure demand, offsetting the continued shortfall in inbound tourism. Against this backdrop, investors have become more confident about operating cash flows and the big question for 2013 will be addressing the distress in Japanese hotels and how it affects the pricing gap.
Where loans in default are securitised into CMBS, special servicers have started controlling the process and bad debts will be resolved in due course. Should the junior lender portion be reduced to reflect the adjustment in pricing to meet the expectation of buyers, this could represent a marked change in the investment landscape and may attract investment funds back to the sector. In contrast, although the expiration of the loan moratorium law in March 2013 will place added pressure on Japanese commercial banks for loss realisation on corporate loans, we do not expect formal foreclosure processes to be initiated immediately and liquidation of these assets will be at a slower pace.
We expect the volume of transactions in 2013 to occur outside Tokyo, for example in Sapporo or Osaka. Hotels in Tokyo will continue to be afforded a premium. Markets outside of Tokyo therefore present some interesting high yield opportunities while being more attractive than other Asian secondary markets because of the depth of liquidity which prevails. The punt for investors will therefore be on the stability of the operating cash flows.
Policy interest rates – North Asia and India
Source: IHS Global Insight
China Hong Kong IndiaJapan South Korea Taiwan
0%
2%
4%
6%
8%
10%
2008 2009 2010 2011 2012E 2013F 2014F
Polic
y inte
rest
rate

January 2013 | Hotel Investment Outlook 31
New Thai REIT law to improve liquidity
While having somewhat of a chequered past, Thailand is increasingly emerging as one of the region’s hotel investment hot spots. Transaction volumes are expected to remain robust in 2013 with more deals anticipated in Phuket and Bangkok. The imminent signing of the new REIT law is also expected to incite an increase in liquidity in the hotel and property investment market.
The new REIT law will supersede Thailand’s Property Fund law within 12 months of signing. It is more flexible than the existing Property Fund Law, and is based on REIT regulation in other Asian nations, notably Singapore. Property transactions are expected to increase materially once the law takes effect, although it may take a few years for the market to become established. Thai REITs will also be permitted to invest overseas and capital outflows are expected to increase as a result, some of which will flow into hotels.
Policy interest rates – South East Asia
Source: IHS Global Insight
Indonesia Malaysia PhilippinesSingapore Thailand Vietnam
0%
2%
4%
6%
8%
10%
12%
14%
16%
2008 2009 2010 2011 2012E 2013F 2014F
Polic
y inte
rest
rate
Hotel market cycle 2013 – South East Asia
Source: Jones Lang LaSalle
RevPARgrowthslowing
RevPARfalling
RevPARrising
RevPARdeclineslowing
Phuket
Jakarta
Singapore
Bangkok, Manila
Kuala Lumpur, Bali, Hanoi
Ho Chi Minh City

32 Hotel Investment Outlook | January 2013
Sources and methodology
This report includes hotel transactions tracked by Jones Lang LaSalle valued at US$5 million and above. The sale price is not necessarily the actual contract price, but rather that reported in the press, the confirmed price, or amount apportioned to hotel component. This information is publicly available and Jones Lang LaSalle provides no warranty for accuracy. All dollars are U.S. dollars unless otherwise indicated. Local currencies have been converted to U.S. dollars using monthly average exchange rates. All economic forecasts, unless otherwise noted, have been obtained from IHS Global Insight and are as of the fourth quarter of 2012.
Hotel market cycle
The hotel market cycle is a proprietary graphic of Jones Lang LaSalle, used to provide a snapshot of the state of the hotel property market. Each quadrant describes our observation of the state of the market as indicated by current RevPAR movements and annual outlook at a particular point in time. The cycle clock uses RevPAR as a proxy for the market as a whole. The clock is a simple tool and should only be used in a broad impressionistic way. The property clock is not intended to depict precise forecasts or property market cycles, and does not suggest that markets will move in a clockwise direction. The references to movement in RevPAR are in local currency.
Definition of buyer and seller types
Corporates: Public and private companies from whom investment in hotels is not their primary business activity and who do not operate hotels
Developer/Property company: Property developers who buy with the intent of redevelopment
HNWI: High net worth individual
Hotel operator: Listed or unlisted companies that operate hotels or serviced apartments as their core business
Institutional investor: Direct investment by pension funds, banks and insurance companies
Investment fund/Private equity: Companies, including investment banks, which invest on behalf of other investors. Investments are opportunistic and require an active management strategy
Receiver: Court appointed third party that acts on behalf of bond holder or share holder
REIT: Real Estate Investment Trust or Property Trust. Includes Listed Property Trusts (LPTs) in Australia
Sovereign wealth fund: Funds owned by a state composed of various financial assets

Atlanta tel: +1 404 995 2100 fax: +1 404 995 2109
Auckland tel: +64 9 366 1666 fax: +64 9 309 7628
Bangkok tel: +66 2624 6400 fax: +66 2679 6519
Barcelona tel: +34 93 318 5353 fax: +34 93 301 2999
Beijing tel: +86 10 5922 1300 fax: +86 10 5922 1346
Birmingham tel: +44 121 643 6440 fax: +44 121 634 6510
Brisbane tel: +61 7 3231 1400 fax: +61 7 3231 1411
Buenos Aires tel: +54 11 4893 2600 fax: +54 11 4893 2080
Chengdu tel: +86 28 6680 5000 fax: +86 28 6680 5096
Chicago tel: +1 312 782 5800 fax: +1 312 782 4339
Dallas tel: +1 214 438 6100 fax: +1 214 438 6101
Denver tel: +1 303 260 6500 fax: +1 303 260 6501
Dubai tel: +971 4 426 6999 fax: +971 4 365 3260
Düsseldorf tel: +49 211 13006 0 fax: +49 211 13399 0
Exeter tel: +44 1392 423696 fax: +44 1392 423698
Frankfurt tel: +49 69 2003 0 fax: +49 69 2003 1040
Glasgow tel: +44 141 248 6040 fax: +44 141 221 9032
Istanbul tel: +90 212 350 0800 fax: +90 212 350 0806
Jakarta tel: +62 21 2922 3888 fax: +62 21 515 3232
Leeds tel: +44 113 244 6440 fax: +44 113 245 4664
London tel: +44 20 7493 6040 fax: +44 20 7399 5694
Los Angeles tel: +1 213 239 6000 fax: +1 213 239 6100
Lyon tel: +33 4 7889 2626 fax: +33 4 7889 0476
Madrid tel: +34 91 789 1100 fax: +34 91 789 1200
Manchester tel: +44 161 828 6440 fax: +44 161 828 6490
Marseille tel: +33 495 091313 fax: +33 495 091300
Melbourne tel: +61 3 9672 6666 fax: +61 3 9600 1715
Mexico City tel: +52 55 5980 8054 fax: +52 55 5202 4377
Miami tel: +1 305 529 6345 fax: +1 305 529 6398
Milan tel: +39 2 8586 8672 fax +39 2 8586 8670
Moscow tel: +7 495 737 8000 fax: +7 495 737 8011
Munich tel: +49 89 2900 8882 fax: +49 89 2900 8888
New Delhi tel: +91 124 331 9600 fax: +91 124 460 5001
New York tel: +1 212 812 5700 fax: +1 212 421 5640
Paris tel: +33 1 4055 1718 fax: +33 1 4055 1868
Perth tel: +61 8 9322 5111 fax: +61 8 9481 0107
Rome tel: +39 6 4200 6771 fax: +39 6 4200 6720
San Francisco tel: +1 415 395 4900 fax: +1 415 955 1150
São Paulo tel: +55 11 3071 0747 fax: +55 11 3071 4766
Shanghai tel: +86 21 6393 3333 fax: +86 21 6393 7890
Singapore tel: +65 6536 0606 fax: +65 6533 2107
Sydney tel: +61 2 9220 8777 fax: +61 2 9220 8765
Tokyo tel: +81 3 5501 9240 fax: +81 3 5501 9211
Washington, D.C. tel: +1 202 719 5000 fax: +1 202 719 5001
Jones Lang LaSalle’s Hotels & Hospitality Group dedicated offices

2013
COPYRIGHT © Jones Lang LaSalle IP, INC. 2013
All rights reserved. No part of this publication may be reproduced or transmitted in any form or by any means without prior written consent of Jones Lang LaSalle. It is based on material that we believe to be reliable. Whilst every effort has been made to ensure its accuracy, we cannot offer any warranty that it contains no factual errors. We would like to be told of any such errors in order to correct them.
www.jll.com/hospitality
Hotels & Hospitality