Embed Size (px)
Citation preview

1
HOTEL INDUSTRY
ii
August 2018
© THE INSTITUTE OF COMPANY SECRETARIES OF INDIA
Disclaimer
Due care has been taken to avoid errors or omissions in this publication. In spite of this, errors may still persist. Any mistake, error or discrepancy if noted, may be brought to the notice of the Institute, which shall be taken care of in next edition.
The Institute shall not be responsible for any loss or damage resulting from any action taken on the basis of the contents of this publication. To avoid any doubt, it is suggested that the reader should cross-check the contents of this publication with original Government notifications.
This industry specific research report is for wide circulation among experts to receive valuable suggestions and necessary supports for further improving the manuscript. Experts are encouraged to email their suggestions and contribute any material which they think could value add the manuscript to [email protected].
The Section 3, “Legal Framework” is indicative only.
Published by :
THE INSTITUTE OF COMPANY SECRETARIES OF INDIA
ICSI House, 22, Institutional Area, Lodi Road, New Delhi - 110 003
Phones : 41504444, 45341000, Fax : 24626727Website : www.icsi.edu, E-mail : [email protected]
Laser typesetting at: AArushi Graphics
Printed at: Indian Offset Press/August 2018

iii
PREFACE
In the liberalized economic policy regime, the corporate sector has been assigned a major role as the driver of growth and development of the Indian economy. This has resulted in a number of changes, especially in the regulatory framework applicable to specific industry sectors. As an economy is consist of different industries like agriculture, service, engineering, manufacturing etc., it provides impetus to the economy i.e. employment generation, production of goods and services, income distribution in the whole economy.
With the intent to further enhance the competitiveness of India’s services sector and to boost productivity with the creation of new employment opportunities, the Central Government has focused attention on 12 sectors in the economy as ‘Champion Sectors’ i.e., IT & ITeS, Tourism and Hospitality, Financial, Accounting and Finance, Transport and Logistics, Construction and Related Engineering, Communication, Education, Medical Value Travel, Audio Visual, Legal and Environmental.
As part of its support to government’s policy initiatives, the Institute has started an initiative by projecting Company Secretary as ‘Corporate Saviour ’- a person who can be relied upon by stakeholders i.e., Corporates, Promoters, Shareholders, Government and Regulators.
With this basic objective, the institute has initiated the process of developing industry specific knowledge through research, creating awareness among the members about the contribution the Company Secretary can make in specific industry, capacity building of members in the specific industry, securing recognitions for members in specific industry sector, and sensitisation of regulatory authorities about the contribution the Company Secretaries can make in specific industry.
For conducting the detailed analysis in a structured manner, a format is designed with four sections, Section-I covering the industry profile, Section-II Business Scenario, Section-III legal framework and Section-IV Contribution of Company Secretary in employment and in practice. The research publications in all the industry sector are based on exploratory research.
I wish to express my sincere thanks and gratitude to CS Ahalada Rao V, Vice-President, the ICSI for his efforts in guiding and finalizing industry specific publications.

iv
I also appreciate Dr. Prasant Sarangi, Director (Research), the ICSI-Research Cell for doing in-depth study of Hotel Industry and bringing out this research publication, under the guidance of CS Sonia Baijal, Director, Professional Development, Prospective Planning and Studies and Dr. S.K. Dixit, Mentor, Research Cell.
I am sure this research publication will prove to be of immense value to professionals, corporates and researchers. The research is an ongoing process, and I welcome the readers to give suggestions to make this research publication more comprehensive.
I wish all the readers a happy reading
New Delhi CS Makarand Lele Date : August 23, 2018 President
The Institute of Company Secretaries of India
v
TABLE OF CONTENTS
Section No.
Title of the Section / Sub Topics Page Number
1 Introduction 1
1.1 Introduction 1
1.2 The Hospitality Industry 2
2 Business Scenario 6
2.1 History 6
2.2 Business Scenario 7
2.3 Nature 19
2.4 Types of Hotel Industry 20
3 Legal Framework 29
3.1 Industry type 29
3.2 Applicable Laws 29
3.3 State Acts 34
4 Contribution of Company Secretary 36
4.1 Introduction 36
4.2 Role of Company Secretary in Employment 39
4.3 Role of Company Secretary in Practice 39
4.4 Suggestions to Ministry of Tourism (MOT) to boost Indian Hotel Industry:
39
4.5 Conclusion 42
Bibliography 43
Revised Guidelines for Marketing Development Assistance (MDA) Scheme
44
Served From Indian Scheme 53

vi

1
SECTION 1
INTRODUCTION
1.1 INTRODUCTION
With opening up of the Indian economy after 1991 and the adoption of globalization, there has been a steep rise in the operational activities of various sectors that were earlier dormant. One of the best examples of this is the hospitality industry. The sectors in hospitality services include travel and tourism, and hotel industry. The other industries included in this sector are food and service management, leisure, bars, night clubs, amusement parks, motels, hostels, restaurants, self-catering accommodation, holiday centers and travel agents. It has rapidly grown in training people for hospitality industry the last 26 years and despite the recession in economy is determined to grow further. The sector at present employs about 2.5 million people and provides support to other industries, like hotels and restaurants, and educational establishments. One of the major part of this sector is the hotel industry. The economy has grown and with it has grown the personal wealth of people. This domestic success has created greater need for more hotels, attract tourism.
India is a country with a long history, and many people visit the country for spiritual reasons, bringing in visitors from all over the world. Additionally, the country has 32 national heritage sites bringing in history buffs, and a wide variety of nature reserves and parks for those looking for adventure. The variety of available sites have made India a popular choice for many foreigners.
Other areas in the hospitality industry come from businesses that have been outsourced here to India, because the wages are much cheaper over the last decade and a half the mad rush to India for business opportunities has intensified and elevated room rates and occupancy levels in hotel’s. Even budget hotels are charging USD 250 per day. This successful growth story of ‘Hotel Industry in India’ is second only to that of China in the Asia Pacific. This brings in business people who are meeting and working with the international companies, thus strengthening the hotel industry.
The expanding activities of the hotel industry have turned it into a multimillion-dollar industry. Hotel industry consists of restaurants, lodging places, theme parks, event planning,
1
2 HOTEL INDUSTRY
etc. and includes activities such as facility maintenance and direct operations including servers, porters, housekeepers, bartenders, kitchen keepers, etc. Such services that are provided by the hotels constitute to be the subject matter of laws that regulate the hotel industry. This study is specific to hotel industry only.
1.2 THE HOSPITALITY INDUSTRY
The hospitality industry is a large umbrella industry that contains several different divisions of businesses:
• Food and beverage Industry
• Air and land travel Industry
• Entertainment such as movies/theatre/sports Industry, and
• Tourism Industry and medical tourism
• Hotel Industry
The hospitality industry is usually one of the largest revenue producers for countries since it deals with a variety of businesses. Hospitality usually focuses on extra money that people have to spend on pleasurable things and leisure, though not always. Business conventions, trainings, and meetings in different countries also affect the hospitality industry greatly. Besides this domestic and international travellers also contribute to it.
The present analytical research broadly discusses the Indian Hotel Industry. The paragraphs below shortly introduce the nature of other related industries as well. However, a detailed study of each of these industries is the subject matter of our extensive research, which are is discussed below in a logical sequence.
• Food and Beverage Industry
India is among the largest producers of food grains globally. Following figure-1 shows the production of food grains (in million tonnes) in India by 2014. It can be seen from the figure that the total increase is 34 MT with a CAGR of 2%.
It is increasingly becoming evident that only a vibrant food processing sector can lead to increasing farm-gate prices and thus enhance income levels, reduce wastages and increase employment opportunities. An average Indian spends about 50% of household expenditure on food items, and the demand for processed/convenience food is also constantly on the rise. As India has liberalized its overall policy regime with specific incentives for a high priority food processing sector, a very conducive environment for investments and exports in the sector has attracted lot of capital.

3
The Indian food processing industry accounts for 32 per cent of the country’s total food market. It is one of the largest industries in India, and is ranked fifth in terms of production, consumption, export and expected growth. It contributes around 8.80 and 8.39 per cent of Gross Value Added (GVA) in Manufacturing and Agriculture respectively. The Indian gourmet food market is currently valued at US$ 1.3 billion and is growing at a Compound Annual Growth Rate (CAGR) of 20 per cent. India’s organic food market is expected to increase by three times by 2020.
The online food-ordering business in India is in its nascent stage, yet it is witnessing exponential growth. With online food delivery players like FoodPanda, Zomato, TinyOwl and Swiggy are building scale through partnerships, the organised food business has a huge potential and a promising future. The online food delivery industry grew at 150 per cent year-on-year with an estimated Gross Merchandise Value (GMV) of US$ 300 million in 2016.
Indian is also a leading market for food related raw materials in the world. The following table shows various items related to raw materials in food production with their global ranking.
According to the data provided by the Department of Industrial Policies and Promotion (DIPP), the food processing sector in India has received around US$ 7.54 billion worth of Foreign Direct Investment (FDI) during the period April 2000 to March 2017. The Confederation of Indian Industry (CII) estimates that the food processing sectors have the potential to attract as much as US$ 33 billion of investment over the next 10 years and also to generate employment of nine million person-days.
• Air and Land Travel Industry
In 2018, airlines have the opportunity to take progressive steps towards defining the next generation of air travel. Airlines are leaving behind a decade where losses surpassed many-fold. Now, bolstered by low fuel prices, tighter capacity, new merchandizing strategies, and industry consolidation, the sector is expected to post a consecutive run of annual profits. Indian carriers should seize the opportunity of the upswing – and that begins with investment in critical infrastructure and technology that has been lacking behind because of recent industry pressures.
Many airlines are taking steps in the right direction. On the infrastructure side, large Indian carriers are announcing significant airport investments and fleet expansions that are critical to capitalize on rising travel demand. Carriers are also upgrading fleets with sorely needed amenities to meet rising flyer expectations, including new seats, satellite Wi-Fi service, larger overhead bins, and power for devices. A competitive aircraft leasing market will likely continue to grant carriers easier access to attractive aircraft-financing, enabling fleet growth and expansion in 2018.
SECTION 1 – INTRODUCTION

4 HOTEL INDUSTRY
Air traffic reform will likely continue to be a key infrastructure debate throughout the year, with enormous implications for the industry. A confluence of emerging technologies can unlock incredible solutions for airlines, specifically around main points, such as security checkpoints, baggage systems, route optimization, helping consumers navigate busy airports, and mitigating the impact of weather delays and equipment failure. Consider the following scenario that showcases the potential impact technologies like the Internet of Things (IoT), robotics, 3D printing, asset tracking, and smart workforces can have to relieve pain points around aircraft malfunctions:
• In-air detection and notification: Mid-flight, an IoT connected aircraft part recognizes it is not functioning properly. The aircraft sends a message to the ground about the malfunctioning part for repair upon arrival.
• The on-demand supply chain: The part used in the repair will need to be replaced upon landing, so before arrival, a 3D printer at the arrival airport receives a signal to print the part.
• The connected, autonomous tarmac: The printed part must be delivered to the arrival gate. An autonomous vehicle picks it up and makes a delivery.
• The connected employee: The mechanic uses heads-up display eyeglasses to reference documents from the cloud. Using a bore scope connected to a wireless tablet, the mechanic streams live video to a remote engineer allowing the repair and inspection to benefit from the engineer’s authority.
Instead of this aircraft being taken out of service, frustrating travelers with delays, the aircraft leaves on time for its next segment. This example not only demonstrates the synergistic power of different technology platforms, it highlights the inextricable link between airline operations and customer experience.
• Entertainment Industry
The Indian media industry has tremendous scope for growth in all the segments due to rising income and evolving lifestyles. Media is consumed by audience across demographics and various avenues, such as television, films, out of home (OOH), radio, animation and visual effect (VFX), music, gaming, digital advertising, and print.
The Media & Entertainment industry is anticipated to grow at a Compound Annual Growth Rate (CAGR) of 13.9 per cent during 2016-21 to reach US$ 37.55 billion. The industry has provided employment to 3.5-4 million people, including both direct and indirect employment as of 2017.
Advertising expenditure in India is expected to grow 13 per cent year-on-year to Rs 69,346 crore (US$ 10.71 billion) in 2018 and Rs 1.07 trillion (US$ 16.70 billion) by 2020. The Indian

5
digital advertising industry is expected to grow at a CAGR of 32 per cent to reach Rs 18,986 crore (US$ 2.93 billion) by 2020. India’s digital revenues are expected to reach US$394.22 million by 2021. India is the second largest television market in the world with US$ 10.14 billion in revenue in 2017. The Indian film industry is expected to grow at a rate of 11.9 per cent by 2020. India digital advertising market has reached Rs 8,202 crore (US$ 1.27 billion) in 2017 and is forecasted to grow at a CAGR of 32 per cent to reach Rs 18,986 crore (US$ 2.95 billion) by 2020. The Government of India has supported this sector’s growth by taking various initiatives such as digitizing the cable distribution sector to attract greater institutional funding, increasing Foreign Direct Investment (FDI) limit from 74 per cent to 100 per cent in cable and Direct-to-home (DTH) satellite platforms, and granting industry status to the film industry for easy access to institutional finance.
• Tourism Industry
Tourism is a major engine of economic growth and an important source of employment & foreign exchange earnings in many countries including India. It has great capacity to create large-scale employment of diverse variety – from the most specialized to the unskilled, and hence can play a major role in the creation of additional employment opportunities. It can also play an important role in achieving growth with equity and sustainability.
Tourism Industry in India is growing and it has vast potential for generating employment and earning large amount of foreign exchange besides giving a fillip to the country’s overall economic and social development. By 2030 it will be nearly two billion people, spending just over $2 trillion, in all corners of the world. As per the report of UNWTO around two billion people, experiencing new cultures are sharing new friends, creating new businesses. Two billion people providing jobs and an income 400 million people globally. By 2030, travel & tourism will be 11% of the world’s economy. Each and every person who travels will play a part in this story of growth, adventure and experience.
SECTION 1 – INTRODUCTION

SECTION-2
BUSINESS SCENARIO
2.1 HISTORY
A hotel is an establishment that provides lodging paid on a short-term basis. Facilities provided may range from a basic bed and storage for clothing, to luxury features like en-suite bathrooms. Larger hotels may provide additional guest facilities, such as a swimming pool, business centre, childcare, conference facilities and social function services. The Indian Hotel Industry Survey 2013-2014 reflects a positive change indicated by the key operating statistics, which may be an early indicator towards the end of a downturn for the Indian hotel industry. There are over 600 hotels and resorts in India that constitute the “organized” or modern sector. Most of these hotels are in the larger cities and major tourist or business destinations. India has several world class domestic hotel chains. Besides several international chains have also established their presence through franchising or entering into partnerships with Indian firms. These branded hotels are mostly in the premium segment (5 star/5 star deluxe/heritage) and mid-range segments (4 star), which cater to businessmen and leisure travelers. With the rise in tourism and business travel, several international brands are exploring the possibility of entering or expanding even further in India.
Hotel Industry as we know started in the 19th century with the development of major cities, easier sea travel and coming up of railways. During Mogul rule, the forts and their surroundings would cater to the needs of the travelers often in exchange for no more than the story of their adventures during their travel or any news from other towns and villages they passed by. In India, resting houses called dharamshallas were established on high ways by kings and emperors of during the ancient and medieval periods. Movement of people both political and pilgrimage stressed the need for better and improved facilities to cater to the varied needs of the people coming from various classes of the society.
Most of modern hotels that sprouted were managed by European families. The Bombay hotel was opened in 1799. The British brought modern hotels to Kolkata. The Oldest was John Spence’s Hotel. Spence’s, the first ever hotel in Asia was opened up to the public in 1830. The credit for opening the first western style hotel under the name of British Hotel in Bombay in 1840 goes to Pallonjee Pestonjee. Then came the ‘Auckland’ hotel by David
6

7
Wilson in Calcutta in the year 1840-41 (‘The Great Eastern Hotel’ now officially called Lalit Great ‘Eastern Hotel’) is a colonial era hotel in the Indian city of Kolkata (formerly Calcutta) and Connemara Hotel in Madras (now Chennai) in the year 1870 by E. A. Oakshroff.
In 1971-72, a beautiful palace of Rajasthan was linked up to the Taj, the Lake Palace in Udaipur, a marble dream, afloat lake pichola and the Rambagh palace, originally created at the height of Rajput splendour in Jaipur. In 1903 the group, hired the best architects and craftsmen and build the exquisitely beautiful Taj Mahal hotel in Bombay (now Mumbai) with 220 rooms. Mohan Singh Oberoi took Carlton Hotel in Shimla on Lease in 1927, renamed as Clarks hotel. He took a building in 1933 and built Grand Hotel in Calcutta it.
The India Tourism Development Corporation (ITDC) was set up in 1966 as a corporation under the Indian Companies Act of 1956, with the merger of Janpath Hotel India Ltd. Three Welcome Group Hotels were commissioned between 1975 and 1977; these were non-franchised hotels, inspired by the slogan “Be Indian, Buy Indian” and using Indian expertise. Ultimately, however, these hotels adopted the Sheraton system in 1978 and used the services of expatriates for the purposes of upgrading staff training and installing Sheraton operating systems-all without a management contract. This gave the Welcome Group a good start.
When India agreed to host the 1982 Asian Games, the Government of India granted licenses for building hotels to the Taj Palace, Asian Hotels Hyatt Regency, India Tourism Development Corporation – Lodhi Hotel, Samrat Hotel, Kanishka, Le Meridien, and Surya Sofitel, with the stipulation that their new hotels had to be completed in time for the games. India hosted the Commonwealth Games in 2010, at Delhi. It was India’s most successful Commonwealth Games to date with Indian athletes winning 38 gold, 27 silver and 36 bronze medals. This also added to the growth of hotel industry in India.
2.2 BUSINESS SCENARIO:
After registering GDP growth of over 7 per cent for the third year in succession in 2016-17, the Indian economy is headed for somewhat slower growth, estimated to be 6.5 per cent in 201718, as per first Advance Estimates released by CSO. This is slightly lower than the range of 6.5 per cent to 6.75 per cent being currently projected based on recent developments. Even with this lower growth during 2017-18, GDP growth has averaged 7.3 per cent for the period from 2014-15 to 2017-18, which is the highest among the major economies of the world. That this growth has been achieved in a milieu of lower inflation with improved current account balance and a notable reduction in the fiscal deficit to GDP ratio makes it all the more creditable. In addition to the introduction of GST, the year also witnessed significant steps being undertaken
SECTION 2 – BUSINESS SCENARIO

8 HOTEL INDUSTRY
towards resolution of problems associated with non-performing assets of the banks, further liberalization of FDI, etc., thereby strengthening the momentum of reforms. After remaining in negative territory for a couple of years, growth of exports rebounded into positive one during 2016-17 and strengthened further in 2017-18. There was an augmentation in the spot levels of foreign exchange reserves close to US$ 414 billion, as on 12th January 2018.
Table-1: Indian Economy Outlook
Years 2014-15 2015-16 2016-17 2017-18
GDP at Constant Market price (Growth %)
10536984 (7.4)
11381002 (8.0)
12189854 (7.1)
12985363 (6.5)
Gross saving (% of GDP)
33.1 32.3 NA NA
Gross Capital Formation (%)
34.4 33.3 NA NA
Per capita National Income
86454 94130 103219 111783
WPI Inflation (%) 1.2 -3.7 1.7 2.9
CPI Combined Inflation (%)
5.9 4.9 4.5 3.3
Foreign Exchange Reserve (US $ billion)
341.6 360.2 370.0 409.4
Gross Fiscal Deficit (% to GDP)
4.1 3.9 3.5 3.2
Revenue Deficit 2.9 2.5 2.1 1.9
Source: Compiled from Economic Survey, 2017-18
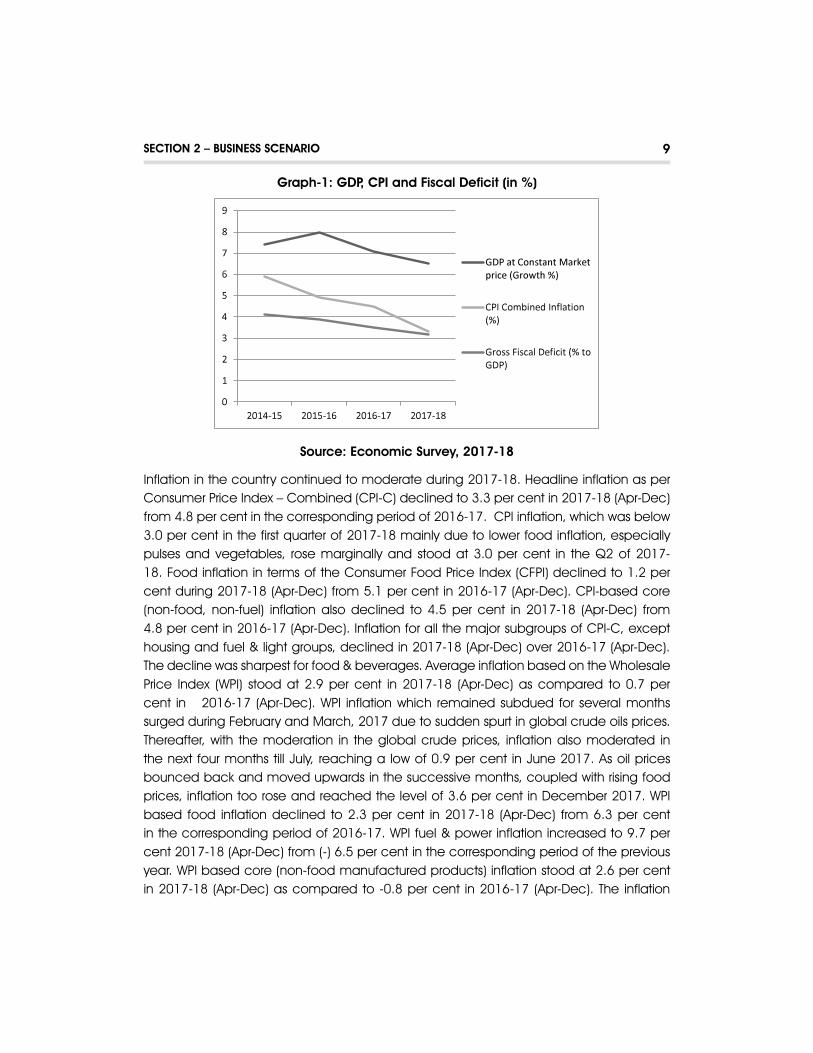
The derived graph-1 given below shows the overall economic indicator by considering three variables like GDP, CPI combined inflation and Fiscal deficit. The CPI and fiscal deficit are observed to be decreasing continuously which is a positive sign for the country.
9
Graph-1: GDP, CPI and Fiscal Deficit (in %)
Source: Economic Survey, 2017-18
Inflation in the country continued to moderate during 2017-18. Headline inflation as per Consumer Price Index – Combined (CPI-C) declined to 3.3 per cent in 2017-18 (Apr-Dec) from 4.8 per cent in the corresponding period of 2016-17. CPI inflation, which was below 3.0 per cent in the first quarter of 2017-18 mainly due to lower food inflation, especially pulses and vegetables, rose marginally and stood at 3.0 per cent in the Q2 of 2017-18. Food inflation in terms of the Consumer Food Price Index (CFPI) declined to 1.2 per cent during 2017-18 (Apr-Dec) from 5.1 per cent in 2016-17 (Apr-Dec). CPI-based core (non-food, non-fuel) inflation also declined to 4.5 per cent in 2017-18 (Apr-Dec) from 4.8 per cent in 2016-17 (Apr-Dec). Inflation for all the major subgroups of CPI-C, except housing and fuel & light groups, declined in 2017-18 (Apr-Dec) over 2016-17 (Apr-Dec). The decline was sharpest for food & beverages. Average inflation based on the Wholesale Price Index (WPI) stood at 2.9 per cent in 2017-18 (Apr-Dec) as compared to 0.7 per cent in 2016-17 (Apr-Dec). WPI inflation which remained subdued for several months surged during February and March, 2017 due to sudden spurt in global crude oils prices. Thereafter, with the moderation in the global crude prices, inflation also moderated in the next four months till July, reaching a low of 0.9 per cent in June 2017. As oil prices bounced back and moved upwards in the successive months, coupled with rising food prices, inflation too rose and reached the level of 3.6 per cent in December 2017. WPI based food inflation declined to 2.3 per cent in 2017-18 (Apr-Dec) from 6.3 per cent in the corresponding period of 2016-17. WPI fuel & power inflation increased to 9.7 per cent 2017-18 (Apr-Dec) from (-) 6.5 per cent in the corresponding period of the previous year. WPI based core (non-food manufactured products) inflation stood at 2.6 per cent in 2017-18 (Apr-Dec) as compared to -0.8 per cent in 2016-17 (Apr-Dec). The inflation
SECTION 2 – BUSINESS SCENARIO
10 HOTEL INDUSTRY
of manufactured group, which has the weight of 64.2 per cent in the WPI basket, has however, remained range-bound hovering around 2.6 per cent.
India’s foreign exchange reserves reached US$ 409.4 billion on December 29, 2017, with a growth of 14.1 per cent on a YoY basis from end of December, 2016 and growth of 10.7 per cent from end-March 2017. The foreign exchange reserves were US$ 413.8 billion on 12th January 2018. The foreign exchange reserves in nominal terms (including the valuation effects) increased by US$ 30.3 billion during 2017 as compared to an increase of US$ 11.8 billion during the same period of preceding year. The import cover of India’s foreign exchange reserves increased to 11.1 months at end-September 2017. Exchange Rate is 1.46 during 2017-18 (up to December 2017), the rupee generally traded with an appreciating bias against the US dollar, barring intermittent depreciation in September and October 2017. The rupee strengthened by 2.5 per cent to a level of Rs. 64.24 per US dollar during December, 2017 from the level of Rs. 65.88 per US dollar during March 2017 on the back of significant capital flows. The appreciating trend vis-à-vis US$ has continued in January so far. During 2017-18 (April-December), on an average, the rupee has also appreciated against other major currencies but for the US dollar. The appreciation of the rupee (in real effective exchange rate) indicates that India’s exports may have become slightly less competitive. In the last few years, the value of Rupee has been relatively stable vis-à-vis US$. The rupee depreciated by much higher levels between 2011-12 and 2013-14 than between 2014-15 and 2016-17. Not only this, within the year fluctuations have been much less.
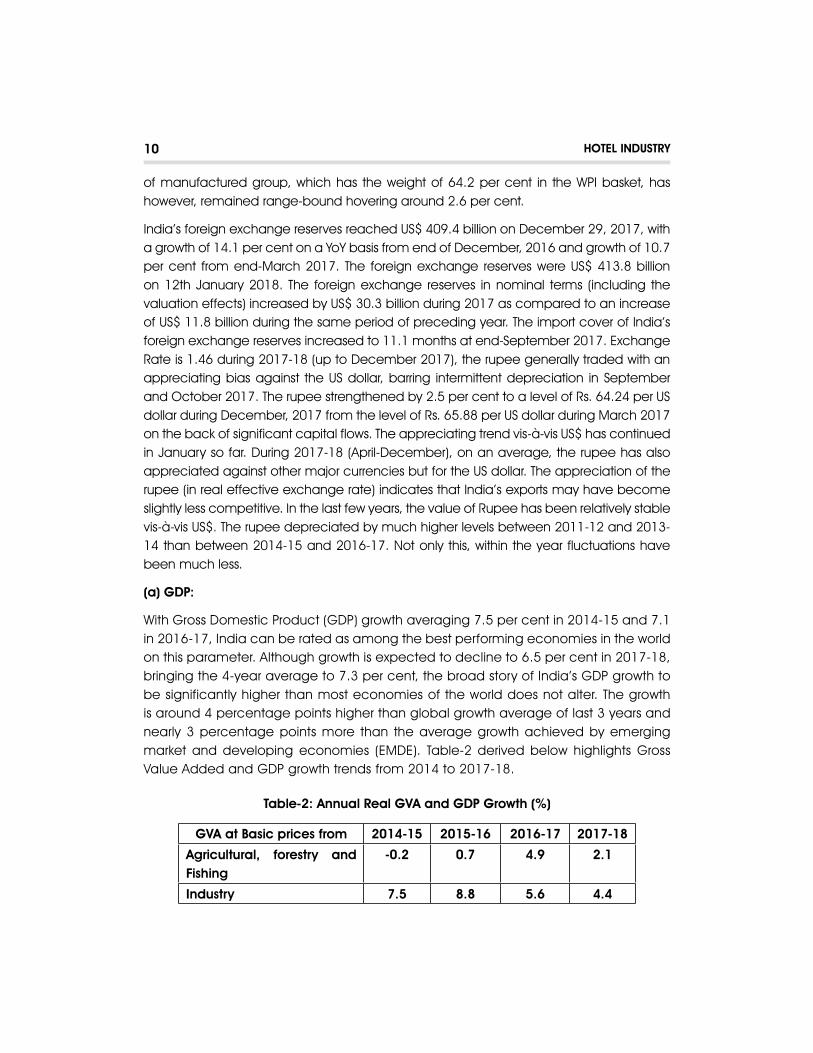
(a) GDP:
With Gross Domestic Product (GDP) growth averaging 7.5 per cent in 2014-15 and 7.1 in 2016-17, India can be rated as among the best performing economies in the world on this parameter. Although growth is expected to decline to 6.5 per cent in 2017-18, bringing the 4-year average to 7.3 per cent, the broad story of India’s GDP growth to be significantly higher than most economies of the world does not alter. The growth is around 4 percentage points higher than global growth average of last 3 years and nearly 3 percentage points more than the average growth achieved by emerging market and developing economies (EMDE). Table-2 derived below highlights Gross Value Added and GDP growth trends from 2014 to 2017-18.
Table-2: Annual Real GVA and GDP Growth (%)
GVA at Basic prices from 2014-15 2015-16 2016-17 2017-18
Agricultural, forestry and Fishing
-0.2 0.7 4.9 2.1
Industry 7.5 8.8 5.6 4.4
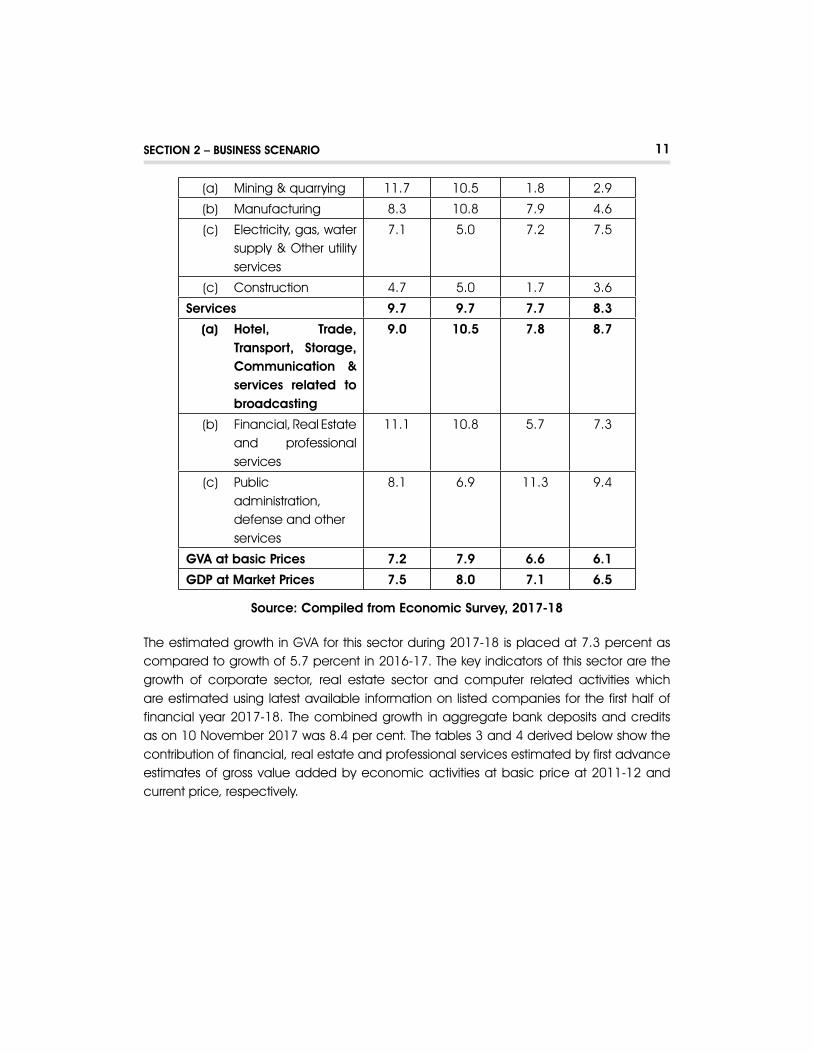
11
(a) Mining & quarrying 11.7 10.5 1.8 2.9
(b) Manufacturing 8.3 10.8 7.9 4.6
(c) Electricity, gas, water supply & Other utility services
7.1 5.0 7.2 7.5
(c) Construction 4.7 5.0 1.7 3.6
Services 9.7 9.7 7.7 8.3
(a) Hotel, Trade, Transport, Storage, Communication & services related to broadcasting
9.0 10.5 7.8 8.7
(b) Financial, Real Estate and professional services
11.1 10.8 5.7 7.3
(c) Public administration, defense and other services
8.1 6.9 11.3 9.4
GVA at basic Prices 7.2 7.9 6.6 6.1
GDP at Market Prices 7.5 8.0 7.1 6.5
Source: Compiled from Economic Survey, 2017-18
The estimated growth in GVA for this sector during 2017-18 is placed at 7.3 percent as compared to growth of 5.7 percent in 2016-17. The key indicators of this sector are the growth of corporate sector, real estate sector and computer related activities which are estimated using latest available information on listed companies for the first half of financial year 2017-18. The combined growth in aggregate bank deposits and credits as on 10 November 2017 was 8.4 per cent. The tables 3 and 4 derived below show the contribution of financial, real estate and professional services estimated by first advance estimates of gross value added by economic activities at basic price at 2011-12 and current price, respectively.
SECTION 2 – BUSINESS SCENARIO

12 HOTEL INDUSTRY
Table-3: First Advance Estimates of GVA at Basic Price by Economic Activities(At 2011-12 prices) (Rs. crore)
Industry 2015-16 2016-17(PE)
2017-18(Ist AE)
Percentage change over previous year
2016-17
2017-18
1. Agriculture, forestry & fishing
1,617,208 1,696,175 1,732,371 4.9 2.1
2. Mining & quarrying
324,740 330,485 339,972 1.8 2.9
3. Manufacturing 1,872,115 2,019,227 2,112,345 7.9 4.6
4. Electricity, gas, water supply & other utility services
224,447 240,590 258,672 7.2 7.5
5. Construction 879,782 894,668 927,085 1.7 3.6
6. Trade, hotels, transport, communication and services related to broadcasting
1,989,161 2,143,956 2,329,801 7.8 8.7
7. Financial, real estate & professional services
2,298,798 2,429,638 2,606,602 5.7 7.3
8. Public administration, defence and Other Services
1,284,263 1,430,002 1,564,473 11.3 9.4
GVA at Basic Price 10,490,514 11,185,440 11,871,320 6.6 6.1
Source: Compiled from Economic Survey, 2017-18
All these demographic and economic indicators and more are enough to convenience that the real estate sector is having an ample scope growth in the coming years.

13
Table-4: First Advance Estimates of GVA at Basic Price by Economic Activities(At current prices)
Industry 2015-16 2016-17 2017-18 Percentage change over previous year
2016-17
2017-18
1. Agriculture, forestry & fishing
2,175,547 2,372,085 2,438,546 9.0 2.8
2. Mining & quarrying
296,253 301,921 341,843 1.9 13.2
3. Manufacturing 2,064,820 2,257,413 2,422,101 9.3 7.3
4. Electricity, gas, water supply & other utility services
321,651 342,422 368,269 6.5 7.5
5. Construction 1,006,403 1,041,343 1,109,608 3.5 6.6
6. Trade, hotels, transport, communication and services related to broadcasting
2,294,364 2,519,999 2,825,708 9.8 12.1
7. Financial, real estate & professional services
2,631,120 2,889,048 3,186,115 9.8 10.3
8. Public administration, defence and Other Services
1,668,486 1,945,683 2,205,463 16.6 13.4
GVA at Basic Price 12,458,642 13,669,914 14,897,653 9.7 9.0
Source: Compiled from Economic Survey, 2017-18
Real GDP or Gross Domestic Product (GDP) at constant (2011-12) prices in the year 2017-18 is likely to attain a level of Rs.129.85 lakh crore, as against the Provisional Estimate of GDP for the year 2016-17 of Rs. 121.90 lakh crore, released on 31st May 2017. The growth
SECTION 2 – BUSINESS SCENARIO
14 HOTEL INDUSTRY
in GDP during 2017-18 is estimated at 6.5 per cent. With GDP at current prices in the year 2017-18 is likely to attain a level of Rs. 166.28 lakh crore, as against Rs. 151.84 lakh crore in 2016-17 showing a growth rate of 9.5 per cent.
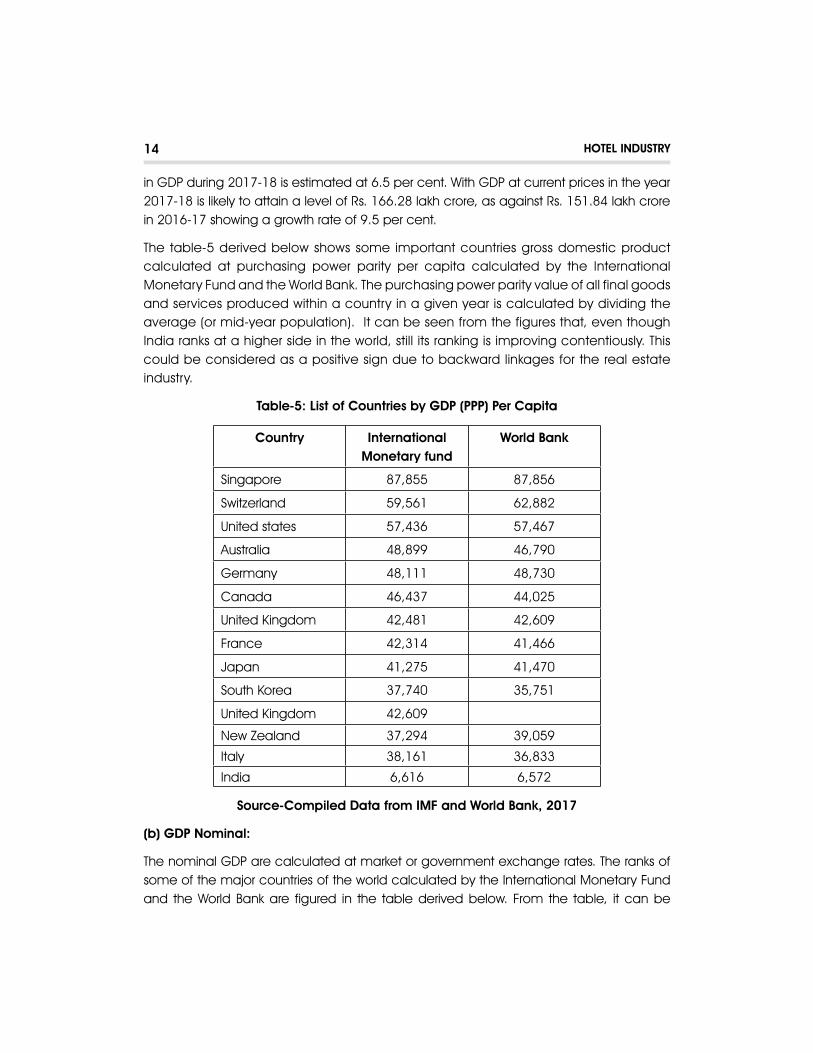
The table-5 derived below shows some important countries gross domestic product calculated at purchasing power parity per capita calculated by the International Monetary Fund and the World Bank. The purchasing power parity value of all final goods and services produced within a country in a given year is calculated by dividing the average (or mid-year population). It can be seen from the figures that, even though India ranks at a higher side in the world, still its ranking is improving contentiously. This could be considered as a positive sign due to backward linkages for the real estate industry.
Table-5: List of Countries by GDP (PPP) Per Capita
Country International Monetary fund
World Bank
Singapore 87,855 87,856
Switzerland 59,561 62,882
United states 57,436 57,467
Australia 48,899 46,790
Germany 48,111 48,730
Canada 46,437 44,025
United Kingdom 42,481 42,609
France 42,314 41,466
Japan 41,275 41,470
South Korea 37,740 35,751
United Kingdom 42,609
New Zealand 37,294 39,059
Italy 38,161 36,833
India 6,616 6,572
Source-Compiled Data from IMF and World Bank, 2017
(b) GDP Nominal:
The nominal GDP are calculated at market or government exchange rates. The ranks of some of the major countries of the world calculated by the International Monetary Fund and the World Bank are figured in the table derived below. From the table, it can be
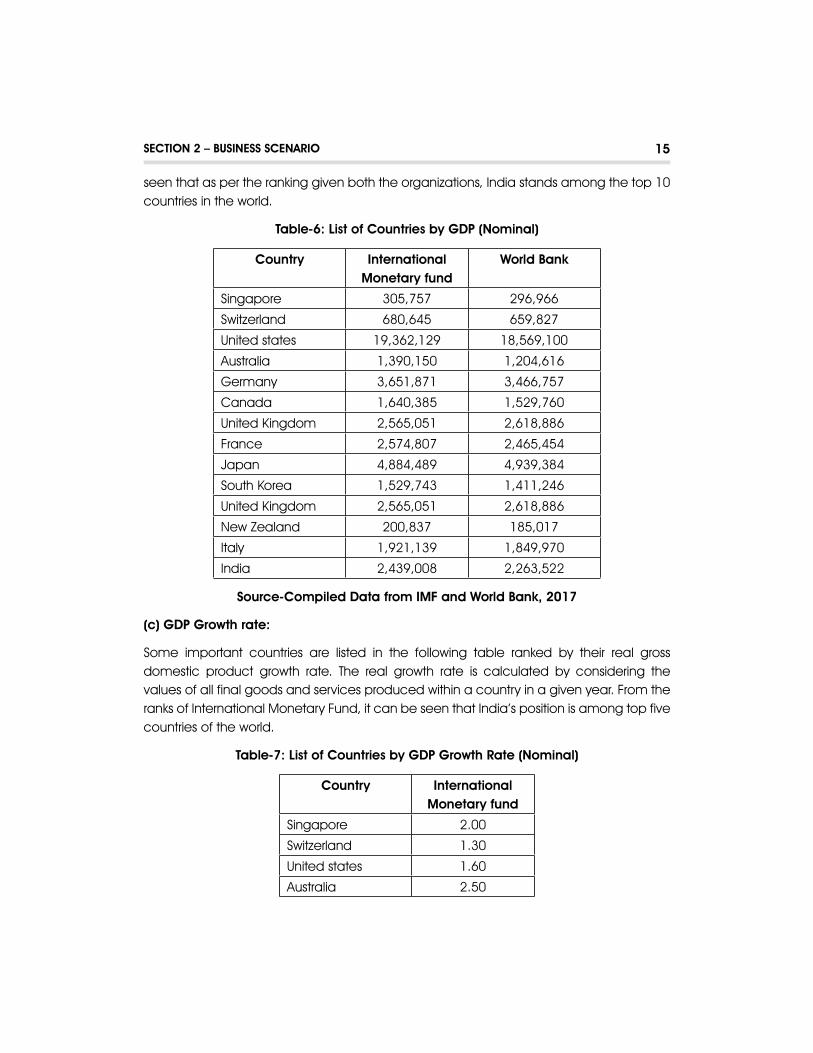
15
seen that as per the ranking given both the organizations, India stands among the top 10 countries in the world.
Table-6: List of Countries by GDP (Nominal)
Country International Monetary fund
World Bank
Singapore 305,757 296,966
Switzerland 680,645 659,827
United states 19,362,129 18,569,100
Australia 1,390,150 1,204,616
Germany 3,651,871 3,466,757
Canada 1,640,385 1,529,760
United Kingdom 2,565,051 2,618,886
France 2,574,807 2,465,454
Japan 4,884,489 4,939,384
South Korea 1,529,743 1,411,246
United Kingdom 2,565,051 2,618,886
New Zealand 200,837 185,017
Italy 1,921,139 1,849,970
India 2,439,008 2,263,522
Source-Compiled Data from IMF and World Bank, 2017
(c) GDP Growth rate:
Some important countries are listed in the following table ranked by their real gross domestic product growth rate. The real growth rate is calculated by considering the values of all final goods and services produced within a country in a given year. From the ranks of International Monetary Fund, it can be seen that India’s position is among top five countries of the world.
Table-7: List of Countries by GDP Growth Rate (Nominal)
Country International Monetary fund
Singapore 2.00
Switzerland 1.30
United states 1.60
Australia 2.50
SECTION 2 – BUSINESS SCENARIO
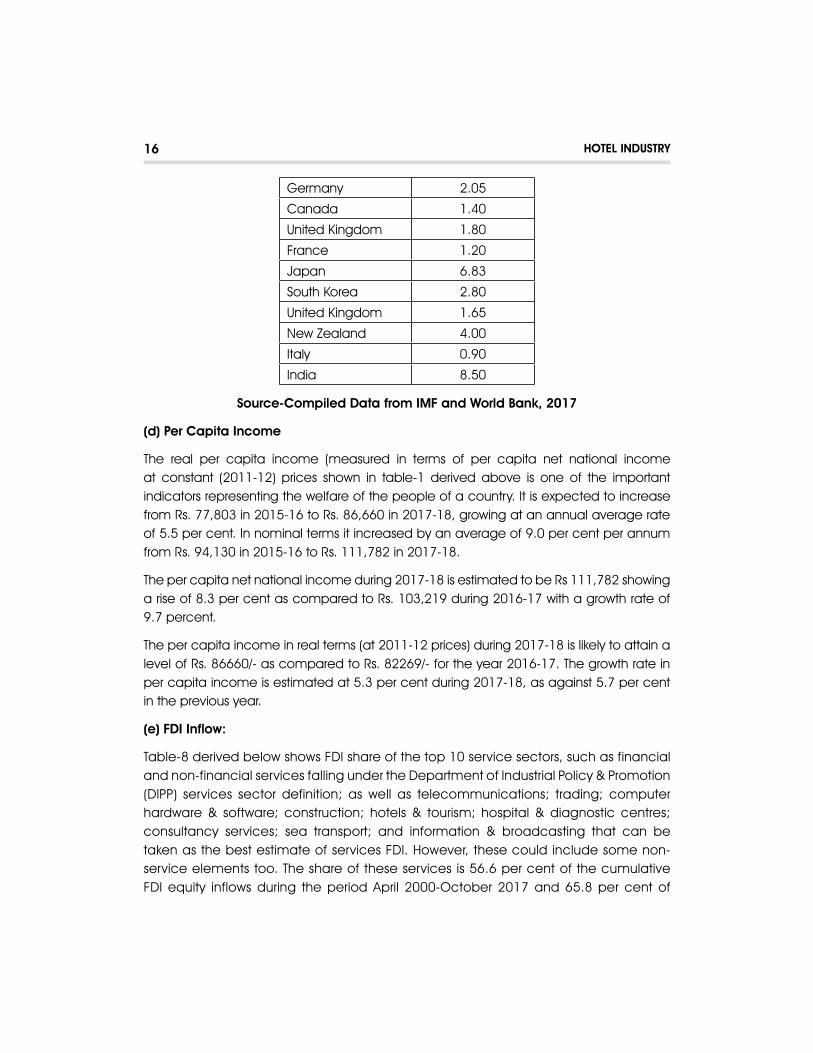
16 HOTEL INDUSTRY
Germany 2.05
Canada 1.40
United Kingdom 1.80
France 1.20
Japan 6.83
South Korea 2.80
United Kingdom 1.65
New Zealand 4.00
Italy 0.90
India 8.50
Source-Compiled Data from IMF and World Bank, 2017
(d) Per Capita Income
The real per capita income (measured in terms of per capita net national income at constant (2011-12) prices shown in table-1 derived above is one of the important indicators representing the welfare of the people of a country. It is expected to increase from Rs. 77,803 in 2015-16 to Rs. 86,660 in 2017-18, growing at an annual average rate of 5.5 per cent. In nominal terms it increased by an average of 9.0 per cent per annum from Rs. 94,130 in 2015-16 to Rs. 111,782 in 2017-18.
The per capita net national income during 2017-18 is estimated to be Rs 111,782 showing a rise of 8.3 per cent as compared to Rs. 103,219 during 2016-17 with a growth rate of 9.7 percent.
The per capita income in real terms (at 2011-12 prices) during 2017-18 is likely to attain a level of Rs. 86660/- as compared to Rs. 82269/- for the year 2016-17. The growth rate in per capita income is estimated at 5.3 per cent during 2017-18, as against 5.7 per cent in the previous year.
(e) FDI Inflow:
Table-8 derived below shows FDI share of the top 10 service sectors, such as financial and non-financial services falling under the Department of Industrial Policy & Promotion (DIPP) services sector definition; as well as telecommunications; trading; computer hardware & software; construction; hotels & tourism; hospital & diagnostic centres; consultancy services; sea transport; and information & broadcasting that can be taken as the best estimate of services FDI. However, these could include some non-service elements too. The share of these services is 56.6 per cent of the cumulative FDI equity inflows during the period April 2000-October 2017 and 65.8 per cent of

17
FDI equity inflows during 2017-18 (April-October). If the shares of another 5 services or service-related sectors like retail trading, agriculture services, education, book-printing and air transport are included, then the total share of FDI equity inflows to the services sector would increase to 58.5 per cent and 69.6 per cent respectively for the above two periods. In 2016-17, FDI equity inflows to the services sector (top 10 sectors including construction) declined by 0.9 per cent to US$ 26.4 billion, though the overall FDI equity inflows grew by 8.7 per cent. However, during 2017-18 (April-October), the FDI equity inflows to these services sector grew by 15.0 per cent, as compared to 0.8 per cent growth in total FDI equity inflows, mainly due to higher FDI in two sectors, i.e., Telecommunications and Computer Software and Hardware.
Table-8: FDI Equity Inflow to the Service Sector
Sector Value (in US$ Billion
Share in Total
%
Growth Rate (%)
2016-17
2017-18 (Apr – Oct)
Apr 2000
to Oct 2017
2016-17
2017-18
(Apr-Oct.)
1. Services Sector 8.7 3.4 17.6 26.0 -45.8
2. Construction 2.0 1.4 9.9 -57.5 22.0
3. Telecommunication 5.6 6.1 8.4 320.1 115.9
4. Computer Software and Hardware
3.7 3.3 7.8 -38.2 116.0
5. Trading 2.3 1.6 4.4 -39.2 -1.2
6. Hotel and Tourism 0.9 0.6 3.0 -31.3 -4.1
7. Information and broadcasting
1.5 0.5 2.0 -50.3 -48.9
8. Hospital and Diagnostic centre
0.7 0.6 1.4 0.7 6.9
9. Consultancy Services 0.3 0.4 1.1 -49.5 137.6
10. See Transport 0.7 0.6 0.9 71.2 71.1
Top 10 Services (1 to 10) 26.4 18.4 56.6 -0.9 15.0
Top 15 services 27.2 19.5 58.5 -1.7 17.5
Total FDI 43.5 28.0 100.0 8.7 0.8
Source: Compiled from Economic Survey, 2017-18
SECTION 2 – BUSINESS SCENARIO

18 HOTEL INDUSTRY
(f) Services Sector:
With a share of 55.2 per cent in India’s GVA, the services sector continued to be the key driver of India’s economic growth, and is expected to contribute almost 72.5 per cent of GVA growth in 2017-18. While the growth of this sector in 2017-18 is expected to be at 8.3 per cent, the growth in services exports and net services were robust at 16.2 per cent and 14.6 per cent respectively in 2017-18. Out of the 32 States and Union Territories (UTs) for which data are released for new base (2011-12 series) by CSO, the services sector is the dominant sector contributing to more than half of the gross state value added (GSVA) in 15 states and UTs. Among these 32 states and UTs, Delhi and Chandigarh are at the top with over 80 per cent and Sikkim is at the bottom with 31.7 per cent in terms of services sector GVA share. In 2016-17, FDI equity inflows to the services sector (top 10 sectors including construction) declined by 0.9 per cent to US$ 26.4 billion, though overall FDI equity inflows grew by 8.7 per cent. However, during 2017-18 (April to October), the FDI equity inflows to these sectors grew by 15.0 per cent, as compared to 0.8 per cent growth in total FDI equity inflows, mainly due to higher FDI in two sectors, i.e., telecommunications, and computer software and hardware. India remained the eighth largest exporter of commercial services in the world in 2016 (WTO, 2017) with a share of 3.4 per cent, which is double the share of India’s merchandise exports in the world. India’s services export growth returned to positive territory with 5.7 per cent growth in 2016-17 from growth of (-) 2.4 per cent in 2015-16. Services exports recorded a robust growth of 16.2 per cent during April-September 2017, with turnaround observed in some major sectors like travel and software services. India’s service sector imports also exhibited a much higher growth of 17.4 per cent in April-September 2017. Net services receipts rose by 14.6 per cent during April-September of 2017-18 as compared with 2016-17. Net surplus in services financed about 49 per cent of India’s merchandise trade deficit in 2017-18 and cushioned the current account deficit.
In India, the tourism sector has been performing robustly with Foreign Tourist Arrivals (FTAs) growing to 8.8 million in 2016. Foreign Exchange Earnings (FEEs) from tourism grew at 8.8 per cent to US$ 22.9 billion in 2016. As per the provisional data of Ministry of Tourism, FTAs during 2017 were 10.2 million with a growth of 15.6 per cent, while the FEEs from tourism were US$ 27.7 billion with a growth of 20.8 per cent over 2016. Outbound tourism has also picked up in recent years, with the number of departures of Indian nationals from India growing by 7.3 per cent to 21.9 million during 2016 from 20.4 million in 2015. This is more than double of the foreign tourists’ arrivals in India. Domestic tourist visits grew by 12.7 per cent to 1,614 million in 2016 from 1,432 million in 2015. The detailed contribution of Indian hospitality Industry to the services sector is derived in the table-9 given below.

19
Table-9: Share and Growth of India’s Hospitality Industry in Services Sector(GVA at basic prices)
Sector Share (%)
Growth (%)
2015-16
2015-16
2016-17
2017-18
Total Services 52.9 9.7 7.7 8.3
Trade, repair, hotels and restaurants 11.4 11.2 7.7 8.7
(a) Trade and repair services 10.4 10.9 -- --
(b) Hotels and restaurants 10.0 14.4 -- --
Transport, storage, communication & services related to broadcasting
7.0 9.3 -- --
(a) Railways 0.8 7.0 -- --
(b) Road transport 3.2 6.7 -- --
(c) Air transport 0.2 16.8 -- --
Financial Services 5.8 6.8 5.7 7.3
Real Estate, ownership of dwelling & professional services
15.3 12.5 -- --
Public administration and defence and others
13.4 6.9 11.3 9.4
Construction 8.1 5.0 1.7 3.6
Total Services 71.0 9.1 6.9 7.7
Source: Compiled from Various studies.
2.3 NATURE:
There has been a continued change in the revenue composition over the past few years. Although ARRs saw a marginal increase, the trend of declining revenues from the Rooms division continued in 2013-14, falling from 52.2% in 2012-13 to 51.3% in 2013-14. The contribution of Food and Beverage (F&B) revenue, on the other hand, has increased marginally from 41.2% in 2012-13 to 41.9% in 2013-14 with rising contribution from Banquets and Conferences. Additionally, Other revenue that includes laundry, gift shop, business centre, health club and rentals also saw a slight growth from 6.6% in 2012-13 to 6.9% in 2013-14. The survey reveals that energy expenses on an All-India PAR basis have increased by 13.2% in 2013-14 as compared to that in the previous year. Over the past
SECTION 2 – BUSINESS SCENARIO
20 HOTEL INDUSTRY
five years, the energy cost on a PAR basis has grown at a CAGR of 10.5%. High energy costs are a major concern especially in cities such as Chennai and Pune where they are a major factor in declining profitability of hotels. This year’s survey reveals that amongst the use of various technological applications, the use of Energy Management Systems (EMS) has witnessed the highest increase on an All-India level, both in sourcing the energy (renewable sources like solar) and water (tapping rainwater and using treated grey water). The average number of employees per hotel has increased marginally from 95.1 in 2012-13 to 95.8 in 2013-14. However, it is interesting to note that the increase has been at the managerial and supervisory level. In fact, according to the survey results, the increase in the number of employees at the supervisory and managerial levels has been growing at a CAGR of 4.7% over the past five years, whereas the number of staff level employees per hotel has increased at only 1.7%. The use of technology and increasing dependence on online reservation systems is a fast emerging trend amongst hotels across the country. Hotels are focusing more on online travel agents and third-party websites for advance reservations due to the scale and reach of these channels. The use of property level technology such as Intranet and Local Area Network (LAN), Yield Management Systems, Property Management Systems, and Electronic Keycards is also increasing across hotel segments. The use of cash as a payment method has been on a declining the past few years. In 2013-14, the percentage of guests using cash as a payment method was 36.1% as compared to 43.2% in 2009-10. This trend is in line with the countrywide trend of cash-free transactions and increased usage of credit cards and electronic fund transfer, which have become a norm across industries such as retail.
2.4 TYPES OF HOTEL INDUSTRY
The hotel industry is a mature industry marked by intense competition. Market share increases typically come at the competitor‘s expense. Industry wide, most growth occurs in the international, rather than in the domestic, arena.
Commonly, hotel industries are classified as:
Ø Commercial Hotels – These cater mainly to business clients and usually offer room service, coffee-shop, dining room, cocktail lounge, laundry and valet service as well as access to computers and fax services.
Ø Airport Hotels – There are conveniently located near airports to provide any level of service from just a clean room to room service; sometimes provide bus or limousine service to the air lines as well.
Ø Conference Centers – There are designed to specifically provide meeting space for groups; they provide all services and necessary equipments required to handle conventions.

21
Ø Economy Hotels- These hotels provide a limited service and are known for clean rooms at low prices meeting just the basic needs of travelers.
Ø Suite or All-Suite Hotels- These are hotels which offer spacious layout and design. Business people like the setting which provides space to work and entertain people separate from the bedroom.
Ø Residential Hotels- They are very popular. The typical residential hotel offers long-term accommodations.
Ø Casino Hotels- There are often quite luxurious. Their main purpose is to support the gambling operations. Casino hotels often offer top name entertainment and excellent restaurants.
Ø Resort Hotels – These are the planned destination of guests, usually vacationers. These beaches resorts are located at the or in the mountains away from main cities. Resort hotels may offer any form of entertainment to keep their guests happy and busy.
Few popular categories of Indian hotels are:
Ø Restaurants- A restaurant is a business which prepares and serves food and drinks to customers in exchange for money, either paid before the meal, after the meal, or with an open account. Traditionally, Indians tended to eat at home and eat Indian cuisine. Those who ate outside the home often ate street foods from the enormous number of street stalls and informal eateries that are a common sight across the streets. Eating in a restaurant was reserved for special occasions. However, India appears to be in the early stages of a significant transformation in the restaurant sector. Indian consumers are eating out more frequently and younger generation has shed the bias of their elders against international franchises and foreign foods. With only an estimated 100,000 modern organized restaurants (20 or more seats, waiting staff, menus) in India, there is plenty of room for growth in the industry. It is estimated that Indians spend 8 to 10 percent of their food expenditure outside the home in restaurants, cafeterias and other food establishments As per the 2013 India Food Service report published by the National Restaurant Association of India, the restaurant sector is valued at $48 billion and is expected to grow to $78 billion in the next five years. In terms of market segments, Quick Service Restaurants (QSR) and Casual Dine in formats account for 74 percent of the total market, while Cafés make up 12 percent, and Fine Dining Pub Bars Clubs& Lounges (PBCL) comprise the rest After struggling with supply chain issues for many years, major franchises have developed a handful of suppliers in India who can meet quality requirements, placing existing restaurants in a better position to expand and ease the way for new
SECTION 2 – BUSINESS SCENARIO

22 HOTEL INDUSTRY
restaurants seeking to enter the market. While the number of casual dining, fast food restaurants and coffee shops is growing, high tariffs and other trade restrictions tend to limit the use of imported food products on restaurant menus. Imports are typically limited to specialty ingredients that are not available in India.
The level of competition within the restaurant industry is unprecedented. Success in this environment requires brands to focus on a number of strategic imperatives that will define the industry in 2018 and beyond:
ü Embrace the experience: In today’s competitive restaurant marketplace, successful brands need to do much more than offer good food at a reasonable price. They need to deliver a differentiated customer experience along with their meals. But differentiation is not so simple. It requires restaurants to execute on all dimensions of the customer experience: value, menu, quality, and the right managers and employees to tie it all together.
ü Drive employee engagement: Many winning brands are discovering that strategic employee engagement programmes are the foundation for redefining and transforming the customer experience, driving brand loyalty, and growing their market share. Engaged and motivated employees are at the heart of positive restaurant experiences – from how customers are greeted when they walk through the door, pick up a take-out order, or get home delivery, to how quickly and well their food is prepared and served. According to our recent customer experience survey, a staff of friendly, hospitable employees was cited as the most important element needed for a positive experience at a restaurant.
ü Dominate delivery: A swell of food delivery apps have permanently changed consumers’ expectations of when and how they get their food. For some brands, the shift to third-party digital distribution can translate to massive exposure and order volume. For others, it represents a missed opportunity to engage directly with their customers, understand their preferences, and build better relationships not to mention lost revenue.
ü Compete with non-traditional players: The days of high volume foot traffic at overcrowded mall food courts are mostly over. A rising penchant for unique food experiences, authentic local menus, and convenience are drawing customers away from traditional brick-and-mortar locations as they explore alternatives such as pop-up food kitchens, food trucks, restaurants in premium grocery stores, subscription-based meal kits, and even privately hosted meals enabled by the sharing economy. Traditional players should consider the risks of sticking with traditional strategies.

23
ü Operational excellence and compliance: Many restaurants are realizing the pressing need to augment store operations through better technology enablement, which reinforces operational excellence and enhances team member capabilities. Benefits include increased store performance, enhanced “on-brand” guest experience, and stricter adherence to regulatory requirements.
Ø The restaurant industry should anticipate the level of competition and innovation to rise throughout 2018 as Wall Street continues to get more aggressive in the sector. Private equity players and the broader investment community are no longer keeping it safe with larger restaurant brands with proven track records. They are increasingly paying attention to smaller restaurant players with bold, innovative ideas around menu, technology, and supply chain. Deep pockets are hunting for innovation and opportunity. This collision of capital investment and new ideas will continue to drive unprecedented disruption throughout the industry.
Ø Café/Bars- Cafés/bars in India are driven by many factors, such as favourable demographics, rising income levels, the development of mid-sized cities and the advent of international chains. A growing willingness, especially among the youth, to consume food and drink outside the home and increasing disposable incomes are helping to fuel further growth. Cafés/bars are considered as perfect places to socialize and hangout; hence, sales in this category are mainly driven by the younger generation. The population segment aged 15 to 34 is the target demographic that visits cafés/bars frequently. Young people also prefer to drink on-site rather than take products away. Chained cafe culture is also growing in India. They are likely to expand their numbers of outlets and also extend their reach to medium- and small-sized cities. These expansion plans would allow café chains to leverage on the growing influence of the coffee culture in India. Chained cafés, especially those in cities, are expected to provide value for money food items on their menus to induce new consumers into trying their products. Premium outlets are expected to spring up in major cities to tap into consumers who are wishing to upgrade. Rising disposable incomes, a greater population of younger people, growth of consumers in smaller towns and widening exposure to a drinking and pub culture has propelled the growth of bars and pubs, as well. This growth was driven by an increasing number of Indian consumers partaking in alcoholic drinks. Bars and pubs make a major proportion of from money from drinks. Brew pubs featuring craft products are a new concept that is appearing in different parts of the country and slowly gaining popularity among beer drinkers.
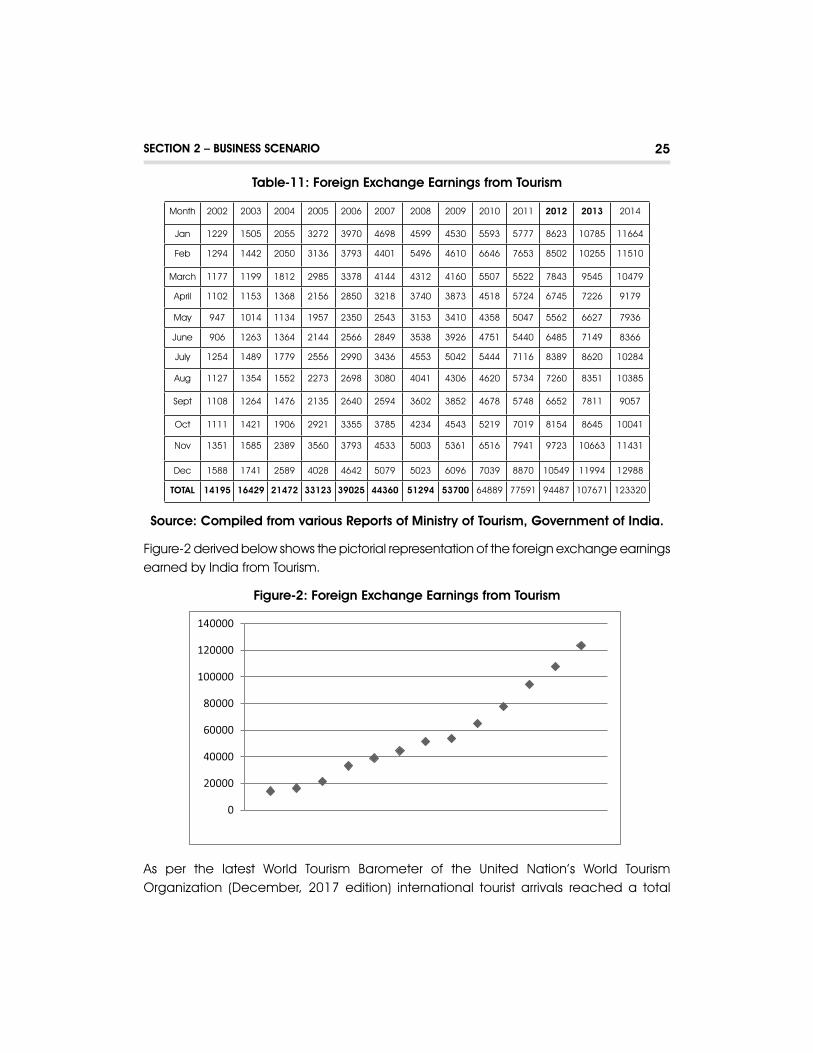
Table-10 derived below shows the figures of foreign tourist arrivals to India 2004 to 2016 from top 15 sources. Whereas table-11 highlights foreign exchange earned by India over the last few years due to tourism activities.
SECTION 2 – BUSINESS SCENARIO

24 HOTEL INDUSTRYTa
ble
-10:
Fo
reig
n To
uris
t A
rriv
als
in In
dia
fro
m T
op
15
Sour
ce
Co
untr
ies
Na
me
of
Co
untr
ies
2004
2005
2006
2007
2008
2009
2010
2011
2012
2013
2014
2015
2016
USA
5261
2061
1165
6967
3979
9062
8049
3382
7140
9312
9298
0688
1039
947
1085
309
1118
983
1213
624
1296
939
UK
5559
0765
1803
7342
4079
6191
7765
3076
9251
7594
9479
8249
7881
7080
9444
9425
6286
7601
9418
83
Bang
lad
esh
4774
4645
6371
4844
0148
0240
5418
8446
8899
4319
6246
3543
4873
9752
4923
8388
6011
3387
913
8040
9
Sril
ank
a
1287
1113
6400
1548
1320
4084
2188
0523
9995
2665
1530
5853
2969
8326
2345
3016
0129
9513
2974
18
Ca
nad
a
1358
8415
7643
1765
6720
8214
2223
6422
4069
2423
7225
9017
2560
2125
5222
2684
8528
4306
3172
39
Fra
nce
13
1824
1522
5817
5345
2048
2720
7802
1964
6222
5232
2314
2324
0674
2483
7924
6101
2308
5423
8707
Ge
rma
ny11
6679
1202
4315
6808
1841
9520
4344
1916
1622
7720
2402
3525
4783
2520
0326
2026
2431
426
5928
Jap
an
9685
110
3082
1192
9214
5538
1453
5212
4756
1680
1919
3525
2200
1522
0283
2391
0620
7413
2513
13
Aus
tralia
8160
896
258
1098
6713
5925
1462
0914
9074
1696
4719
2592
2021
0521
8967
2195
1626
3101
2936
25
Ma
lays
ia84
390
9627
610
7286
1127
4111
5794
1353
4317
9077
2081
9619
5853
2426
4923
9762
2729
4130
1961
Sing
ap
ore
6071
068
666
8257
492
908
9785
195
328
1074
8711
9022
1314
5214
3025
1507
3115
2238
1636
88
Chi
na (M
ain
)34
100
4489
7 62
330
8810
398
093
1002
0911
9530
1422
1816
8952
1747
1218
1020
2063
2225
1313
Russ
ia47
077
5644
662
203
7554
3 91
095
9494
512
2048
1443
1217
7526
2591
2026
9832
1724
1922
7749
Italy
6556
167
642
7997
893
540
8576
677
873
9410
0
1008
89
9874
3
9395
1
9158
988
091
9541
7
Kore
a (S
out
h)47
835
4989
570
407
8458
382
335
7048
5 95
587
1086
8010
9469
1126
19
1068
70
1029
9311
1076
Tha
iland
3344
2 41
978
4662
3 50
037
5806
5 67
309
76
617
92
404
1051
41
1171
3612
1362
1158
6011
9663
Ne
pa
l53
207
7702
491
552
8303
778
133
(1)
8878
510
4374
1191
3112
5375
1137
9012
6416
1547
2016
1097
Tota
l34
5669
839
1861
044
4716
750
8150
452
8260
351
6769
957
7569
263
0922
265
7774
569
6760
176
7909
957
9018
967
1542
5
Sour
ce
: C
om
pile
d fr
om
va
rious
Re
po
rts
of M
inis
try
of T
our
ism
, Go
vern
me
nt o
f Ind
ia.
25
Table-11: Foreign Exchange Earnings from Tourism
Month 2002 2003 2004 2005 2006 2007 2008 2009 2010 2011 2012 2013 2014
Jan 1229 1505 2055 3272 3970 4698 4599 4530 5593 5777 8623 10785 11664
Feb 1294 1442 2050 3136 3793 4401 5496 4610 6646 7653 8502 10255 11510
March 1177 1199 1812 2985 3378 4144 4312 4160 5507 5522 7843 9545 10479
April 1102 1153 1368 2156 2850 3218 3740 3873 4518 5724 6745 7226 9179
May 947 1014 1134 1957 2350 2543 3153 3410 4358 5047 5562 6627 7936
June 906 1263 1364 2144 2566 2849 3538 3926 4751 5440 6485 7149 8366
July 1254 1489 1779 2556 2990 3436 4553 5042 5444 7116 8389 8620 10284
Aug 1127 1354 1552 2273 2698 3080 4041 4306 4620 5734 7260 8351 10385
Sept 1108 1264 1476 2135 2640 2594 3602 3852 4678 5748 6652 7811 9057
Oct 1111 1421 1906 2921 3355 3785 4234 4543 5219 7019 8154 8645 10041
Nov 1351 1585 2389 3560 3793 4533 5003 5361 6516 7941 9723 10663 11431
Dec 1588 1741 2589 4028 4642 5079 5023 6096 7039 8870 10549 11994 12988
TOTAL 14195 16429 21472 33123 39025 44360 51294 53700 64889 77591 94487 107671 123320
Source: Compiled from various Reports of Ministry of Tourism, Government of India.
Figure-2 derived below shows the pictorial representation of the foreign exchange earnings earned by India from Tourism.
Figure-2: Foreign Exchange Earnings from Tourism
As per the latest World Tourism Barometer of the United Nation’s World Tourism Organization (December, 2017 edition) international tourist arrivals reached a total
SECTION 2 – BUSINESS SCENARIO

26 HOTEL INDUSTRY
of 1.2 billion in 2016, 46 million more than in the previous year, though the growth rate of 3.9 per cent was lower than in 2015 (4.6 per cent). In India, the Tourism sector has been performing well with Foreign Tourist Arrivals (FTAs) growing at 9.7 per cent to 8.8 million and Foreign Exchange Earnings (FEEs) at 8.8 per cent to US$ 22.9 billion in 2016. As per the provisional data of Ministry of Tourism, FTAs during 2017 were 10.2 million, with a growth of 15.6 per cent, while, the FEEs from tourism were US$ 27.7 billion, with a growth of 20.8 per cent over 2016.
Outbound tourism has also picked up in recent years, with the number of departures of Indian nationals from India growing at 7.3 per cent during 2016 to 21.9 million from 20.4 million, in 2015. This is more than double the foreign tourist arrivals in India. Domestic tourist visits grew by 12.7 per cent to 1,614 million in 2016 from 1,432 million in 2015. In terms of number of domestic tourist visits, Tamil Nadu, Uttar Pradesh, Andhra Pradesh, Madhya Pradesh, and Karnataka were the top 5 destination States, accounting for 61.3 per cent of total number of tourist visits in 2016. Amongst centrally protected ticketed monuments, for domestic visitors, Taj Mahal was the most visited monument in 2016 followed by Qutub Minar and Red Fort, while for foreign visitors Taj Mahal was the most visited monument, followed by Agra Fort and Qutub Minar.
Table-12: Growth in Net Sales of selected Services: Company-Based
Services Net Sales
2015-16 2016-17 2017-18*
Transport Logistics 1.0 7.3 5.8
Shipping -1.6 -18.7 4.75
Aviation 6.7 9.1 15.65
Retail Trading 23.0 19.5 17.0
Health services 15.4 12.8 10.65
Hotel and Restaurant 8.1 2.7 1.1
ITES 17.8 9.5 2.95
Software 11.2 7.2 3.85
Construction & Real Estate 7.6 -1.9 1.9
Source- Compiled from Economic Survey, 2017-18, * Average of Q1+Q2

27
Graph-2 derived below shows figures of room availability in major Indian cities and estimated rooms availability by the year 2021-22 as predicted by HVS research.
Source: HVS Research.
Business Transactions
A robust business management strategy is of the utmost importance for helping one to optimize business results. Following are a few business strategies which are commonly needed while involving oneself in this sector.
• Market Knowledge
In order to implement a successful revenue management strategy, one must clearly understand his/her market which includes analysis on where demand comes from and various different local factors that might affect seasonal demands, nature of customers visiting to that place, competition that exists within the market, marketing strategies that the competitors are implementing and so on.
For instance, many business customers enjoy a hotel that has close proximity to the airport. Some may prefer viewing natural sights, etc.
• Segmentation and Price Optimization
Selling the right room to the right person at the right price is most important. This requires adequate analysis on consumer segments. This, in turn, may help to generate customer loyalty from those who appreciate the price consistency.
For example, some guests may prefer a ground floor room, later breakfast, or 24-hour gym access. Providing these choices will make the guest feel like they’ve had a more personalized stay.
SECTION 2 – BUSINESS SCENARIO

28 HOTEL INDUSTRY
• Proper Coordination between the Departments
It is important to maintain close coordination between the various departments of the hotel in order to ensure direction proper.
• Forecasting Strategies
Forecasting helps to anticipate future demand and revenue by enabling necessary adjustments to be made whenever required. Within the hospitality industry, high-quality forecasting relies on upkeep of accurate records, including occupancy, room rates and revenue.
• Proper Branding of the USP
One of the most important requirements is to brand the USP in a fruitful way. The branding strategy mostly depends on the nature of customers.
Corporate Actions
One of the recent mergers in the industry is the Louvre Hotels Group, the second largest in the hospitality industry in Europe, bought a majority stake in Sarovar Hotels in India this January, beating Wyndham Hotel Group in the race. The deal, estimated at $50 million (Rs. 336 crore), makes the combined entity one of the biggest hotel chains in India in terms of number of properties.
The basic activities involved in the corporate actions are:
§ Corporate and entity level transactions
§ Buy and sell side M&A advisory
§ Cross-border expansion including portfolios
§ Capital sourcing
§ Joint ventures
§ Company valuations
§ Business restructuring

SECTION-3
LEGAL FRAMEWORK
3.1 INDUSTRY TYPE
Hotel Industry is an integral part of services Industry. This industry goes hand in hand with a few other important related industries, like tourism industry, food processing, aviation and road transportation, entertainment industry.
3.2 APPLICABLE LAWS
General Laws
The majority of the legislations governing the hospitality and hotels industry can be divided into three main sectors.
• The first head is the legislation for the construction and commissioning of hotels, restaurants, guest houses and other establishments, and it includes the Foreign Exchange Management Act, the industrial licensing policies, land laws and various development control orders issued by the Central and state governments.
• The second head has legislation for the operation, maintenance and management of establishments, food and hygiene standards. It also includes insurance laws, fire safety, and weights and measures regulation. Further, various licenses, such as liquor license, dance license, lodging-house license, eating-house license, police permissions, a license under the Shops and Establishment Act, or a license under the Food and Drug Administration Act granted on an annual basis.
• The third head has rules regarding taxation, employment and other contractual relationships. This includes laws on income tax, service tax, expenditure tax, excise duty, luxury tax, entertainment tax, as well as laws on employment matters like Apprentice Act, ESI Act, etc.
Licenses Required
Following are a few important licenses required for the hotel industry as specified under various acts.
29

30 HOTEL INDUSTRY
• Police License / Registration.
• License under Shops & Establishments Act.
• License under Prevention of Food Adulteration Act.
• Registration under the Luxury Tax Act.
• Registration under the Sales Tax Act.
• Registration under the Contract Labour Act.
• Registration under the Pollution Control Act.
• Registration under the Apprentices Act.
• Registration under the Provident Fund Act.
• Registration under the ESI Act.
• Entertainment License on Festival Occasions
• License for Chimney under the Smoke Nuisance Act.
• Registration under the Weights & Measures Act.
• Factory License for Laundry.
• Central Excise License for Bakery Products.
• Registration & Permits under the Motor Vehicle Act for Tourist Coaches / Taxies.
• Eating House License.
• Municipal Beer Bar License.
• License for storage of Diesel Oil.
• License for storage of Kerosene & Compressed Gas (LPG).
• Sign Board Directions, Neon Signs.
• License to deal in Foreign Exchange under FEMA.
• Cold Storage License, (if over 25 cubic ft.).
• License for Boiler & Generators and Mixers and Grinders.
• Bar License (Foreign Liquor).
• Mild Liquor License.
• Temporary License for Awnings & covering of Terrace during monsoon.
• Building Completion Certificate.

31
• Copy Right License for Playing of Music.
• Lodging House License
• Approval from the Department of Tourism, Government of India.
• Registration from GTDC for new projects under the Package Scheme of Incentives.
Specific Acts Applicable
Prevention of Food Adulteration Act
It is a Central Government Act and its main purposes are to:
• protect the public from poisonous and harmful foods;
• prevent the sale of substandard foods;
• protect the interests of the consumers by eliminating fraudulent practices.
Food Safety and Standards Act, 2006
The Act deals with the following:
• Establishment of the Food Safety and Standards Authority of India, which lays down scientific standards relating to articles of food;
• Regulates the manufacture, storage, distribution, sale and import of food articles; and
• Ensures the availability of safe and wholesome food for human consumption and for matters connected therewith or incidental thereto.
The Legal Metrology Act
This Act is a Central Government Act enacted to establish and enforce standards of weights and measures, regulate trade and commerce in weights, measures and other goods which are sold or distributed according to weight, measure or number.
The Apprentices Act
This Act has been enacted to provide to regulate and control of training of the apprentices and for matters connected therewith. It is a Central Government Legislation
The Air (Prevention and Control of Pollution) Act, 1981
This Act as a Central Government Legislation has been enacted to provide for the prevention, control and abatement of air pollution, for the establishment, with a view to carrying out the aforesaid purposes of Boards, for conferring on and assigning to such
SECTION 3 – LEGAL FRAMEWORK
32 HOTEL INDUSTRY
Boards, the powers and functions relating thereto and for matters connected therewith.
The Water (Prevention and Control of Pollution) Act, 1974
As a Central Government Legislation, this Act has been enacted to provide for the prevention and control of water pollution and for maintaining or restoring of wholesomeness of water for the establishment, with a view to carrying out the purposes aforesaid of Boards for the prevention and control of water pollution, for conferring on and assigning to such Boards, the powers and functions relating thereto and for matters connected therewith.
Hotel Insurance Policies
Hotel insurance is specifically designed to meet the growing requirements of the hotel industry. Some purposes of the act includes
• Customized hotel insurance can be arranged to cover all types of establishments. Be it spas, ranches, guest houses, bed and breakfasts (B and Bs) or apartments, hotel insurance caters to every kind of establishment.
• A standard hotel insurance policy includes protection against perils, such as builder’s risk, fire and accidental damage, and natural calamities. Other types of coverage, such as liquor liability are also a part of the policy’s casualty portion.
Goods and Services Tax
The GST slab on hotel room tariffs that widens the slab of 18 per cent to tariffs ranging between Rs 2,500 and Rs 7,500. With the revision, the highest tax rate of 28 per cent is assigned to tariffs of Rs 7,500 and above. The slabs for room tariffs, the tax rate for air-conditioned restaurants, including restaurants in five-star hotels will have GST at 18 per cent, effective from July 1, 2017. Hotels and lodges with a tariff below Rs 1,000 a day are exempted from GST, while those with a room rate of Rs 1,000-2,500 are taxed at 12%, those with a tariff of Rs 2,500-7,500 will attract 18% tax and those above Rs 7,500 will be taxed at 28%. Earlier, threshold for the 28% slab was at room tariffs of Rs 5,000, but later it was revised to Rs 7,500 by the GST Council.
Income Tax Act, 1961
It is tax on income imposed by Central Government. Residents in India are taxed on their worldwide income. Non- residents are taxed on their Indian sources of income.
Value Added Tax (VAT)
Before GST, Sales tax / VAT is levied by states on the sale of goods within its territory. VAT is levied on value added at each stage in the production and distribution process of goods

33
and services. All hotels that exceed the annual registration threshold have to be registered for VAT. VAT is levied on hotel bills pertaining to lodging, food, telephone, tours, etc. After the implementation of VAT, hotel tax was abolished and therefore hotels do not have to be registered for hotel tax anymore. The rates of VAT differ from state to state. The general rate of VAT applicable on food and beverages in a restaurant is 14.5 %.
CENVAT
Before GST, Duty imposed by Central Government on manufacture of goods, CENVAT is imposed at 12 % with lower rates applicable in certain cases. Food preparations containing fruits and vegetables falling under Chapter 20, which are prepared and served in a hotel, restaurant or retail outlet, whether or not such food is consumed in such hotel, restaurant or retail outlet is being fully exempted from basic excise duty with exception of the Bakery and Confectionery items.
Service Tax
Before GST, under the recent service tax regime, all services are taxable unless exempt. General rate of service tax is 12.36 % (Including EC and SHEC). Service tax on hotel accommodation is payable at 7.42 %. Service tax on food and beverages is chargeable at 4.94 % in restaurants with air-conditioning. Food served in hotel rooms from their air-conditioned restaurants with liquor license will not attract service tax.
Luxury Tax
Under the current tax regime, every state has their individual Luxury Tax Acts. Though previously it covered more categories of assessees, at present it covers only the hotels as a taxable assessee. The tax is levied on luxuries provided in hotels, lodging houses, clubs and inns, etc., including residential accommodation but it does not include the supply of food, drinks or other services which are separately charged for under Service Tax or other taxes.
Expenditure Tax
Expenditure tax, a tax collected by Central Government in India is regulated by the Expenditure Tax Act, 1987. This Act shall apply in relation to any chargeable expenditure incurred in a hotel wherein the room charges for any unit of residential accommodation at the time of incurring of such expenditure or incurred in a restaurant are one thousand two hundred rupees or more per day per individual and where (a) a composite charge is payable in respect of such unit and food, the room charges included therein shall be determined in the prescribed manner; (b) (i) a composite charge is payable in respect of such unit, food, drinks and other services, or any of them, and the case is not covered by the provisions of sub-clause (a), or (ii) it appears to the Assessing Officer that the charges
SECTION 3 – LEGAL FRAMEWORK
34 HOTEL INDUSTRY
for such unit, food, drinks or other services are so arranged that the room charges are understated and the other charges are overstated; and (2) incurred in a restaurant.
3.3 STATE ACTS
The State specific Shops and Establishments statutes
These legislations have been enacted to provide statutory obligation and rights to employees and employers in the unorganized sector of employment, i.e., shops and establishments.
• It is applicable to all persons employed in an establishment with or without wages, except the members of the employer’s family.
• It is a state legislation and each state has framed its own rules for the Act. The State Government can exempt, either permanently or for a specified period, any establishments from all or any provisions of this Act.
• The Act provides for compulsory registration of shop/ establishment within 30 days of commencement of work and all communications of closure of an establishment within 15 days from its closing.
• It also lays down the hours of work per day and week as well as the guidelines for spread-over, rest interval, opening and closing hours, closed days, national and religious holidays, overtime work, etc.
Entertainment/Amusement Tax
In India, entertainment tax is levied on every financial transaction that is related to entertainment such as movie tickets, major commercial shows and big private festivals. Entertainment means any exhibition, performance, amusement, game, sport or race, (including horse race) and cinematographic exhibitions. As per the Indian Constitution, entertainment is included in List 2. This revenue is reserved primarily for the state governments.
Following are some other forms of entertainment that are included in the purview of entertainment taxes: amusement parks, video games, arcades, exhibitions, celebrity stage shows, sports activities, bowling alleys and billiards/pool joints.
In India, state governments are primarily responsible for collecting the entertainment taxes. However, the union government can also collect these taxes on the basis of the type of transaction.
The basic financial principle, which separates the entertainment taxes to be collected
35
by the union government and ones under the jurisdiction of the State Government is mentioned in the Article 246 of the Indian Constitution.
Regulatory Agencies
The hotel industry is governed by few regulatory agencies. The brief functions of the agencies are:
The Hotel and Restaurant Approval and Classification Committee (HRACC)
It inspects and assesses establishments based on the facilities and services offered. The Department of Tourism grants star status based on how well the establishment scores in the HRACC report: 90 % = five-star deluxe; 80 % = five star; 75 % = four star; 65 % = three star; 55 % = two star; and 50 % = one star.
The Department of Tourism
The department of tourism acts as a nodal agency in the operations of the hotel industry. Some important functions are:
• Approval of Hotels at Project Stage and Classification & Reclassification of Hotels.
• Guidelines for Classification of Heritage Hotels.
• Time Share Resorts (TSR).
• Stand Alone Restaurants.
• Guidelines for apartment hotels.
• Guidelines for approval of Guest Houses.
• Hospitality Development and Promotion Board.
• Implementing a transparent system for the effective monitoring of hotel projects.
• Ensuring timely accrual of approvals / clearances / NOCs by the multiple agencies and facilitate the implementation of hotel projects.
• Expeditious clearances will enable completion of hotel projects in time leading to enhancement of room availability for the tourists.
SECTION 3 – LEGAL FRAMEWORK

SECTION-4
CONTRIBUTION OF COMPANY SECRETARY
4.1 INTRODUCTION
In the light of economic developments in recent years stakeholders of companies, particularly in the services sector, are increasingly concerned with the conduct of the affairs of the company and therefore it is essential that best practice is adhered to at all times and evidence is available to demonstrate the same. The requirement for higher standards in Tourism Industry can be further evidenced by the introduction of the Ministry of Tourism and other Global regulatory bodies a series of corporate governance codes including fitness and probity standards for certain pre-approval controlled functions or persons who perform controlled functions. Controlled functions include “ensuring, controlling or monitoring compliance by a regulated service provider with its relevant obligations”. Therefore the Company Secretaries in employment role may be presented as per the following diagram:
Fig-3: Role of a Company Secretary
While the monitoring of compliance in the services sector has traditionally been outsourced with the introduction of these new standards there is more caution in the provision of such
36

37
services which are more likely in the future to be laid at the feet of the company secretary. It is true to say that the role of the company secretary also includes keeping the Board informed of new legislation and how it applies to them. With this increased focus on corporate governance, the role of the company secretary has been extended such that the secretary is now seen as the guardian of the company’s compliance with legislative requirements and best practices.
As far as hospitality industry and particularly hotel Industry is concerned a Company Secretary primarily has to perform the following role:
Governance and Regulatory Compliance:
• Review all corporate governance arrangements or developments which might impact the Board.
• Ensure that the Board is fully briefed on all governance matters.
• Provide advice and guidance to the Board on all matters of governance, statutory requirements, laws, regulations risk, compliance, duties and responsibilities.
• Monitor changes in relevant legislation and advise the Board
• Ensure that board and management remains compliant with applicable standards of corporate governance and has the necessary infrastructure to support the governance rationale and governance framework.
• Develop and oversee the systems that ensure, the company complies with all applicable codes, in addition to its legal and statutory requirements.
• Manage and compile content of the governance report of the Annual Report
• Ensure implementation of board deliverables as agreed with the shareholders.
Board and Committee Administrative Support:
• Convene meetings in compliance with regulatory requirements, including notice of meetings, agendas preparing meeting packs, dissemination of information, coordinating attendance at meetings and minutes taking, etc.
• Ensure company policies are kept current and approved, and that company members are aware of their implications.
• Deal with correspondence, collating information and writing reports, ensure decisions made and actions from meetings are communicated to the relevant company stakeholders.
SECTION 4 – CONTRIBUTION OF COMPANY SECRETARY
38 HOTEL INDUSTRY
• Positively support the implementation of all decisions of the Board, Committee Members, and the CEO.
Hotel Records and Policy Maintenance:
• Oversee the storage, maintenance, and retrieval of corporate documents to ensure secure access and safe-keeping.
• Review meeting materials prior to presentation, and ensure compliance with the company’s document retention policy.
• Establish and maintain relationships with key stakeholders, Board, Committee Members, external regulators and advisors.
• Communicate and engage relevant stakeholders on directions and decisions taken by the business.
• Policy and charter maintenance, compilation and implementation.
In the hotel Industry, Management of Human Resources is very important. A Company Secretary may become the guiding force in Human Resources Management like advising on Industrial and Labour Laws; manpower planning and development; performance appraisal; Remuneration Strategies following the applicable laws of land; Audit of the HR function; Office Management, Work Studies and Performance standards; Maintaining Industrial relations; Preparation of Project Reports and Attaining Cultural Integration.
In exercise of the powers conferred by section 410 of the Companies Act, 2013, the Central Government hereby constitutes the National Company Law Appellate Tribunal for hearing appeals against the orders of the National Company Law Tribunal with effect from the 1st day of June, 2016. Establishment of NCLT/NCLAT shall offer various following opportunities to Practicing Company Secretaries as they have been authorized to appear before the Tribunal/ Appellate tribunal:
• Compromise and arrangement,
• Sick companies,
• Winding up, (only notified sections)
• Reduction of capital, etc.
• Act as company representative in all other related matters.
Likewise now-a-days the Practicing Company Secretaries are taking a lead role as Counsel of various Corporates to appear before the other Quasi-judicial Bodies such

39
as Competition Commission of India, Securities Appellate Tribunal, Registrar of Companies, Consumer Forums, Telecom Disputes Settlement and Appellate Tribunal Tax Tribunals, etc.
4.2 ROLE OF COMPANY SECRETARY IN EMPLOYMENT
Advisory Service
Performs independent reviews across various verticals of compliance viz. statutory, regulatory, product, legal, HR, administration etc., and submits a quarterly/periodic report to the management for review.
Compliance
Develop, maintain and refresh the company’s compliance programme/ framework to ensure all key risks are objectively assessed & dealt with.
Procedural
Identify risks for the company and prepare of mitigation plan for risks pertaining to non-compliance of Indian regulations, licensing requirements and Code of Ethics violations.
Representation
Take on legal department projects related to contracts, contract management & commercial transactions.
4.3 ROLE OF COMPANY SECRETARY IN PRACTICE
• Preparing case for Arbitration and representation before arbitrators
• Consultation on behalf of companies at NCLT
• Consultation as an expert in providing training to employees
• Consultation in market development assistance scheme (Annexure-I: Guidelines for the scheme of market development assistance for promotion of domestic tourism
• Consultation in certification of the industry (Format attached in Annexure-II)
• Any other such consultancies that are required from time to time
4.4 SUGGESTIONS TO MINISTRY OF TOURISM (MOT) TO BOOST INDIAN HOTEL INDUSTRY:
1. To Take Support and expertise from the Professionals like Company Secretaries to design Ling Term Planning and Legal Compliances.
SECTION 4 – CONTRIBUTION OF COMPANY SECRETARY
40 HOTEL INDUSTRY
2. To provide for effective marketing and advertisement of India as a global tourist destination through promotional campaigns that project India as a whole and not merely a combination of states.
3. Proper transportation facilities: Families in different strata need facilities like bus, cars, and trains to approach their favorite destinations. Major distances are covered by trains or planes. Sufficient transport facilities exist and additional facilities can be made for the same based on requirements. India’s transportation system is also in need of a serious overhaul. Although cars and trucks traverse India’s roads, laws for operating vehicles are widely ignored. Often the result is pure chaos, as cars, trucks, bicycles and rickshaws drive into opposing traffic rules and ignore traffic lights to get where they need to go. Fatal car and truck accidents are not uncommon. For a tourist visiting India, the experience of traveling along India’s lawless roadways can induce cardiac arrest. While India also has an extensive railway system, due to overcrowding and poor maintenance, this mode of transportation is not in any way better. Trains are frequently so crowded that people sit on the roofs of moving trains or hang out the windows. While a rare breed of adventurous tourist may find traveling on India’s trains exciting, the majority of tourists find using India’s railways highly inconvenient. India needs to enforce its traffic laws and reduce railway overcrowding so that visiting tourists will have an easier time traveling from place to place.
4. Proper accommodation facility: While an international tourist is in India he/she needs to be provided with good quality accommodation at reasonable prices in nearby localities of tourist spots.
5. The educational nature of heritage sites should not be forgotten. Theatres showing educational videos about the heritage site and its history should be available and cost should be included in tour costs.
6. Food and restaurants: Food and restaurants are required at tourist sites. The restaurants should be able to serve a variety of global cuisines to suit all tastes and also have stress for local food. Restaurants should be able to supply mineral water to the health conscious tourists of the day.
7. Adequate and hygienic toilet, bathroom and urinal facilities are required at heritage sites. These facilities also need maintenance and cleanliness.
8. Primary Health Care: Every tourist spot should be equipped with a primary healthcare centre to provide first aid and amenities to minimize stress and fatigue relief.
9. Handicraft and local crafts sales facilities: A tour is probably a time when the tourist is brought close to local handicrafts and local craftsmen. Adequate space

41
for having shops to sell Indian handicrafts, garments and traditional items must be provided.
10. Amusement Parks and secondary entertainment facilities: Now-a-days the tourists want to enjoy more and that too by spending least of their time. This opportunity can be availed by the ministry of tourism by building good amusement parks and shopping complexes near the famous tourist spots. It will not only promote tourism but also lead to employment generation for a large number of people.
11. Bank and ATM facilities: Most tourist locations require Bank and ATM facilities. Nationalized banks can be directed to provide ATM facilities nearby heritage/tourist sites.
12. Persons performing unclean acts can be fined for such purposes. Indian tourism department should frame surveillance and penal code that should authorize the specific persons at respective tourist spots to impose and collect penalties and fines from those who are damaging the tourist spots or creating an unclean environment.
13. Incentive to explore the heritage: The government of India is recommended to design such tourism packages which cover a large number of tourist spots at discounted prices .It will provide an incentive to the tourists to visit more tourist places in a single visit to India. It will help in flourishing the tourism industry.
14. Another issue with an adverse effect on India’s tourism is its widespread environmental pollution. Air quality throughout India is notoriously bad, since there are no curbs on emissions and law enforcement to prevent gross polluters. Most days, the air in big cities such as Mumbai has a red tinge to it, causing watery eyes and cough. Respiratory infections are common, especially among sensitive individuals or those with allergies. Additionally, air pollution is beginning to show its effects on prominent tourist landmarks, such as Agra’s Taj Mahal. In recent years, toxic air has damaged the ancient marble of the monument, jeopardizing its beauty and requiring significant repair. Measures should therefore be initiated for strict enforcement of provisions of Environmental Protection Act and the latest amendments made therein.
15. As India’s population is growing, forests are being cleared to make room for more housing and development. The destruction of these forests leads to a loss of habitat for many of India’s famed fauna, such as Bengal tigers, Asian elephants and Indian ring neck parrots. If India does not make greater efforts to reduce this loss of habitat, tourists searching for safari like encounters with the animals made famous in Rudyard Kipling’s “Jungle Book” will be out of luck. India needs to preserve ecotourism by protecting its forests and the animals that inhabit them.
16. India’s government should be cognizant of the different types of tourists that may want to visit the country ecotourists, history buffs or those seeking meditative retreats. India should take advantage of the West’s intrigue with Indian culture,
SECTION 4 – CONTRIBUTION OF COMPANY SECRETARY
42 HOTEL INDUSTRY
including yoga, ayurvedic medicine, Hinduism and meditation, and market itself accordingly.
17. Coastal development: Development of coastlines and management of water resources will give a new impetus to tourism, tremendous boost to the development of flora and fauna and multiply our domestic and export income through sea food, fisheries and a variety of flora .This can be done with the expert guidance of consultants, hoteliers, industrialists and businessman.
18. Single window facility should be provided for booking rooms in city hotels and other tourism related services the government should improve & change the image of Kashmir valley: Germany was the first country to change the caution notice to its citizens against travelling to Kashmir. They also went on to state that “foreigners were not a target for militants in Indian-held Kashmir”. The government should urge other countries to change their travel advisories and market Kashmir as an adventure tourism destination.
19. More efforts have to be laid in by the Government of India to provide adequate safety of foreign tourists, especially for the female visitors.
20. Similar entry fees at tourist spots: It is a common practice in India to charge much higher entry fees at major tourist spots from foreign tourists in comparison to Indians. Although it is major revenue generating source for the government of India still the price discrimination if not abolished should be minimized.
21. Development of North-east states: Efforts should be made for promotion of heritage of north-eastern states of India which have a great potential to attract foreign tourists because of the rich natural beauty.
22. VoA scheme: In an attempt to push inbound arrivals in India the government should extend VoA (Visa on Arrival) scheme to more and more nations. India currently issues VoA to 14 countries viz: Japan, Indonesia, The Philippines, Cambodia, Laos, Vietnam., Singapore, Myanmar, Finland, New Zealand, Luxembourg, France, Germany and Russia.
4.5 CONCLUSION
The hotel industry has made a special place in the world of hospitality. India is the most diverse place in world as it has different kaleidoscope of landscapes, spectacular hilly sites, varied cultures and festivals. Hotels in India are an old tradition, and the demand for travel and tourism in India is expected to increase annually by 8.5%. It also accounts for about 11% of total population. The government of India has taken and is taking various initiatives to strengthen the industry. Indian hotel industry is one of the fastest growing and important sector revenue wise as well as employment-wise. Company Secretary Profession is having a wide role to perform in the sector. However, the need of the hour is to implement industry-specific act and regulators to monitor and boost the industry on an international scale.

43
BIBLIOGRAPHY
• Government of India, Economic Survey 2017-18, Ministry of Finance.
• Sharma, Sonal, (2016), “Impact of Growth of Hospitality Industry on Indian Economy”, International Journal of Commerce and Management Research, Vol.2, No-3, pp. 148-151.
• Federation of Hotels and Restaurant Associations of India, Indian Hotel Industry Survey 2011-12, RH&RA India, New Delhi.
• Federation of Hotels and Restaurant Associations of India, Indian Hotel Industry Survey 2015-16, RH&RA India, New Delhi.
• Horwath HTL, Hotel Review Report-2017, India, www.horwathhtl.com
• Bagri, S.C. (2015), “Marketing Environment of Indian Hotel Industry”, Researchgate,.
• Government of India, Annual Report 2017-18, Incredible India, Ministry of Tourism.
• Government of India, Annual Report 2015-16, Ministry of Tourism.
• Government of India, Annual Report 2016-17, Ministry of Tourism.
• Kumar, Kuldip, (2015), “Growth Drivers and Challenges in Indian Hotel Industry”, World Wide journal of Multidisciplinary Research and development, Vol-1, No-6.
• Confederation of Indian Industry, Hospitality Insight: From the Indian CEO’s Desk, 2012.
• HVS Research, Hotels in India: Trends and Opportunities, 2017, www.HVS.com
• Government of India, India Tourism Statistics, 2017, Research Division, Ministry of Tourism.
• Sufi, Tahir, (2015), “Indian Hotel Industry: Past, Present and Future”, Journal of Hotel management, Researchgate.
• Deloitte, 2018 Travel and Hospitality Industry Outlook.
BIBLIOGRAPHY

44 HOTEL INDUSTRY
F.No. 5 (30)/2006-MDARevised w.e.f. 01.04.2017 Government of India Ministry of Tourism
(OM Division)
REVISED GUIDELINES FOR MARKETING DEVELOPMENT ASSISTANCE (MDA) SCHEME
1. Objective:
The Marketing Development Assistance Scheme (MDA), administered by the Ministry of Tourism, Government of India, provides financial support to tourism service providers, i.e. hoteliers, travel agents, tour operators, tourist transport operators for undertaking the following tourism promotional activities abroad:
These activities may include sales tours, participation in travel fairs/exhibitions and road shows.
Tourism Departments of all States and Union Territories (UTs) are also eligible for benefits under Scheme for participation in travel fairs / exhibitions and road shows held overseas.
The main objective of the MDA scheme is to promote marketing of brand “Incredible India” – in the established markets as well as in the emerging markets.
2. Eligibility Criteria:
(i) The Tourism Service Providers must be approved by the Ministry of Tourism, Govt. of India. In the case of the state of Jammu & Kashmir and states in the North Eastern Region (Arunachal Pradesh, Assam, Manipur, Meghalaya, Mizoram, Nagaland, Sikkim and Tripura) the Tourism Service Providers must be approved by the State Tourism Department.
(ii) Financial support under the Scheme would be available to companies with foreign exchange earnings up to a maximum of Rs. 15.00 crore (Rupees Fifteen Crore only) during the preceding financial year. In respect of tourism service providers from the state of Jammu & Kashmir and States in the North Eastern Region, the service providers not having any foreign exchange earnings but with a total turnover of up to Rs. 20 crore (Rupees Twenty Crore) would also be eligible.
(iii) Tourism Service Providers must show a cumulative increase of 5% in Foreign Exchange Earnings (FEE) during a three year period, to be eligible for financial support under the MDA scheme i.e. at the end of year 3, there must be a cumulative increase of 5% in FEE over the base year. For this purpose, the base year will be taken as the financial year preceding the year when the promotional
45
activity is undertaken. The clause will be made effective from the financial year 2015-16 and tourism service providers will need to show a cumulative increase of 5% in FEE at the end of year 3 over the base year 2014-15 (actual financial year 2017-18) and so forth. In the case of Tourism Service Providers in Jammu & Kashmir and the North Eastern Region, there must be a cumulative increase of 5% in foreign exchange earnings or total turnover of the agency during the three year period.
(iv) Financial support under the MDA Scheme will be provided to tourism service providers including States/UT Administrations for participation in a total of 02 (two) events (covering sales tours, travel fairs/exhibitions and road shows) in one financial year.
(v) The tour to single country or a group of countries should be for a minimum of two-night stay abroad excluding journey period.
(vi) Assistance is permissible to one regular employee/Director/ partner/ proprietor of the company.
(vii) In order to avail the benefit of reimbursement of air fare under the MDA Scheme, all tourism service providers / officials of Tourism Departments of States / UTs may travel only by Air India, to stations directly connected by Air India.
For travel to stations not directly connected by Air India, but which are directly connected by other airlines, travel by other airlines would be permissible on the lowest available fare. The claimant agency would have to provide certificate with regard to lowest available fare issued by the concerned airlines or the ticket issuing agencies.
For travel to stations not directly connected by any air services with stations in India, if travel on the shortest route available is undertaken through a station connected by Air India, reimbursement of air fare would only be made for travel by Air India on that sector.
(viii) In order to take benefit of reimbursement it is mandatory to take prior approval from Ministry of tourism as detailed at clause 3(ii) of these guidelines.
(ix) The agency should not have got any assistance from any Government agency for the promotional activity abroad.
(x) Details of financial assistance availed during the last three years from any Government agency & the Ministry of Tourism.
(xi) The claim must be submitted within 30 days of return to India.
ANNEXURE
46 HOTEL INDUSTRY
(xii) Claim form received after 30 days of return to India or wherein the deficiencies in the claim as intimated are not fully completed within 30 days of the date of information/documents sought, would not be entertained and would be rejected. However, in the cases of prior approval, the concerned agency would have to ascertain that the prior approval of the Ministry has been received by them before pursuing on the promotional activity abroad.
3. Pattern of Funding
(i) The Ministry of Tourism, Government of India gives maximum grant of Rs.2.50 lakh to the Tourism Service Providers for promotional activities abroad by way of reimbursement towards air fare, participation fee, hotel accommodation as well as to the State Governments/UT Administrations.
(ii) To avail the reimbursement from the Ministry of Tourism, the Tourism Service Providers would have to request to the Ministry of Tourism for prior approval at least 21 days in advance before going abroad for promotional activity through the email [email protected] Ministry of Tourism would respond within the 07 working days. The Tourism Service Providers will have to provide the following details along with the documents given at Clause 4 (a) of the guidelines for obtaining the prior approval:-
(a) Name and contact details of the applicant company.
(b) Name of person undertaking the promotional tour.
(c) Category under which the promotional activity is proposed to be undertaken.
(d) Name of event proposed to be participated in.
(e) Dates / Country(ies) of visit of the proposed tour.
(iii) Financial support for undertaking sales tours, participation in travel fairs/exhibitions and Road Shows organized overseas is provided as follows:-
(a) 90% of economy class air fare from India to any other country and/or by air/euro rail from one country to another country abroad.
(b) 90% of cost of built up/ furnished stall, electricity, water charges and participation fee, etc. at travel fairs/exhibitions.
(c) Hotel Room expenses for a maximum of 5 nights, with an upper limit of Rs.8000/- per night.
Subject to an overall upper ceiling of Rs.2.50 lakh per case.
47
4. Documents:
(a) Documents required for obtaining prior approval:
(i) Self-certified copy of proof of approval of the company by Ministry of Tourism or by the State Government i n the case of Jammu & Kashmir and the North Eastern States (copy of approval letter needs to be attached).
(ii) Declaration with official seal, date and on letter head of the company to the effect that the claimant is not under any investigation and/or has not been charged/prosecuted/debarred/ blacklisted by the Ministry of Tourism, Govt. of India or any other Government agency.
(iii) Certificate of foreign exchange earnings during the preceding financial year, clearly indicating the percentage increase in foreign exchange earnings in the preceding year as compared to the earlier financial year, duly certified by Chartered Accountant. In the case of service providers from Jammu & Kashmir and the North Eastern States, certificate as above or of total turnover and % increase in total turnover, duly certified by the Chartered Accountant.
(b) Documents required while claims are forwarded to the Ministry:
(i) Declaration with official seal, date and on letter head of the company stating that no financial assistance has been claimed/received for the said promotional activity from any Government Department/agency including the Ministry of Tourism.
(ii) Air ticket(s) for journeys performed along with Boarding Pass(es) for each sector along with the copy of passport showing exit/entry dates.
(iii) Bank advices/statement of accounts/receipts, etc., in evidence of payments made for air tickets / booth / hotel accommodation, as the case may be, for which reimbursement is being claimed.
(iv) A comprehensive Tour Report and achievements during the tour undertaken.
5. Formats:
(i) Application Form for obtaining Prior Approval under MDA Scheme for Sales Tours/Participation in Travel Fairs & exhibitions/Road Shows is at Annexure-I.
(ii) Format for claim form for MDA for Sales Tours/Participation in Travel Fairs & exhibitions/Road Shows is at Annexure-II.
ANNEXURE

48 HOTEL INDUSTRY
(iii) Format for declaration from the Agency that the Company is not under investigation/ charged/ prosecuted/ debarred/blacklisted by the Ministry of Tourism, Government of India or any other Government Agency is at Annexure- III.
(iv) Format for declaration from the agency that they have not claimed/received any financial assistance for this sales tour / participation in this travel fair/exhibition / this road show (as applicable) from any Government Department/agency including the Ministry of Tourism is at Annexure-IV.
Annexure-I
Application Form for Obtaining Prior Approval for Marketing Development Assistance for Sales Tours/Participation in Travel Fairs & Exhibitions / Road Shows
1 Name of the firm with full address
2 Name and designation of the person going abroad
3 Certificate regarding approval of the Agency/Firm by Ministry of Tourism OR State Tourism Dept. in the case of Jammu & Kashmir and North Eastern States (Attach a copy of approval letter) (not applicable in the case of Tourism Departments of States/UTs).
No. & Date:
Valid up to :
4 Certificate of Foreign Exchange Earnings during the preceding financial year, duly certified by Chartered Accountant. In the case of service providers from Jammu & Kashmir and the North Eastern States, certificate as above or of total turnover, duly certified by the Chartered Accountant. (not applicable in the case of Tourism Departments of States/UTs). (Membership Number to be indicated in the CA Certificate)
5 Name of the travel fair/exhibition/road show and the countries along with the dates/duration of visit abroad
6 Date of departure from India
7 Date of arrival in India
8 Details of the financial assistance availed earlier under the MDA Scheme:
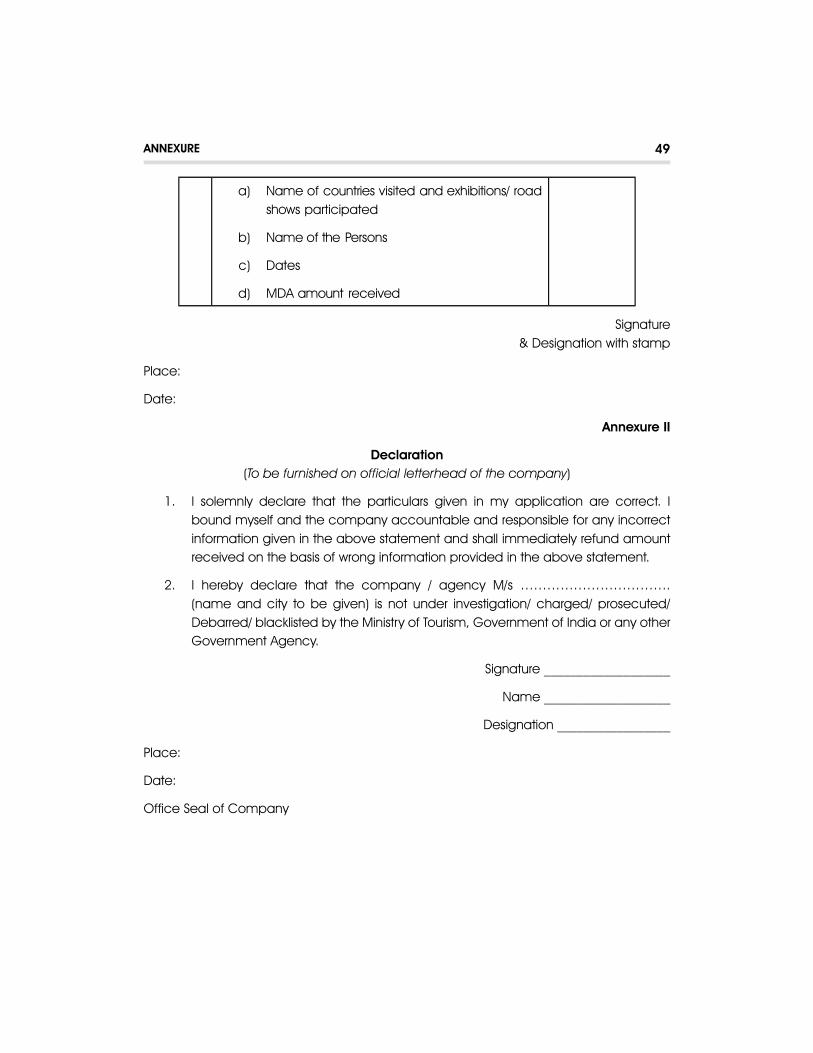
49
a) Name of countries visited and exhibitions/ road shows participated
b) Name of the Persons
c) Dates
d) MDA amount received
Signature & Designation with stamp
Place:
Date:
Annexure II
Declaration(To be furnished on official letterhead of the company)
1. I solemnly declare that the particulars given in my application are correct. I bound myself and the company accountable and responsible for any incorrect information given in the above statement and shall immediately refund amount received on the basis of wrong information provided in the above statement.
2. I hereby declare that the company / agency M/s ……………………………. (name and city to be given) is not under investigation/ charged/ prosecuted/ Debarred/ blacklisted by the Ministry of Tourism, Government of India or any other Government Agency.
Signature ___________________
Name ___________________
Designation _________________
Place:
Date:
Office Seal of Company
ANNEXURE
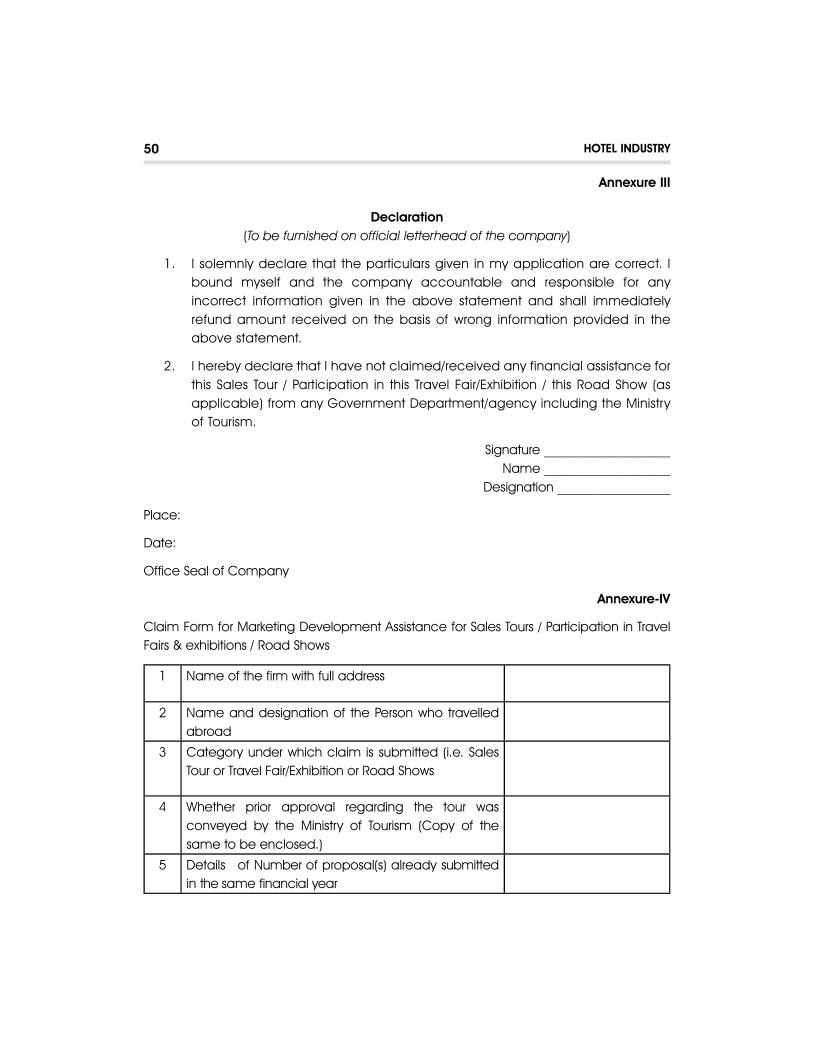
50 HOTEL INDUSTRY
Annexure III
Declaration(To be furnished on official letterhead of the company)
1. I solemnly declare that the particulars given in my application are correct. I bound myself and the company accountable and responsible for any incorrect information given in the above statement and shall immediately refund amount received on the basis of wrong information provided in the above statement.
2. I hereby declare that I have not claimed/received any financial assistance for this Sales Tour / Participation in this Travel Fair/Exhibition / this Road Show (as applicable) from any Government Department/agency including the Ministry of Tourism.
Signature ___________________ Name ___________________
Designation _________________
Place:
Date:
Office Seal of Company
Annexure-IV
Claim Form for Marketing Development Assistance for Sales Tours / Participation in Travel Fairs & exhibitions / Road Shows
1 Name of the firm with full address
2 Name and designation of the Person who travelled abroad
3 Category under which claim is submitted (i.e. Sales Tour or Travel Fair/Exhibition or Road Shows
4 Whether prior approval regarding the tour was conveyed by the Ministry of Tourism (Copy of the same to be enclosed.)
5 Details of Number of proposal(s) already submitted in the same financial year

51
6 Details of the financial assistance availed earlier under the MDA Scheme separately for:
a) Sales Tour &
b) Participation in fair/exhibition/road show
(Please furnish details of the sales tours/fairs and exhibitions/ road shows, countries visited, name of the person who went abroad and the amount of financial assistance received in each case)
7 Name of the Country(ies) / Sectors visited for the Sales Tour.
8 Name of the Travel Fair/ Exhibition/Road Show participated in and the countries along with the dates/duration of stay abroad
9 Date of departure from India
10 Date of return to India
11 Sector-wise details of journeys undertaken:
(i) Airline on which travelled
(ii) Flight Number
(iii) Class in which travelled
(iv) Ticket Number
(Air ticket with boarding pass for each sector travelled to be submitted)
12
(a)
Actual expenditure incurred on return airfare by economy excursion class
(Please attach receipt/document in evidence of payment made for the air ticket)
If travel was undertaken by any other class
(Business/First, etc.), economy excursion class fare for sectors/countries visited to be indicated.
ANNEXURE
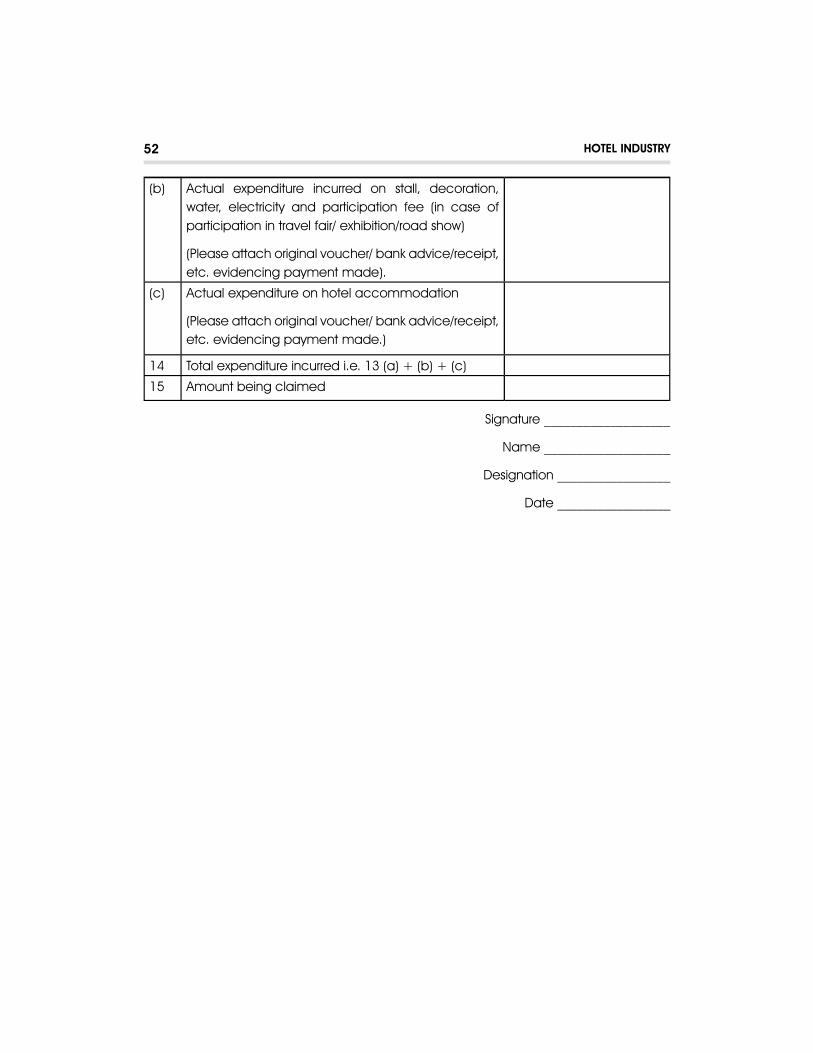
52 HOTEL INDUSTRY
(b) Actual expenditure incurred on stall, decoration, water, electricity and participation fee (in case of participation in travel fair/ exhibition/road show)
(Please attach original voucher/ bank advice/receipt, etc. evidencing payment made).
(c) Actual expenditure on hotel accommodation
(Please attach original voucher/ bank advice/receipt, etc. evidencing payment made.)
14 Total expenditure incurred i.e. 13 (a) + (b) + (c)
15 Amount being claimed
Signature ___________________
Name ___________________
Designation _________________
Date _________________
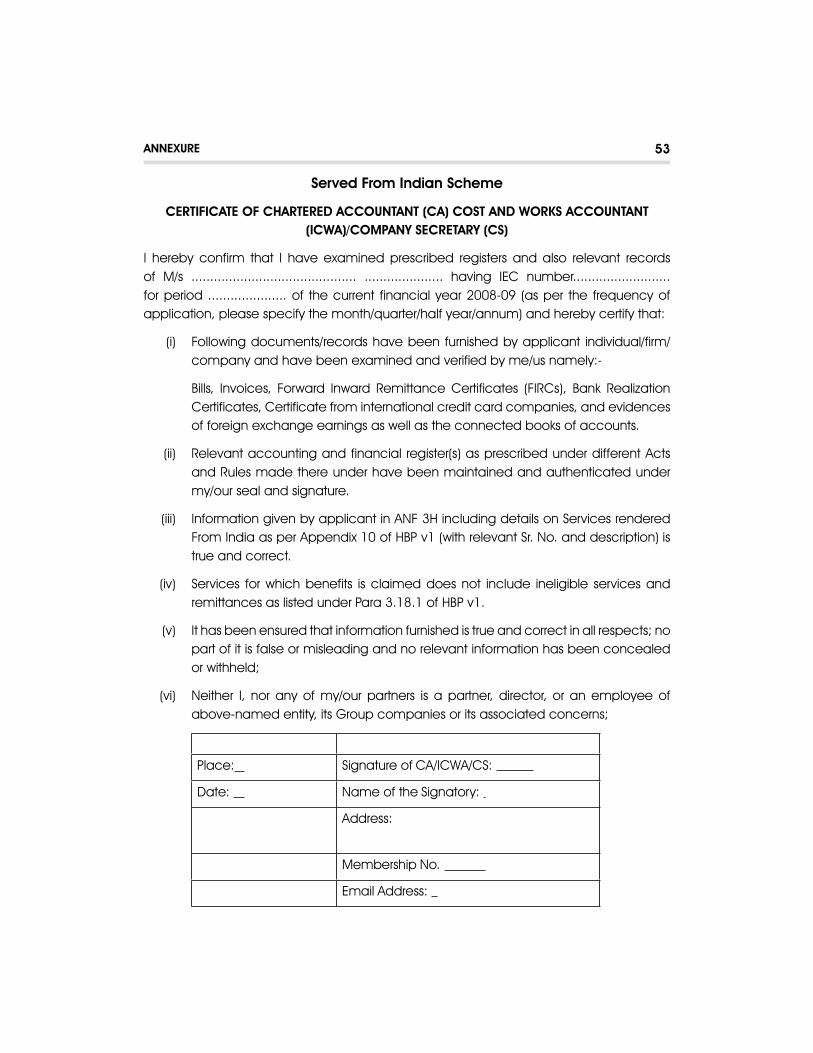
53
Served From Indian Scheme
CERTIFICATE OF CHARTERED ACCOUNTANT (CA) COST AND WORKS ACCOUNTANT (ICWA)/COMPANY SECRETARY (CS)
I hereby confirm that I have examined prescribed registers and also relevant records of M/s ............................................ ..................... having IEC number.......................... for period ..................... of the current financial year 2008-09 (as per the frequency of application, please specify the month/quarter/half year/annum) and hereby certify that:
(i) Following documents/records have been furnished by applicant individual/firm/company and have been examined and verified by me/us namely:-
Bills, Invoices, Forward Inward Remittance Certificates (FIRCs), Bank Realization Certificates, Certificate from international credit card companies, and evidences of foreign exchange earnings as well as the connected books of accounts.
(ii) Relevant accounting and financial register(s) as prescribed under different Acts and Rules made there under have been maintained and authenticated under my/our seal and signature.
(iii) Information given by applicant in ANF 3H including details on Services rendered From India as per Appendix 10 of HBP v1 (with relevant Sr. No. and description) is true and correct.
(iv) Services for which benefits is claimed does not include ineligible services and remittances as listed under Para 3.18.1 of HBP v1.
(v) It has been ensured that information furnished is true and correct in all respects; no part of it is false or misleading and no relevant information has been concealed or withheld;
(vi) Neither I, nor any of my/our partners is a partner, director, or an employee of above-named entity, its Group companies or its associated concerns;
Place: Signature of CA/ICWA/CS:
Date: Name of the Signatory:
Address:
Membership No.
Email Address:
ANNEXURE
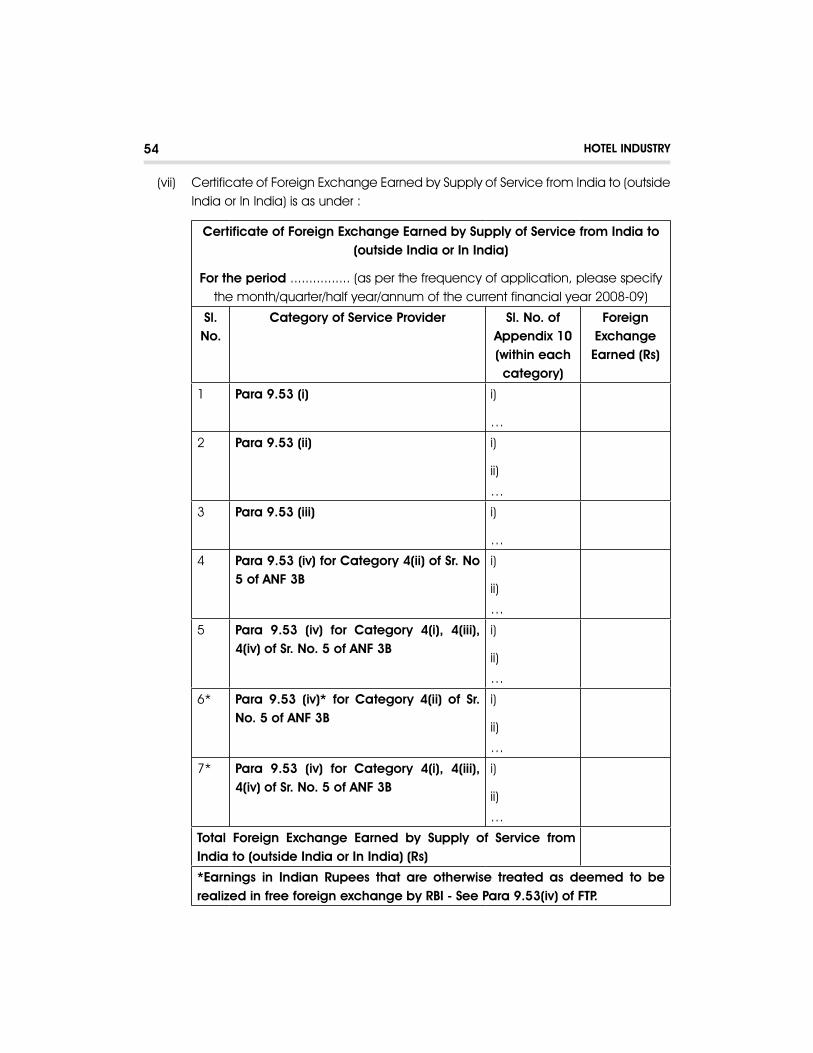
54 HOTEL INDUSTRY
(vii) Certificate of Foreign Exchange Earned by Supply of Service from India to (outside India or In India) is as under :
Certificate of Foreign Exchange Earned by Supply of Service from India to (outside India or In India)
For the period ................ (as per the frequency of application, please specify the month/quarter/half year/annum of the current financial year 2008-09)
Sl.No.
Category of Service Provider Sl. No. of Appendix 10 (within each category)
Foreign Exchange Earned (Rs)
1 Para 9.53 (i) i)
…
2 Para 9.53 (ii) i)
ii)
…
3 Para 9.53 (iii) i)
…
4 Para 9.53 (iv) for Category 4(ii) of Sr. No 5 of ANF 3B
i)
ii)
…
5 Para 9.53 (iv) for Category 4(i), 4(iii), 4(iv) of Sr. No. 5 of ANF 3B
i)
ii)
…
6* Para 9.53 (iv)* for Category 4(ii) of Sr. No. 5 of ANF 3B
i)
ii)
…
7* Para 9.53 (iv) for Category 4(i), 4(iii), 4(iv) of Sr. No. 5 of ANF 3B
i)
ii)
…
Total Foreign Exchange Earned by Supply of Service from India to (outside India or In India) (Rs)
*Earnings in Indian Rupees that are otherwise treated as deemed to be realized in free foreign exchange by RBI - See Para 9.53(iv) of FTP.
55
(vii) I fully understand that any statement made in this certificate, if proved incorrect or false, will render me liable to face any penal action or other consequences as may be prescribed in law or otherwise warranted.
Place: Signature of CA/ICWA/CS:
Date: Name of the Signatory:
Address:
Membership No.
Email Address:
ANNEXURE

56 HOTEL INDUSTRY