Embed Size (px)
Citation preview
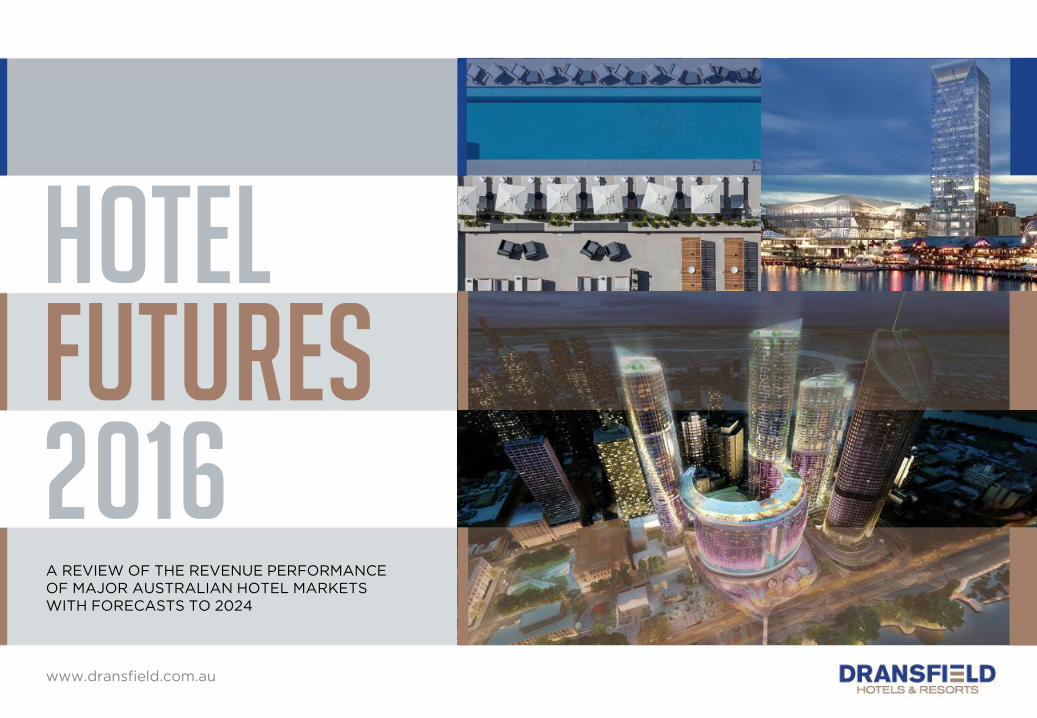
FuturesHOTEL
www.dransfield.com.au
2016A REVIEW OF THE REVENUE PERFORMANCE
OF MAJOR AUSTRALIAN HOTEL MARKETS
WITH FORECASTS TO 2024
PP
HOTEL FUTURES2016
www.dransfield.com.au1
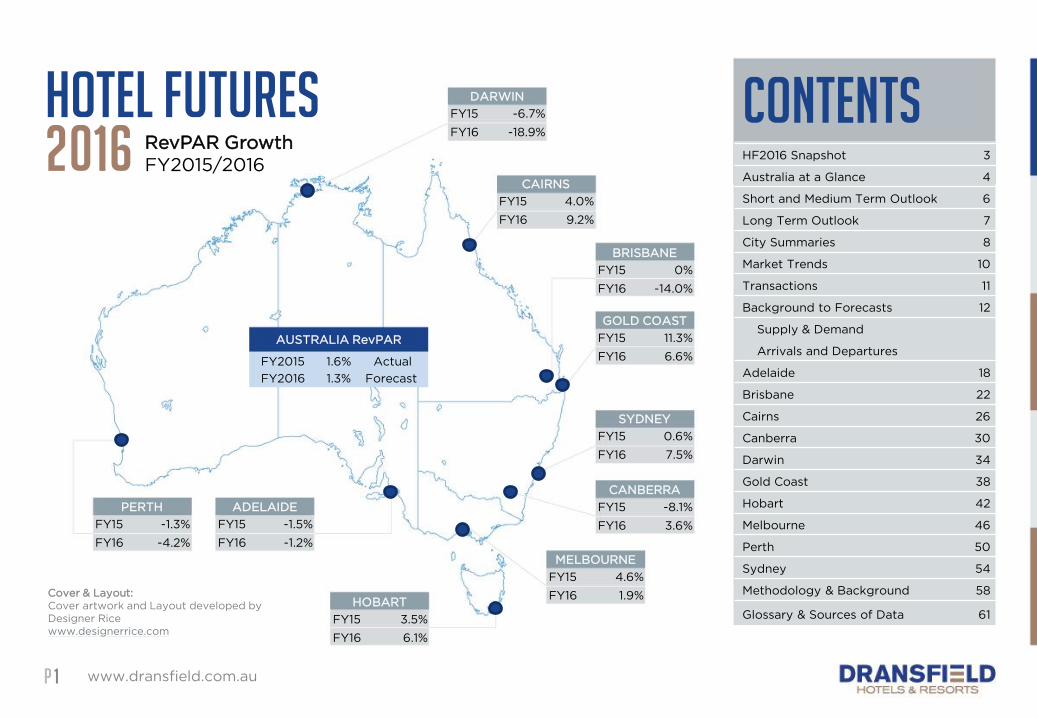
RevPAR Growth
FY2015/2016
DARWIN
FY15 -6.7%
FY16 -18.9%
CAIRNS
FY15 4.0%
FY16 9.2%
BRISBANE
FY15 0%
FY16 -14.0%
GOLD COAST
FY15 11.3%
FY16 6.6%
SYDNEY
FY15 0.6%
FY16 7.5%
CANBERRA
FY15 -8.1%
FY16 3.6%
MELBOURNE
FY15 4.6%
FY16 1.9%HOBART
FY15 3.5%
FY16 6.1%
ADELAIDE
FY15 -1.5%
FY16 -1.2%
PERTH
FY15 -1.3%
FY16 -4.2%
AUSTRALIA RevPAR
FY2016 1.3% Forecast
FY2015 1.6% Actual
Cover & Layout:
Cover artwork and Layout developed by
Designer Rice
www.designerrice.com
CONTENTSHF2016 Snapshot 3
Australia at a Glance 4
Short and Medium Term Outlook 6
Long Term Outlook 7
City Summaries 8
Market Trends 10
Transactions 11
Background to Forecasts 12
Supply & Demand
Arrivals and Departures
Adelaide 18
Brisbane 22
Cairns 26
Canberra 30
Darwin 34
Gold Coast 38
Hobart 42
Melbourne 46
Perth 50
Sydney 54
Methodology & Background 58
Glossary & Sources of Data 61
PP
AboutDransfield
www.dransfield.com.au2
Our core offering is the ability to integrate the various service skill sets into a cohesive solution for
development, operations and overarching advice. Service streams include:DRANSFIELD is a specialist
professional services organisation
advising the tourism, finance and
property industries.
Our experience includes a wide
range of property and business
related projects involving over
60,000 hotel rooms and numerous
food and beverage outlets in more
than 600 hospitality enterprises
throughout Australia and Asia.
For further information on the range
of services we provide, and the ways
in which we can assist you, please
visit our website
www.dransfield.com.au
or contact us.
DEAN DRANSFIELD
Director & Owner
T +61 2 8234 6644
TRANSACTIONS
• Agency
• Operator Selection
• Due Diligence
• Vendor Representation
• Interested Party Assessments
• Bid Advisory
• Transaction Management
• Leasing
DEVELOPMENT
• Development Management
• Commercialisation of Design
• Integration of Development
& Operations
• Feasibility Assessment
• Planning
• Design
SHARED OWNERSHIP
• Scheme Concept
• Responsible Entity
• Marketing & Sales
• Feasibility
• Advisory
STRATA/COMMUNITY TITLE
• Scheme Concepts
• PDS & Prospectus
(AFS Licensed)
• Offer Structure
• Project Design and
Commercialisation
• Operator Selection
• Project Marketing
EXPERT’S REPORTS
• Independent Expert Reports
–Prospectus
–PDS
• Expert Witness
– Independent Court Reports
– Litigation Support
& Management
ASSET MANAGEMENT
• Asset Management
• Strategy Development &
Implementation
• Operations Implementation
• Financial & Operational
Reporting
• Stakeholder Management
• Refurbishment
ADVISORY AND FINANCE
• Operations
• Feasibility & Best Use Studies
• Strategic Consulting
• Restructuring Services
• Investment Risk Analysis
• Portfolio Assessment
• Debt & Equity Sourcing
• Refinancing
• Valuation Management
• Joint Venture/Equity
Participation
• Independent Advisory
• Debt Restructuring
DISCLAIMER This document contains both qualitative and quantitative statements concerning the future performance of hotel and property markets, which may or may not prove to be correct. Dransfield & Co Pty Ltd (Dransfield) does not make any representation or warranty, express or implied that such statements will prove correct, or that estimates or forecasts contained in this document will be achieved. The projections contained in this document are estimates and represent only one possible result, depending on the assumptions made. Potential users of these forecasts should satisfy themselves as to the current market conditions. Individual hotel performance may differ to market averages. Due to the difficulty in predicting future events, the assumptions we have used may not hold true. Dransfield accepts no responsibility for any action taken or any failure to act, in reliance upon the information contained in this document. No liability for negligence or otherwise is accepted by Dransfield directly or indirectly in relation to the material contained in this document. Hotel Futures 2016 was compiled by Dean Dransfield, Raq Pustetto, Scot McLaughlin, Grace Lam and Hayden Longmuir © May 2016
PP
HF2016 Snapshot
www.dransfield.com.au3
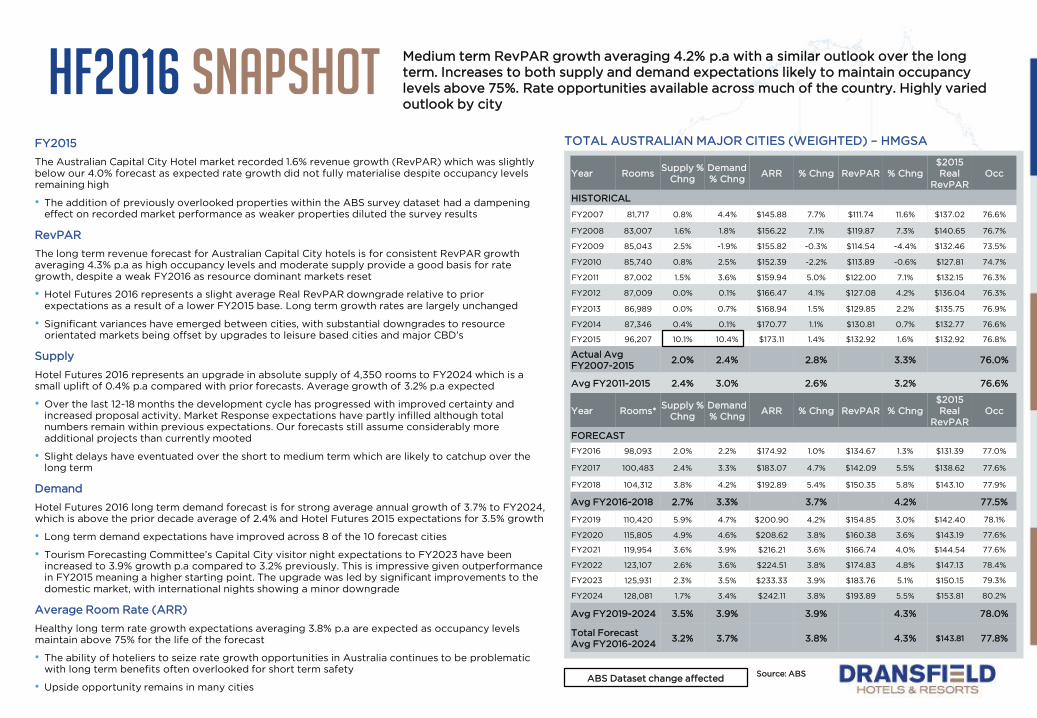
Medium term RevPAR growth averaging 4.2% p.a with a similar outlook over the long
term. Increases to both supply and demand expectations likely to maintain occupancy
levels above 75%. Rate opportunities available across much of the country. Highly varied
outlook by city
TOTAL AUSTRALIAN MAJOR CITIES (WEIGHTED) – HMGSA
Year RoomsSupply %
Chng
Demand
% ChngARR % Chng RevPAR % Chng
$2015
Real
RevPAR
Occ
HISTORICAL
FY2007 81,717 0.8% 4.4% $145.88 7.7% $111.74 11.6% $137.02 76.6%
FY2008 83,007 1.6% 1.8% $156.22 7.1% $119.87 7.3% $140.65 76.7%
FY2009 85,043 2.5% -1.9% $155.82 -0.3% $114.54 -4.4% $132.46 73.5%
FY2010 85,740 0.8% 2.5% $152.39 -2.2% $113.89 -0.6% $127.81 74.7%
FY2011 87,002 1.5% 3.6% $159.94 5.0% $122.00 7.1% $132.15 76.3%
FY2012 87,009 0.0% 0.1% $166.47 4.1% $127.08 4.2% $136.04 76.3%
FY2013 86,989 0.0% 0.7% $168.94 1.5% $129.85 2.2% $135.75 76.9%
FY2014 87,346 0.4% 0.1% $170.77 1.1% $130.81 0.7% $132.77 76.6%
FY2015 96,207 10.1% 10.4% $173.11 1.4% $132.92 1.6% $132.92 76.8%
Actual Avg
FY2007-20152.0% 2.4% 2.8% 3.3% 76.0%
Avg FY2011-2015 2.4% 3.0% 2.6% 3.2% 76.6%
Year Rooms*Supply %
Chng
Demand
% ChngARR % Chng RevPAR % Chng
$2015
Real
RevPAR
Occ
FORECAST
FY2016 98,093 2.0% 2.2% $174.92 1.0% $134.67 1.3% $131.39 77.0%
FY2017 100,483 2.4% 3.3% $183.07 4.7% $142.09 5.5% $138.62 77.6%
FY2018 104,312 3.8% 4.2% $192.89 5.4% $150.35 5.8% $143.10 77.9%
Avg FY2016-2018 2.7% 3.3% 3.7% 4.2% 77.5%
FY2019 110,420 5.9% 4.7% $200.90 4.2% $154.85 3.0% $142.40 78.1%
FY2020 115,805 4.9% 4.6% $208.62 3.8% $160.38 3.6% $143.19 77.6%
FY2021 119,954 3.6% 3.9% $216.21 3.6% $166.74 4.0% $144.54 77.6%
FY2022 123,107 2.6% 3.6% $224.51 3.8% $174.83 4.8% $147.13 78.4%
FY2023 125,931 2.3% 3.5% $233.33 3.9% $183.76 5.1% $150.15 79.3%
FY2024 128,081 1.7% 3.4% $242.11 3.8% $193.89 5.5% $153.81 80.2%
Avg FY2019-2024 3.5% 3.9% 3.9% 4.3% 78.0%
Total Forecast
Avg FY2016-20243.2% 3.7% 3.8% 4.3% $143.81 77.8%
FY2015
The Australian Capital City Hotel market recorded 1.6% revenue growth (RevPAR) which was slightly
below our 4.0% forecast as expected rate growth did not fully materialise despite occupancy levels
remaining high
• The addition of previously overlooked properties within the ABS survey dataset had a dampening
effect on recorded market performance as weaker properties diluted the survey results
RevPAR
The long term revenue forecast for Australian Capital City hotels is for consistent RevPAR growth
averaging 4.3% p.a as high occupancy levels and moderate supply provide a good basis for rate
growth, despite a weak FY2016 as resource dominant markets reset
• Hotel Futures 2016 represents a slight average Real RevPAR downgrade relative to prior
expectations as a result of a lower FY2015 base. Long term growth rates are largely unchanged
• Significant variances have emerged between cities, with substantial downgrades to resource
orientated markets being offset by upgrades to leisure based cities and major CBD’s
Supply
Hotel Futures 2016 represents an upgrade in absolute supply of 4,350 rooms to FY2024 which is a
small uplift of 0.4% p.a compared with prior forecasts. Average growth of 3.2% p.a expected
• Over the last 12-18 months the development cycle has progressed with improved certainty and
increased proposal activity. Market Response expectations have partly infilled although total
numbers remain within previous expectations. Our forecasts still assume considerably more
additional projects than currently mooted
• Slight delays have eventuated over the short to medium term which are likely to catchup over the
long term
Demand
Hotel Futures 2016 long term demand forecast is for strong average annual growth of 3.7% to FY2024,
which is above the prior decade average of 2.4% and Hotel Futures 2015 expectations for 3.5% growth
• Long term demand expectations have improved across 8 of the 10 forecast cities
• Tourism Forecasting Committee’s Capital City visitor night expectations to FY2023 have been
increased to 3.9% growth p.a compared to 3.2% previously. This is impressive given outperformance
in FY2015 meaning a higher starting point. The upgrade was led by significant improvements to the
domestic market, with international nights showing a minor downgrade
Average Room Rate (ARR)
Healthy long term rate growth expectations averaging 3.8% p.a are expected as occupancy levels
maintain above 75% for the life of the forecast
• The ability of hoteliers to seize rate growth opportunities in Australia continues to be problematic
with long term benefits often overlooked for short term safety
• Upside opportunity remains in many citiesABS Dataset change affected
Source: ABS
PP
AUSTRALIA AT A GLANCE FY2015
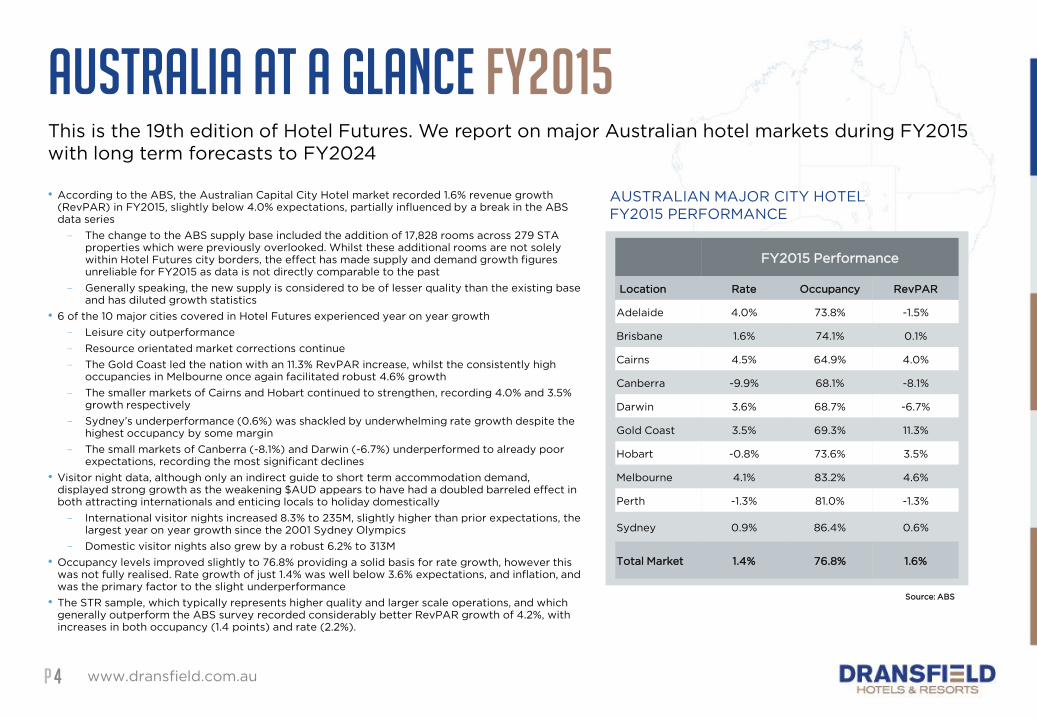
• According to the ABS, the Australian Capital City Hotel market recorded 1.6% revenue growth
(RevPAR) in FY2015, slightly below 4.0% expectations, partially influenced by a break in the ABS
data series
– The change to the ABS supply base included the addition of 17,828 rooms across 279 STA
properties which were previously overlooked. Whilst these additional rooms are not solely
within Hotel Futures city borders, the effect has made supply and demand growth figures
unreliable for FY2015 as data is not directly comparable to the past
– Generally speaking, the new supply is considered to be of lesser quality than the existing base
and has diluted growth statistics
• 6 of the 10 major cities covered in Hotel Futures experienced year on year growth
– Leisure city outperformance
– Resource orientated market corrections continue
– The Gold Coast led the nation with an 11.3% RevPAR increase, whilst the consistently high
occupancies in Melbourne once again facilitated robust 4.6% growth
– The smaller markets of Cairns and Hobart continued to strengthen, recording 4.0% and 3.5%
growth respectively
– Sydney’s underperformance (0.6%) was shackled by underwhelming rate growth despite the
highest occupancy by some margin
– The small markets of Canberra (-8.1%) and Darwin (-6.7%) underperformed to already poor
expectations, recording the most significant declines
• Visitor night data, although only an indirect guide to short term accommodation demand,
displayed strong growth as the weakening $AUD appears to have had a doubled barreled effect in
both attracting internationals and enticing locals to holiday domestically
– International visitor nights increased 8.3% to 235M, slightly higher than prior expectations, the
largest year on year growth since the 2001 Sydney Olympics
– Domestic visitor nights also grew by a robust 6.2% to 313M
• Occupancy levels improved slightly to 76.8% providing a solid basis for rate growth, however this
was not fully realised. Rate growth of just 1.4% was well below 3.6% expectations, and inflation, and
was the primary factor to the slight underperformance
• The STR sample, which typically represents higher quality and larger scale operations, and which
generally outperform the ABS survey recorded considerably better RevPAR growth of 4.2%, with
increases in both occupancy (1.4 points) and rate (2.2%).
www.dransfield.com.au4
This is the 19th edition of Hotel Futures. We report on major Australian hotel markets during FY2015
with long term forecasts to FY2024
AUSTRALIAN MAJOR CITY HOTEL
FY2015 PERFORMANCE
FY2015 Performance
Location Rate Occupancy RevPAR
Adelaide 4.0% 73.8% -1.5%
Brisbane 1.6% 74.1% 0.1%
Cairns 4.5% 64.9% 4.0%
Canberra -9.9% 68.1% -8.1%
Darwin 3.6% 68.7% -6.7%
Gold Coast 3.5% 69.3% 11.3%
Hobart -0.8% 73.6% 3.5%
Melbourne 4.1% 83.2% 4.6%
Perth -1.3% 81.0% -1.3%
Sydney 0.9% 86.4% 0.6%
Total Market 1.4% 76.8% 1.6%
Source: ABS
P
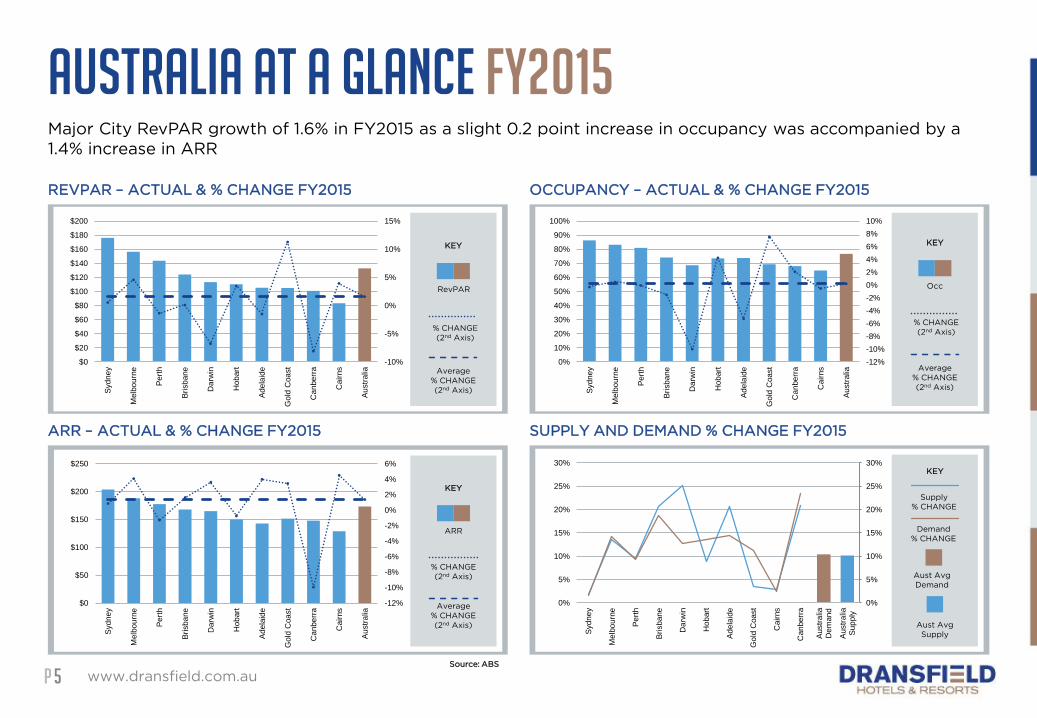
AUSTRALIA AT A GLANCE FY2015Major City RevPAR growth of 1.6% in FY2015 as a slight 0.2 point increase in occupancy was accompanied by a
1.4% increase in ARR
www.dransfield.com.au5
REVPAR – ACTUAL & % CHANGE FY2015 OCCUPANCY – ACTUAL & % CHANGE FY2015
ARR – ACTUAL & % CHANGE FY2015 SUPPLY AND DEMAND % CHANGE FY2015
-10%
-5%
0%
5%
10%
15%
$0
$20
$40
$60
$80
$100
$120
$140
$160
$180
$200
Syd
ne
y
Melb
ou
rne
Pe
rth
Bri
sba
ne
Darw
in
Hob
art
Ad
ela
ide
Go
ld C
oa
st
Can
be
rra
Cair
ns
Au
str
alia
RevPAR
KEY
% CHANGE
(2nd Axis)
Average
% CHANGE
(2nd Axis)
0%
5%
10%
15%
20%
25%
30%
0%
5%
10%
15%
20%
25%
30%
Syd
ne
y
Melb
ou
rne
Pe
rth
Bri
sba
ne
Darw
in
Hob
art
Ad
ela
ide
Go
ld C
oa
st
Cair
ns
Ca
nbe
rra
Au
str
alia
Dem
an
d
Au
str
alia
Su
pp
ly
Supply
% CHANGE
KEY
Aust Avg
Supply
Aust Avg
Demand
Demand
% CHANGE
-12%
-10%
-8%
-6%
-4%
-2%
0%
2%
4%
6%
$0
$50
$100
$150
$200
$250
Syd
ne
y
Melb
ou
rne
Pe
rth
Bri
sba
ne
Darw
in
Hob
art
Ad
ela
ide
Go
ld C
oa
st
Ca
nbe
rra
Cair
ns
Au
str
alia
ARR
KEY
% CHANGE
(2nd Axis)
Average
% CHANGE
(2nd Axis)
-12%
-10%
-8%
-6%
-4%
-2%
0%
2%
4%
6%
8%
10%
0%
10%
20%
30%
40%
50%
60%
70%
80%
90%
100%
Syd
ne
y
Melb
ou
rne
Pe
rth
Bri
sba
ne
Darw
in
Hob
art
Ad
ela
ide
Go
ld C
oa
st
Can
be
rra
Cair
ns
Au
str
alia
Occ
KEY
% CHANGE
(2nd Axis)
Average
% CHANGE
(2nd Axis)
Source: ABS
P
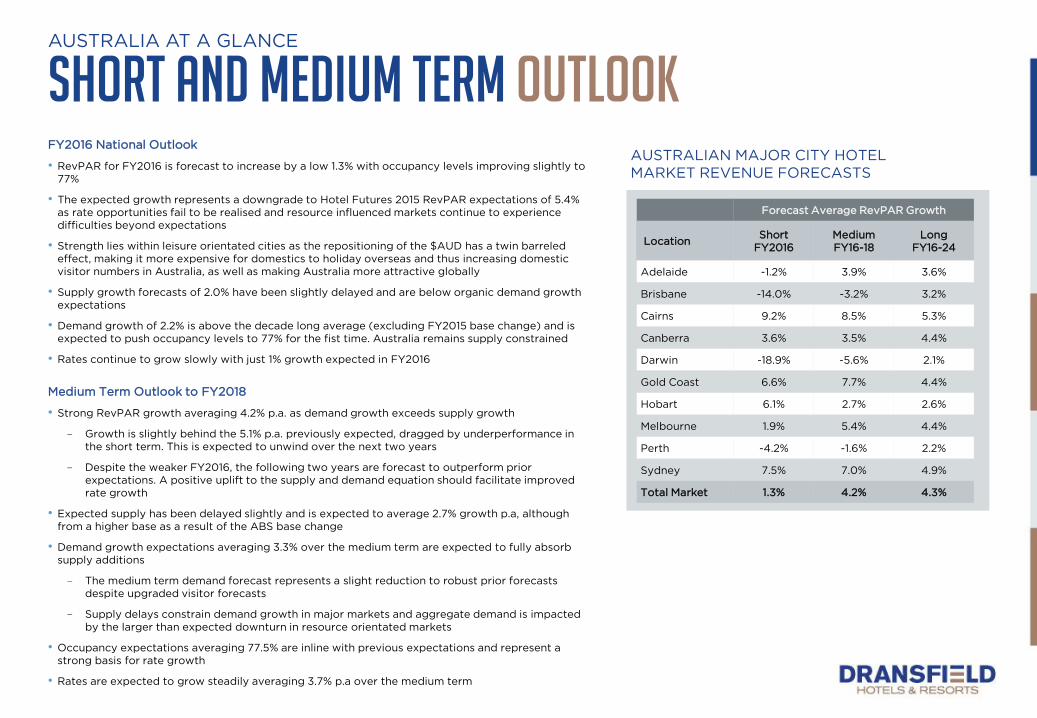
Short and Medium Term OutlookFY2016 National Outlook
• RevPAR for FY2016 is forecast to increase by a low 1.3% with occupancy levels improving slightly to
77%
• The expected growth represents a downgrade to Hotel Futures 2015 RevPAR expectations of 5.4%
as rate opportunities fail to be realised and resource influenced markets continue to experience
difficulties beyond expectations
• Strength lies within leisure orientated cities as the repositioning of the $AUD has a twin barreled
effect, making it more expensive for domestics to holiday overseas and thus increasing domestic
visitor numbers in Australia, as well as making Australia more attractive globally
• Supply growth forecasts of 2.0% have been slightly delayed and are below organic demand growth
expectations
• Demand growth of 2.2% is above the decade long average (excluding FY2015 base change) and is
expected to push occupancy levels to 77% for the fist time. Australia remains supply constrained
• Rates continue to grow slowly with just 1% growth expected in FY2016
www.dransfield.com.au6
AUSTRALIA AT A GLANCE
AUSTRALIAN MAJOR CITY HOTEL
MARKET REVENUE FORECASTS
Forecast Average RevPAR Growth
LocationShort
FY2016
Medium
FY16-18
Long
FY16-24
Adelaide -1.2% 3.9% 3.6%
Brisbane -14.0% -3.2% 3.2%
Cairns 9.2% 8.5% 5.3%
Canberra 3.6% 3.5% 4.4%
Darwin -18.9% -5.6% 2.1%
Gold Coast 6.6% 7.7% 4.4%
Hobart 6.1% 2.7% 2.6%
Melbourne 1.9% 5.4% 4.4%
Perth -4.2% -1.6% 2.2%
Sydney 7.5% 7.0% 4.9%
Total Market 1.3% 4.2% 4.3%
Medium Term Outlook to FY2018
• Strong RevPAR growth averaging 4.2% p.a. as demand growth exceeds supply growth
– Growth is slightly behind the 5.1% p.a. previously expected, dragged by underperformance in
the short term. This is expected to unwind over the next two years
– Despite the weaker FY2016, the following two years are forecast to outperform prior
expectations. A positive uplift to the supply and demand equation should facilitate improved
rate growth
• Expected supply has been delayed slightly and is expected to average 2.7% growth p.a, although
from a higher base as a result of the ABS base change
• Demand growth expectations averaging 3.3% over the medium term are expected to fully absorb
supply additions
– The medium term demand forecast represents a slight reduction to robust prior forecasts
despite upgraded visitor forecasts
– Supply delays constrain demand growth in major markets and aggregate demand is impacted
by the larger than expected downturn in resource orientated markets
• Occupancy expectations averaging 77.5% are inline with previous expectations and represent a
strong basis for rate growth
• Rates are expected to grow steadily averaging 3.7% p.a over the medium term

P
FY2024 Long Term OutlookLong Term Outlook to FY2024
• Australian major city RevPAR is forecast to grow at a
strong average of 4.3% p.a over the long term
– This represents a slight absolute downgrade to prior
expectations based on underperformance in FY2015 and a
soft FY2016
– Performance is expected to catch up over the long term
with growth rates being largely maintained
• Supply expectations have increased to 3.2% p.a
representing an increase to Hotel Futures 2015 expectations
of 3.0%. We expect supply to be fully absorbed
– Supply has been slightly delayed through the first 3 years
of the forecast, before increasing over the long term as
market conditions improve
– Certainty has increased as we move through the
development cycle with an increased proportion of
projects in construction and proposal stages
– The primary development window appears to be several
years away, with the bulk of new supply expected to
come online through FY2019 & FY2020
• Demand growth has been upgraded to 3.7% p.a. compared
to 3.5% previously, as tourism visitor forecasts improve and
supply bottlenecks in key gateway cities ease
• Occupancy is forecast to maintain above 77% for the life of
the forecast which will enable consistent rate growth
• Rate growth averaging 3.8% p.a is expected over the life of
the forecast, largely in line with previous expectations
– Upside opportunity exists across many of the major cities
as the general quality of assets improve and occupancy
levels grow
– Some rate risk lies in resources centric cities as operators
seek to consolidate occupancy at the expense of rate.
www.dransfield.com.au7
AUSTRALIA AT A GLANCE
TOTAL AUSTRALIAN MAJOR CITIES (WEIGHTED) – HMGSA
Year RoomsSupply %
Chng
Demand
% ChngARR % Chng RevPAR % Chng
$2015 Real
RevPAROcc
FORECAST
FY2016 98,093 2.0% 2.2% $174.92 1.0% $134.67 1.3% $131.39 77.0%
FY2017 100,483 2.4% 3.3% $183.07 4.7% $142.09 5.5% $138.62 77.6%
FY2018 104,312 3.8% 4.2% $192.89 5.4% $150.35 5.8% $143.10 77.9%
Avg FY 16-18 2.7% 3.3% 3.7% 4.2% 77.5%
FY2019 110,420 5.9% 4.7% $200.90 4.2% $154.85 3.0% $142.40 77.1%
FY2020 115,805 4.9% 4.6% $208.62 3.8% $160.38 3.6% $143.19 76.9%
FY2021 119,954 3.6% 3.9% $216.21 3.6% $166.74 4.0% $144.54 77.1%
FY2022 123,107 2.6% 3.6% $224.51 3.8% $174.83 4.8% $147.13 77.9%
FY2023 125,931 2.3% 3.5% $233.33 3.9% $183.76 5.1% $150.15 78.8%
FY2024 128,081 1.7% 3.4% $242.11 3.8% $193.89 5.5% $153.81 80.1%
Avg FY19-24 3.5% 3.9% 3.9% 4.3% 78.0%
Total Forecast Avg FY
2016-20243.2% 3.7% 3.8% 4.3% $143.81 77.8%
P
CITY SUMMARIES
www.dransfield.com.au8
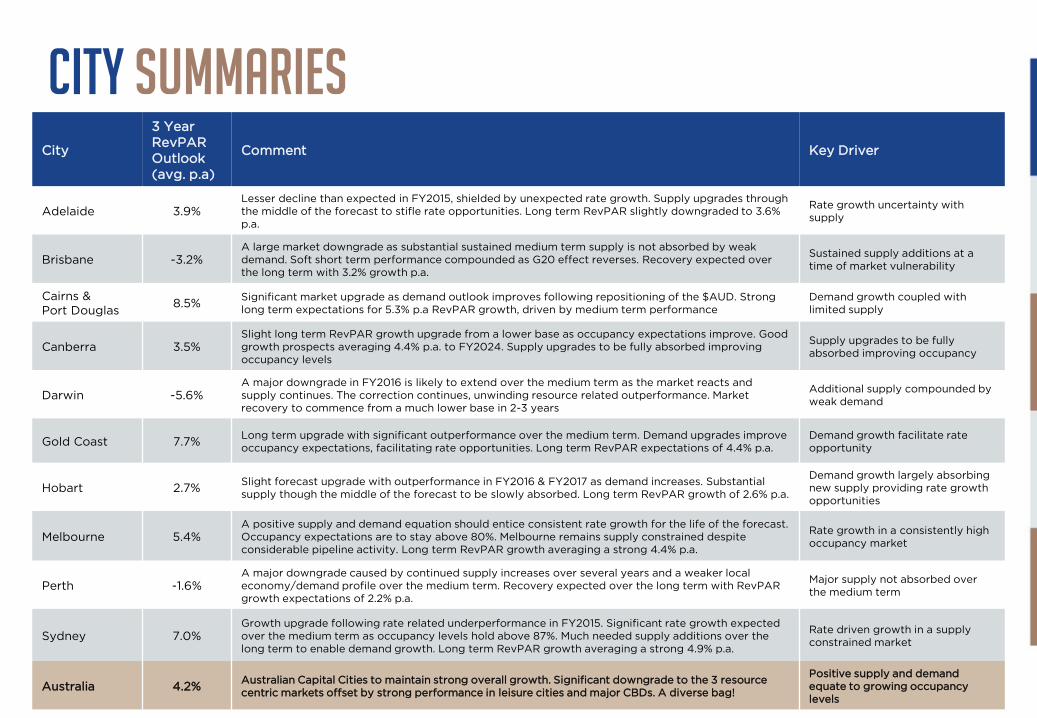
City
3 Year
RevPAR
Outlook
(avg. p.a)
Comment Key Driver
Adelaide 3.9%Lesser decline than expected in FY2015, shielded by unexpected rate growth. Supply upgrades through
the middle of the forecast to stifle rate opportunities. Long term RevPAR slightly downgraded to 3.6%
p.a.
Rate growth uncertainty with
supply
Brisbane -3.2%A large market downgrade as substantial sustained medium term supply is not absorbed by weak
demand. Soft short term performance compounded as G20 effect reverses. Recovery expected over
the long term with 3.2% growth p.a.
Sustained supply additions at a
time of market vulnerability
Cairns &
Port Douglas8.5%
Significant market upgrade as demand outlook improves following repositioning of the $AUD. Strong
long term expectations for 5.3% p.a RevPAR growth, driven by medium term performance
Demand growth coupled with
limited supply
Canberra 3.5%Slight long term RevPAR growth upgrade from a lower base as occupancy expectations improve. Good
growth prospects averaging 4.4% p.a. to FY2024. Supply upgrades to be fully absorbed improving
occupancy levels
Supply upgrades to be fully
absorbed improving occupancy
Darwin -5.6%A major downgrade in FY2016 is likely to extend over the medium term as the market reacts and
supply continues. The correction continues, unwinding resource related outperformance. Market
recovery to commence from a much lower base in 2-3 years
Additional supply compounded by
weak demand
Gold Coast 7.7%Long term upgrade with significant outperformance over the medium term. Demand upgrades improve
occupancy expectations, facilitating rate opportunities. Long term RevPAR expectations of 4.4% p.a.
Demand growth facilitate rate
opportunity
Hobart 2.7%Slight forecast upgrade with outperformance in FY2016 & FY2017 as demand increases. Substantial
supply though the middle of the forecast to be slowly absorbed. Long term RevPAR growth of 2.6% p.a.
Demand growth largely absorbing
new supply providing rate growth
opportunities
Melbourne 5.4%A positive supply and demand equation should entice consistent rate growth for the life of the forecast.
Occupancy expectations are to stay above 80%. Melbourne remains supply constrained despite
considerable pipeline activity. Long term RevPAR growth averaging a strong 4.4% p.a.
Rate growth in a consistently high
occupancy market
Perth -1.6%A major downgrade caused by continued supply increases over several years and a weaker local
economy/demand profile over the medium term. Recovery expected over the long term with RevPAR
growth expectations of 2.2% p.a.
Major supply not absorbed over
the medium term
Sydney 7.0%Growth upgrade following rate related underperformance in FY2015. Significant rate growth expected
over the medium term as occupancy levels hold above 87%. Much needed supply additions over the
long term to enable demand growth. Long term RevPAR growth averaging a strong 4.9% p.a.
Rate driven growth in a supply
constrained market
Australia 4.2%Australian Capital Cities to maintain strong overall growth. Significant downgrade to the 3 resource
centric markets offset by strong performance in leisure cities and major CBDs. A diverse bag!
Positive supply and demand
equate to growing occupancy
levels
P
CITY SUMMARIES
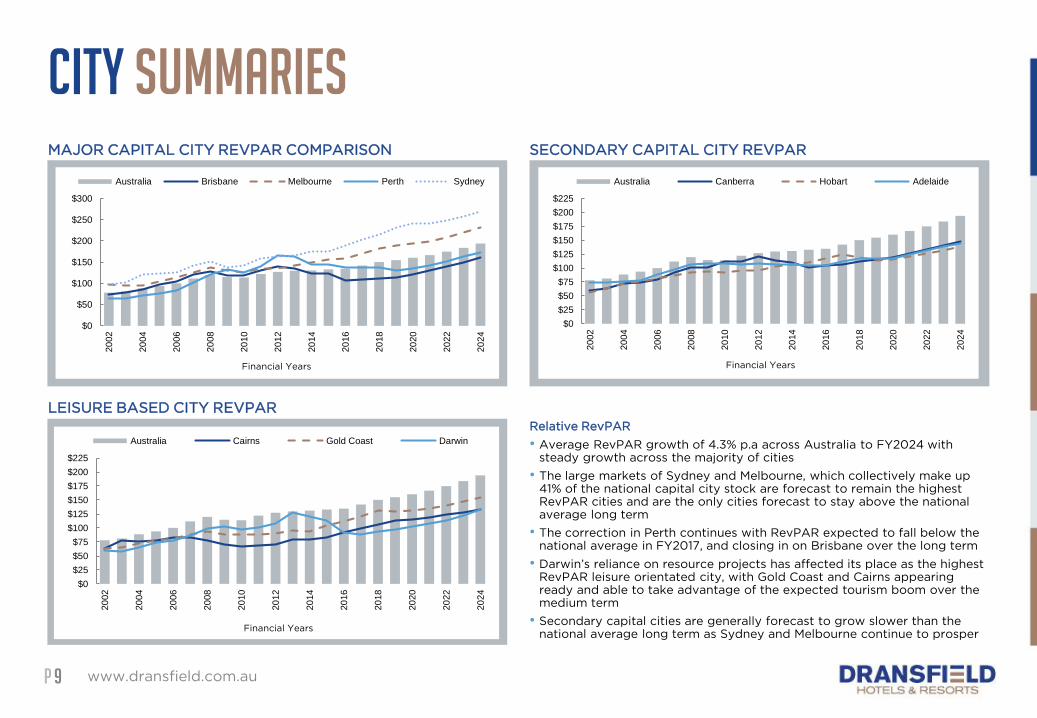
Relative RevPAR
• Average RevPAR growth of 4.3% p.a across Australia to FY2024 with steady growth across the majority of cities
• The large markets of Sydney and Melbourne, which collectively make up 41% of the national capital city stock are forecast to remain the highest RevPAR cities and are the only cities forecast to stay above the national average long term
• The correction in Perth continues with RevPAR expected to fall below the national average in FY2017, and closing in on Brisbane over the long term
• Darwin’s reliance on resource projects has affected its place as the highest RevPAR leisure orientated city, with Gold Coast and Cairns appearing ready and able to take advantage of the expected tourism boom over the medium term
• Secondary capital cities are generally forecast to grow slower than the national average long term as Sydney and Melbourne continue to prosper
www.dransfield.com.au9
MAJOR CAPITAL CITY REVPAR COMPARISON SECONDARY CAPITAL CITY REVPAR
LEISURE BASED CITY REVPAR
$0
$50
$100
$150
$200
$250
$300
20
02
20
04
20
06
20
08
20
10
20
12
20
14
20
16
20
18
20
20
20
22
20
24
Financial Years
Australia Brisbane Melbourne Perth Sydney
$0
$25
$50
$75
$100
$125
$150
$175
$200
$225
20
02
20
04
20
06
20
08
20
10
20
12
20
14
20
16
20
18
20
20
20
22
20
24
Financial Years
Australia Canberra Hobart Adelaide
$0
$25
$50
$75
$100
$125
$150
$175
$200
$225
20
02
20
04
20
06
20
08
20
10
20
12
20
14
20
16
20
18
20
20
20
22
20
24
Financial Years
Australia Cairns Gold Coast Darwin
P
MARKET TRENDSPositive outlook and capital availability is seeing record levels of transactions in almost every area
www.dransfield.com.au10
Market Consolidation
Big guys getting bigger for synergies in
IT centric distribution and marketing.
Newer and offshore operators still seek
positions in the local market with
significant new builds creating
opportunities
• Market consolidation on several fronts,
with operators, distribution and
ownership. Partly fueled by Capital
Markets appetite rather than just
operating metrics
• Major operators merging and aligning
– Starwood and Marriott
– Accor and
Fairmont/Raffles/Swissotel
– IHG and Kempinski
• Business complication is encouraging
the search for scale in distribution
and investment platforms
– Reaching out is now difficult as so
many different outlets available
– Mass/cut through/real power
needed to hold the attention,
though still need to be nimble
– Loyalty programs gaining power
and resonance
Development trends and Activity Uplift
Construction and proposal numbers infill Market
Response Allowances. Still room for more
• Development activity significantly lifts as the
cycle advances.
– Local resourcing gaining experience but
being stretched
– Identified projects in capital cities have
increased from 96 last year to 146 this year
• Positive demand sentiment and rising
performance metrics will entice additional
development.
• Increase in Luxury segments
• Refurbishment activity has been prominent over
the last 12-18 months and is expected to continue
over the medium term
– Refurbishment has been particularly
prominent in destinations where the
development trigger, which is generally
considered to be occupancy of 70%+ in
leisure destinations and 75%+ in Major
Capital Cities, has not yet been reached
– Older and tired stock needs to refurbish or
reposition to stay competitive. We are
seeing a two speed market where smaller
and independent hotels are increasingly
being left behind
• Stronger level of government sponsorship
(Crownland sites, government grants, space
bonuses, infrastructure grants)
Transaction Trends
Capital availability across a broad spectrum sees
transaction volumes continue to rise with diversity
• Transaction volumes continue to grow, increasing from
$2.6b in 2014 to $3.9b in 2015 as capital availability
continues to improve
• 2016 YTD (May) has started off in the same fashion with
nearly $700M worth of assets already trading
• Scarcity of investment product combined with
increased capital availability is driving asset
competition
– Combination of rising hotel earnings and falling
cost of debt adding to appetite with good
supply/demand equation in major cities
– Many first time/new investors open to the asset
class
– Portfolio transactions are both touted and
occurring as are regional, non institutional quality
and development assets
– New funds securing mandates including
development and initial investments
• Mixture of Australian and international investor
appetite.
– Asia continues to be the dominant international
continent
– Emergence of China continues. High interest in
trophy assets across major capital cities
– Australia is considered a safe to place to park
money
– Mainstream investors increasingly looking at hotels
as a respectable property class
• The falling $AUD has taken the edge of some investors
returns and been ignored by others
P
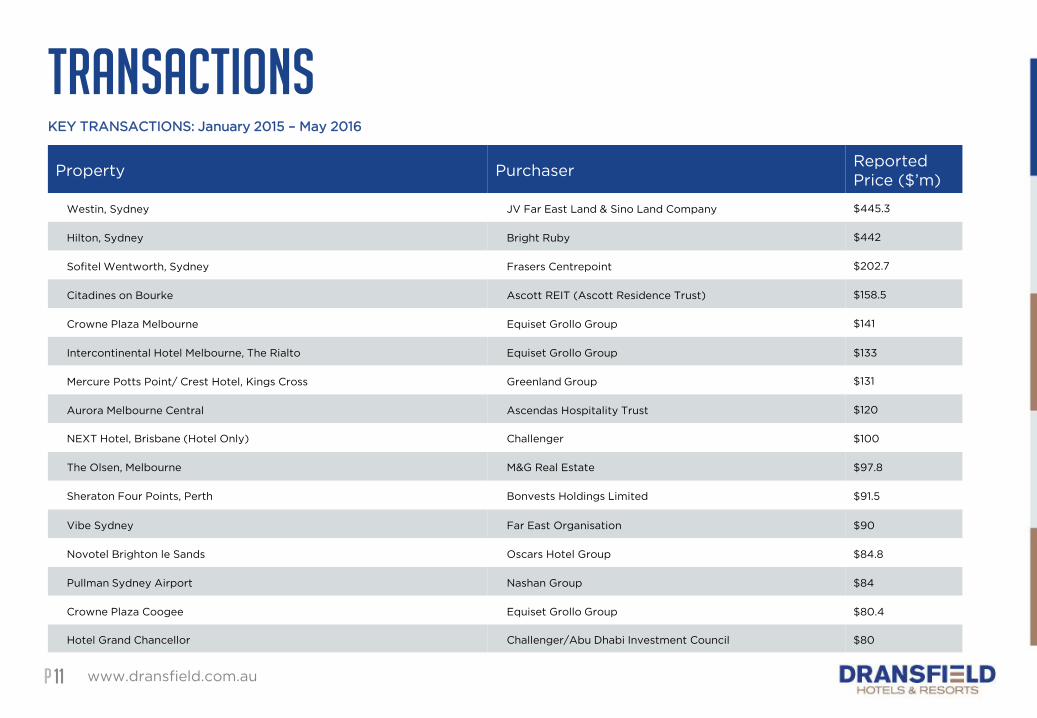
TransactionsKEY TRANSACTIONS: January 2015 – May 2016
www.dransfield.com.au11
Property PurchaserReported
Price ($’m)
Westin, Sydney JV Far East Land & Sino Land Company $445.3
Hilton, Sydney Bright Ruby $442
Sofitel Wentworth, Sydney Frasers Centrepoint $202.7
Citadines on Bourke Ascott REIT (Ascott Residence Trust) $158.5
Crowne Plaza Melbourne Equiset Grollo Group $141
Intercontinental Hotel Melbourne, The Rialto Equiset Grollo Group $133
Mercure Potts Point/ Crest Hotel, Kings Cross Greenland Group $131
Aurora Melbourne Central Ascendas Hospitality Trust $120
NEXT Hotel, Brisbane (Hotel Only) Challenger $100
The Olsen, Melbourne M&G Real Estate $97.8
Sheraton Four Points, Perth Bonvests Holdings Limited $91.5
Vibe Sydney Far East Organisation $90
Novotel Brighton le Sands Oscars Hotel Group $84.8
Pullman Sydney Airport Nashan Group $84
Crowne Plaza Coogee Equiset Grollo Group $80.4
Hotel Grand Chancellor Challenger/Abu Dhabi Investment Council $80
P
SUPPLY
www.dransfield.com.au12
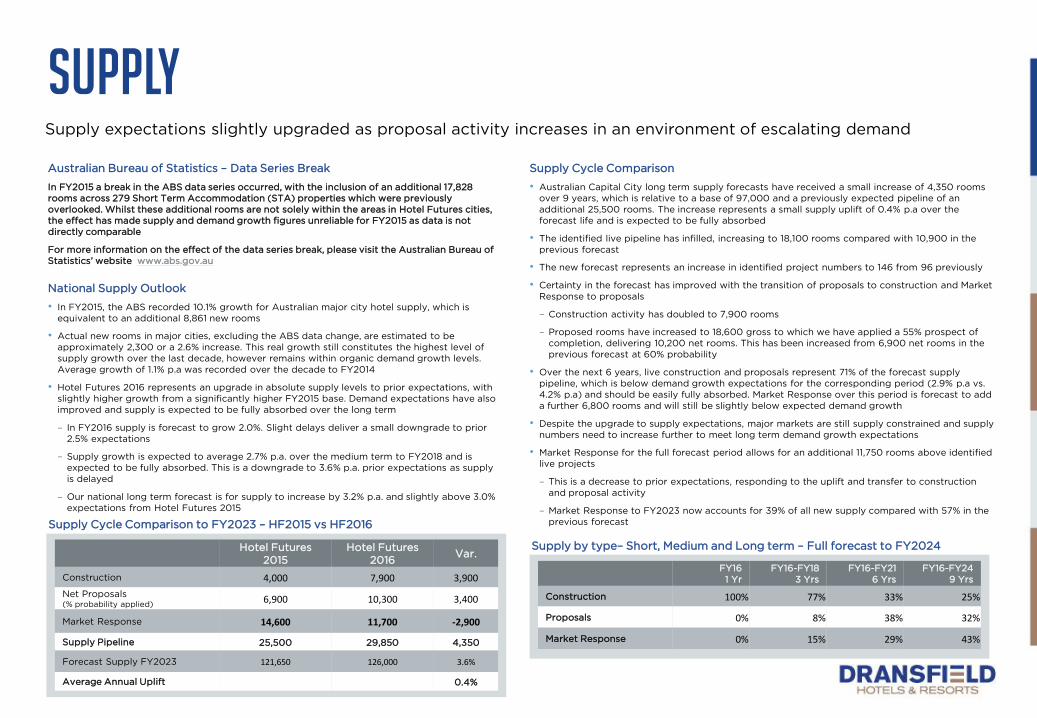
Australian Bureau of Statistics – Data Series Break
In FY2015 a break in the ABS data series occurred, with the inclusion of an additional 17,828
rooms across 279 Short Term Accommodation (STA) properties which were previously
overlooked. Whilst these additional rooms are not solely within the areas in Hotel Futures cities,
the effect has made supply and demand growth figures unreliable for FY2015 as data is not
directly comparable
For more information on the effect of the data series break, please visit the Australian Bureau of
Statistics’ website www.abs.gov.au
National Supply Outlook
• In FY2015, the ABS recorded 10.1% growth for Australian major city hotel supply, which is
equivalent to an additional 8,861 new rooms
• Actual new rooms in major cities, excluding the ABS data change, are estimated to be
approximately 2,300 or a 2.6% increase. This real growth still constitutes the highest level of
supply growth over the last decade, however remains within organic demand growth levels.
Average growth of 1.1% p.a was recorded over the decade to FY2014
• Hotel Futures 2016 represents an upgrade in absolute supply levels to prior expectations, with
slightly higher growth from a significantly higher FY2015 base. Demand expectations have also
improved and supply is expected to be fully absorbed over the long term
– In FY2016 supply is forecast to grow 2.0%. Slight delays deliver a small downgrade to prior
2.5% expectations
– Supply growth is expected to average 2.7% p.a. over the medium term to FY2018 and is
expected to be fully absorbed. This is a downgrade to 3.6% p.a. prior expectations as supply
is delayed
– Our national long term forecast is for supply to increase by 3.2% p.a. and slightly above 3.0%
expectations from Hotel Futures 2015
Supply expectations slightly upgraded as proposal activity increases in an environment of escalating demand
FY16
1 Yr
FY16-FY18
3 Yrs
FY16-FY21
6 Yrs
FY16-FY24
9 Yrs
Construction 100% 77% 33% 25%
Proposals 0% 8% 38% 32%
Market Response 0% 15% 29% 43%
Supply by type– Short, Medium and Long term – Full forecast to FY2024Hotel Futures
2015
Hotel Futures
2016Var.
Construction 4,000 7,900 3,900
Net Proposals(% probability applied)
6,900 10,300 3,400
Market Response 14,600 11,700 -2,900
Supply Pipeline 25,500 29,850 4,350
Forecast Supply FY2023 121,650 126,000 3.6%
Average Annual Uplift 0.4%
Supply Cycle Comparison to FY2023 – HF2015 vs HF2016
Supply Cycle Comparison
• Australian Capital City long term supply forecasts have received a small increase of 4,350 rooms
over 9 years, which is relative to a base of 97,000 and a previously expected pipeline of an
additional 25,500 rooms. The increase represents a small supply uplift of 0.4% p.a over the
forecast life and is expected to be fully absorbed
• The identified live pipeline has infilled, increasing to 18,100 rooms compared with 10,900 in the
previous forecast
• The new forecast represents an increase in identified project numbers to 146 from 96 previously
• Certainty in the forecast has improved with the transition of proposals to construction and Market
Response to proposals
– Construction activity has doubled to 7,900 rooms
– Proposed rooms have increased to 18,600 gross to which we have applied a 55% prospect of
completion, delivering 10,200 net rooms. This has been increased from 6,900 net rooms in the
previous forecast at 60% probability
• Over the next 6 years, live construction and proposals represent 71% of the forecast supply
pipeline, which is below demand growth expectations for the corresponding period (2.9% p.a vs.
4.2% p.a) and should be easily fully absorbed. Market Response over this period is forecast to add
a further 6,800 rooms and will still be slightly below expected demand growth
• Despite the upgrade to supply expectations, major markets are still supply constrained and supply
numbers need to increase further to meet long term demand growth expectations
• Market Response for the full forecast period allows for an additional 11,750 rooms above identified
live projects
– This is a decrease to prior expectations, responding to the uplift and transfer to construction
and proposal activity
– Market Response to FY2023 now accounts for 39% of all new supply compared with 57% in the
previous forecast
P
SUPPLY national
www.dransfield.com.au13
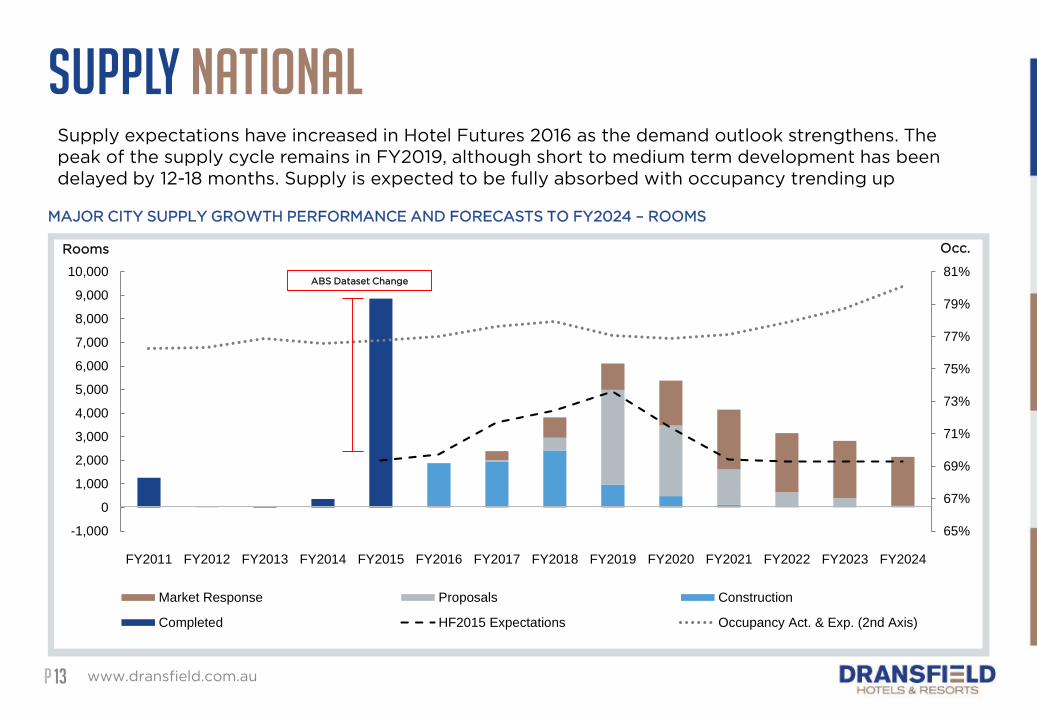
MAJOR CITY SUPPLY GROWTH PERFORMANCE AND FORECASTS TO FY2024 – ROOMS
Supply expectations have increased in Hotel Futures 2016 as the demand outlook strengthens. The
peak of the supply cycle remains in FY2019, although short to medium term development has been
delayed by 12-18 months. Supply is expected to be fully absorbed with occupancy trending up
65%
67%
69%
71%
73%
75%
77%
79%
81%
-1,000
0
1,000
2,000
3,000
4,000
5,000
6,000
7,000
8,000
9,000
10,000
FY2011 FY2012 FY2013 FY2014 FY2015 FY2016 FY2017 FY2018 FY2019 FY2020 FY2021 FY2022 FY2023 FY2024
Market Response Proposals Construction
Completed HF2015 Expectations Occupancy Act. & Exp. (2nd Axis)
Rooms Occ.
ABS Dataset Change
P
SUPPLY national
www.dransfield.com.au14
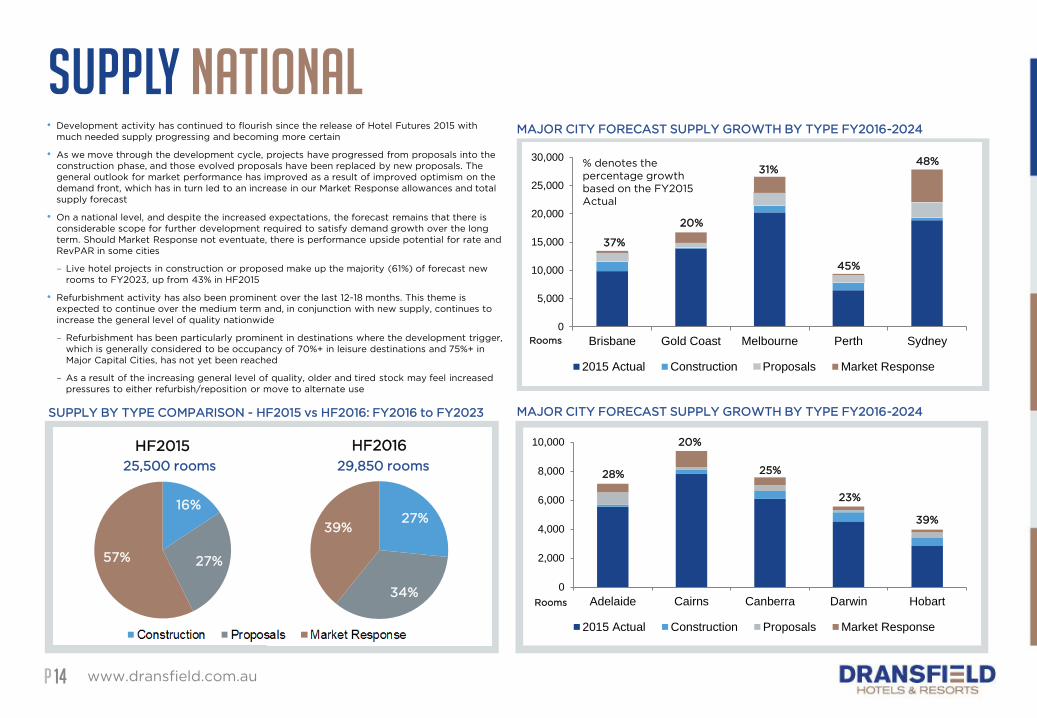
MAJOR CITY FORECAST SUPPLY GROWTH BY TYPE FY2016-2024• Development activity has continued to flourish since the release of Hotel Futures 2015 with
much needed supply progressing and becoming more certain
• As we move through the development cycle, projects have progressed from proposals into the
construction phase, and those evolved proposals have been replaced by new proposals. The
general outlook for market performance has improved as a result of improved optimism on the
demand front, which has in turn led to an increase in our Market Response allowances and total
supply forecast
• On a national level, and despite the increased expectations, the forecast remains that there is
considerable scope for further development required to satisfy demand growth over the long
term. Should Market Response not eventuate, there is performance upside potential for rate and
RevPAR in some cities
– Live hotel projects in construction or proposed make up the majority (61%) of forecast new
rooms to FY2023, up from 43% in HF2015
• Refurbishment activity has also been prominent over the last 12-18 months. This theme is
expected to continue over the medium term and, in conjunction with new supply, continues to
increase the general level of quality nationwide
– Refurbishment has been particularly prominent in destinations where the development trigger,
which is generally considered to be occupancy of 70%+ in leisure destinations and 75%+ in
Major Capital Cities, has not yet been reached
– As a result of the increasing general level of quality, older and tired stock may feel increased
pressures to either refurbish/reposition or move to alternate use
SUPPLY BY TYPE COMPARISON - HF2015 vs HF2016: FY2016 to FY2023
16%
27%57%
HF2015
27%
34%
39%
HF2016
25,500 rooms 29,850 rooms
0
5,000
10,000
15,000
20,000
25,000
30,000
Brisbane Gold Coast Melbourne Perth Sydney
2015 Actual Construction Proposals Market Response
37%
20%
31%
45%
48%
0
2,000
4,000
6,000
8,000
10,000
Adelaide Cairns Canberra Darwin Hobart
2015 Actual Construction Proposals Market Response
28%
20%
25%
23%
39%
% denotes the
percentage growth
based on the FY2015
Actual
MAJOR CITY FORECAST SUPPLY GROWTH BY TYPE FY2016-2024
Rooms
Rooms
P
TFC FORECAST MOVEMENT – Long Term to FY2023
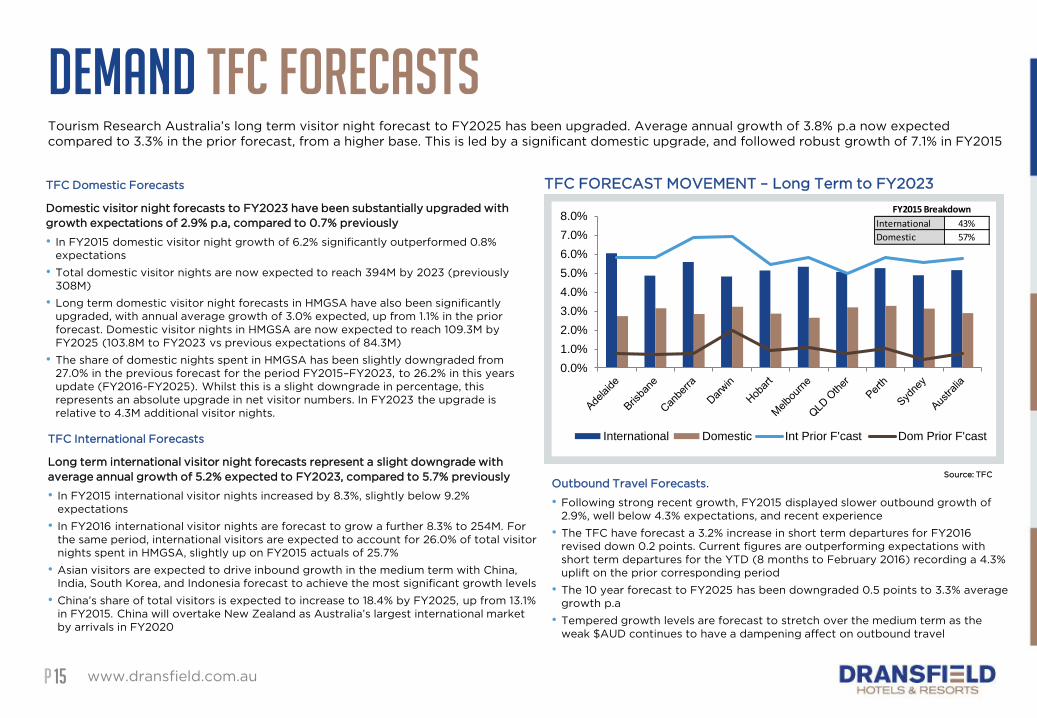
DEMAND TFC FORECASTSTourism Research Australia’s long term visitor night forecast to FY2025 has been upgraded. Average annual growth of 3.8% p.a now expected
compared to 3.3% in the prior forecast, from a higher base. This is led by a significant domestic upgrade, and followed robust growth of 7.1% in FY2015
www.dransfield.com.au15
TFC International Forecasts
Long term international visitor night forecasts represent a slight downgrade with
average annual growth of 5.2% expected to FY2023, compared to 5.7% previously
• In FY2015 international visitor nights increased by 8.3%, slightly below 9.2%
expectations
• In FY2016 international visitor nights are forecast to grow a further 8.3% to 254M. For
the same period, international visitors are expected to account for 26.0% of total visitor
nights spent in HMGSA, slightly up on FY2015 actuals of 25.7%
• Asian visitors are expected to drive inbound growth in the medium term with China,
India, South Korea, and Indonesia forecast to achieve the most significant growth levels
• China’s share of total visitors is expected to increase to 18.4% by FY2025, up from 13.1%
in FY2015. China will overtake New Zealand as Australia’s largest international market
by arrivals in FY2020
TFC Domestic Forecasts
Domestic visitor night forecasts to FY2023 have been substantially upgraded with
growth expectations of 2.9% p.a, compared to 0.7% previously
• In FY2015 domestic visitor night growth of 6.2% significantly outperformed 0.8%
expectations
• Total domestic visitor nights are now expected to reach 394M by 2023 (previously
308M)
• Long term domestic visitor night forecasts in HMGSA have also been significantly
upgraded, with annual average growth of 3.0% expected, up from 1.1% in the prior
forecast. Domestic visitor nights in HMGSA are now expected to reach 109.3M by
FY2025 (103.8M to FY2023 vs previous expectations of 84.3M)
• The share of domestic nights spent in HMGSA has been slightly downgraded from
27.0% in the previous forecast for the period FY2015–FY2023, to 26.2% in this years
update (FY2016-FY2025). Whilst this is a slight downgrade in percentage, this
represents an absolute upgrade in net visitor numbers. In FY2023 the upgrade is
relative to 4.3M additional visitor nights.
Outbound Travel Forecasts.
• Following strong recent growth, FY2015 displayed slower outbound growth of
2.9%, well below 4.3% expectations, and recent experience
• The TFC have forecast a 3.2% increase in short term departures for FY2016
revised down 0.2 points. Current figures are outperforming expectations with
short term departures for the YTD (8 months to February 2016) recording a 4.3%
uplift on the prior corresponding period
• The 10 year forecast to FY2025 has been downgraded 0.5 points to 3.3% average
growth p.a
• Tempered growth levels are forecast to stretch over the medium term as the
weak $AUD continues to have a dampening affect on outbound travel
0.0%
1.0%
2.0%
3.0%
4.0%
5.0%
6.0%
7.0%
8.0%
International Domestic Int Prior F'cast Dom Prior F'cast
International 43%
Domestic 57%
FY2015 Breakdown
Source: TFC
P
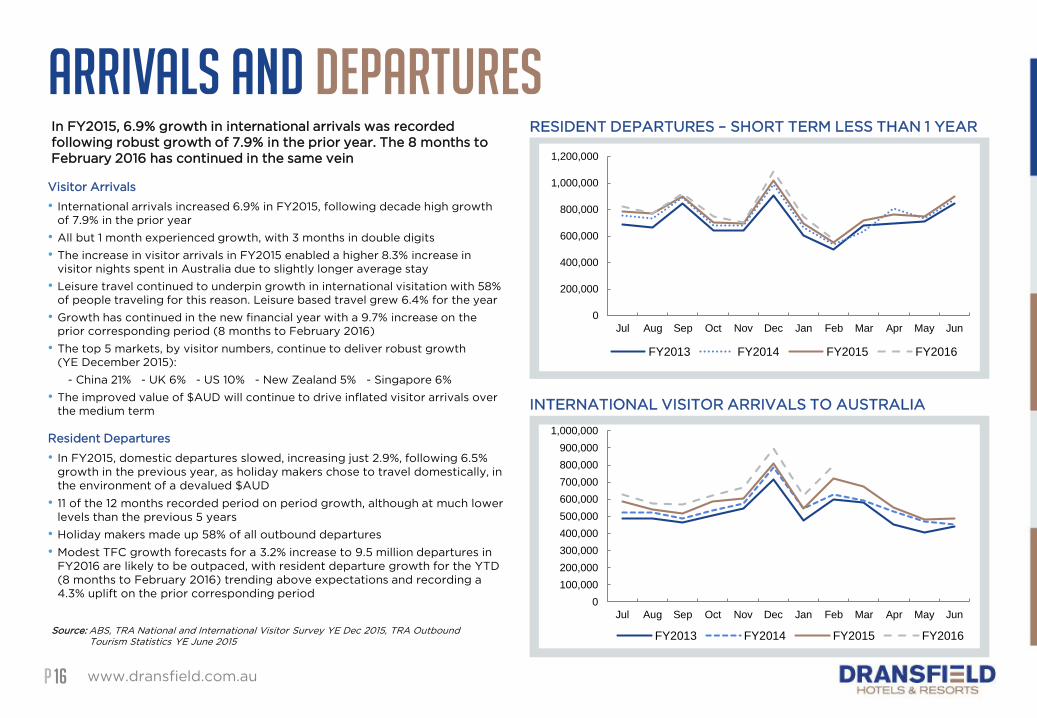
RESIDENT DEPARTURES – SHORT TERM LESS THAN 1 YEAR
ARRIVALS AND DEPARTURES
www.dransfield.com.au16
Resident Departures
• In FY2015, domestic departures slowed, increasing just 2.9%, following 6.5%
growth in the previous year, as holiday makers chose to travel domestically, in
the environment of a devalued $AUD
• 11 of the 12 months recorded period on period growth, although at much lower
levels than the previous 5 years
• Holiday makers made up 58% of all outbound departures
• Modest TFC growth forecasts for a 3.2% increase to 9.5 million departures in
FY2016 are likely to be outpaced, with resident departure growth for the YTD
(8 months to February 2016) trending above expectations and recording a
4.3% uplift on the prior corresponding period
Visitor Arrivals
• International arrivals increased 6.9% in FY2015, following decade high growth
of 7.9% in the prior year
• All but 1 month experienced growth, with 3 months in double digits
• The increase in visitor arrivals in FY2015 enabled a higher 8.3% increase in
visitor nights spent in Australia due to slightly longer average stay
• Leisure travel continued to underpin growth in international visitation with 58%
of people traveling for this reason. Leisure based travel grew 6.4% for the year
• Growth has continued in the new financial year with a 9.7% increase on the
prior corresponding period (8 months to February 2016)
• The top 5 markets, by visitor numbers, continue to deliver robust growth
(YE December 2015):
- China 21% - UK 6% - US 10% - New Zealand 5% - Singapore 6%
• The improved value of $AUD will continue to drive inflated visitor arrivals over
the medium termINTERNATIONAL VISITOR ARRIVALS TO AUSTRALIA
In FY2015, 6.9% growth in international arrivals was recorded
following robust growth of 7.9% in the prior year. The 8 months to
February 2016 has continued in the same vein
Source: ABS, TRA National and International Visitor Survey YE Dec 2015, TRA Outbound
Tourism Statistics YE June 2015
0
200,000
400,000
600,000
800,000
1,000,000
1,200,000
Jul Aug Sep Oct Nov Dec Jan Feb Mar Apr May Jun
FY2013 FY2014 FY2015 FY2016
0
100,000
200,000
300,000
400,000
500,000
600,000
700,000
800,000
900,000
1,000,000
Jul Aug Sep Oct Nov Dec Jan Feb Mar Apr May Jun
FY2013 FY2014 FY2015 FY2016
P
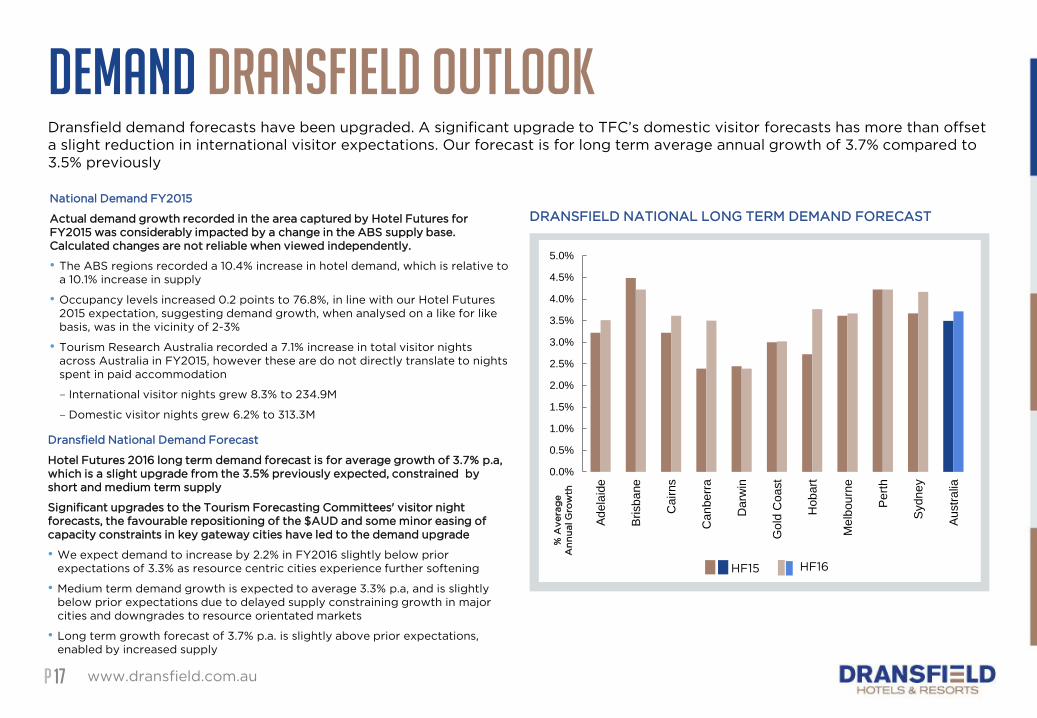
DRANSFIELD NATIONAL LONG TERM DEMAND FORECAST
DEMAND Dransfield OutlookDransfield demand forecasts have been upgraded. A significant upgrade to TFC’s domestic visitor forecasts has more than offset
a slight reduction in international visitor expectations. Our forecast is for long term average annual growth of 3.7% compared to
3.5% previously
www.dransfield.com.au17
Dransfield National Demand Forecast
Hotel Futures 2016 long term demand forecast is for average growth of 3.7% p.a,
which is a slight upgrade from the 3.5% previously expected, constrained by
short and medium term supply
Significant upgrades to the Tourism Forecasting Committees' visitor night
forecasts, the favourable repositioning of the $AUD and some minor easing of
capacity constraints in key gateway cities have led to the demand upgrade
• We expect demand to increase by 2.2% in FY2016 slightly below prior
expectations of 3.3% as resource centric cities experience further softening
• Medium term demand growth is expected to average 3.3% p.a, and is slightly
below prior expectations due to delayed supply constraining growth in major
cities and downgrades to resource orientated markets
• Long term growth forecast of 3.7% p.a. is slightly above prior expectations,
enabled by increased supply
National Demand FY2015
Actual demand growth recorded in the area captured by Hotel Futures for
FY2015 was considerably impacted by a change in the ABS supply base.
Calculated changes are not reliable when viewed independently.
• The ABS regions recorded a 10.4% increase in hotel demand, which is relative to
a 10.1% increase in supply
• Occupancy levels increased 0.2 points to 76.8%, in line with our Hotel Futures
2015 expectation, suggesting demand growth, when analysed on a like for like
basis, was in the vicinity of 2-3%
• Tourism Research Australia recorded a 7.1% increase in total visitor nights
across Australia in FY2015, however these are do not directly translate to nights
spent in paid accommodation
– International visitor nights grew 8.3% to 234.9M
– Domestic visitor nights grew 6.2% to 313.3M
0.0%
0.5%
1.0%
1.5%
2.0%
2.5%
3.0%
3.5%
4.0%
4.5%
5.0%
Ad
ela
ide
Bri
sb
ane
Cair
ns
Can
be
rra
Darw
in
Go
ld C
oa
st
Hob
art
Me
lbou
rne
Pe
rth
Sydn
ey
Au
str
alia
HF15 HF16%
Av
era
ge
An
nu
al G
row
th
PP
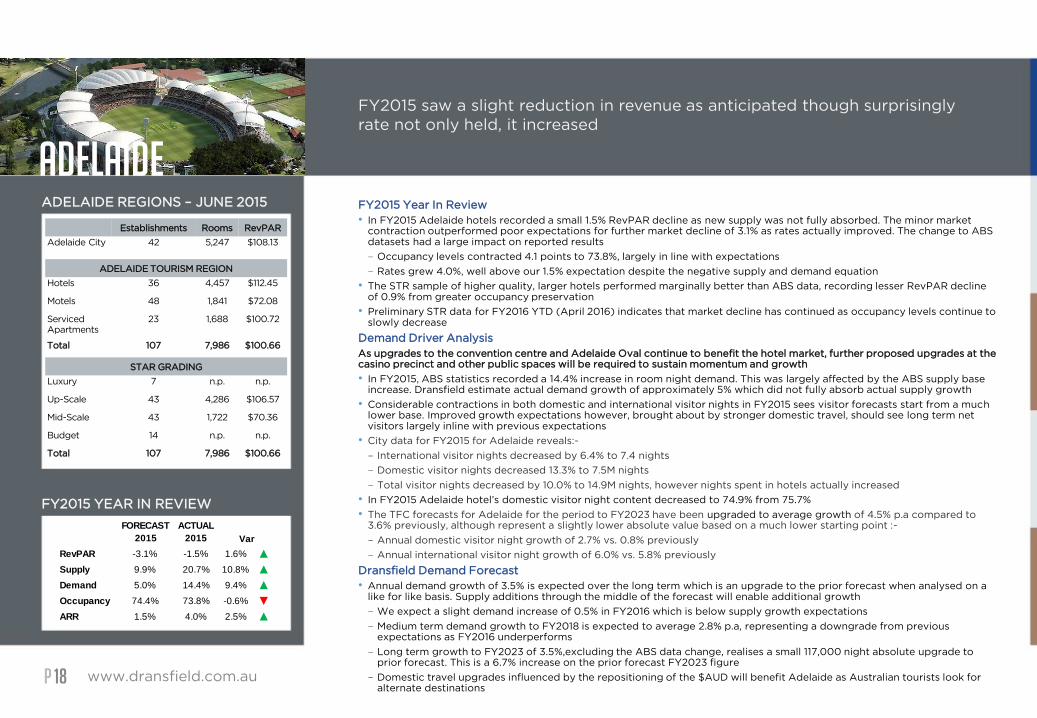
ADELAIDE
www.dransfield.com.au18
FY2015 saw a slight reduction in revenue as anticipated though surprisingly
rate not only held, it increased
ADELAIDE REGIONS – JUNE 2015
FY2015 YEAR IN REVIEW
Establishments Rooms RevPAR
Adelaide City 42 5,247 $108.13
ADELAIDE TOURISM REGION
Hotels 36 4,457 $112.45
Motels 48 1,841 $72.08
Serviced
Apartments
23 1,688 $100.72
Total 107 7,986 $100.66
STAR GRADING
Luxury 7 n.p. n.p.
Up-Scale 43 4,286 $106.57
Mid-Scale 43 1,722 $70.36
Budget 14 n.p. n.p.
Total 107 7,986 $100.66
FY2015 Year In Review
• In FY2015 Adelaide hotels recorded a small 1.5% RevPAR decline as new supply was not fully absorbed. The minor market contraction outperformed poor expectations for further market decline of 3.1% as rates actually improved. The change to ABS datasets had a large impact on reported results
– Occupancy levels contracted 4.1 points to 73.8%, largely in line with expectations
– Rates grew 4.0%, well above our 1.5% expectation despite the negative supply and demand equation
• The STR sample of higher quality, larger hotels performed marginally better than ABS data, recording lesser RevPAR decline of 0.9% from greater occupancy preservation
• Preliminary STR data for FY2016 YTD (April 2016) indicates that market decline has continued as occupancy levels continue to slowly decrease
Demand Driver Analysis
As upgrades to the convention centre and Adelaide Oval continue to benefit the hotel market, further proposed upgrades at thecasino precinct and other public spaces will be required to sustain momentum and growth
• In FY2015, ABS statistics recorded a 14.4% increase in room night demand. This was largely affected by the ABS supply base increase. Dransfield estimate actual demand growth of approximately 5% which did not fully absorb actual supply growth
• Considerable contractions in both domestic and international visitor nights in FY2015 sees visitor forecasts start from a much lower base. Improved growth expectations however, brought about by stronger domestic travel, should see long term net visitors largely inline with previous expectations
• City data for FY2015 for Adelaide reveals:-
– International visitor nights decreased by 6.4% to 7.4 nights
– Domestic visitor nights decreased 13.3% to 7.5M nights
– Total visitor nights decreased by 10.0% to 14.9M nights, however nights spent in hotels actually increased
• In FY2015 Adelaide hotel’s domestic visitor night content decreased to 74.9% from 75.7%
• The TFC forecasts for Adelaide for the period to FY2023 have been upgraded to average growth of 4.5% p.a compared to 3.6% previously, although represent a slightly lower absolute value based on a much lower starting point :-
– Annual domestic visitor night growth of 2.7% vs. 0.8% previously
– Annual international visitor night growth of 6.0% vs. 5.8% previously
Dransfield Demand Forecast
• Annual demand growth of 3.5% is expected over the long term which is an upgrade to the prior forecast when analysed on a like for like basis. Supply additions through the middle of the forecast will enable additional growth
– We expect a slight demand increase of 0.5% in FY2016 which is below supply growth expectations
– Medium term demand growth to FY2018 is expected to average 2.8% p.a, representing a downgrade from previous expectations as FY2016 underperforms
– Long term growth to FY2023 of 3.5%,excluding the ABS data change, realises a small 117,000 night absolute upgrade to prior forecast. This is a 6.7% increase on the prior forecast FY2023 figure
– Domestic travel upgrades influenced by the repositioning of the $AUD will benefit Adelaide as Australian tourists look for alternate destinations
FORECAST
2015
ACTUAL
2015
RevPAR -3.1% -1.5% 1.6% ▲
Supply 9.9% 20.7% 10.8% ▲
Demand 5.0% 14.4% 9.4% ▲
Occupancy 74.4% 73.8% -0.6% ▼
ARR 1.5% 4.0% 2.5% ▲
Var
PP
ADELAIDE
www.dransfield.com.au19
Adelaide supply has evolved, with previous expectations for new rooms being
met with a slight overall increase and perhaps matched by improved demand
growth expectations
Supply Actual
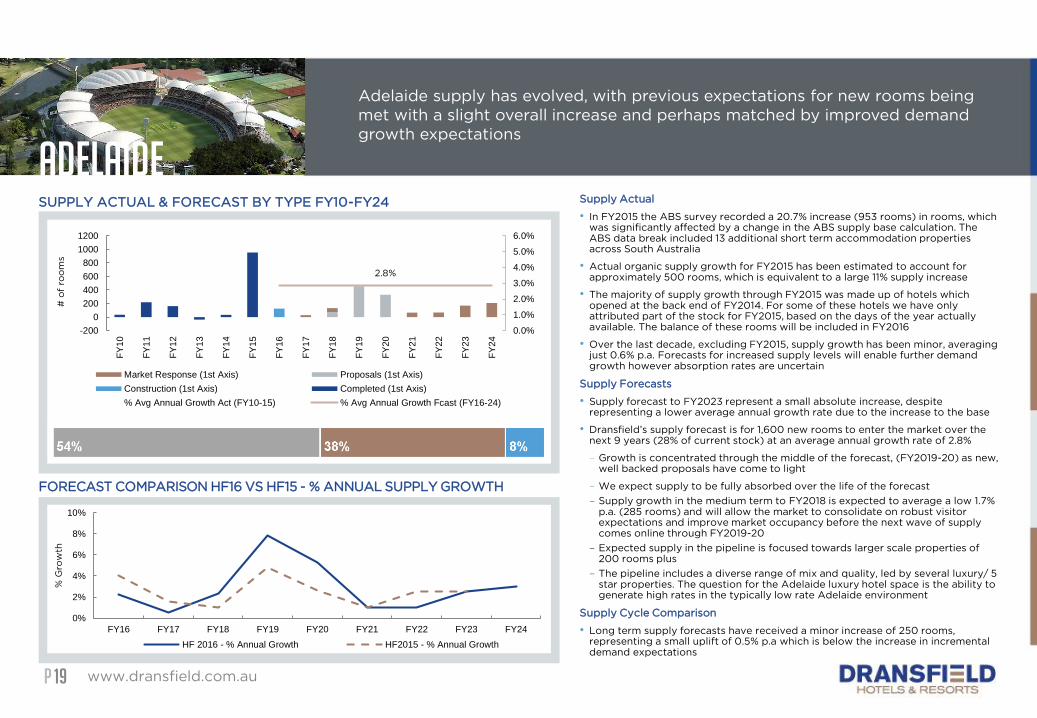
• In FY2015 the ABS survey recorded a 20.7% increase (953 rooms) in rooms, which was significantly affected by a change in the ABS supply base calculation. The ABS data break included 13 additional short term accommodation properties across South Australia
• Actual organic supply growth for FY2015 has been estimated to account for approximately 500 rooms, which is equivalent to a large 11% supply increase
• The majority of supply growth through FY2015 was made up of hotels which opened at the back end of FY2014. For some of these hotels we have only attributed part of the stock for FY2015, based on the days of the year actually available. The balance of these rooms will be included in FY2016
• Over the last decade, excluding FY2015, supply growth has been minor, averaging just 0.6% p.a. Forecasts for increased supply levels will enable further demand growth however absorption rates are uncertain
Supply Forecasts
• Supply forecast to FY2023 represent a small absolute increase, despite representing a lower average annual growth rate due to the increase to the base
• Dransfield’s supply forecast is for 1,600 new rooms to enter the market over the next 9 years (28% of current stock) at an average annual growth rate of 2.8%
– Growth is concentrated through the middle of the forecast, (FY2019-20) as new, well backed proposals have come to light
– We expect supply to be fully absorbed over the life of the forecast
– Supply growth in the medium term to FY2018 is expected to average a low 1.7% p.a. (285 rooms) and will allow the market to consolidate on robust visitor expectations and improve market occupancy before the next wave of supply comes online through FY2019-20
– Expected supply in the pipeline is focused towards larger scale properties of 200 rooms plus
– The pipeline includes a diverse range of mix and quality, led by several luxury/ 5 star properties. The question for the Adelaide luxury hotel space is the ability to generate high rates in the typically low rate Adelaide environment
Supply Cycle Comparison
• Long term supply forecasts have received a minor increase of 250 rooms, representing a small uplift of 0.5% p.a which is below the increase in incremental demand expectations
SUPPLY ACTUAL & FORECAST BY TYPE FY10-FY24
FORECAST COMPARISON HF16 VS HF15 - % ANNUAL SUPPLY GROWTH
2.8%
0.0%
1.0%
2.0%
3.0%
4.0%
5.0%
6.0%
-200
0
200
400
600
800
1000
1200
FY
10
FY
11
FY
12
FY
13
FY
14
FY
15
FY
16
FY
17
FY
18
FY
19
FY
20
FY
21
FY
22
FY
23
FY
24
# o
f ro
om
s
Market Response (1st Axis) Proposals (1st Axis)
Construction (1st Axis) Completed (1st Axis)
% Avg Annual Growth Act (FY10-15) % Avg Annual Growth Fcast (FY16-24)
0%
2%
4%
6%
8%
10%
FY16 FY17 FY18 FY19 FY20 FY21 FY22 FY23 FY24
% G
row
th
HF 2016 - % Annual Growth HF2015 - % Annual Growth
PP
ADELAIDE
www.dransfield.com.au20
Long term RevPAR expectations are for average 3.6% growth with higher 3.9%
in the medium term. Slight downgrade off a lower base and lower FY2016 with
an increase in mid term supply. No more rooms please
ADELAIDE CITY REAL REVPAR
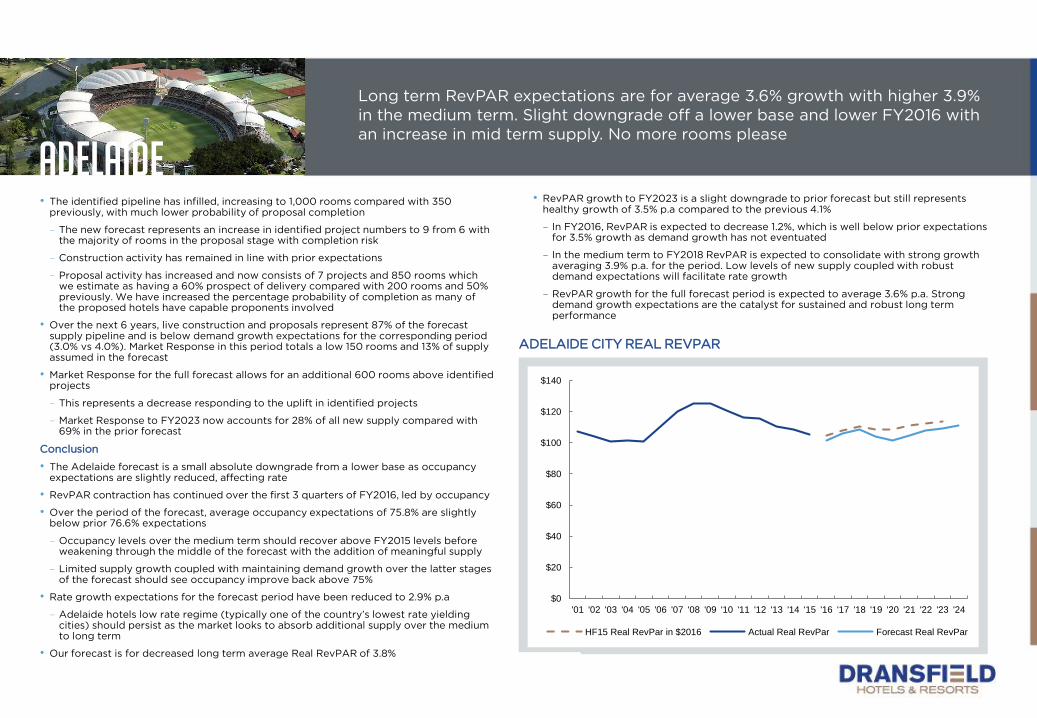
• RevPAR growth to FY2023 is a slight downgrade to prior forecast but still represents healthy growth of 3.5% p.a compared to the previous 4.1%
– In FY2016, RevPAR is expected to decrease 1.2%, which is well below prior expectations for 3.5% growth as demand growth has not eventuated
– In the medium term to FY2018 RevPAR is expected to consolidate with strong growth averaging 3.9% p.a. for the period. Low levels of new supply coupled with robust demand expectations will facilitate rate growth
– RevPAR growth for the full forecast period is expected to average 3.6% p.a. Strong demand growth expectations are the catalyst for sustained and robust long term performance
$0
$20
$40
$60
$80
$100
$120
$140
'01 '02 '03 '04 '05 '06 '07 '08 '09 '10 '11 '12 '13 '14 '15 '16 '17 '18 '19 '20 '21 '22 '23 '24
HF15 Real RevPar in $2016 Actual Real RevPar Forecast Real RevPar
• The identified pipeline has infilled, increasing to 1,000 rooms compared with 350 previously, with much lower probability of proposal completion
– The new forecast represents an increase in identified project numbers to 9 from 6 with the majority of rooms in the proposal stage with completion risk
– Construction activity has remained in line with prior expectations
– Proposal activity has increased and now consists of 7 projects and 850 rooms which we estimate as having a 60% prospect of delivery compared with 200 rooms and 50% previously. We have increased the percentage probability of completion as many of the proposed hotels have capable proponents involved
• Over the next 6 years, live construction and proposals represent 87% of the forecast supply pipeline and is below demand growth expectations for the corresponding period (3.0% vs 4.0%). Market Response in this period totals a low 150 rooms and 13% of supply assumed in the forecast
• Market Response for the full forecast allows for an additional 600 rooms above identified projects
– This represents a decrease responding to the uplift in identified projects
– Market Response to FY2023 now accounts for 28% of all new supply compared with 69% in the prior forecast
Conclusion
• The Adelaide forecast is a small absolute downgrade from a lower base as occupancy expectations are slightly reduced, affecting rate
• RevPAR contraction has continued over the first 3 quarters of FY2016, led by occupancy
• Over the period of the forecast, average occupancy expectations of 75.8% are slightly below prior 76.6% expectations
– Occupancy levels over the medium term should recover above FY2015 levels before weakening through the middle of the forecast with the addition of meaningful supply
– Limited supply growth coupled with maintaining demand growth over the latter stages of the forecast should see occupancy improve back above 75%
• Rate growth expectations for the forecast period have been reduced to 2.9% p.a
– Adelaide hotels low rate regime (typically one of the country’s lowest rate yielding cities) should persist as the market looks to absorb additional supply over the medium to long term
• Our forecast is for decreased long term average Real RevPAR of 3.8%
PP
ADELAIDE
www.dransfield.com.au21
Long term RevPAR expectations are for average 3.6% growth with higher 3.9%
in the medium term. Slight downgrade off a lower base and lower FY2016 with
an increase in mid term supply. No more rooms please
ACTUAL FORECAST
ADELAIDE CITY – HOTELS, MOTELS AND SERVICE APARTMENTS
Year RoomsSupply %
Chng
Demand
% ChngARR % Chng RevPAR % Chng
$2015
Real
RevPAR
Occ
HISTORICAL
FY2001 3,518 2.3% 1.2% $109.34 -2.9% $74.51 -3.9% $107.54 68.1%
FY2002 3,691 4.9% 3.4% $110.38 0.9% $74.09 -0.6% $103.99 67.1%
FY2003 4,152 12.5% 10.8% $111.54 1.1% $73.74 -0.5% $100.79 66.1%
FY2004 4,325 4.2% 4.7% $114.23 2.4% $75.91 2.9% $101.24 66.4%
FY2005 4,451 2.9% 7.1% $112.02 -1.9% $77.43 2.0% $100.77 69.1%
FY2006 4,276 -3.9% 3.6% $118.67 5.9% $88.43 14.2% $110.68 74.5%
FY2007 4,159 -2.7% 1.3% $126.29 6.4% $98.06 10.9% $120.23 77.6%
FY2008 4,147 -0.3% -0.3% $137.49 8.9% $106.71 8.8% $125.21 77.6%
FY2009 4,186 0.9% -0.9% $142.43 3.6% $108.56 1.7% $125.54 76.2%
FY2010 4,220 0.8% 1.7% $140.07 -1.7% $107.73 -0.8% $120.89 76.9%
FY2011 4,439 5.2% 3.0% $142.34 1.6% $107.15 -0.5% $116.06 75.3%
FY2012 4,602 3.7% 3.0% $144.34 1.4% $107.97 0.8% $115.59 74.8%
FY2013 4,564 -0.8% -0.6% $141.48 -2.0% $106.03 -1.8% $110.85 74.9%
FY2014 4,597 0.7% 4.7% $137.34 -2.9% $106.97 0.9% $108.58 77.9%
FY2015 5,550 20.7% 14.4% $142.82 4.0% $105.42 -1.5% $105.42 73.8%
Actual Avg FY 2001 -
20153.4% 3.8% 1.7% 2.2% 73.1%
Avg FY 11-15 5.9% 4.9% 0.4% -0.4% $111.30 75.3%
Avg FY 12-15 6.9% 6.2% -0.3% -0.8% $108.28 75.6%
Year RoomsSupply %
Chng
Demand
% ChngARR % Chng RevPAR % Chng
$2015
Real
RevPAR
Occ
FORECAST
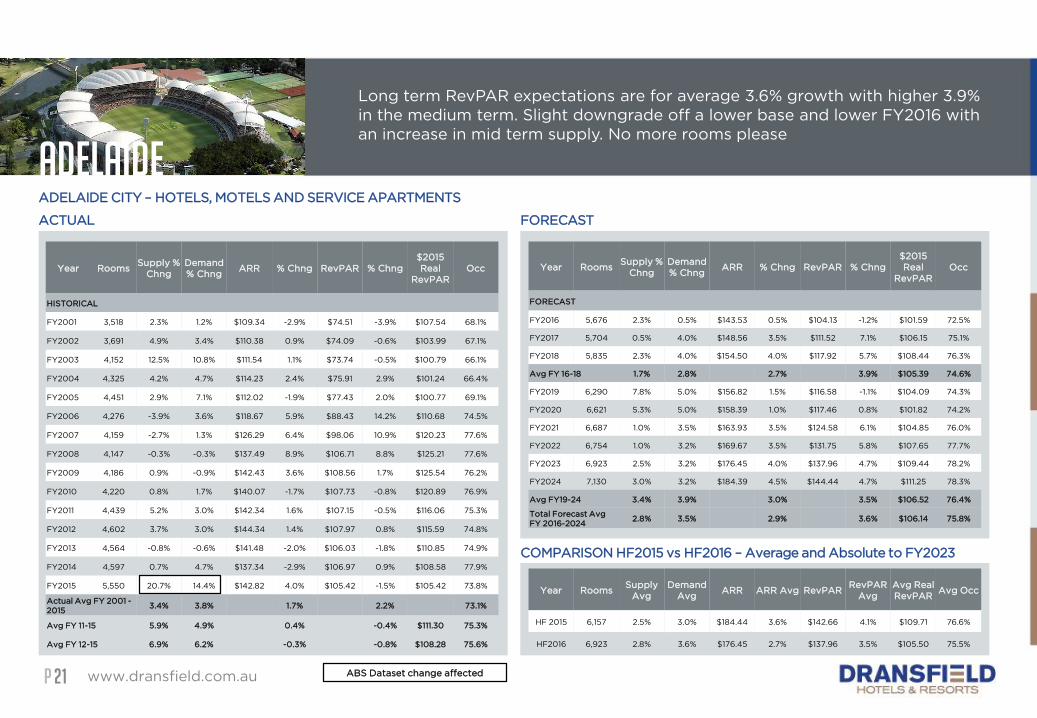
FY2016 5,676 2.3% 0.5% $143.53 0.5% $104.13 -1.2% $101.59 72.5%
FY2017 5,704 0.5% 4.0% $148.56 3.5% $111.52 7.1% $106.15 75.1%
FY2018 5,835 2.3% 4.0% $154.50 4.0% $117.92 5.7% $108.44 76.3%
Avg FY 16-18 1.7% 2.8% 2.7% 3.9% $105.39 74.6%
FY2019 6,290 7.8% 5.0% $156.82 1.5% $116.58 -1.1% $104.09 74.3%
FY2020 6,621 5.3% 5.0% $158.39 1.0% $117.46 0.8% $101.82 74.2%
FY2021 6,687 1.0% 3.5% $163.93 3.5% $124.58 6.1% $104.85 76.0%
FY2022 6,754 1.0% 3.2% $169.67 3.5% $131.75 5.8% $107.65 77.7%
FY2023 6,923 2.5% 3.2% $176.45 4.0% $137.96 4.7% $109.44 78.2%
FY2024 7,130 3.0% 3.2% $184.39 4.5% $144.44 4.7% $111.25 78.3%
Avg FY19-24 3.4% 3.9% 3.0% 3.5% $106.52 76.4%
Total Forecast Avg
FY 2016-20242.8% 3.5% 2.9% 3.6% $106.14 75.8%
COMPARISON HF2015 vs HF2016 – Average and Absolute to FY2023
Year RoomsSupply
Avg
Demand
Avg ARR ARR Avg RevPAR
RevPAR
Avg
Avg Real
RevPARAvg Occ
HF 2015 6,157 2.5% 3.0% $184.44 3.6% $142.66 4.1% $109.71 76.6%
HF2016 6,923 2.8% 3.6% $176.45 2.7% $137.96 3.5% $105.50 75.5%
ABS Dataset change affected
PP
Brisbane
www.dransfield.com.au22
FY2015 RevPAR was neutral, performing as expected however FY2016 will see
a large decline as the impact of the G20 reverses and new supply is not
absorbed
BRISBANE REGIONS – JUNE 2015
FY2015 YEAR IN REVIEW
Est Rooms RevPAR
Brisbane City
Core
85 10,196 $111.75
BRISBANE TOURISM REGION
Hotels 43 5,603 $131.85
Motels 95 4,104 $86.64
Serviced
Apartments
82 6,155 $110.85
Total 220 15,862 $111.98
STAR GRADING
Luxury 7 1,409 $182.97
Up-Scale 104 10,157 $117.51
Mid-Scale 99 3,936 $76.70
Budget 10 360 $64.02
Total 220 15,862 $111.98
FY2015 Year in Review
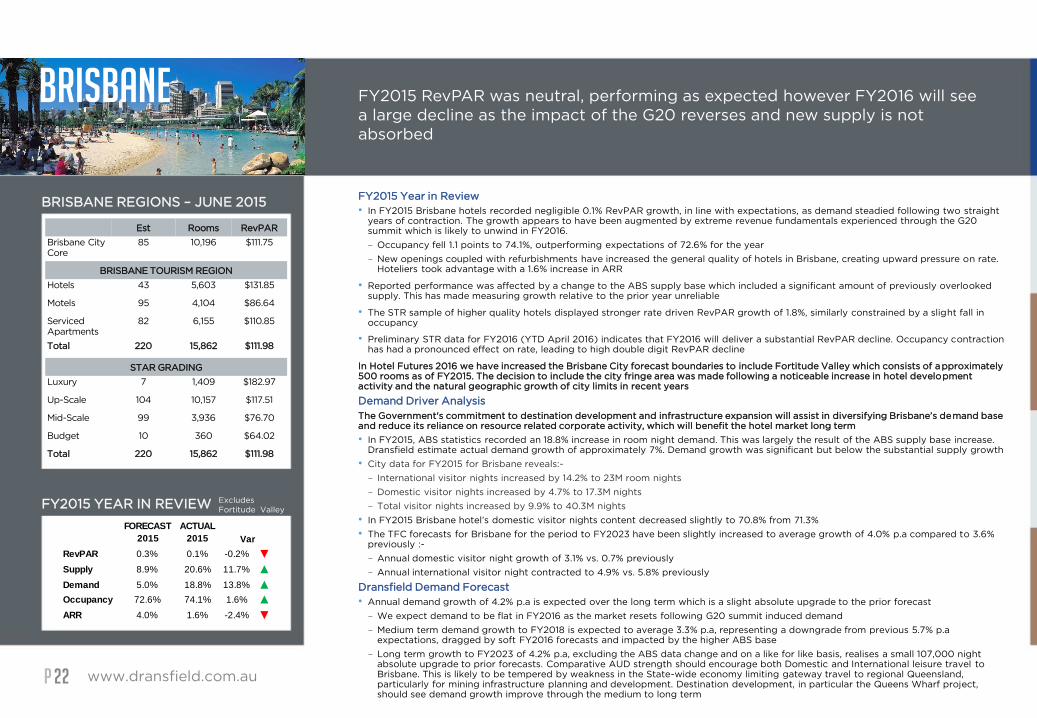
• In FY2015 Brisbane hotels recorded negligible 0.1% RevPAR growth, in line with expectations, as demand steadied following two straight years of contraction. The growth appears to have been augmented by extreme revenue fundamentals experienced through the G20 summit which is likely to unwind in FY2016.
– Occupancy fell 1.1 points to 74.1%, outperforming expectations of 72.6% for the year
– New openings coupled with refurbishments have increased the general quality of hotels in Brisbane, creating upward pressure on rate. Hoteliers took advantage with a 1.6% increase in ARR
• Reported performance was affected by a change to the ABS supply base which included a significant amount of previously overlooked supply. This has made measuring growth relative to the prior year unreliable
• The STR sample of higher quality hotels displayed stronger rate driven RevPAR growth of 1.8%, similarly constrained by a slight fall in occupancy
• Preliminary STR data for FY2016 (YTD April 2016) indicates that FY2016 will deliver a substantial RevPAR decline. Occupancy contraction has had a pronounced effect on rate, leading to high double digit RevPAR decline
In Hotel Futures 2016 we have increased the Brisbane City forecast boundaries to include Fortitude Valley which consists of approximately 500 rooms as of FY2015. The decision to include the city fringe area was made following a noticeable increase in hotel development activity and the natural geographic growth of city limits in recent years
Demand Driver Analysis
The Government's commitment to destination development and infrastructure expansion will assist in diversifying Brisbane’s demand base and reduce its reliance on resource related corporate activity, which will benefit the hotel market long term
• In FY2015, ABS statistics recorded an 18.8% increase in room night demand. This was largely the result of the ABS supply base increase. Dransfield estimate actual demand growth of approximately 7%. Demand growth was significant but below the substantial supply growth
• City data for FY2015 for Brisbane reveals:-
– International visitor nights increased by 14.2% to 23M room nights
– Domestic visitor nights increased by 4.7% to 17.3M nights
– Total visitor nights increased by 9.9% to 40.3M nights
• In FY2015 Brisbane hotel’s domestic visitor nights content decreased slightly to 70.8% from 71.3%
• The TFC forecasts for Brisbane for the period to FY2023 have been slightly increased to average growth of 4.0% p.a compared to 3.6% previously :-
– Annual domestic visitor night growth of 3.1% vs. 0.7% previously
– Annual international visitor night contracted to 4.9% vs. 5.8% previously
Dransfield Demand Forecast
• Annual demand growth of 4.2% p.a is expected over the long term which is a slight absolute upgrade to the prior forecast
– We expect demand to be flat in FY2016 as the market resets following G20 summit induced demand
– Medium term demand growth to FY2018 is expected to average 3.3% p.a, representing a downgrade from previous 5.7% p.a expectations, dragged by soft FY2016 forecasts and impacted by the higher ABS base
– Long term growth to FY2023 of 4.2% p.a, excluding the ABS data change and on a like for like basis, realises a small 107,000 night absolute upgrade to prior forecasts. Comparative AUD strength should encourage both Domestic and International leisure travel toBrisbane. This is likely to be tempered by weakness in the State-wide economy limiting gateway travel to regional Queensland, particularly for mining infrastructure planning and development. Destination development, in particular the Queens Wharf project, should see demand growth improve through the medium to long term
FORECAST
2015
ACTUAL
2015
RevPAR 0.3% 0.1% -0.2% ▼
Supply 8.9% 20.6% 11.7% ▲
Demand 5.0% 18.8% 13.8% ▲
Occupancy 72.6% 74.1% 1.6% ▲
ARR 4.0% 1.6% -2.4% ▼
Var
Excludes
Fortitude Valley
PP www.dransfield.com.au23
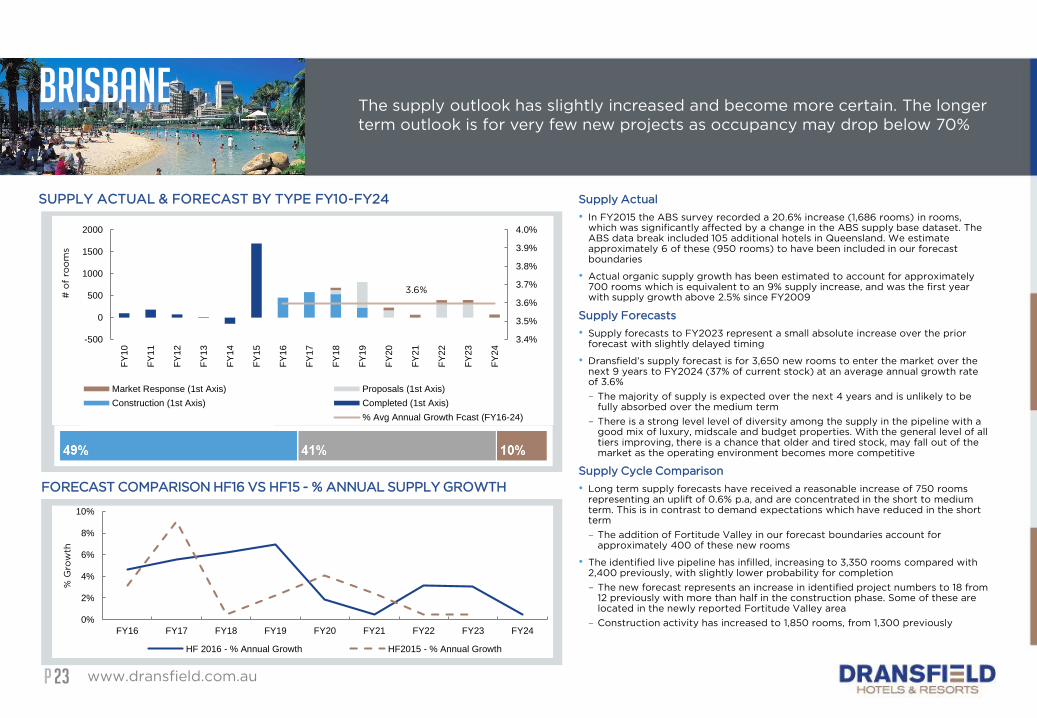
The supply outlook has slightly increased and become more certain. The longer
term outlook is for very few new projects as occupancy may drop below 70%
SUPPLY ACTUAL & FORECAST BY TYPE FY10-FY24
FORECAST COMPARISON HF16 VS HF15 - % ANNUAL SUPPLY GROWTH
Supply Actual
• In FY2015 the ABS survey recorded a 20.6% increase (1,686 rooms) in rooms, which was significantly affected by a change in the ABS supply base dataset. The ABS data break included 105 additional hotels in Queensland. We estimate approximately 6 of these (950 rooms) to have been included in our forecast boundaries
• Actual organic supply growth has been estimated to account for approximately 700 rooms which is equivalent to an 9% supply increase, and was the first year with supply growth above 2.5% since FY2009
Supply Forecasts
• Supply forecasts to FY2023 represent a small absolute increase over the prior forecast with slightly delayed timing
• Dransfield’s supply forecast is for 3,650 new rooms to enter the market over the next 9 years to FY2024 (37% of current stock) at an average annual growth rate of 3.6%
– The majority of supply is expected over the next 4 years and is unlikely to be fully absorbed over the medium term
– There is a strong level level of diversity among the supply in the pipeline with a good mix of luxury, midscale and budget properties. With the general level of all tiers improving, there is a chance that older and tired stock, may fall out of the market as the operating environment becomes more competitive
Supply Cycle Comparison
• Long term supply forecasts have received a reasonable increase of 750 rooms representing an uplift of 0.6% p.a, and are concentrated in the short to medium term. This is in contrast to demand expectations which have reduced in the short term
– The addition of Fortitude Valley in our forecast boundaries account for approximately 400 of these new rooms
• The identified live pipeline has infilled, increasing to 3,350 rooms compared with 2,400 previously, with slightly lower probability for completion
– The new forecast represents an increase in identified project numbers to 18 from 12 previously with more than half in the construction phase. Some of these are located in the newly reported Fortitude Valley area
– Construction activity has increased to 1,850 rooms, from 1,300 previously
Brisbane
3.6%
3.4%
3.5%
3.6%
3.7%
3.8%
3.9%
4.0%
-500
0
500
1000
1500
2000
FY
10
FY
11
FY
12
FY
13
FY
14
FY
15
FY
16
FY
17
FY
18
FY
19
FY
20
FY
21
FY
22
FY
23
FY
24
# o
f ro
om
s
Market Response (1st Axis) Proposals (1st Axis)
Construction (1st Axis) Completed (1st Axis)
% Avg Annual Growth Act (FY10-15) % Avg Annual Growth Fcast (FY16-24)
0%
2%
4%
6%
8%
10%
FY16 FY17 FY18 FY19 FY20 FY21 FY22 FY23 FY24
% G
row
th
HF 2016 - % Annual Growth HF2015 - % Annual Growth

PP
• RevPAR growth to FY2023 represents a substantial downgrade with average growth of 2.5% p.a
compared to the previous 5.4%. Supply induced market uncertainty may impact rates short term
– In FY2016, RevPAR is expected to decline a significant 14.0%, well below previous expectations
for growth as the expected demand recovery is delayed and rate competition intensifies
– In the medium term to FY2018, RevPAR is expected to decline by an average of 3.2% p.a though
largely affected by FY2016. The short term decline is expected to recover through FY17 and
FY18 with demand expected to bounce back.
– The inclusion of high quality new supply over the next few years is expected to force older and
tired stock out of the market over this period as it becomes increasingly difficult for sub
standard properties to compete. This will have a strengthening effect on market fundamentals.
– Average RevPAR growth of 3.2% p.a over the full forecast period is buoyed by a strong back
end to the forecast. A supply cycle pause should see occupancy levels push towards 75%
leading to more aggressive rate movements.
www.dransfield.com.au24
Long term RevPAR expectations are for an average 3.2% p.a growth. A large
market downgrade and poor medium term outlook as a poor FY2016 lowers the
base which is compounded by continuous supply at a time of market vulnerability
BRISBANE CITY REAL REVPAR
Brisbane
$0
$20
$40
$60
$80
$100
$120
$140
$160
'01 '02 '03 '04 '05 '06 '07 '08 '09 '10 '11 '12 '13 '14 '15 '16 '17 '18 '19 '20 '21 '22 '23 '24
HF15 Real RevPar in $2016 Actual Real RevPar Forecast Real RevPar
– Proposals now consist of 8 projects and 1,500 rooms to which we have applied a 63% estimated prospect of delivery compared with 1,100 rooms at 77% previously
• Over the next 6 years, live construction and proposals represent 93% of the forecast supply pipeline which is slightly below demand growth expectations for the corresponding period (4.2% vs 4.5%). Additional Market Response in this period is assumed at a very low 200 rooms and 7% of supply adopted in the forecast
• Market Response for the full forecast period allows for an additional 350 rooms above those already identified
– This represents a decrease, responding to the uplift in construction and proposal activity
– Market Response to FY2023 now accounts for just 9% of all new supply compared with 18% in the prior forecast
Conclusion
• The Brisbane forecast represents a considerable downgrade, as the effect of sustained supply additions over the medium term meets a weak local and regional economy. Occupancy and rate softness provide further downside risk
• RevPAR performance through the first 3 quarters of FY2016 has significantly deteriorated with substantial reductions in rate and to a lesser degree occupancies
• Over the period of the forecast, average occupancy expectations of 72.1% are below prior 76.6% expectations
– Occupancy levels dipped below 75% for the first time in 12 years and are expected to follow a similar trend over the medium term as the supply cycle peaks and is not fully absorbed
– The backend of the forecast is expected to see the beginning of recovery as sustained demand growth slowly absorbs rooms
• Rate growth expectations for the forecast period have been reduced to 2.4% p.a as market confidence levels continue to be tempered by state wide economic uncertainty and large supply increases. Downside risk is a possibility should demand growth not eventuate
– Rates in FY2016 are expected to record double digit decline as new supply, coupled with flat demand force, hoteliers to compete for occupancy
– Medium term rate growth is expected to see average decline of 1.3% which is largely affected by the forecast decline in FY2016
– Long term rate growth excluding FY2016 is in line with prior expectations although from a lower base as the market cycle improves towards the back end of the forecast. The general quality of the Brisbane hotel market will be much improved following significant development and is expected to drive positive rate movement in the long term if matched with presently expected demand growth
• Our forecast is for reduced long term average Real RevPAR of 21.8% compared to previous expectations, influenced by much lower performance in FY2016
PP
COMPARISON* HF2015 vs HF2016 – Average and Absolute to FY2023
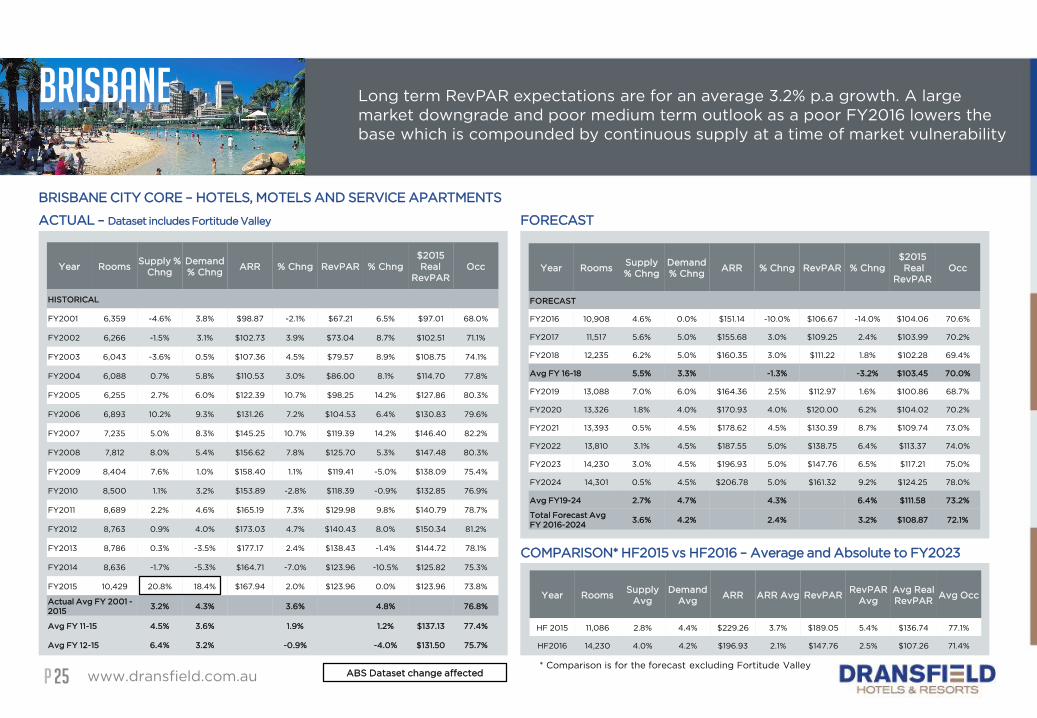
www.dransfield.com.au25
Long term RevPAR expectations are for an average 3.2% p.a growth. A large
market downgrade and poor medium term outlook as a poor FY2016 lowers the
base which is compounded by continuous supply at a time of market vulnerability
Brisbane
BRISBANE CITY CORE – HOTELS, MOTELS AND SERVICE APARTMENTS
ACTUAL – Dataset includes Fortitude Valley FORECAST
Year RoomsSupply %
Chng
Demand
% ChngARR % Chng RevPAR % Chng
$2015
Real
RevPAR
Occ
HISTORICAL
FY2001 6,359 -4.6% 3.8% $98.87 -2.1% $67.21 6.5% $97.01 68.0%
FY2002 6,266 -1.5% 3.1% $102.73 3.9% $73.04 8.7% $102.51 71.1%
FY2003 6,043 -3.6% 0.5% $107.36 4.5% $79.57 8.9% $108.75 74.1%
FY2004 6,088 0.7% 5.8% $110.53 3.0% $86.00 8.1% $114.70 77.8%
FY2005 6,255 2.7% 6.0% $122.39 10.7% $98.25 14.2% $127.86 80.3%
FY2006 6,893 10.2% 9.3% $131.26 7.2% $104.53 6.4% $130.83 79.6%
FY2007 7,235 5.0% 8.3% $145.25 10.7% $119.39 14.2% $146.40 82.2%
FY2008 7,812 8.0% 5.4% $156.62 7.8% $125.70 5.3% $147.48 80.3%
FY2009 8,404 7.6% 1.0% $158.40 1.1% $119.41 -5.0% $138.09 75.4%
FY2010 8,500 1.1% 3.2% $153.89 -2.8% $118.39 -0.9% $132.85 76.9%
FY2011 8,689 2.2% 4.6% $165.19 7.3% $129.98 9.8% $140.79 78.7%
FY2012 8,763 0.9% 4.0% $173.03 4.7% $140.43 8.0% $150.34 81.2%
FY2013 8,786 0.3% -3.5% $177.17 2.4% $138.43 -1.4% $144.72 78.1%
FY2014 8,636 -1.7% -5.3% $164.71 -7.0% $123.96 -10.5% $125.82 75.3%
FY2015 10,429 20.8% 18.4% $167.94 2.0% $123.96 0.0% $123.96 73.8%
Actual Avg FY 2001 -
20153.2% 4.3% 3.6% 4.8% 76.8%
Avg FY 11-15 4.5% 3.6% 1.9% 1.2% $137.13 77.4%
Avg FY 12-15 6.4% 3.2% -0.9% -4.0% $131.50 75.7%
Year RoomsSupply
% Chng
Demand
% ChngARR % Chng RevPAR % Chng
$2015
Real
RevPAR
Occ
FORECAST
FY2016 10,908 4.6% 0.0% $151.14 -10.0% $106.67 -14.0% $104.06 70.6%
FY2017 11,517 5.6% 5.0% $155.68 3.0% $109.25 2.4% $103.99 70.2%
FY2018 12,235 6.2% 5.0% $160.35 3.0% $111.22 1.8% $102.28 69.4%
Avg FY 16-18 5.5% 3.3% -1.3% -3.2% $103.45 70.0%
FY2019 13,088 7.0% 6.0% $164.36 2.5% $112.97 1.6% $100.86 68.7%
FY2020 13,326 1.8% 4.0% $170.93 4.0% $120.00 6.2% $104.02 70.2%
FY2021 13,393 0.5% 4.5% $178.62 4.5% $130.39 8.7% $109.74 73.0%
FY2022 13,810 3.1% 4.5% $187.55 5.0% $138.75 6.4% $113.37 74.0%
FY2023 14,230 3.0% 4.5% $196.93 5.0% $147.76 6.5% $117.21 75.0%
FY2024 14,301 0.5% 4.5% $206.78 5.0% $161.32 9.2% $124.25 78.0%
Avg FY19-24 2.7% 4.7% 4.3% 6.4% $111.58 73.2%
Total Forecast Avg
FY 2016-20243.6% 4.2% 2.4% 3.2% $108.87 72.1%
Year RoomsSupply
Avg
Demand
Avg ARR ARR Avg RevPAR
RevPAR
Avg
Avg Real
RevPARAvg Occ
HF 2015 11,086 2.8% 4.4% $229.26 3.7% $189.05 5.4% $136.74 77.1%
HF2016 14,230 4.0% 4.2% $196.93 2.1% $147.76 2.5% $107.26 71.4%
* Comparison is for the forecast excluding Fortitude Valley ABS Dataset change affected
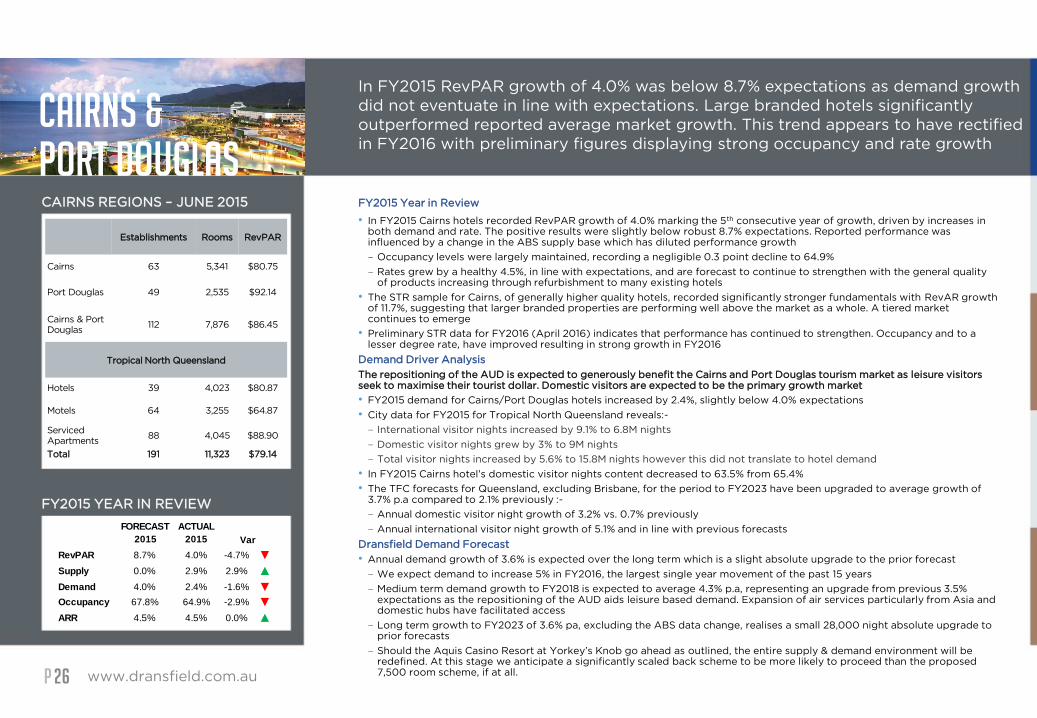
PP
CAIRNS &PORT DOUGLAS
www.dransfield.com.au26
In FY2015 RevPAR growth of 4.0% was below 8.7% expectations as demand growth
did not eventuate in line with expectations. Large branded hotels significantly
outperformed reported average market growth. This trend appears to have rectified
in FY2016 with preliminary figures displaying strong occupancy and rate growth
CAIRNS REGIONS – JUNE 2015
FY2015 YEAR IN REVIEW
Establishments Rooms RevPAR
Cairns 63 5,341 $80.75
Port Douglas 49 2,535 $92.14
Cairns & Port
Douglas112 7,876 $86.45
Tropical North Queensland
Hotels 39 4,023 $80.87
Motels 64 3,255 $64.87
Serviced
Apartments88 4,045 $88.90
Total 191 11,323 $79.14
FY2015 Year in Review
• In FY2015 Cairns hotels recorded RevPAR growth of 4.0% marking the 5th consecutive year of growth, driven by increases in both demand and rate. The positive results were slightly below robust 8.7% expectations. Reported performance was influenced by a change in the ABS supply base which has diluted performance growth
– Occupancy levels were largely maintained, recording a negligible 0.3 point decline to 64.9%
– Rates grew by a healthy 4.5%, in line with expectations, and are forecast to continue to strengthen with the general quality of products increasing through refurbishment to many existing hotels
• The STR sample for Cairns, of generally higher quality hotels, recorded significantly stronger fundamentals with RevAR growth of 11.7%, suggesting that larger branded properties are performing well above the market as a whole. A tiered market continues to emerge
• Preliminary STR data for FY2016 (April 2016) indicates that performance has continued to strengthen. Occupancy and to a lesser degree rate, have improved resulting in strong growth in FY2016
Demand Driver Analysis
The repositioning of the AUD is expected to generously benefit the Cairns and Port Douglas tourism market as leisure visitorsseek to maximise their tourist dollar. Domestic visitors are expected to be the primary growth market
• FY2015 demand for Cairns/Port Douglas hotels increased by 2.4%, slightly below 4.0% expectations
• City data for FY2015 for Tropical North Queensland reveals:-
– International visitor nights increased by 9.1% to 6.8M nights
– Domestic visitor nights grew by 3% to 9M nights
– Total visitor nights increased by 5.6% to 15.8M nights however this did not translate to hotel demand
• In FY2015 Cairns hotel’s domestic visitor nights content decreased to 63.5% from 65.4%
• The TFC forecasts for Queensland, excluding Brisbane, for the period to FY2023 have been upgraded to average growth of 3.7% p.a compared to 2.1% previously :-
– Annual domestic visitor night growth of 3.2% vs. 0.7% previously
– Annual international visitor night growth of 5.1% and in line with previous forecasts
Dransfield Demand Forecast
• Annual demand growth of 3.6% is expected over the long term which is a slight absolute upgrade to the prior forecast
– We expect demand to increase 5% in FY2016, the largest single year movement of the past 15 years
– Medium term demand growth to FY2018 is expected to average 4.3% p.a, representing an upgrade from previous 3.5% expectations as the repositioning of the AUD aids leisure based demand. Expansion of air services particularly from Asia and domestic hubs have facilitated access
– Long term growth to FY2023 of 3.6% pa, excluding the ABS data change, realises a small 28,000 night absolute upgrade to prior forecasts
– Should the Aquis Casino Resort at Yorkey’s Knob go ahead as outlined, the entire supply & demand environment will be redefined. At this stage we anticipate a significantly scaled back scheme to be more likely to proceed than the proposed 7,500 room scheme, if at all.
FORECAST
2015
ACTUAL
2015
RevPAR 8.7% 4.0% -4.7% ▼
Supply 0.0% 2.9% 2.9% ▲
Demand 4.0% 2.4% -1.6% ▼
Occupancy 67.8% 64.9% -2.9% ▼
ARR 4.5% 4.5% 0.0% ▲
Var
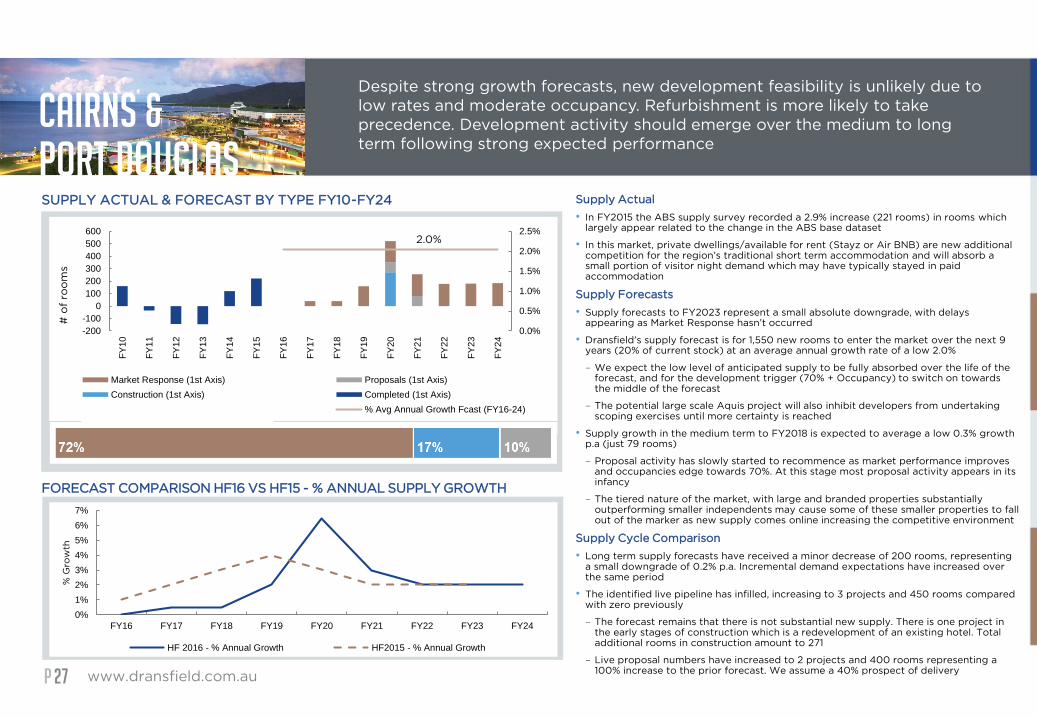
PP www.dransfield.com.au27
Despite strong growth forecasts, new development feasibility is unlikely due to
low rates and moderate occupancy. Refurbishment is more likely to take
precedence. Development activity should emerge over the medium to long
term following strong expected performance
SUPPLY ACTUAL & FORECAST BY TYPE FY10-FY24
FORECAST COMPARISON HF16 VS HF15 - % ANNUAL SUPPLY GROWTH
CAIRNS &PORT DOUGLAS
Supply Actual
• In FY2015 the ABS supply survey recorded a 2.9% increase (221 rooms) in rooms which largely appear related to the change in the ABS base dataset
• In this market, private dwellings/available for rent (Stayz or Air BNB) are new additional competition for the region’s traditional short term accommodation and will absorb a small portion of visitor night demand which may have typically stayed in paid accommodation
Supply Forecasts
• Supply forecasts to FY2023 represent a small absolute downgrade, with delays appearing as Market Response hasn’t occurred
• Dransfield’s supply forecast is for 1,550 new rooms to enter the market over the next 9 years (20% of current stock) at an average annual growth rate of a low 2.0%
– We expect the low level of anticipated supply to be fully absorbed over the life of the forecast, and for the development trigger (70% + Occupancy) to switch on towards the middle of the forecast
– The potential large scale Aquis project will also inhibit developers from undertaking scoping exercises until more certainty is reached
• Supply growth in the medium term to FY2018 is expected to average a low 0.3% growth p.a (just 79 rooms)
– Proposal activity has slowly started to recommence as market performance improves and occupancies edge towards 70%. At this stage most proposal activity appears in its infancy
– The tiered nature of the market, with large and branded properties substantially outperforming smaller independents may cause some of these smaller properties to fall out of the marker as new supply comes online increasing the competitive environment
Supply Cycle Comparison
• Long term supply forecasts have received a minor decrease of 200 rooms, representing a small downgrade of 0.2% p.a. Incremental demand expectations have increased over the same period
• The identified live pipeline has infilled, increasing to 3 projects and 450 rooms compared with zero previously
– The forecast remains that there is not substantial new supply. There is one project in the early stages of construction which is a redevelopment of an existing hotel. Total additional rooms in construction amount to 271
– Live proposal numbers have increased to 2 projects and 400 rooms representing a 100% increase to the prior forecast. We assume a 40% prospect of delivery
0%
1%
2%
3%
4%
5%
6%
7%
FY16 FY17 FY18 FY19 FY20 FY21 FY22 FY23 FY24
% G
row
th
HF 2016 - % Annual Growth HF2015 - % Annual Growth
2.0%
0.0%
0.5%
1.0%
1.5%
2.0%
2.5%
-200
-100
0
100
200
300
400
500
600
FY
10
FY
11
FY
12
FY
13
FY
14
FY
15
FY
16
FY
17
FY
18
FY
19
FY
20
FY
21
FY
22
FY
23
FY
24
# o
f ro
om
s
Market Response (1st Axis) Proposals (1st Axis)
Construction (1st Axis) Completed (1st Axis)
% Avg Annual Growth Act (FY10-15) % Avg Annual Growth Fcast (FY16-24)
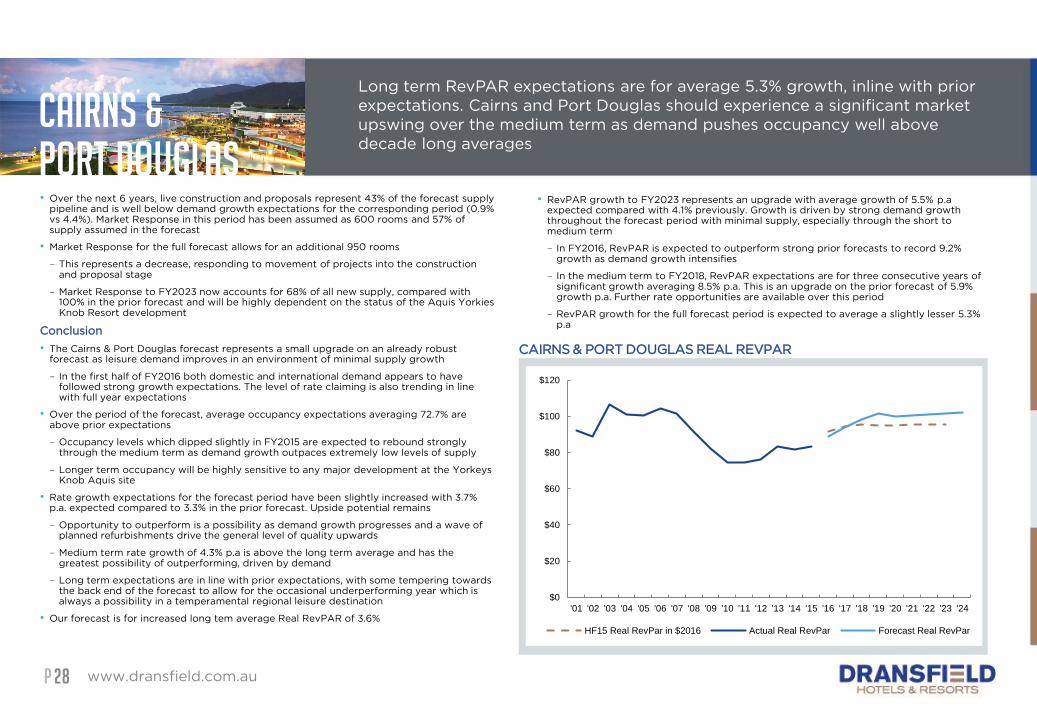
PP www.dransfield.com.au28
Long term RevPAR expectations are for average 5.3% growth, inline with prior
expectations. Cairns and Port Douglas should experience a significant market
upswing over the medium term as demand pushes occupancy well above
decade long averages
• Over the next 6 years, live construction and proposals represent 43% of the forecast supply pipeline and is well below demand growth expectations for the corresponding period (0.9% vs 4.4%). Market Response in this period has been assumed as 600 rooms and 57% of supply assumed in the forecast
• Market Response for the full forecast allows for an additional 950 rooms
– This represents a decrease, responding to movement of projects into the construction and proposal stage
– Market Response to FY2023 now accounts for 68% of all new supply, compared with 100% in the prior forecast and will be highly dependent on the status of the Aquis YorkiesKnob Resort development
Conclusion
• The Cairns & Port Douglas forecast represents a small upgrade on an already robust forecast as leisure demand improves in an environment of minimal supply growth
– In the first half of FY2016 both domestic and international demand appears to have followed strong growth expectations. The level of rate claiming is also trending in line with full year expectations
• Over the period of the forecast, average occupancy expectations averaging 72.7% are above prior expectations
– Occupancy levels which dipped slightly in FY2015 are expected to rebound strongly through the medium term as demand growth outpaces extremely low levels of supply
– Longer term occupancy will be highly sensitive to any major development at the YorkeysKnob Aquis site
• Rate growth expectations for the forecast period have been slightly increased with 3.7% p.a. expected compared to 3.3% in the prior forecast. Upside potential remains
– Opportunity to outperform is a possibility as demand growth progresses and a wave of planned refurbishments drive the general level of quality upwards
– Medium term rate growth of 4.3% p.a is above the long term average and has the greatest possibility of outperforming, driven by demand
– Long term expectations are in line with prior expectations, with some tempering towards the back end of the forecast to allow for the occasional underperforming year which is always a possibility in a temperamental regional leisure destination
• Our forecast is for increased long tem average Real RevPAR of 3.6%
CAIRNS & PORT DOUGLAS REAL REVPAR
CAIRNS &PORT DOUGLAS
• RevPAR growth to FY2023 represents an upgrade with average growth of 5.5% p.aexpected compared with 4.1% previously. Growth is driven by strong demand growth throughout the forecast period with minimal supply, especially through the short to medium term
– In FY2016, RevPAR is expected to outperform strong prior forecasts to record 9.2% growth as demand growth intensifies
– In the medium term to FY2018, RevPAR expectations are for three consecutive years of significant growth averaging 8.5% p.a. This is an upgrade on the prior forecast of 5.9% growth p.a. Further rate opportunities are available over this period
– RevPAR growth for the full forecast period is expected to average a slightly lesser 5.3% p.a
$0
$20
$40
$60
$80
$100
$120
'01 '02 '03 '04 '05 '06 '07 '08 '09 '10 '11 '12 '13 '14 '15 '16 '17 '18 '19 '20 '21 '22 '23 '24
HF15 Real RevPar in $2016 Actual Real RevPar Forecast Real RevPar
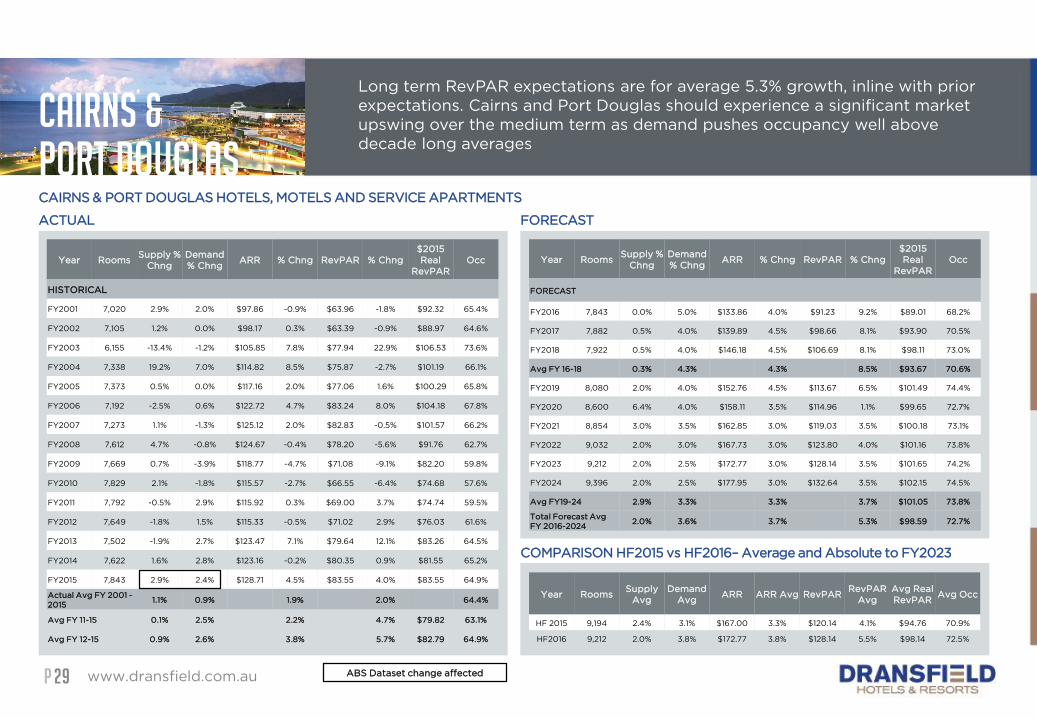
PP
COMPARISON HF2015 vs HF2016– Average and Absolute to FY2023
www.dransfield.com.au29
Long term RevPAR expectations are for average 5.3% growth, inline with prior
expectations. Cairns and Port Douglas should experience a significant market
upswing over the medium term as demand pushes occupancy well above
decade long averages
CAIRNS & PORT DOUGLAS HOTELS, MOTELS AND SERVICE APARTMENTS
ACTUAL FORECAST
Year RoomsSupply %
Chng
Demand
% ChngARR % Chng RevPAR % Chng
$2015
Real
RevPAR
Occ
HISTORICAL
FY2001 7,020 2.9% 2.0% $97.86 -0.9% $63.96 -1.8% $92.32 65.4%
FY2002 7,105 1.2% 0.0% $98.17 0.3% $63.39 -0.9% $88.97 64.6%
FY2003 6,155 -13.4% -1.2% $105.85 7.8% $77.94 22.9% $106.53 73.6%
FY2004 7,338 19.2% 7.0% $114.82 8.5% $75.87 -2.7% $101.19 66.1%
FY2005 7,373 0.5% 0.0% $117.16 2.0% $77.06 1.6% $100.29 65.8%
FY2006 7,192 -2.5% 0.6% $122.72 4.7% $83.24 8.0% $104.18 67.8%
FY2007 7,273 1.1% -1.3% $125.12 2.0% $82.83 -0.5% $101.57 66.2%
FY2008 7,612 4.7% -0.8% $124.67 -0.4% $78.20 -5.6% $91.76 62.7%
FY2009 7,669 0.7% -3.9% $118.77 -4.7% $71.08 -9.1% $82.20 59.8%
FY2010 7,829 2.1% -1.8% $115.57 -2.7% $66.55 -6.4% $74.68 57.6%
FY2011 7,792 -0.5% 2.9% $115.92 0.3% $69.00 3.7% $74.74 59.5%
FY2012 7,649 -1.8% 1.5% $115.33 -0.5% $71.02 2.9% $76.03 61.6%
FY2013 7,502 -1.9% 2.7% $123.47 7.1% $79.64 12.1% $83.26 64.5%
FY2014 7,622 1.6% 2.8% $123.16 -0.2% $80.35 0.9% $81.55 65.2%
FY2015 7,843 2.9% 2.4% $128.71 4.5% $83.55 4.0% $83.55 64.9%
Actual Avg FY 2001 -
20151.1% 0.9% 1.9% 2.0% 64.4%
Avg FY 11-15 0.1% 2.5% 2.2% 4.7% $79.82 63.1%
Avg FY 12-15 0.9% 2.6% 3.8% 5.7% $82.79 64.9%
Year RoomsSupply %
Chng
Demand
% ChngARR % Chng RevPAR % Chng
$2015
Real
RevPAR
Occ
FORECAST
FY2016 7,843 0.0% 5.0% $133.86 4.0% $91.23 9.2% $89.01 68.2%
FY2017 7,882 0.5% 4.0% $139.89 4.5% $98.66 8.1% $93.90 70.5%
FY2018 7,922 0.5% 4.0% $146.18 4.5% $106.69 8.1% $98.11 73.0%
Avg FY 16-18 0.3% 4.3% 4.3% 8.5% $93.67 70.6%
FY2019 8,080 2.0% 4.0% $152.76 4.5% $113.67 6.5% $101.49 74.4%
FY2020 8,600 6.4% 4.0% $158.11 3.5% $114.96 1.1% $99.65 72.7%
FY2021 8,854 3.0% 3.5% $162.85 3.0% $119.03 3.5% $100.18 73.1%
FY2022 9,032 2.0% 3.0% $167.73 3.0% $123.80 4.0% $101.16 73.8%
FY2023 9,212 2.0% 2.5% $172.77 3.0% $128.14 3.5% $101.65 74.2%
FY2024 9,396 2.0% 2.5% $177.95 3.0% $132.64 3.5% $102.15 74.5%
Avg FY19-24 2.9% 3.3% 3.3% 3.7% $101.05 73.8%
Total Forecast Avg
FY 2016-20242.0% 3.6% 3.7% 5.3% $98.59 72.7%
CAIRNS &PORT DOUGLAS
Year RoomsSupply
Avg
Demand
Avg ARR ARR Avg RevPAR
RevPAR
Avg
Avg Real
RevPARAvg Occ
HF 2015 9,194 2.4% 3.1% $167.00 3.3% $120.14 4.1% $94.76 70.9%
HF2016 9,212 2.0% 3.8% $172.77 3.8% $128.14 5.5% $98.14 72.5%
ABS Dataset change affected
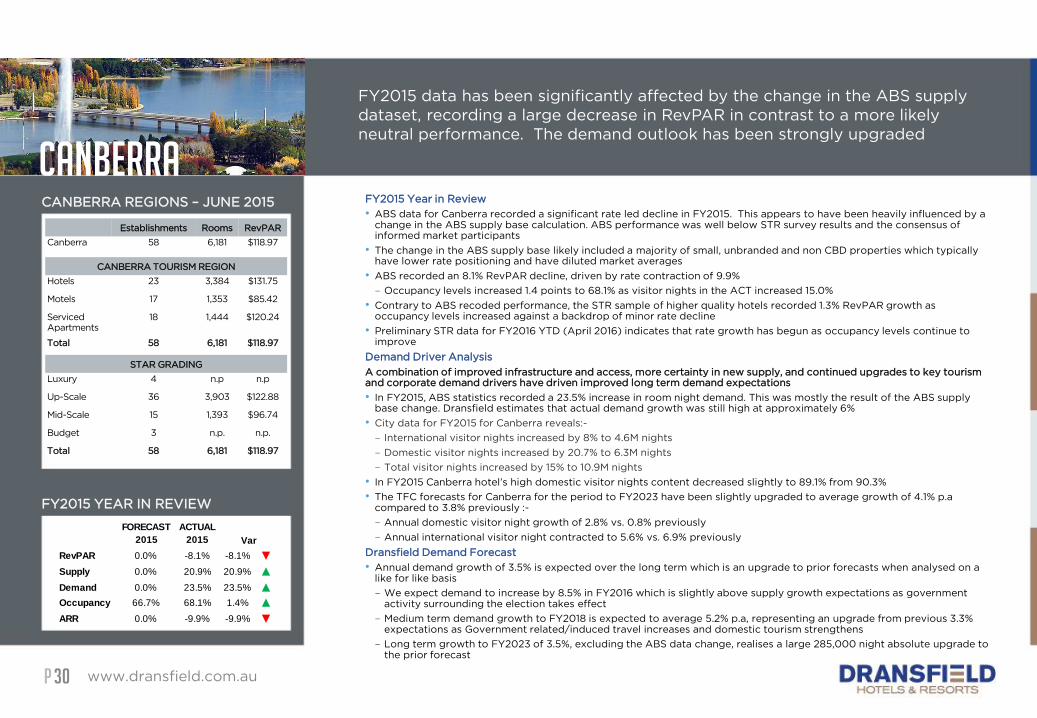
PP
CANBERRA
www.dransfield.com.au30
FY2015 data has been significantly affected by the change in the ABS supply
dataset, recording a large decrease in RevPAR in contrast to a more likely
neutral performance. The demand outlook has been strongly upgraded
FY2015 Year in Review
• ABS data for Canberra recorded a significant rate led decline in FY2015. This appears to have been heavily influenced by a change in the ABS supply base calculation. ABS performance was well below STR survey results and the consensus of informed market participants
• The change in the ABS supply base likely included a majority of small, unbranded and non CBD properties which typically have lower rate positioning and have diluted market averages
• ABS recorded an 8.1% RevPAR decline, driven by rate contraction of 9.9%
– Occupancy levels increased 1.4 points to 68.1% as visitor nights in the ACT increased 15.0%
• Contrary to ABS recoded performance, the STR sample of higher quality hotels recorded 1.3% RevPAR growth as occupancy levels increased against a backdrop of minor rate decline
• Preliminary STR data for FY2016 YTD (April 2016) indicates that rate growth has begun as occupancy levels continue to improve
Demand Driver Analysis
A combination of improved infrastructure and access, more certainty in new supply, and continued upgrades to key tourism and corporate demand drivers have driven improved long term demand expectations
• In FY2015, ABS statistics recorded a 23.5% increase in room night demand. This was mostly the result of the ABS supply base change. Dransfield estimates that actual demand growth was still high at approximately 6%
• City data for FY2015 for Canberra reveals:-
– International visitor nights increased by 8% to 4.6M nights
– Domestic visitor nights increased by 20.7% to 6.3M nights
– Total visitor nights increased by 15% to 10.9M nights
• In FY2015 Canberra hotel’s high domestic visitor nights content decreased slightly to 89.1% from 90.3%
• The TFC forecasts for Canberra for the period to FY2023 have been slightly upgraded to average growth of 4.1% p.a compared to 3.8% previously :-
– Annual domestic visitor night growth of 2.8% vs. 0.8% previously
– Annual international visitor night contracted to 5.6% vs. 6.9% previously
Dransfield Demand Forecast
• Annual demand growth of 3.5% is expected over the long term which is an upgrade to prior forecasts when analysed on a like for like basis
– We expect demand to increase by 8.5% in FY2016 which is slightly above supply growth expectations as government activity surrounding the election takes effect
– Medium term demand growth to FY2018 is expected to average 5.2% p.a, representing an upgrade from previous 3.3% expectations as Government related/induced travel increases and domestic tourism strengthens
– Long term growth to FY2023 of 3.5%, excluding the ABS data change, realises a large 285,000 night absolute upgrade to the prior forecast
CANBERRA REGIONS – JUNE 2015
FY2015 YEAR IN REVIEW
Establishments Rooms RevPAR
Canberra 58 6,181 $118.97
CANBERRA TOURISM REGION
Hotels 23 3,384 $131.75
Motels 17 1,353 $85.42
Serviced
Apartments
18 1,444 $120.24
Total 58 6,181 $118.97
STAR GRADING
Luxury 4 n.p n.p
Up-Scale 36 3,903 $122.88
Mid-Scale 15 1,393 $96.74
Budget 3 n.p. n.p.
Total 58 6,181 $118.97
FORECAST
2015
ACTUAL
2015
RevPAR 0.0% -8.1% -8.1% ▼
Supply 0.0% 20.9% 20.9% ▲
Demand 0.0% 23.5% 23.5% ▲
Occupancy 66.7% 68.1% 1.4% ▲
ARR 0.0% -9.9% -9.9% ▼
Var
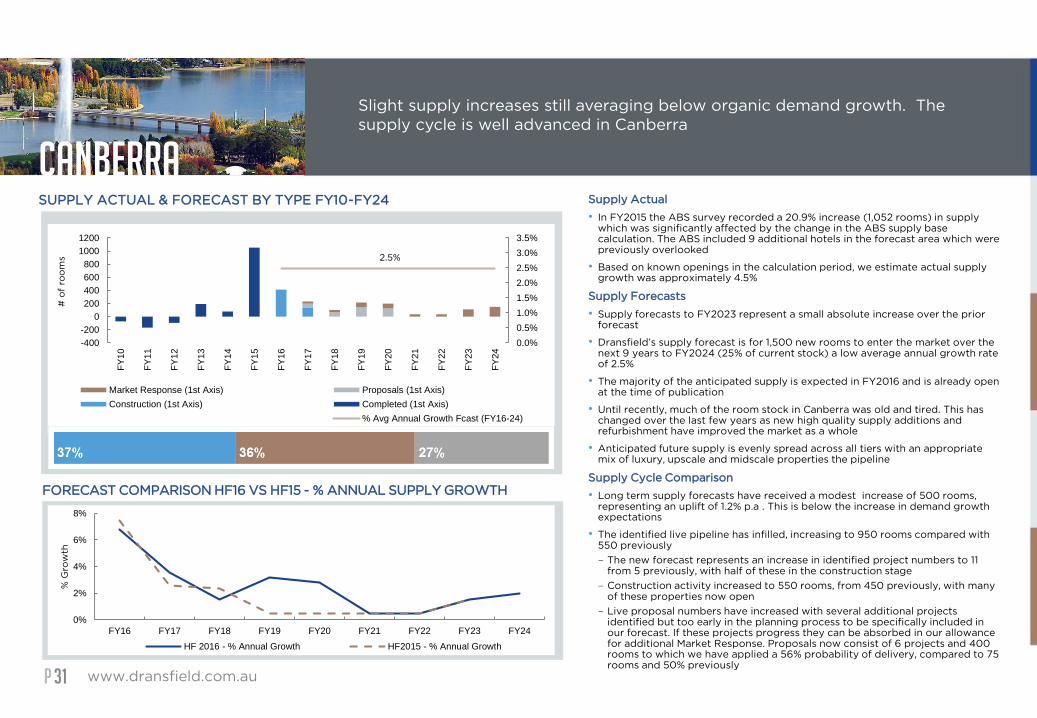
PP
CANBERRA
www.dransfield.com.au31
Slight supply increases still averaging below organic demand growth. The
supply cycle is well advanced in Canberra
SUPPLY ACTUAL & FORECAST BY TYPE FY10-FY24
FORECAST COMPARISON HF16 VS HF15 - % ANNUAL SUPPLY GROWTH
Supply Actual
• In FY2015 the ABS survey recorded a 20.9% increase (1,052 rooms) in supply which was significantly affected by the change in the ABS supply base calculation. The ABS included 9 additional hotels in the forecast area which were previously overlooked
• Based on known openings in the calculation period, we estimate actual supply growth was approximately 4.5%
Supply Forecasts
• Supply forecasts to FY2023 represent a small absolute increase over the prior forecast
• Dransfield’s supply forecast is for 1,500 new rooms to enter the market over the next 9 years to FY2024 (25% of current stock) a low average annual growth rate of 2.5%
• The majority of the anticipated supply is expected in FY2016 and is already open at the time of publication
• Until recently, much of the room stock in Canberra was old and tired. This has changed over the last few years as new high quality supply additions and refurbishment have improved the market as a whole
• Anticipated future supply is evenly spread across all tiers with an appropriate mix of luxury, upscale and midscale properties the pipeline
Supply Cycle Comparison
• Long term supply forecasts have received a modest increase of 500 rooms, representing an uplift of 1.2% p.a . This is below the increase in demand growth expectations
• The identified live pipeline has infilled, increasing to 950 rooms compared with 550 previously
– The new forecast represents an increase in identified project numbers to 11 from 5 previously, with half of these in the construction stage
– Construction activity increased to 550 rooms, from 450 previously, with many of these properties now open
– Live proposal numbers have increased with several additional projects identified but too early in the planning process to be specifically included in our forecast. If these projects progress they can be absorbed in our allowance for additional Market Response. Proposals now consist of 6 projects and 400 rooms to which we have applied a 56% probability of delivery, compared to 75 rooms and 50% previously
2.5%
0.0%
0.5%
1.0%
1.5%
2.0%
2.5%
3.0%
3.5%
-400
-200
0
200
400
600
800
1000
1200
FY
10
FY
11
FY
12
FY
13
FY
14
FY
15
FY
16
FY
17
FY
18
FY
19
FY
20
FY
21
FY
22
FY
23
FY
24
# o
f ro
om
s
Market Response (1st Axis) Proposals (1st Axis)
Construction (1st Axis) Completed (1st Axis)
% Avg Annual Growth Act (FY10-15) % Avg Annual Growth Fcast (FY16-24)
0%
2%
4%
6%
8%
FY16 FY17 FY18 FY19 FY20 FY21 FY22 FY23 FY24
% G
row
th
HF 2016 - % Annual Growth HF2015 - % Annual Growth
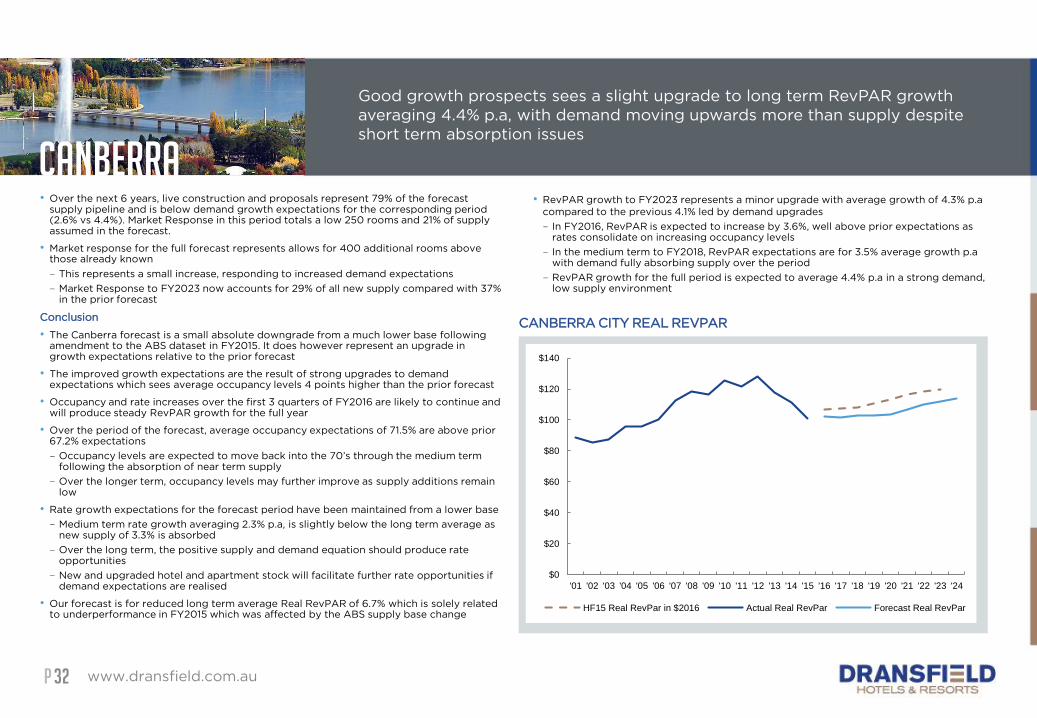
PP
CANBERRA
www.dransfield.com.au32
Good growth prospects sees a slight upgrade to long term RevPAR growth
averaging 4.4% p.a, with demand moving upwards more than supply despite
short term absorption issues
• RevPAR growth to FY2023 represents a minor upgrade with average growth of 4.3% p.a
compared to the previous 4.1% led by demand upgrades
– In FY2016, RevPAR is expected to increase by 3.6%, well above prior expectations as rates consolidate on increasing occupancy levels
– In the medium term to FY2018, RevPAR expectations are for 3.5% average growth p.a with demand fully absorbing supply over the period
– RevPAR growth for the full period is expected to average 4.4% p.a in a strong demand, low supply environment
CANBERRA CITY REAL REVPAR
$0
$20
$40
$60
$80
$100
$120
$140
'01 '02 '03 '04 '05 '06 '07 '08 '09 '10 '11 '12 '13 '14 '15 '16 '17 '18 '19 '20 '21 '22 '23 '24
HF15 Real RevPar in $2016 Actual Real RevPar Forecast Real RevPar
• Over the next 6 years, live construction and proposals represent 79% of the forecast supply pipeline and is below demand growth expectations for the corresponding period (2.6% vs 4.4%). Market Response in this period totals a low 250 rooms and 21% of supply assumed in the forecast.
• Market response for the full forecast represents allows for 400 additional rooms above those already known
– This represents a small increase, responding to increased demand expectations
– Market Response to FY2023 now accounts for 29% of all new supply compared with 37% in the prior forecast
Conclusion
• The Canberra forecast is a small absolute downgrade from a much lower base following amendment to the ABS dataset in FY2015. It does however represent an upgrade in growth expectations relative to the prior forecast
• The improved growth expectations are the result of strong upgrades to demand expectations which sees average occupancy levels 4 points higher than the prior forecast
• Occupancy and rate increases over the first 3 quarters of FY2016 are likely to continue and will produce steady RevPAR growth for the full year
• Over the period of the forecast, average occupancy expectations of 71.5% are above prior 67.2% expectations
– Occupancy levels are expected to move back into the 70’s through the medium term following the absorption of near term supply
– Over the longer term, occupancy levels may further improve as supply additions remain low
• Rate growth expectations for the forecast period have been maintained from a lower base
– Medium term rate growth averaging 2.3% p.a, is slightly below the long term average as new supply of 3.3% is absorbed
– Over the long term, the positive supply and demand equation should produce rate opportunities
– New and upgraded hotel and apartment stock will facilitate further rate opportunities if demand expectations are realised
• Our forecast is for reduced long term average Real RevPAR of 6.7% which is solely related to underperformance in FY2015 which was affected by the ABS supply base change
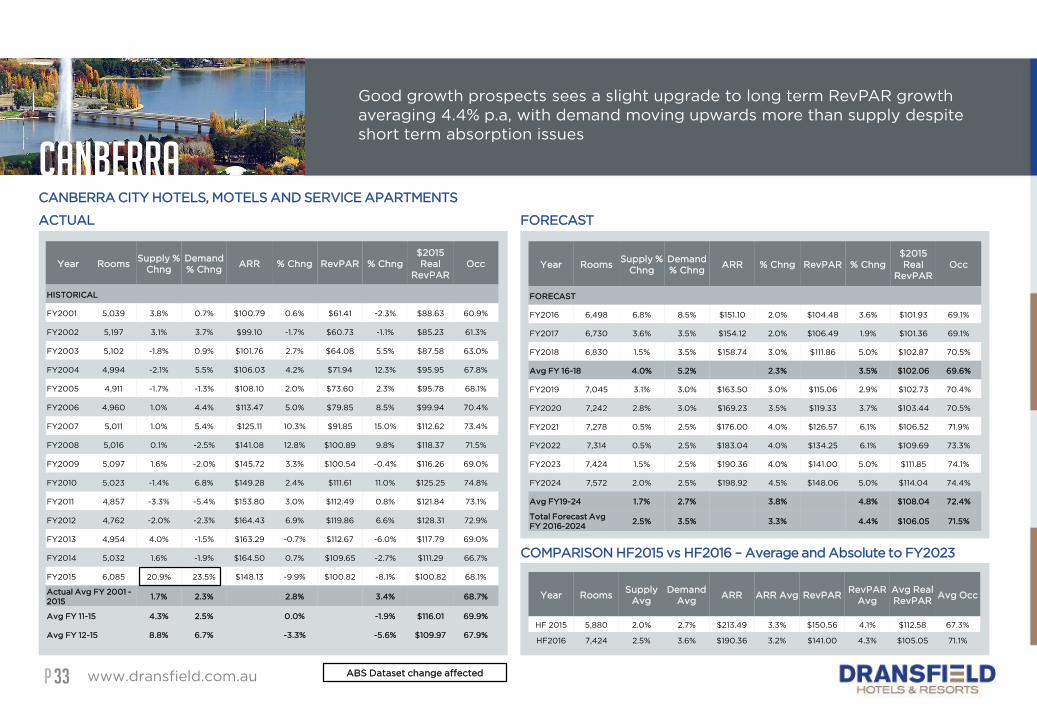
PP
COMPARISON HF2015 vs HF2016 – Average and Absolute to FY2023
CANBERRA
www.dransfield.com.au33
Good growth prospects sees a slight upgrade to long term RevPAR growth
averaging 4.4% p.a, with demand moving upwards more than supply despite
short term absorption issues
CANBERRA CITY HOTELS, MOTELS AND SERVICE APARTMENTS
ACTUAL FORECAST
Year RoomsSupply %
Chng
Demand
% ChngARR % Chng RevPAR % Chng
$2015
Real
RevPAR
Occ
HISTORICAL
FY2001 5,039 3.8% 0.7% $100.79 0.6% $61.41 -2.3% $88.63 60.9%
FY2002 5,197 3.1% 3.7% $99.10 -1.7% $60.73 -1.1% $85.23 61.3%
FY2003 5,102 -1.8% 0.9% $101.76 2.7% $64.08 5.5% $87.58 63.0%
FY2004 4,994 -2.1% 5.5% $106.03 4.2% $71.94 12.3% $95.95 67.8%
FY2005 4,911 -1.7% -1.3% $108.10 2.0% $73.60 2.3% $95.78 68.1%
FY2006 4,960 1.0% 4.4% $113.47 5.0% $79.85 8.5% $99.94 70.4%
FY2007 5,011 1.0% 5.4% $125.11 10.3% $91.85 15.0% $112.62 73.4%
FY2008 5,016 0.1% -2.5% $141.08 12.8% $100.89 9.8% $118.37 71.5%
FY2009 5,097 1.6% -2.0% $145.72 3.3% $100.54 -0.4% $116.26 69.0%
FY2010 5,023 -1.4% 6.8% $149.28 2.4% $111.61 11.0% $125.25 74.8%
FY2011 4,857 -3.3% -5.4% $153.80 3.0% $112.49 0.8% $121.84 73.1%
FY2012 4,762 -2.0% -2.3% $164.43 6.9% $119.86 6.6% $128.31 72.9%
FY2013 4,954 4.0% -1.5% $163.29 -0.7% $112.67 -6.0% $117.79 69.0%
FY2014 5,032 1.6% -1.9% $164.50 0.7% $109.65 -2.7% $111.29 66.7%
FY2015 6,085 20.9% 23.5% $148.13 -9.9% $100.82 -8.1% $100.82 68.1%
Actual Avg FY 2001 -
20151.7% 2.3% 2.8% 3.4% 68.7%
Avg FY 11-15 4.3% 2.5% 0.0% -1.9% $116.01 69.9%
Avg FY 12-15 8.8% 6.7% -3.3% -5.6% $109.97 67.9%
Year RoomsSupply %
Chng
Demand
% ChngARR % Chng RevPAR % Chng
$2015
Real
RevPAR
Occ
FORECAST
FY2016 6,498 6.8% 8.5% $151.10 2.0% $104.48 3.6% $101.93 69.1%
FY2017 6,730 3.6% 3.5% $154.12 2.0% $106.49 1.9% $101.36 69.1%
FY2018 6,830 1.5% 3.5% $158.74 3.0% $111.86 5.0% $102.87 70.5%
Avg FY 16-18 4.0% 5.2% 2.3% 3.5% $102.06 69.6%
FY2019 7,045 3.1% 3.0% $163.50 3.0% $115.06 2.9% $102.73 70.4%
FY2020 7,242 2.8% 3.0% $169.23 3.5% $119.33 3.7% $103.44 70.5%
FY2021 7,278 0.5% 2.5% $176.00 4.0% $126.57 6.1% $106.52 71.9%
FY2022 7,314 0.5% 2.5% $183.04 4.0% $134.25 6.1% $109.69 73.3%
FY2023 7,424 1.5% 2.5% $190.36 4.0% $141.00 5.0% $111.85 74.1%
FY2024 7,572 2.0% 2.5% $198.92 4.5% $148.06 5.0% $114.04 74.4%
Avg FY19-24 1.7% 2.7% 3.8% 4.8% $108.04 72.4%
Total Forecast Avg
FY 2016-20242.5% 3.5% 3.3% 4.4% $106.05 71.5%
Year RoomsSupply
Avg
Demand
Avg ARR ARR Avg RevPAR
RevPAR
Avg
Avg Real
RevPARAvg Occ
HF 2015 5,880 2.0% 2.7% $213.49 3.3% $150.56 4.1% $112.58 67.3%
HF2016 7,424 2.5% 3.6% $190.36 3.2% $141.00 4.3% $105.05 71.1%
ABS Dataset change affected
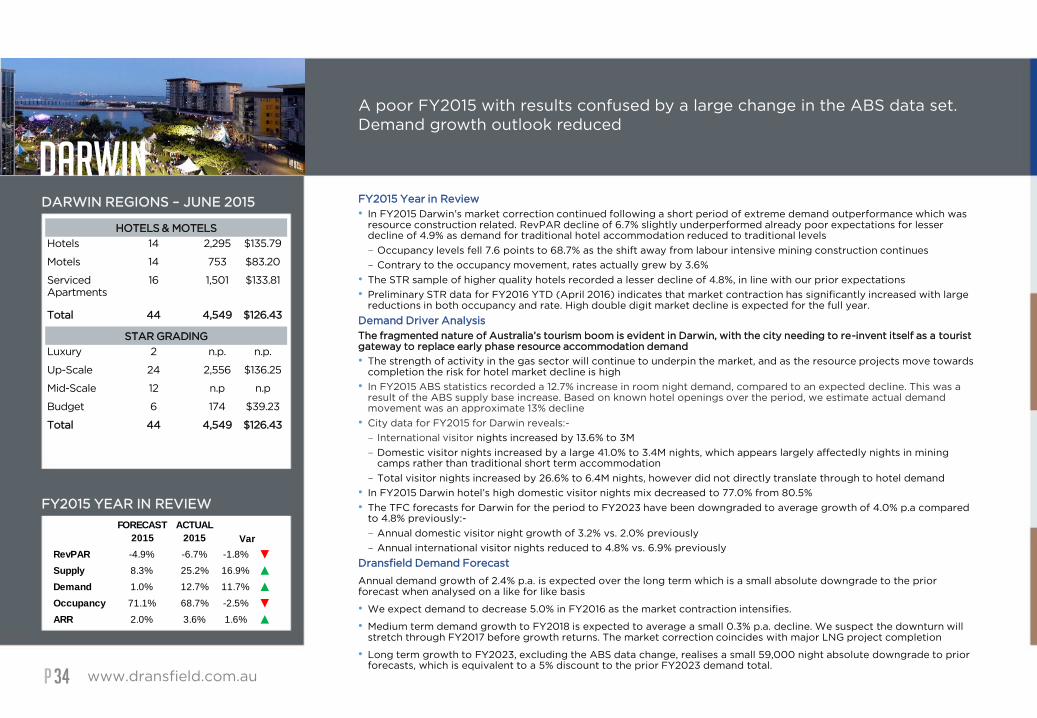
PP
DARWIN
www.dransfield.com.au34
A poor FY2015 with results confused by a large change in the ABS data set.
Demand growth outlook reduced
DARWIN REGIONS – JUNE 2015
FY2015 YEAR IN REVIEW
HOTELS & MOTELS
Hotels 14 2,295 $135.79
Motels 14 753 $83.20
Serviced
Apartments
16 1,501 $133.81
Total 44 4,549 $126.43
STAR GRADING
Luxury 2 n.p. n.p.
Up-Scale 24 2,556 $136.25
Mid-Scale 12 n.p n.p
Budget 6 174 $39.23
Total 44 4,549 $126.43
FY2015 Year in Review
• In FY2015 Darwin’s market correction continued following a short period of extreme demand outperformance which was resource construction related. RevPAR decline of 6.7% slightly underperformed already poor expectations for lesser decline of 4.9% as demand for traditional hotel accommodation reduced to traditional levels
– Occupancy levels fell 7.6 points to 68.7% as the shift away from labour intensive mining construction continues
– Contrary to the occupancy movement, rates actually grew by 3.6%
• The STR sample of higher quality hotels recorded a lesser decline of 4.8%, in line with our prior expectations
• Preliminary STR data for FY2016 YTD (April 2016) indicates that market contraction has significantly increased with large reductions in both occupancy and rate. High double digit market decline is expected for the full year.
Demand Driver Analysis
The fragmented nature of Australia’s tourism boom is evident in Darwin, with the city needing to re-invent itself as a tourist gateway to replace early phase resource accommodation demand
• The strength of activity in the gas sector will continue to underpin the market, and as the resource projects move towards completion the risk for hotel market decline is high
• In FY2015 ABS statistics recorded a 12.7% increase in room night demand, compared to an expected decline. This was a result of the ABS supply base increase. Based on known hotel openings over the period, we estimate actual demand movement was an approximate 13% decline
• City data for FY2015 for Darwin reveals:-
– International visitor nights increased by 13.6% to 3M
– Domestic visitor nights increased by a large 41.0% to 3.4M nights, which appears largely affectedly nights in mining camps rather than traditional short term accommodation
– Total visitor nights increased by 26.6% to 6.4M nights, however did not directly translate through to hotel demand
• In FY2015 Darwin hotel’s high domestic visitor nights mix decreased to 77.0% from 80.5%
• The TFC forecasts for Darwin for the period to FY2023 have been downgraded to average growth of 4.0% p.a compared to 4.8% previously:-
– Annual domestic visitor night growth of 3.2% vs. 2.0% previously
– Annual international visitor nights reduced to 4.8% vs. 6.9% previously
Dransfield Demand Forecast
Annual demand growth of 2.4% p.a. is expected over the long term which is a small absolute downgrade to the prior forecast when analysed on a like for like basis
• We expect demand to decrease 5.0% in FY2016 as the market contraction intensifies.
• Medium term demand growth to FY2018 is expected to average a small 0.3% p.a. decline. We suspect the downturn will stretch through FY2017 before growth returns. The market correction coincides with major LNG project completion
• Long term growth to FY2023, excluding the ABS data change, realises a small 59,000 night absolute downgrade to prior forecasts, which is equivalent to a 5% discount to the prior FY2023 demand total.
FORECAST
2015
ACTUAL
2015
RevPAR -4.9% -6.7% -1.8% ▼
Supply 8.3% 25.2% 16.9% ▲
Demand 1.0% 12.7% 11.7% ▲
Occupancy 71.1% 68.7% -2.5% ▼
ARR 2.0% 3.6% 1.6% ▲
Var

PP
DARWIN
www.dransfield.com.au35
Supply needs have been meet and perhaps exceeded in the short term,
coinciding with reduced demand. We expect mooted proposals will be re-
assessed and deferred pending a change in market conditions
SUPPLY ACTUAL & FORECAST BY TYPE FY10-FY24
FORECAST COMPARISON HF16 VS HF15 - % ANNUAL SUPPLY GROWTH
Supply Actual
• In FY2015, Darwin was significantly affected by the ABS supply base change, recording 25.2% growth. Dransfield are aware of one large accommodation product (301 rooms) to have opened early enough to have been included in FY2015 figures. This equates to an approximate 8% increase
• Supply increases has been more pronounced recently with several new products opening over the first 4 months of FY2016, adding 500+ rooms to the market. These have been apartment orientated products without major operator/brands associated. These projects would have been conceived during the market upswing and will now place pressure on older and tired stock to either refurbish in a down market or risk loss of market position and perhaps closure
Supply Forecasts
• Supply forecasts to FY2023 represent a small absolute increase to the prior forecast
• Dransfield’s supply forecast is for 1,000 new rooms to enter the market over the next 9 years to FY2024 (23% of current stock) at an average annual growth rate of 2.3%
– It is important to note that half of these rooms have already opened during FY2016 and the market effect has already been felt
– The outlook for additional supply over the long term is for limited growth. Any project which has not already commenced, or does not have specific backing from a sponsor (Government or alternative) for a specific purpose or to stimulate the market, is either unlikely to proceed or will be significantly delayed, as feasibility is re-assessed
– Supply is unlikely to be absorbed over short to medium term as the market resets
– Unless there is more economic certainty for the region, it is hard to envisage any significant new proposal activity coming to light
– Quality concerns over currently available stock remain, and risk of supply withdrawal is a real possibility over the medium term
Supply Cycle Comparison
• Long term supply forecasts have received a minor increase of 200 rooms, representing a small uplift of 0.4% p.a which is converse to a decrease in demand expectations
• The identified live pipeline has infilled, increasing to 800 rooms compared with 200 rooms previously
– Construction activity includes a proportion of new properties which opened in the first quarter of FY2016 and were not considered in the previous forecast. Recently completed and under construction hotels account for 650 of the 800 identified rooms in the pipeline
0%
1%
2%
3%
4%
5%
6%
7%
8%
FY16 FY17 FY18 FY19 FY20 FY21 FY22 FY23 FY24
% G
row
th
HF 2016 - % Annual Growth HF2015 - % Annual Growth
2.3%
0.0%
1.0%
2.0%
3.0%
4.0%
5.0%
6.0%
-400
-200
0
200
400
600
800
1000
FY
10
FY
11
FY
12
FY
13
FY
14
FY
15
FY
16
FY
17
FY
18
FY
19
FY
20
FY
21
FY
22
FY
23
FY
24
# o
f ro
om
s
Market Response (1st Axis) Proposals (1st Axis)
Construction (1st Axis) Completed (1st Axis)
% Avg Annual Growth Act (FY10-15) % Avg Annual Growth Fcast (FY16-24)
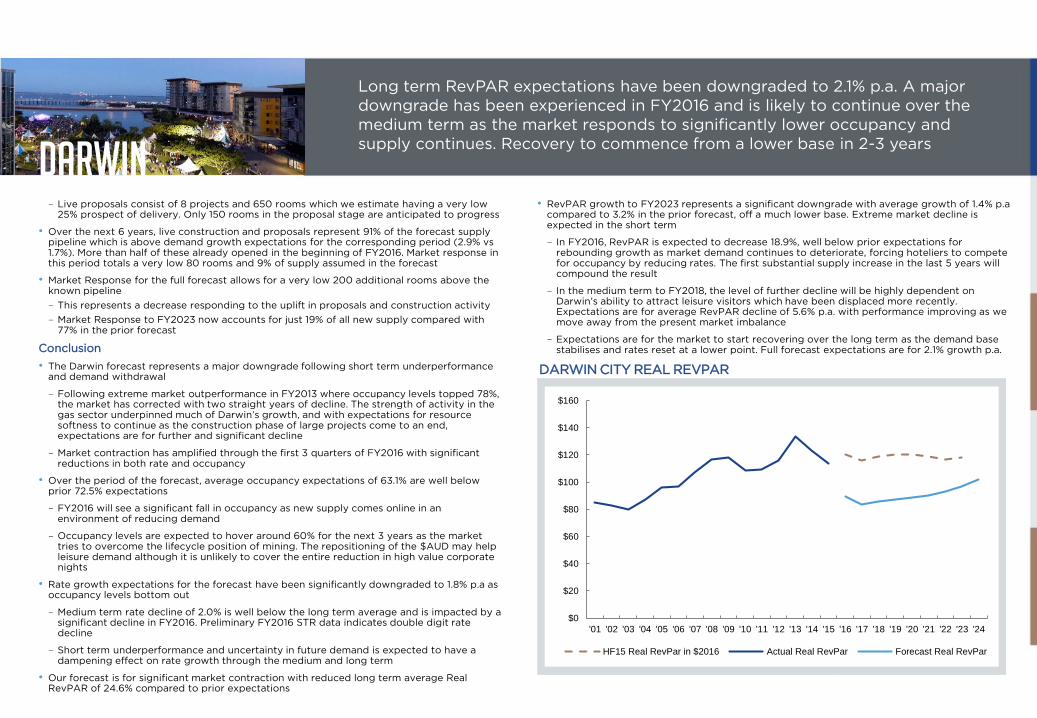
PP
DARWIN
www.dransfield.com.au36
Long term RevPAR expectations have been downgraded to 2.1% p.a. A major
downgrade has been experienced in FY2016 and is likely to continue over the
medium term as the market responds to significantly lower occupancy and
supply continues. Recovery to commence from a lower base in 2-3 years
DARWIN CITY REAL REVPAR
• RevPAR growth to FY2023 represents a significant downgrade with average growth of 1.4% p.a compared to 3.2% in the prior forecast, off a much lower base. Extreme market decline is expected in the short term
– In FY2016, RevPAR is expected to decrease 18.9%, well below prior expectations for rebounding growth as market demand continues to deteriorate, forcing hoteliers to compete for occupancy by reducing rates. The first substantial supply increase in the last 5 years will compound the result
– In the medium term to FY2018, the level of further decline will be highly dependent on Darwin’s ability to attract leisure visitors which have been displaced more recently. Expectations are for average RevPAR decline of 5.6% p.a. with performance improving as we move away from the present market imbalance
– Expectations are for the market to start recovering over the long term as the demand base stabilises and rates reset at a lower point. Full forecast expectations are for 2.1% growth p.a.
– Live proposals consist of 8 projects and 650 rooms which we estimate having a very low 25% prospect of delivery. Only 150 rooms in the proposal stage are anticipated to progress
• Over the next 6 years, live construction and proposals represent 91% of the forecast supply pipeline which is above demand growth expectations for the corresponding period (2.9% vs 1.7%). More than half of these already opened in the beginning of FY2016. Market response in this period totals a very low 80 rooms and 9% of supply assumed in the forecast
• Market Response for the full forecast allows for a very low 200 additional rooms above the known pipeline
– This represents a decrease responding to the uplift in proposals and construction activity
– Market Response to FY2023 now accounts for just 19% of all new supply compared with 77% in the prior forecast
Conclusion
• The Darwin forecast represents a major downgrade following short term underperformance and demand withdrawal
– Following extreme market outperformance in FY2013 where occupancy levels topped 78%, the market has corrected with two straight years of decline. The strength of activity in the gas sector underpinned much of Darwin’s growth, and with expectations for resource softness to continue as the construction phase of large projects come to an end, expectations are for further and significant decline
– Market contraction has amplified through the first 3 quarters of FY2016 with significant reductions in both rate and occupancy
• Over the period of the forecast, average occupancy expectations of 63.1% are well below prior 72.5% expectations
– FY2016 will see a significant fall in occupancy as new supply comes online in an environment of reducing demand
– Occupancy levels are expected to hover around 60% for the next 3 years as the market tries to overcome the lifecycle position of mining. The repositioning of the $AUD may help leisure demand although it is unlikely to cover the entire reduction in high value corporate nights
• Rate growth expectations for the forecast have been significantly downgraded to 1.8% p.a as occupancy levels bottom out
– Medium term rate decline of 2.0% is well below the long term average and is impacted by a significant decline in FY2016. Preliminary FY2016 STR data indicates double digit rate decline
– Short term underperformance and uncertainty in future demand is expected to have a dampening effect on rate growth through the medium and long term
• Our forecast is for significant market contraction with reduced long term average Real RevPAR of 24.6% compared to prior expectations
$0
$20
$40
$60
$80
$100
$120
$140
$160
'01 '02 '03 '04 '05 '06 '07 '08 '09 '10 '11 '12 '13 '14 '15 '16 '17 '18 '19 '20 '21 '22 '23 '24
HF15 Real RevPar in $2016 Actual Real RevPar Forecast Real RevPar
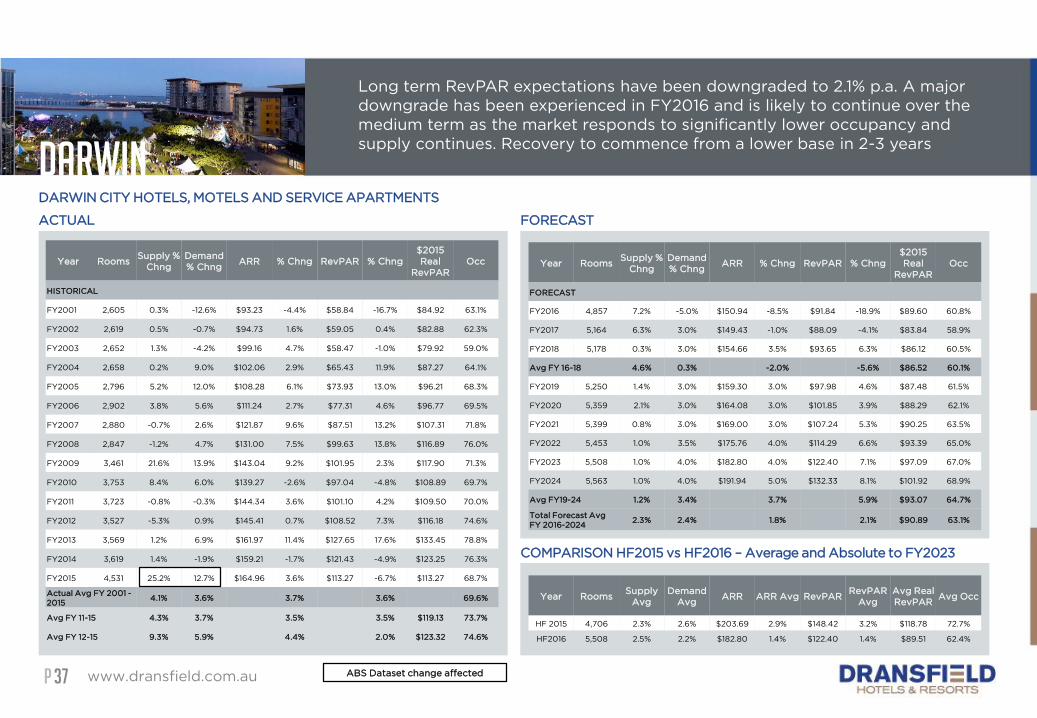
PP
COMPARISON HF2015 vs HF2016 – Average and Absolute to FY2023
DARWIN
www.dransfield.com.au37
Long term RevPAR expectations have been downgraded to 2.1% p.a. A major
downgrade has been experienced in FY2016 and is likely to continue over the
medium term as the market responds to significantly lower occupancy and
supply continues. Recovery to commence from a lower base in 2-3 years
DARWIN CITY HOTELS, MOTELS AND SERVICE APARTMENTS
ACTUAL FORECAST
Year RoomsSupply %
Chng
Demand
% ChngARR % Chng RevPAR % Chng
$2015
Real
RevPAR
Occ
HISTORICAL
FY2001 2,605 0.3% -12.6% $93.23 -4.4% $58.84 -16.7% $84.92 63.1%
FY2002 2,619 0.5% -0.7% $94.73 1.6% $59.05 0.4% $82.88 62.3%
FY2003 2,652 1.3% -4.2% $99.16 4.7% $58.47 -1.0% $79.92 59.0%
FY2004 2,658 0.2% 9.0% $102.06 2.9% $65.43 11.9% $87.27 64.1%
FY2005 2,796 5.2% 12.0% $108.28 6.1% $73.93 13.0% $96.21 68.3%
FY2006 2,902 3.8% 5.6% $111.24 2.7% $77.31 4.6% $96.77 69.5%
FY2007 2,880 -0.7% 2.6% $121.87 9.6% $87.51 13.2% $107.31 71.8%
FY2008 2,847 -1.2% 4.7% $131.00 7.5% $99.63 13.8% $116.89 76.0%
FY2009 3,461 21.6% 13.9% $143.04 9.2% $101.95 2.3% $117.90 71.3%
FY2010 3,753 8.4% 6.0% $139.27 -2.6% $97.04 -4.8% $108.89 69.7%
FY2011 3,723 -0.8% -0.3% $144.34 3.6% $101.10 4.2% $109.50 70.0%
FY2012 3,527 -5.3% 0.9% $145.41 0.7% $108.52 7.3% $116.18 74.6%
FY2013 3,569 1.2% 6.9% $161.97 11.4% $127.65 17.6% $133.45 78.8%
FY2014 3,619 1.4% -1.9% $159.21 -1.7% $121.43 -4.9% $123.25 76.3%
FY2015 4,531 25.2% 12.7% $164.96 3.6% $113.27 -6.7% $113.27 68.7%
Actual Avg FY 2001 -
20154.1% 3.6% 3.7% 3.6% 69.6%
Avg FY 11-15 4.3% 3.7% 3.5% 3.5% $119.13 73.7%
Avg FY 12-15 9.3% 5.9% 4.4% 2.0% $123.32 74.6%
Year RoomsSupply %
Chng
Demand
% ChngARR % Chng RevPAR % Chng
$2015
Real
RevPAR
Occ
FORECAST
FY2016 4,857 7.2% -5.0% $150.94 -8.5% $91.84 -18.9% $89.60 60.8%
FY2017 5,164 6.3% 3.0% $149.43 -1.0% $88.09 -4.1% $83.84 58.9%
FY2018 5,178 0.3% 3.0% $154.66 3.5% $93.65 6.3% $86.12 60.5%
Avg FY 16-18 4.6% 0.3% -2.0% -5.6% $86.52 60.1%
FY2019 5,250 1.4% 3.0% $159.30 3.0% $97.98 4.6% $87.48 61.5%
FY2020 5,359 2.1% 3.0% $164.08 3.0% $101.85 3.9% $88.29 62.1%
FY2021 5,399 0.8% 3.0% $169.00 3.0% $107.24 5.3% $90.25 63.5%
FY2022 5,453 1.0% 3.5% $175.76 4.0% $114.29 6.6% $93.39 65.0%
FY2023 5,508 1.0% 4.0% $182.80 4.0% $122.40 7.1% $97.09 67.0%
FY2024 5,563 1.0% 4.0% $191.94 5.0% $132.33 8.1% $101.92 68.9%
Avg FY19-24 1.2% 3.4% 3.7% 5.9% $93.07 64.7%
Total Forecast Avg
FY 2016-20242.3% 2.4% 1.8% 2.1% $90.89 63.1%
Year RoomsSupply
Avg
Demand
Avg ARR ARR Avg RevPAR
RevPAR
Avg
Avg Real
RevPARAvg Occ
HF 2015 4,706 2.3% 2.6% $203.69 2.9% $148.42 3.2% $118.78 72.7%
HF2016 5,508 2.5% 2.2% $182.80 1.4% $122.40 1.4% $89.51 62.4%
ABS Dataset change affected
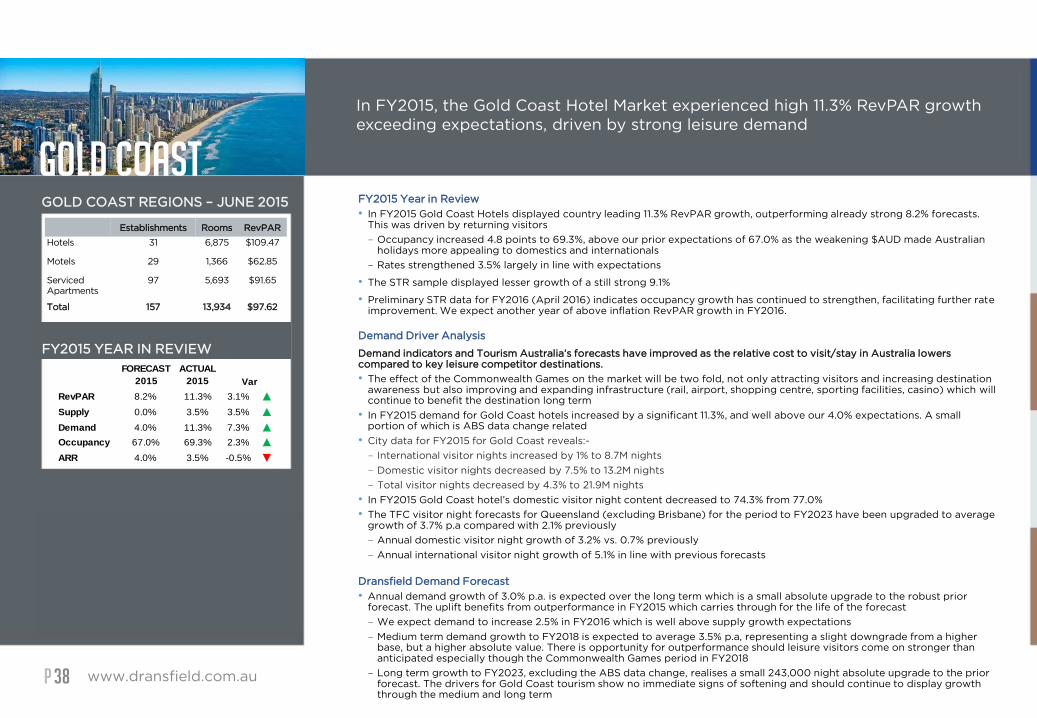
PP
GOLD COAST
www.dransfield.com.au38
In FY2015, the Gold Coast Hotel Market experienced high 11.3% RevPAR growth
exceeding expectations, driven by strong leisure demand
GOLD COAST REGIONS – JUNE 2015
Establishments Rooms RevPAR
Hotels 31 6,875 $109.47
Motels 29 1,366 $62.85
Serviced
Apartments
97 5,693 $91.65
Total 157 13,934 $97.62
FY2015 Year in Review
• In FY2015 Gold Coast Hotels displayed country leading 11.3% RevPAR growth, outperforming already strong 8.2% forecasts. This was driven by returning visitors
– Occupancy increased 4.8 points to 69.3%, above our prior expectations of 67.0% as the weakening $AUD made Australian holidays more appealing to domestics and internationals
– Rates strengthened 3.5% largely in line with expectations
• The STR sample displayed lesser growth of a still strong 9.1%
• Preliminary STR data for FY2016 (April 2016) indicates occupancy growth has continued to strengthen, facilitating further rate improvement. We expect another year of above inflation RevPAR growth in FY2016.
Demand Driver Analysis
Demand indicators and Tourism Australia’s forecasts have improved as the relative cost to visit/stay in Australia lowers compared to key leisure competitor destinations.
• The effect of the Commonwealth Games on the market will be two fold, not only attracting visitors and increasing destination awareness but also improving and expanding infrastructure (rail, airport, shopping centre, sporting facilities, casino) which will continue to benefit the destination long term
• In FY2015 demand for Gold Coast hotels increased by a significant 11.3%, and well above our 4.0% expectations. A small portion of which is ABS data change related
• City data for FY2015 for Gold Coast reveals:-
– International visitor nights increased by 1% to 8.7M nights
– Domestic visitor nights decreased by 7.5% to 13.2M nights
– Total visitor nights decreased by 4.3% to 21.9M nights
• In FY2015 Gold Coast hotel’s domestic visitor night content decreased to 74.3% from 77.0%
• The TFC visitor night forecasts for Queensland (excluding Brisbane) for the period to FY2023 have been upgraded to average growth of 3.7% p.a compared with 2.1% previously
– Annual domestic visitor night growth of 3.2% vs. 0.7% previously
– Annual international visitor night growth of 5.1% in line with previous forecasts
Dransfield Demand Forecast
• Annual demand growth of 3.0% p.a. is expected over the long term which is a small absolute upgrade to the robust prior forecast. The uplift benefits from outperformance in FY2015 which carries through for the life of the forecast
– We expect demand to increase 2.5% in FY2016 which is well above supply growth expectations
– Medium term demand growth to FY2018 is expected to average 3.5% p.a, representing a slight downgrade from a higher base, but a higher absolute value. There is opportunity for outperformance should leisure visitors come on stronger than anticipated especially though the Commonwealth Games period in FY2018
– Long term growth to FY2023, excluding the ABS data change, realises a small 243,000 night absolute upgrade to the prior forecast. The drivers for Gold Coast tourism show no immediate signs of softening and should continue to display growth through the medium and long term
FY2015 YEAR IN REVIEW
FORECAST
2015
ACTUAL
2015
RevPAR 8.2% 11.3% 3.1% ▲
Supply 0.0% 3.5% 3.5% ▲
Demand 4.0% 11.3% 7.3% ▲
Occupancy 67.0% 69.3% 2.3% ▲
ARR 4.0% 3.5% -0.5% ▼
Var
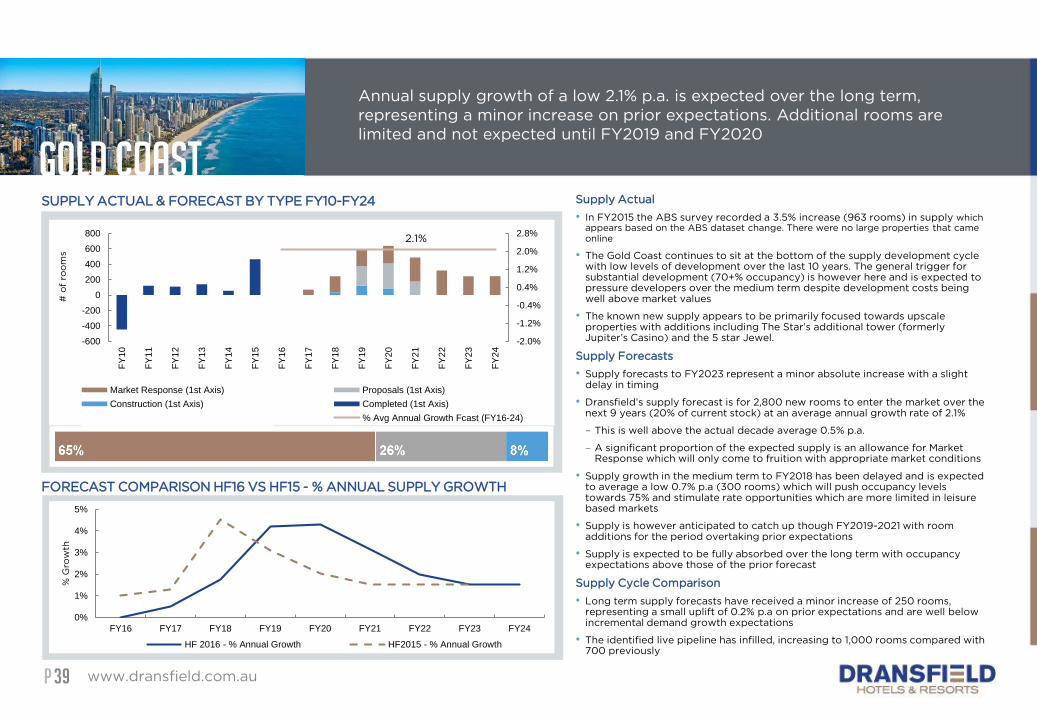
PP
GOLD COAST
www.dransfield.com.au39
Annual supply growth of a low 2.1% p.a. is expected over the long term,
representing a minor increase on prior expectations. Additional rooms are
limited and not expected until FY2019 and FY2020
Supply Actual
• In FY2015 the ABS survey recorded a 3.5% increase (963 rooms) in supply which appears based on the ABS dataset change. There were no large properties that came
online
• The Gold Coast continues to sit at the bottom of the supply development cycle with low levels of development over the last 10 years. The general trigger for substantial development (70+% occupancy) is however here and is expected to pressure developers over the medium term despite development costs being well above market values
• The known new supply appears to be primarily focused towards upscale properties with additions including The Star’s additional tower (formerly Jupiter’s Casino) and the 5 star Jewel.
Supply Forecasts
• Supply forecasts to FY2023 represent a minor absolute increase with a slight delay in timing
• Dransfield’s supply forecast is for 2,800 new rooms to enter the market over the next 9 years (20% of current stock) at an average annual growth rate of 2.1%
– This is well above the actual decade average 0.5% p.a.
– A significant proportion of the expected supply is an allowance for Market Response which will only come to fruition with appropriate market conditions
• Supply growth in the medium term to FY2018 has been delayed and is expected to average a low 0.7% p.a (300 rooms) which will push occupancy levels towards 75% and stimulate rate opportunities which are more limited in leisure based markets
• Supply is however anticipated to catch up though FY2019-2021 with room additions for the period overtaking prior expectations
• Supply is expected to be fully absorbed over the long term with occupancy expectations above those of the prior forecast
Supply Cycle Comparison
• Long term supply forecasts have received a minor increase of 250 rooms, representing a small uplift of 0.2% p.a on prior expectations and are well below incremental demand growth expectations
• The identified live pipeline has infilled, increasing to 1,000 rooms compared with 700 previously
SUPPLY ACTUAL & FORECAST BY TYPE FY10-FY24
FORECAST COMPARISON HF16 VS HF15 - % ANNUAL SUPPLY GROWTH
0%
1%
2%
3%
4%
5%
FY16 FY17 FY18 FY19 FY20 FY21 FY22 FY23 FY24
% G
row
th
HF 2016 - % Annual Growth HF2015 - % Annual Growth
2.1%
-2.0%
-1.2%
-0.4%
0.4%
1.2%
2.0%
2.8%
-600
-400
-200
0
200
400
600
800
FY
10
FY
11
FY
12
FY
13
FY
14
FY
15
FY
16
FY
17
FY
18
FY
19
FY
20
FY
21
FY
22
FY
23
FY
24
# o
f ro
om
s
Market Response (1st Axis) Proposals (1st Axis)
Construction (1st Axis) Completed (1st Axis)
% Avg Annual Growth Act (FY10-15) % Avg Annual Growth Fcast (FY16-24)
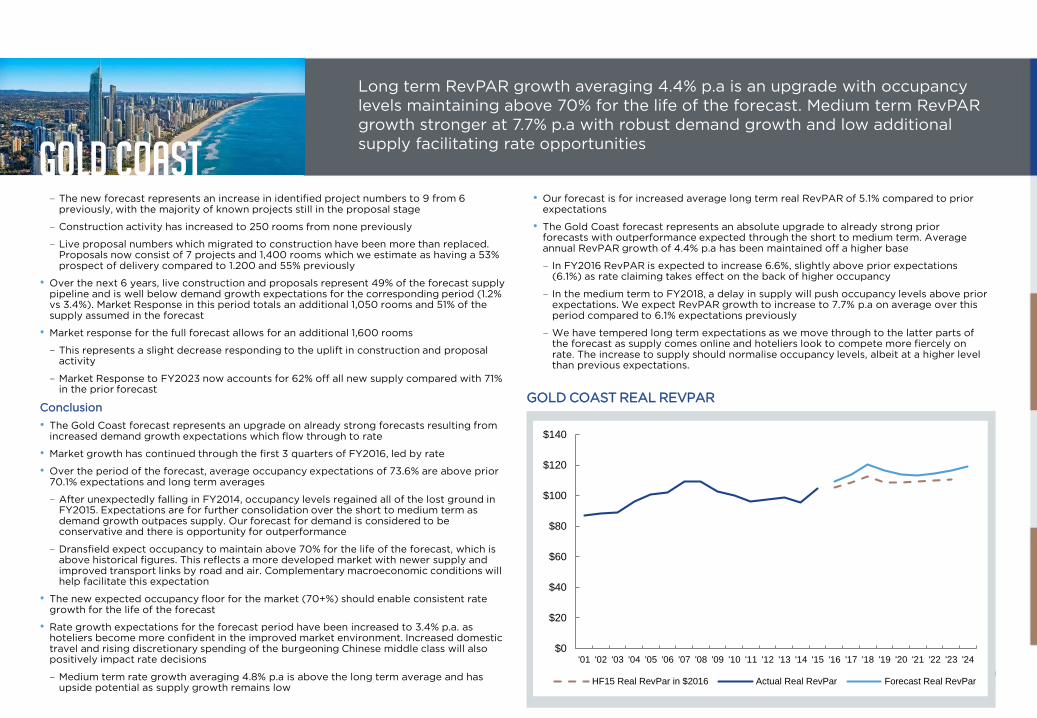
PP
GOLD COAST
40
Long term RevPAR growth averaging 4.4% p.a is an upgrade with occupancy
levels maintaining above 70% for the life of the forecast. Medium term RevPAR
growth stronger at 7.7% p.a with robust demand growth and low additional
supply facilitating rate opportunities
GOLD COAST REAL REVPAR
• Our forecast is for increased average long term real RevPAR of 5.1% compared to prior expectations
• The Gold Coast forecast represents an absolute upgrade to already strong prior forecasts with outperformance expected through the short to medium term. Average annual RevPAR growth of 4.4% p.a has been maintained off a higher base
– In FY2016 RevPAR is expected to increase 6.6%, slightly above prior expectations (6.1%) as rate claiming takes effect on the back of higher occupancy
– In the medium term to FY2018, a delay in supply will push occupancy levels above prior expectations. We expect RevPAR growth to increase to 7.7% p.a on average over this period compared to 6.1% expectations previously
– We have tempered long term expectations as we move through to the latter parts of the forecast as supply comes online and hoteliers look to compete more fiercely on rate. The increase to supply should normalise occupancy levels, albeit at a higher level than previous expectations.
– The new forecast represents an increase in identified project numbers to 9 from 6 previously, with the majority of known projects still in the proposal stage
– Construction activity has increased to 250 rooms from none previously
– Live proposal numbers which migrated to construction have been more than replaced. Proposals now consist of 7 projects and 1,400 rooms which we estimate as having a 53% prospect of delivery compared to 1.200 and 55% previously
• Over the next 6 years, live construction and proposals represent 49% of the forecast supply pipeline and is well below demand growth expectations for the corresponding period (1.2% vs 3.4%). Market Response in this period totals an additional 1,050 rooms and 51% of the supply assumed in the forecast
• Market response for the full forecast allows for an additional 1,600 rooms
– This represents a slight decrease responding to the uplift in construction and proposal activity
– Market Response to FY2023 now accounts for 62% off all new supply compared with 71% in the prior forecast
Conclusion
• The Gold Coast forecast represents an upgrade on already strong forecasts resulting from increased demand growth expectations which flow through to rate
• Market growth has continued through the first 3 quarters of FY2016, led by rate
• Over the period of the forecast, average occupancy expectations of 73.6% are above prior 70.1% expectations and long term averages
– After unexpectedly falling in FY2014, occupancy levels regained all of the lost ground in FY2015. Expectations are for further consolidation over the short to medium term as demand growth outpaces supply. Our forecast for demand is considered to be conservative and there is opportunity for outperformance
– Dransfield expect occupancy to maintain above 70% for the life of the forecast, which is above historical figures. This reflects a more developed market with newer supply and improved transport links by road and air. Complementary macroeconomic conditions will help facilitate this expectation
• The new expected occupancy floor for the market (70+%) should enable consistent rate growth for the life of the forecast
• Rate growth expectations for the forecast period have been increased to 3.4% p.a. as hoteliers become more confident in the improved market environment. Increased domestic travel and rising discretionary spending of the burgeoning Chinese middle class will also positively impact rate decisions
– Medium term rate growth averaging 4.8% p.a is above the long term average and has upside potential as supply growth remains low
$0
$20
$40
$60
$80
$100
$120
$140
'01 '02 '03 '04 '05 '06 '07 '08 '09 '10 '11 '12 '13 '14 '15 '16 '17 '18 '19 '20 '21 '22 '23 '24
HF15 Real RevPar in $2016 Actual Real RevPar
Forecast Real RevPar
$0
$20
$40
$60
$80
$100
$120
$140
'01 '02 '03 '04 '05 '06 '07 '08 '09 '10 '11 '12 '13 '14 '15 '16 '17 '18 '19 '20 '21 '22 '23 '24
HF15 Real RevPar in $2016 Actual Real RevPar Forecast Real RevPar
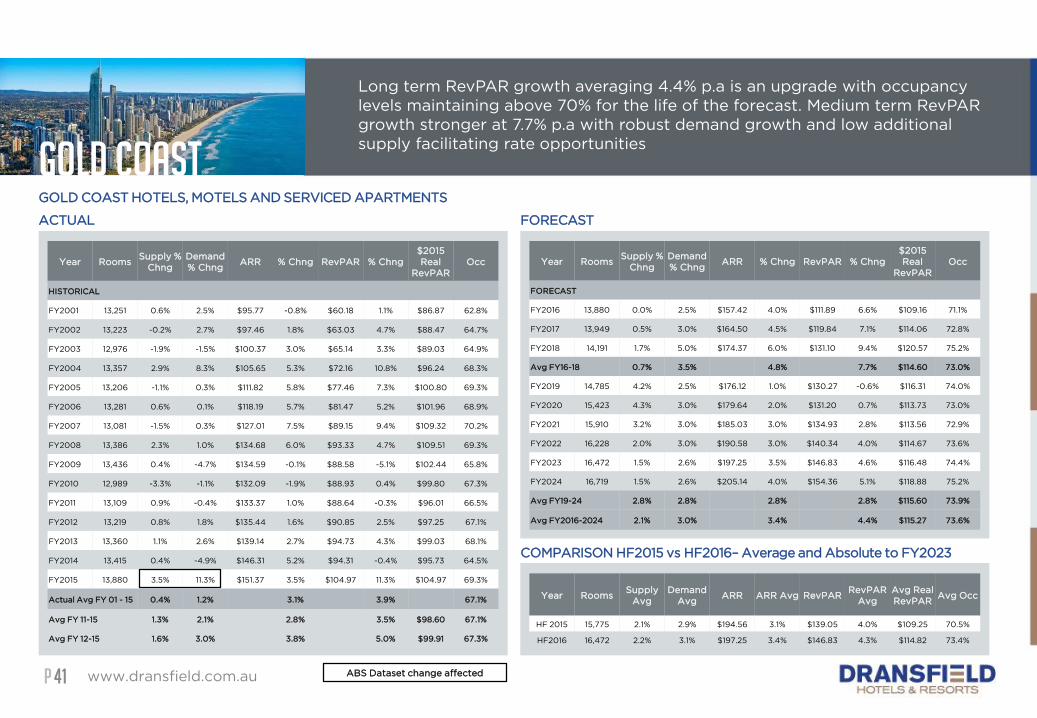
PP
COMPARISON HF2015 vs HF2016– Average and Absolute to FY2023
GOLD COAST
www.dransfield.com.au41
Long term RevPAR growth averaging 4.4% p.a is an upgrade with occupancy
levels maintaining above 70% for the life of the forecast. Medium term RevPAR
growth stronger at 7.7% p.a with robust demand growth and low additional
supply facilitating rate opportunities
GOLD COAST HOTELS, MOTELS AND SERVICED APARTMENTS
ACTUAL FORECAST
Year RoomsSupply %
Chng
Demand
% ChngARR % Chng RevPAR % Chng
$2015
Real
RevPAR
Occ
HISTORICAL
FY2001 13,251 0.6% 2.5% $95.77 -0.8% $60.18 1.1% $86.87 62.8%
FY2002 13,223 -0.2% 2.7% $97.46 1.8% $63.03 4.7% $88.47 64.7%
FY2003 12,976 -1.9% -1.5% $100.37 3.0% $65.14 3.3% $89.03 64.9%
FY2004 13,357 2.9% 8.3% $105.65 5.3% $72.16 10.8% $96.24 68.3%
FY2005 13,206 -1.1% 0.3% $111.82 5.8% $77.46 7.3% $100.80 69.3%
FY2006 13,281 0.6% 0.1% $118.19 5.7% $81.47 5.2% $101.96 68.9%
FY2007 13,081 -1.5% 0.3% $127.01 7.5% $89.15 9.4% $109.32 70.2%
FY2008 13,386 2.3% 1.0% $134.68 6.0% $93.33 4.7% $109.51 69.3%
FY2009 13,436 0.4% -4.7% $134.59 -0.1% $88.58 -5.1% $102.44 65.8%
FY2010 12,989 -3.3% -1.1% $132.09 -1.9% $88.93 0.4% $99.80 67.3%
FY2011 13,109 0.9% -0.4% $133.37 1.0% $88.64 -0.3% $96.01 66.5%
FY2012 13,219 0.8% 1.8% $135.44 1.6% $90.85 2.5% $97.25 67.1%
FY2013 13,360 1.1% 2.6% $139.14 2.7% $94.73 4.3% $99.03 68.1%
FY2014 13,415 0.4% -4.9% $146.31 5.2% $94.31 -0.4% $95.73 64.5%
FY2015 13,880 3.5% 11.3% $151.37 3.5% $104.97 11.3% $104.97 69.3%
Actual Avg FY 01 - 15 0.4% 1.2% 3.1% 3.9% 67.1%
Avg FY 11-15 1.3% 2.1% 2.8% 3.5% $98.60 67.1%
Avg FY 12-15 1.6% 3.0% 3.8% 5.0% $99.91 67.3%
Year RoomsSupply %
Chng
Demand
% ChngARR % Chng RevPAR % Chng
$2015
Real
RevPAR
Occ
FORECAST
FY2016 13,880 0.0% 2.5% $157.42 4.0% $111.89 6.6% $109.16 71.1%
FY2017 13,949 0.5% 3.0% $164.50 4.5% $119.84 7.1% $114.06 72.8%
FY2018 14,191 1.7% 5.0% $174.37 6.0% $131.10 9.4% $120.57 75.2%
Avg FY16-18 0.7% 3.5% 4.8% 7.7% $114.60 73.0%
FY2019 14,785 4.2% 2.5% $176.12 1.0% $130.27 -0.6% $116.31 74.0%
FY2020 15,423 4.3% 3.0% $179.64 2.0% $131.20 0.7% $113.73 73.0%
FY2021 15,910 3.2% 3.0% $185.03 3.0% $134.93 2.8% $113.56 72.9%
FY2022 16,228 2.0% 3.0% $190.58 3.0% $140.34 4.0% $114.67 73.6%
FY2023 16,472 1.5% 2.6% $197.25 3.5% $146.83 4.6% $116.48 74.4%
FY2024 16,719 1.5% 2.6% $205.14 4.0% $154.36 5.1% $118.88 75.2%
Avg FY19-24 2.8% 2.8% 2.8% 2.8% $115.60 73.9%
Avg FY2016-2024 2.1% 3.0% 3.4% 4.4% $115.27 73.6%
Year RoomsSupply
Avg
Demand
Avg ARR ARR Avg RevPAR
RevPAR
Avg
Avg Real
RevPARAvg Occ
HF 2015 15,775 2.1% 2.9% $194.56 3.1% $139.05 4.0% $109.25 70.5%
HF2016 16,472 2.2% 3.1% $197.25 3.4% $146.83 4.3% $114.82 73.4%
ABS Dataset change affected
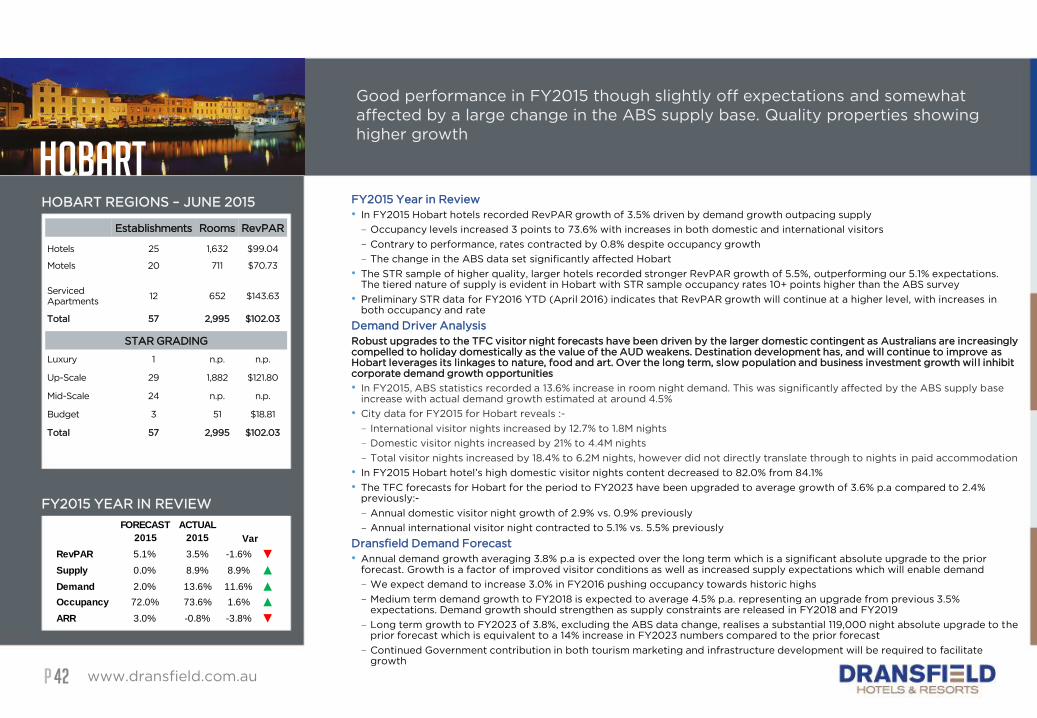
PP
Hobart
www.dransfield.com.au42
Good performance in FY2015 though slightly off expectations and somewhat
affected by a large change in the ABS supply base. Quality properties showing
higher growth
FY2015 Year in Review
• In FY2015 Hobart hotels recorded RevPAR growth of 3.5% driven by demand growth outpacing supply
– Occupancy levels increased 3 points to 73.6% with increases in both domestic and international visitors
– Contrary to performance, rates contracted by 0.8% despite occupancy growth
– The change in the ABS data set significantly affected Hobart
• The STR sample of higher quality, larger hotels recorded stronger RevPAR growth of 5.5%, outperforming our 5.1% expectations.The tiered nature of supply is evident in Hobart with STR sample occupancy rates 10+ points higher than the ABS survey
• Preliminary STR data for FY2016 YTD (April 2016) indicates that RevPAR growth will continue at a higher level, with increases inboth occupancy and rate
Demand Driver Analysis
Robust upgrades to the TFC visitor night forecasts have been driven by the larger domestic contingent as Australians are increasingly compelled to holiday domestically as the value of the AUD weakens. Destination development has, and will continue to improve as Hobart leverages its linkages to nature, food and art. Over the long term, slow population and business investment growth will inhibit corporate demand growth opportunities
• In FY2015, ABS statistics recorded a 13.6% increase in room night demand. This was significantly affected by the ABS supply baseincrease with actual demand growth estimated at around 4.5%
• City data for FY2015 for Hobart reveals :-
– International visitor nights increased by 12.7% to 1.8M nights
– Domestic visitor nights increased by 21% to 4.4M nights
– Total visitor nights increased by 18.4% to 6.2M nights, however did not directly translate through to nights in paid accommodation
• In FY2015 Hobart hotel’s high domestic visitor nights content decreased to 82.0% from 84.1%
• The TFC forecasts for Hobart for the period to FY2023 have been upgraded to average growth of 3.6% p.a compared to 2.4% previously:-
– Annual domestic visitor night growth of 2.9% vs. 0.9% previously
– Annual international visitor night contracted to 5.1% vs. 5.5% previously
Dransfield Demand Forecast
• Annual demand growth averaging 3.8% p.a is expected over the long term which is a significant absolute upgrade to the prior forecast. Growth is a factor of improved visitor conditions as well as increased supply expectations which will enable demand
– We expect demand to increase 3.0% in FY2016 pushing occupancy towards historic highs
– Medium term demand growth to FY2018 is expected to average 4.5% p.a. representing an upgrade from previous 3.5% expectations. Demand growth should strengthen as supply constraints are released in FY2018 and FY2019
– Long term growth to FY2023 of 3.8%, excluding the ABS data change, realises a substantial 119,000 night absolute upgrade to the prior forecast which is equivalent to a 14% increase in FY2023 numbers compared to the prior forecast
– Continued Government contribution in both tourism marketing and infrastructure development will be required to facilitate growth
HOBART REGIONS – JUNE 2015
FY2015 YEAR IN REVIEW
Establishments Rooms RevPAR
Hotels 25 1,632 $99.04
Motels 20 711 $70.73
Serviced
Apartments12 652 $143.63
Total 57 2,995 $102.03
STAR GRADING
Luxury 1 n.p. n.p.
Up-Scale 29 1,882 $121.80
Mid-Scale 24 n.p. n.p.
Budget 3 51 $18.81
Total 57 2,995 $102.03
FORECAST
2015
ACTUAL
2015
RevPAR 5.1% 3.5% -1.6% ▼
Supply 0.0% 8.9% 8.9% ▲
Demand 2.0% 13.6% 11.6% ▲
Occupancy 72.0% 73.6% 1.6% ▲
ARR 3.0% -0.8% -3.8% ▼
Var
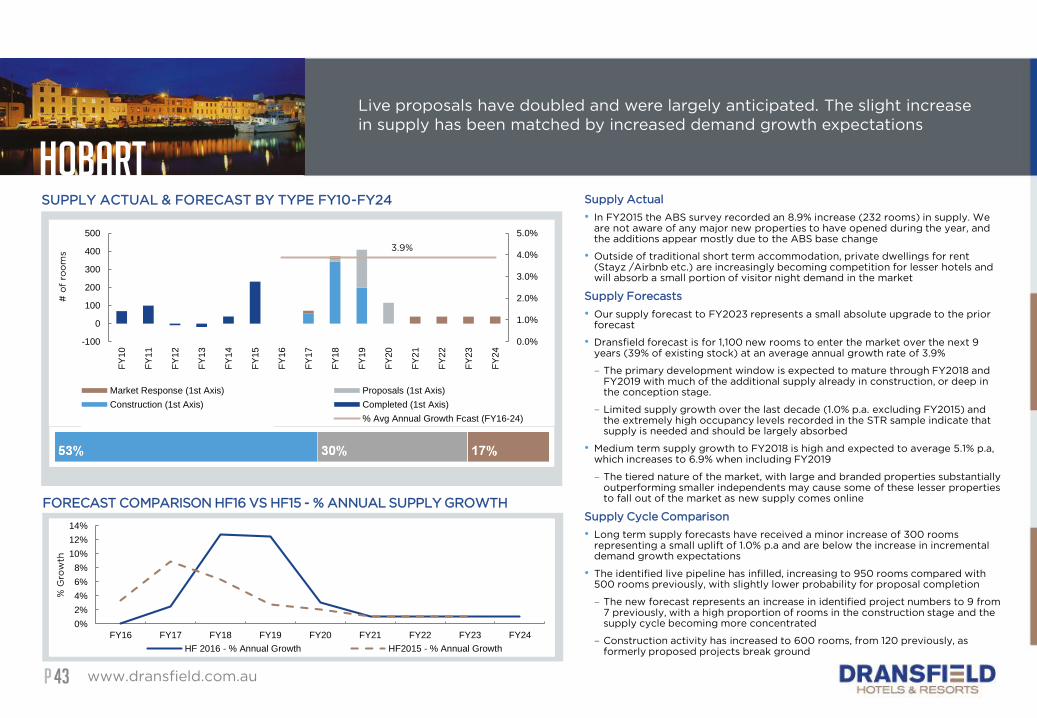
PP
Hobart
www.dransfield.com.au43
Live proposals have doubled and were largely anticipated. The slight increase
in supply has been matched by increased demand growth expectations
SUPPLY ACTUAL & FORECAST BY TYPE FY10-FY24
FORECAST COMPARISON HF16 VS HF15 - % ANNUAL SUPPLY GROWTH
Supply Actual
• In FY2015 the ABS survey recorded an 8.9% increase (232 rooms) in supply. We are not aware of any major new properties to have opened during the year, and the additions appear mostly due to the ABS base change
• Outside of traditional short term accommodation, private dwellings for rent (Stayz /Airbnb etc.) are increasingly becoming competition for lesser hotels and will absorb a small portion of visitor night demand in the market
Supply Forecasts
• Our supply forecast to FY2023 represents a small absolute upgrade to the prior forecast
• Dransfield forecast is for 1,100 new rooms to enter the market over the next 9 years (39% of existing stock) at an average annual growth rate of 3.9%
– The primary development window is expected to mature through FY2018 and FY2019 with much of the additional supply already in construction, or deep in the conception stage.
– Limited supply growth over the last decade (1.0% p.a. excluding FY2015) and the extremely high occupancy levels recorded in the STR sample indicate that supply is needed and should be largely absorbed
• Medium term supply growth to FY2018 is high and expected to average 5.1% p.a, which increases to 6.9% when including FY2019
– The tiered nature of the market, with large and branded properties substantially outperforming smaller independents may cause some of these lesser properties to fall out of the market as new supply comes online
Supply Cycle Comparison
• Long term supply forecasts have received a minor increase of 300 rooms representing a small uplift of 1.0% p.a and are below the increase in incremental demand growth expectations
• The identified live pipeline has infilled, increasing to 950 rooms compared with 500 rooms previously, with slightly lower probability for proposal completion
– The new forecast represents an increase in identified project numbers to 9 from 7 previously, with a high proportion of rooms in the construction stage and the supply cycle becoming more concentrated
– Construction activity has increased to 600 rooms, from 120 previously, as formerly proposed projects break ground
0%
2%
4%
6%
8%
10%
12%
14%
FY16 FY17 FY18 FY19 FY20 FY21 FY22 FY23 FY24
% G
row
th
HF 2016 - % Annual Growth HF2015 - % Annual Growth
3.9%
0.0%
1.0%
2.0%
3.0%
4.0%
5.0%
-100
0
100
200
300
400
500
FY
10
FY
11
FY
12
FY
13
FY
14
FY
15
FY
16
FY
17
FY
18
FY
19
FY
20
FY
21
FY
22
FY
23
FY
24
# o
f ro
om
s
Market Response (1st Axis) Proposals (1st Axis)
Construction (1st Axis) Completed (1st Axis)
% Avg Annual Growth Act (FY10-15) % Avg Annual Growth Fcast (FY16-24)
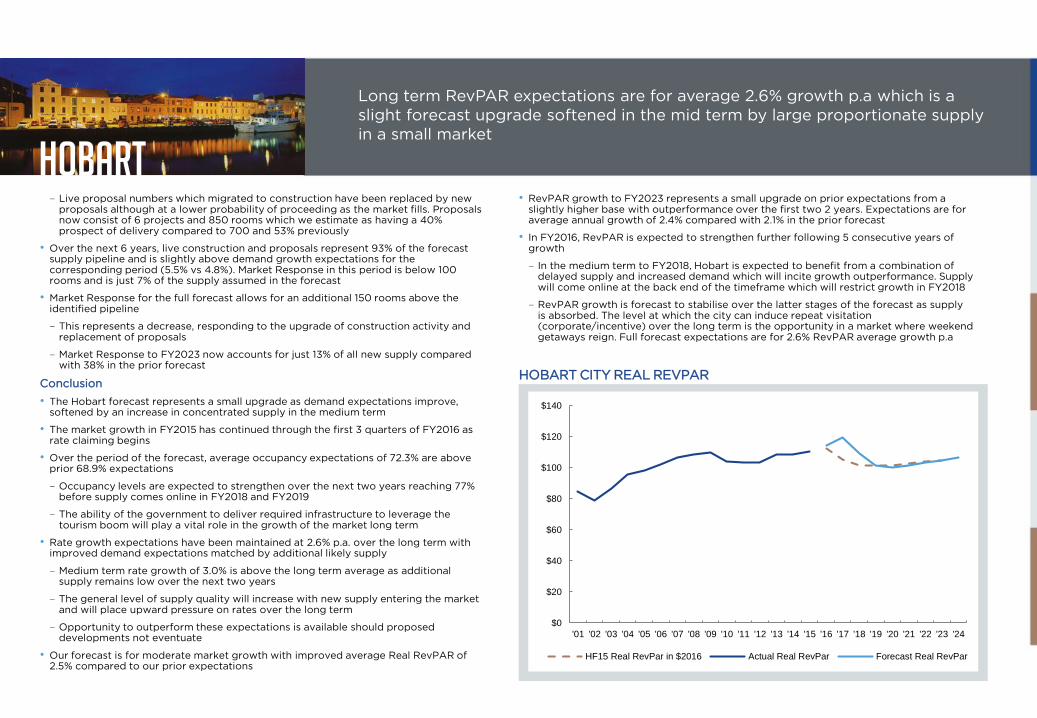
PP
Hobart
www.dransfield.com.au44
Long term RevPAR expectations are for average 2.6% growth p.a which is a
slight forecast upgrade softened in the mid term by large proportionate supply
in a small market
• RevPAR growth to FY2023 represents a small upgrade on prior expectations from a slightly higher base with outperformance over the first two 2 years. Expectations are for average annual growth of 2.4% compared with 2.1% in the prior forecast
• In FY2016, RevPAR is expected to strengthen further following 5 consecutive years of growth
– In the medium term to FY2018, Hobart is expected to benefit from a combination of delayed supply and increased demand which will incite growth outperformance. Supply will come online at the back end of the timeframe which will restrict growth in FY2018
– RevPAR growth is forecast to stabilise over the latter stages of the forecast as supply is absorbed. The level at which the city can induce repeat visitation (corporate/incentive) over the long term is the opportunity in a market where weekend getaways reign. Full forecast expectations are for 2.6% RevPAR average growth p.a
– Live proposal numbers which migrated to construction have been replaced by new proposals although at a lower probability of proceeding as the market fills. Proposals now consist of 6 projects and 850 rooms which we estimate as having a 40% prospect of delivery compared to 700 and 53% previously
• Over the next 6 years, live construction and proposals represent 93% of the forecast supply pipeline and is slightly above demand growth expectations for the corresponding period (5.5% vs 4.8%). Market Response in this period is below 100 rooms and is just 7% of the supply assumed in the forecast
• Market Response for the full forecast allows for an additional 150 rooms above the identified pipeline
– This represents a decrease, responding to the upgrade of construction activity and replacement of proposals
– Market Response to FY2023 now accounts for just 13% of all new supply compared with 38% in the prior forecast
Conclusion
• The Hobart forecast represents a small upgrade as demand expectations improve, softened by an increase in concentrated supply in the medium term
• The market growth in FY2015 has continued through the first 3 quarters of FY2016 as rate claiming begins
• Over the period of the forecast, average occupancy expectations of 72.3% are above prior 68.9% expectations
– Occupancy levels are expected to strengthen over the next two years reaching 77% before supply comes online in FY2018 and FY2019
– The ability of the government to deliver required infrastructure to leverage the tourism boom will play a vital role in the growth of the market long term
• Rate growth expectations have been maintained at 2.6% p.a. over the long term with improved demand expectations matched by additional likely supply
– Medium term rate growth of 3.0% is above the long term average as additional supply remains low over the next two years
– The general level of supply quality will increase with new supply entering the market and will place upward pressure on rates over the long term
– Opportunity to outperform these expectations is available should proposed developments not eventuate
• Our forecast is for moderate market growth with improved average Real RevPAR of 2.5% compared to our prior expectations
HOBART CITY REAL REVPAR
$0
$20
$40
$60
$80
$100
$120
$140
'01 '02 '03 '04 '05 '06 '07 '08 '09 '10 '11 '12 '13 '14 '15 '16 '17 '18 '19 '20 '21 '22 '23 '24
HF15 Real RevPar in $2016 Actual Real RevPar Forecast Real RevPar
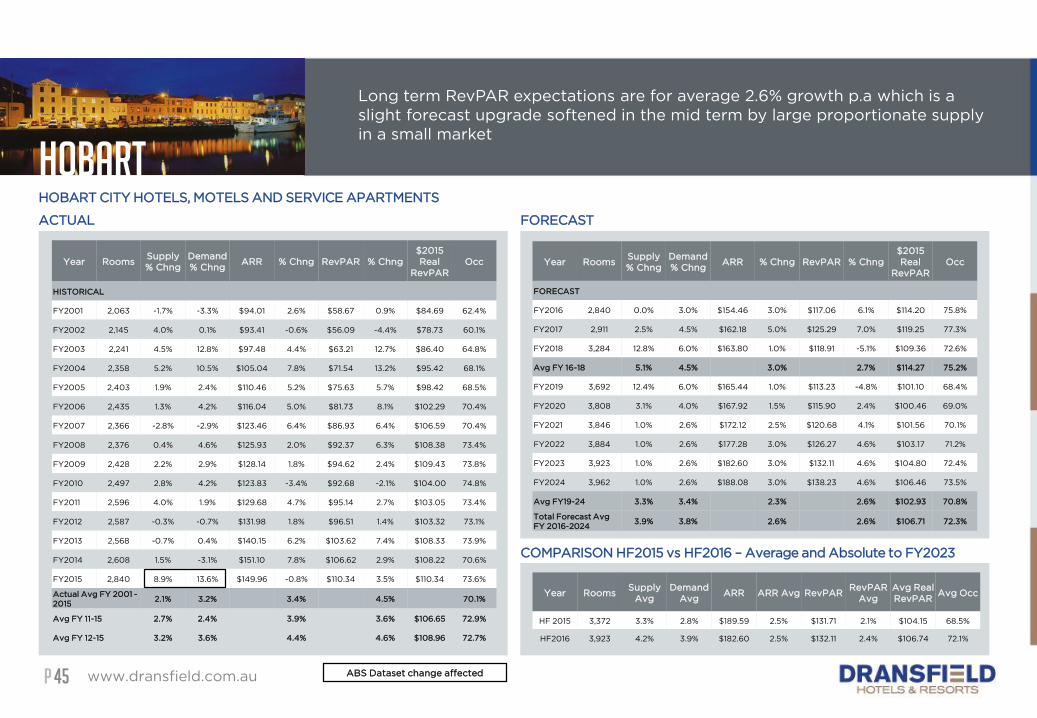
PP
COMPARISON HF2015 vs HF2016 – Average and Absolute to FY2023
Hobart
www.dransfield.com.au45
Long term RevPAR expectations are for average 2.6% growth p.a which is a
slight forecast upgrade softened in the mid term by large proportionate supply
in a small market
HOBART CITY HOTELS, MOTELS AND SERVICE APARTMENTS
ACTUAL FORECAST
Year RoomsSupply
% Chng
Demand
% ChngARR % Chng RevPAR % Chng
$2015
Real
RevPAR
Occ
HISTORICAL
FY2001 2,063 -1.7% -3.3% $94.01 2.6% $58.67 0.9% $84.69 62.4%
FY2002 2,145 4.0% 0.1% $93.41 -0.6% $56.09 -4.4% $78.73 60.1%
FY2003 2,241 4.5% 12.8% $97.48 4.4% $63.21 12.7% $86.40 64.8%
FY2004 2,358 5.2% 10.5% $105.04 7.8% $71.54 13.2% $95.42 68.1%
FY2005 2,403 1.9% 2.4% $110.46 5.2% $75.63 5.7% $98.42 68.5%
FY2006 2,435 1.3% 4.2% $116.04 5.0% $81.73 8.1% $102.29 70.4%
FY2007 2,366 -2.8% -2.9% $123.46 6.4% $86.93 6.4% $106.59 70.4%
FY2008 2,376 0.4% 4.6% $125.93 2.0% $92.37 6.3% $108.38 73.4%
FY2009 2,428 2.2% 2.9% $128.14 1.8% $94.62 2.4% $109.43 73.8%
FY2010 2,497 2.8% 4.2% $123.83 -3.4% $92.68 -2.1% $104.00 74.8%
FY2011 2,596 4.0% 1.9% $129.68 4.7% $95.14 2.7% $103.05 73.4%
FY2012 2,587 -0.3% -0.7% $131.98 1.8% $96.51 1.4% $103.32 73.1%
FY2013 2,568 -0.7% 0.4% $140.15 6.2% $103.62 7.4% $108.33 73.9%
FY2014 2,608 1.5% -3.1% $151.10 7.8% $106.62 2.9% $108.22 70.6%
FY2015 2,840 8.9% 13.6% $149.96 -0.8% $110.34 3.5% $110.34 73.6%
Actual Avg FY 2001 -
20152.1% 3.2% 3.4% 4.5% 70.1%
Avg FY 11-15 2.7% 2.4% 3.9% 3.6% $106.65 72.9%
Avg FY 12-15 3.2% 3.6% 4.4% 4.6% $108.96 72.7%
Year RoomsSupply
% Chng
Demand
% ChngARR % Chng RevPAR % Chng
$2015
Real
RevPAR
Occ
FORECAST
FY2016 2,840 0.0% 3.0% $154.46 3.0% $117.06 6.1% $114.20 75.8%
FY2017 2,911 2.5% 4.5% $162.18 5.0% $125.29 7.0% $119.25 77.3%
FY2018 3,284 12.8% 6.0% $163.80 1.0% $118.91 -5.1% $109.36 72.6%
Avg FY 16-18 5.1% 4.5% 3.0% 2.7% $114.27 75.2%
FY2019 3,692 12.4% 6.0% $165.44 1.0% $113.23 -4.8% $101.10 68.4%
FY2020 3,808 3.1% 4.0% $167.92 1.5% $115.90 2.4% $100.46 69.0%
FY2021 3,846 1.0% 2.6% $172.12 2.5% $120.68 4.1% $101.56 70.1%
FY2022 3,884 1.0% 2.6% $177.28 3.0% $126.27 4.6% $103.17 71.2%
FY2023 3,923 1.0% 2.6% $182.60 3.0% $132.11 4.6% $104.80 72.4%
FY2024 3,962 1.0% 2.6% $188.08 3.0% $138.23 4.6% $106.46 73.5%
Avg FY19-24 3.3% 3.4% 2.3% 2.6% $102.93 70.8%
Total Forecast Avg
FY 2016-20243.9% 3.8% 2.6% 2.6% $106.71 72.3%
Year RoomsSupply
Avg
Demand
Avg ARR ARR Avg RevPAR
RevPAR
Avg
Avg Real
RevPARAvg Occ
HF 2015 3,372 3.3% 2.8% $189.59 2.5% $131.71 2.1% $104.15 68.5%
HF2016 3,923 4.2% 3.9% $182.60 2.5% $132.11 2.4% $106.74 72.1%
ABS Dataset change affected
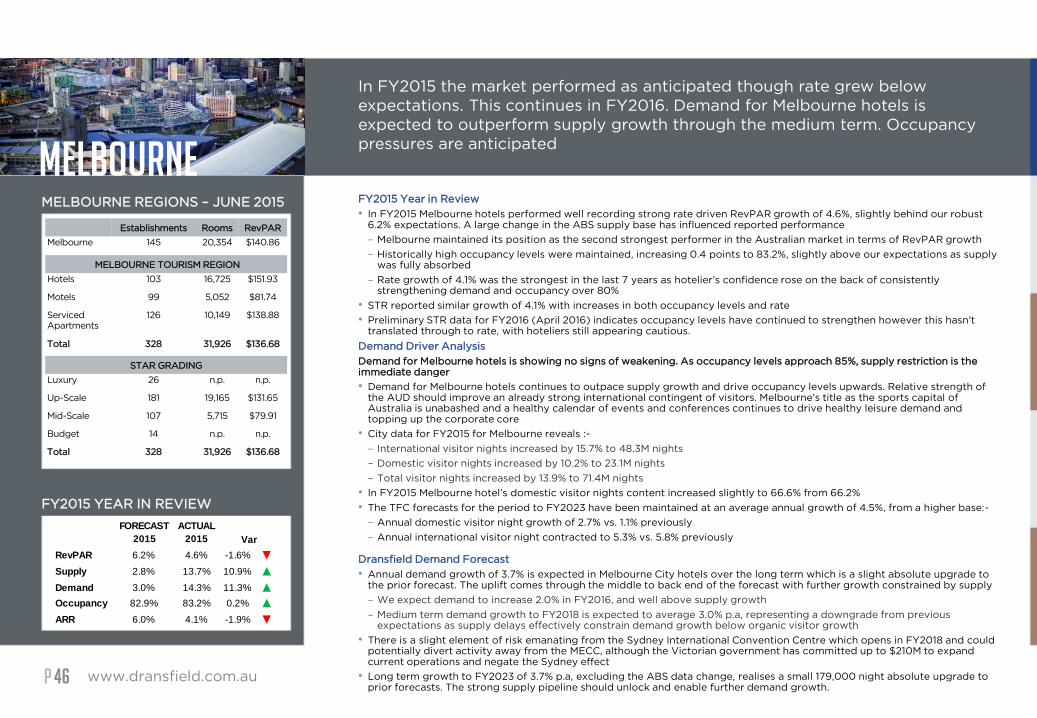
PP
Melbourne
www.dransfield.com.au46
In FY2015 the market performed as anticipated though rate grew below
expectations. This continues in FY2016. Demand for Melbourne hotels is
expected to outperform supply growth through the medium term. Occupancy
pressures are anticipated
MELBOURNE REGIONS – JUNE 2015
FY2015 YEAR IN REVIEW
Establishments Rooms RevPAR
Melbourne 145 20,354 $140.86
MELBOURNE TOURISM REGION
Hotels 103 16,725 $151.93
Motels 99 5,052 $81.74
Serviced
Apartments
126 10,149 $138.88
Total 328 31,926 $136.68
STAR GRADING
Luxury 26 n.p. n.p.
Up-Scale 181 19,165 $131.65
Mid-Scale 107 5,715 $79.91
Budget 14 n.p. n.p.
Total 328 31,926 $136.68
FY2015 Year in Review
• In FY2015 Melbourne hotels performed well recording strong rate driven RevPAR growth of 4.6%, slightly behind our robust 6.2% expectations. A large change in the ABS supply base has influenced reported performance
– Melbourne maintained its position as the second strongest performer in the Australian market in terms of RevPAR growth
– Historically high occupancy levels were maintained, increasing 0.4 points to 83.2%, slightly above our expectations as supply was fully absorbed
– Rate growth of 4.1% was the strongest in the last 7 years as hotelier’s confidence rose on the back of consistently strengthening demand and occupancy over 80%
• STR reported similar growth of 4.1% with increases in both occupancy levels and rate
• Preliminary STR data for FY2016 (April 2016) indicates occupancy levels have continued to strengthen however this hasn’t translated through to rate, with hoteliers still appearing cautious.
Demand Driver Analysis
Demand for Melbourne hotels is showing no signs of weakening. As occupancy levels approach 85%, supply restriction is the immediate danger
• Demand for Melbourne hotels continues to outpace supply growth and drive occupancy levels upwards. Relative strength of the AUD should improve an already strong international contingent of visitors. Melbourne’s title as the sports capital of Australia is unabashed and a healthy calendar of events and conferences continues to drive healthy leisure demand and topping up the corporate core
• City data for FY2015 for Melbourne reveals :-
– International visitor nights increased by 15.7% to 48.3M nights
– Domestic visitor nights increased by 10.2% to 23.1M nights
– Total visitor nights increased by 13.9% to 71.4M nights
• In FY2015 Melbourne hotel’s domestic visitor nights content increased slightly to 66.6% from 66.2%
• The TFC forecasts for the period to FY2023 have been maintained at an average annual growth of 4.5%, from a higher base:-
– Annual domestic visitor night growth of 2.7% vs. 1.1% previously
– Annual international visitor night contracted to 5.3% vs. 5.8% previously
Dransfield Demand Forecast
• Annual demand growth of 3.7% is expected in Melbourne City hotels over the long term which is a slight absolute upgrade to the prior forecast. The uplift comes through the middle to back end of the forecast with further growth constrained by supply
– We expect demand to increase 2.0% in FY2016, and well above supply growth
– Medium term demand growth to FY2018 is expected to average 3.0% p.a, representing a downgrade from previous expectations as supply delays effectively constrain demand growth below organic visitor growth
• There is a slight element of risk emanating from the Sydney International Convention Centre which opens in FY2018 and could potentially divert activity away from the MECC, although the Victorian government has committed up to $210M to expand current operations and negate the Sydney effect
• Long term growth to FY2023 of 3.7% p.a, excluding the ABS data change, realises a small 179,000 night absolute upgrade to prior forecasts. The strong supply pipeline should unlock and enable further demand growth.
FORECAST
2015
ACTUAL
2015
RevPAR 6.2% 4.6% -1.6% ▼
Supply 2.8% 13.7% 10.9% ▲
Demand 3.0% 14.3% 11.3% ▲
Occupancy 82.9% 83.2% 0.2% ▲
ARR 6.0% 4.1% -1.9% ▼
Var
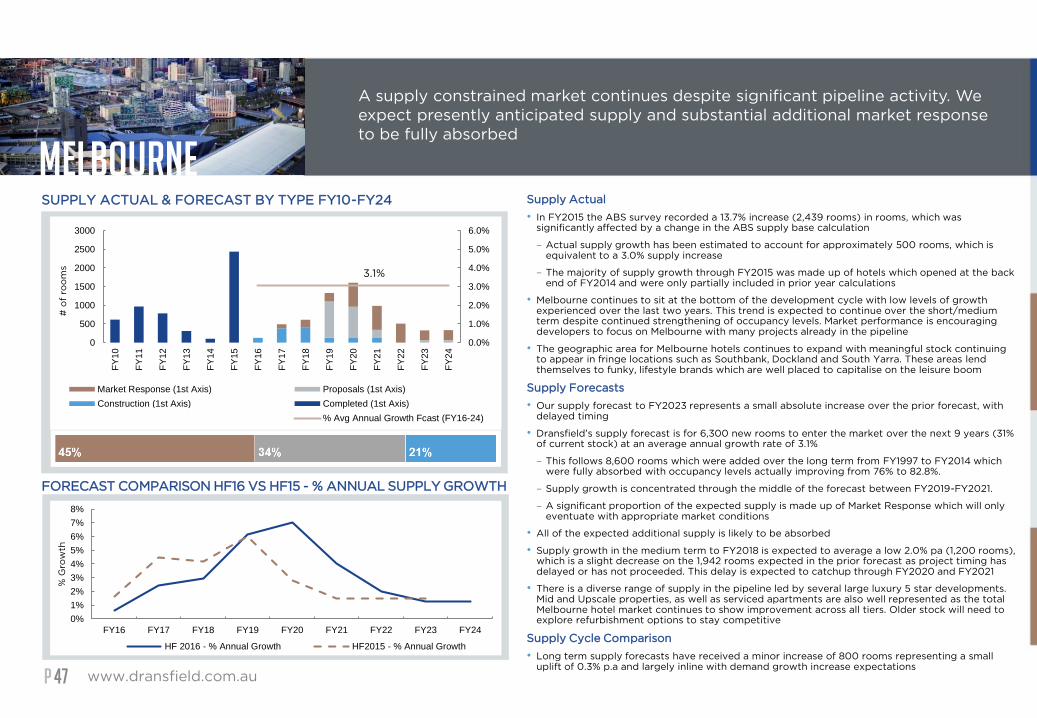
PP
Melbourne
www.dransfield.com.au47
A supply constrained market continues despite significant pipeline activity. We
expect presently anticipated supply and substantial additional market response
to be fully absorbed
SUPPLY ACTUAL & FORECAST BY TYPE FY10-FY24
FORECAST COMPARISON HF16 VS HF15 - % ANNUAL SUPPLY GROWTH
Supply Actual
• In FY2015 the ABS survey recorded a 13.7% increase (2,439 rooms) in rooms, which was significantly affected by a change in the ABS supply base calculation
– Actual supply growth has been estimated to account for approximately 500 rooms, which is equivalent to a 3.0% supply increase
– The majority of supply growth through FY2015 was made up of hotels which opened at the back end of FY2014 and were only partially included in prior year calculations
• Melbourne continues to sit at the bottom of the development cycle with low levels of growth experienced over the last two years. This trend is expected to continue over the short/medium term despite continued strengthening of occupancy levels. Market performance is encouraging developers to focus on Melbourne with many projects already in the pipeline
• The geographic area for Melbourne hotels continues to expand with meaningful stock continuing to appear in fringe locations such as Southbank, Dockland and South Yarra. These areas lend themselves to funky, lifestyle brands which are well placed to capitalise on the leisure boom
Supply Forecasts
• Our supply forecast to FY2023 represents a small absolute increase over the prior forecast, with delayed timing
• Dransfield’s supply forecast is for 6,300 new rooms to enter the market over the next 9 years (31% of current stock) at an average annual growth rate of 3.1%
– This follows 8,600 rooms which were added over the long term from FY1997 to FY2014 which were fully absorbed with occupancy levels actually improving from 76% to 82.8%.
– Supply growth is concentrated through the middle of the forecast between FY2019-FY2021.
– A significant proportion of the expected supply is made up of Market Response which will only eventuate with appropriate market conditions
• All of the expected additional supply is likely to be absorbed
• Supply growth in the medium term to FY2018 is expected to average a low 2.0% pa (1,200 rooms), which is a slight decrease on the 1,942 rooms expected in the prior forecast as project timing has delayed or has not proceeded. This delay is expected to catchup through FY2020 and FY2021
• There is a diverse range of supply in the pipeline led by several large luxury 5 star developments. Mid and Upscale properties, as well as serviced apartments are also well represented as the total Melbourne hotel market continues to show improvement across all tiers. Older stock will need to explore refurbishment options to stay competitive
Supply Cycle Comparison
• Long term supply forecasts have received a minor increase of 800 rooms representing a small uplift of 0.3% p.a and largely inline with demand growth increase expectations
0%
1%
2%
3%
4%
5%
6%
7%
8%
FY16 FY17 FY18 FY19 FY20 FY21 FY22 FY23 FY24
% G
row
th
HF 2016 - % Annual Growth HF2015 - % Annual Growth
3.1%
0.0%
1.0%
2.0%
3.0%
4.0%
5.0%
6.0%
0
500
1000
1500
2000
2500
3000
FY
10
FY
11
FY
12
FY
13
FY
14
FY
15
FY
16
FY
17
FY
18
FY
19
FY
20
FY
21
FY
22
FY
23
FY
24
# o
f ro
om
s
Market Response (1st Axis) Proposals (1st Axis)
Construction (1st Axis) Completed (1st Axis)
% Avg Annual Growth Act (FY10-15) % Avg Annual Growth Fcast (FY16-24)
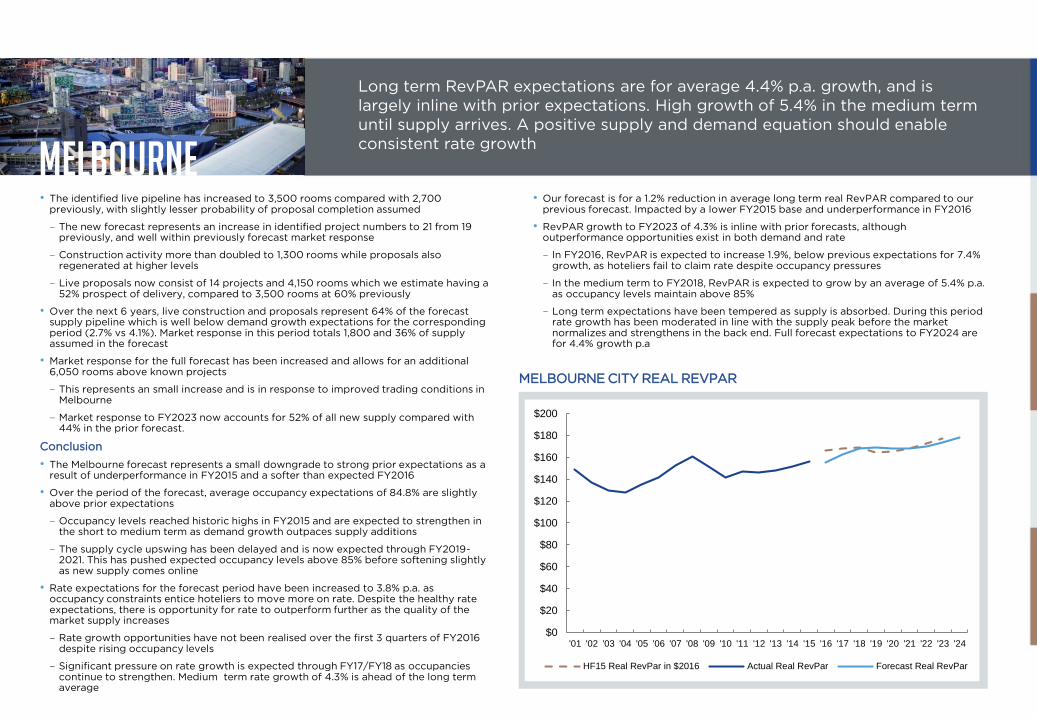
PP
Melbourne
www.dransfield.com.au48
Long term RevPAR expectations are for average 4.4% p.a. growth, and is
largely inline with prior expectations. High growth of 5.4% in the medium term
until supply arrives. A positive supply and demand equation should enable
consistent rate growth
• Our forecast is for a 1.2% reduction in average long term real RevPAR compared to our previous forecast. Impacted by a lower FY2015 base and underperformance in FY2016
• RevPAR growth to FY2023 of 4.3% is inline with prior forecasts, although outperformance opportunities exist in both demand and rate
– In FY2016, RevPAR is expected to increase 1.9%, below previous expectations for 7.4% growth, as hoteliers fail to claim rate despite occupancy pressures
– In the medium term to FY2018, RevPAR is expected to grow by an average of 5.4% p.a. as occupancy levels maintain above 85%
– Long term expectations have been tempered as supply is absorbed. During this period rate growth has been moderated in line with the supply peak before the market normalizes and strengthens in the back end. Full forecast expectations to FY2024 are for 4.4% growth p.a
We have tempered the
rate forecast for the back
end of the forecast as
supply slightly eases
occupancy pressure.
There remains
opportunity for
outperformance at the
back end if demand takes
up the additional supply
quicker than expected
• The identified live pipeline has increased to 3,500 rooms compared with 2,700 previously, with slightly lesser probability of proposal completion assumed
– The new forecast represents an increase in identified project numbers to 21 from 19 previously, and well within previously forecast market response
– Construction activity more than doubled to 1,300 rooms while proposals also regenerated at higher levels
– Live proposals now consist of 14 projects and 4,150 rooms which we estimate having a 52% prospect of delivery, compared to 3,500 rooms at 60% previously
• Over the next 6 years, live construction and proposals represent 64% of the forecast supply pipeline which is well below demand growth expectations for the corresponding period (2.7% vs 4.1%). Market response in this period totals 1,800 and 36% of supply assumed in the forecast
• Market response for the full forecast has been increased and allows for an additional 6,050 rooms above known projects
– This represents an small increase and is in response to improved trading conditions in Melbourne
– Market response to FY2023 now accounts for 52% of all new supply compared with 44% in the prior forecast.
Conclusion
• The Melbourne forecast represents a small downgrade to strong prior expectations as a result of underperformance in FY2015 and a softer than expected FY2016
• Over the period of the forecast, average occupancy expectations of 84.8% are slightly above prior expectations
– Occupancy levels reached historic highs in FY2015 and are expected to strengthen in the short to medium term as demand growth outpaces supply additions
– The supply cycle upswing has been delayed and is now expected through FY2019-2021. This has pushed expected occupancy levels above 85% before softening slightly as new supply comes online
• Rate expectations for the forecast period have been increased to 3.8% p.a. as occupancy constraints entice hoteliers to move more on rate. Despite the healthy rate expectations, there is opportunity for rate to outperform further as the quality of the market supply increases
– Rate growth opportunities have not been realised over the first 3 quarters of FY2016 despite rising occupancy levels
– Significant pressure on rate growth is expected through FY17/FY18 as occupancies continue to strengthen. Medium term rate growth of 4.3% is ahead of the long term average
MELBOURNE CITY REAL REVPAR
$0
$20
$40
$60
$80
$100
$120
$140
$160
$180
$200
'01 '02 '03 '04 '05 '06 '07 '08 '09 '10 '11 '12 '13 '14 '15 '16 '17 '18 '19 '20 '21 '22 '23 '24
HF15 Real RevPar in $2016 Actual Real RevPar Forecast Real RevPar
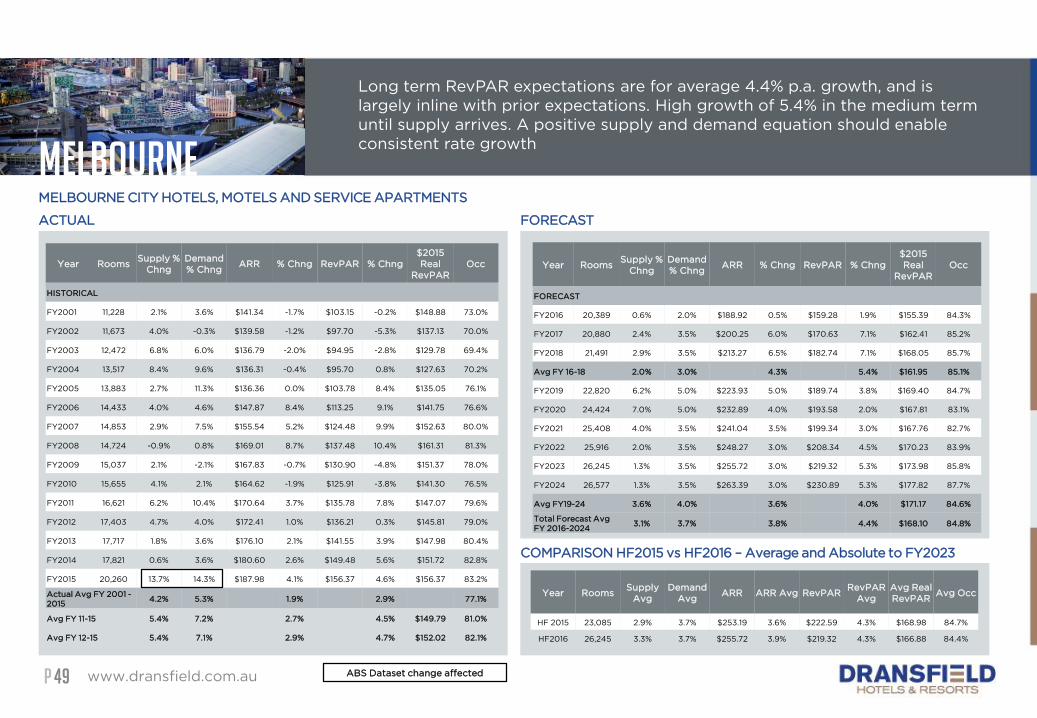
PP
COMPARISON HF2015 vs HF2016 – Average and Absolute to FY2023
Melbourne
www.dransfield.com.au49
MELBOURNE CITY HOTELS, MOTELS AND SERVICE APARTMENTS
ACTUAL FORECAST
Year RoomsSupply %
Chng
Demand
% ChngARR % Chng RevPAR % Chng
$2015
Real
RevPAR
Occ
HISTORICAL
FY2001 11,228 2.1% 3.6% $141.34 -1.7% $103.15 -0.2% $148.88 73.0%
FY2002 11,673 4.0% -0.3% $139.58 -1.2% $97.70 -5.3% $137.13 70.0%
FY2003 12,472 6.8% 6.0% $136.79 -2.0% $94.95 -2.8% $129.78 69.4%
FY2004 13,517 8.4% 9.6% $136.31 -0.4% $95.70 0.8% $127.63 70.2%
FY2005 13,883 2.7% 11.3% $136.36 0.0% $103.78 8.4% $135.05 76.1%
FY2006 14,433 4.0% 4.6% $147.87 8.4% $113.25 9.1% $141.75 76.6%
FY2007 14,853 2.9% 7.5% $155.54 5.2% $124.48 9.9% $152.63 80.0%
FY2008 14,724 -0.9% 0.8% $169.01 8.7% $137.48 10.4% $161.31 81.3%
FY2009 15,037 2.1% -2.1% $167.83 -0.7% $130.90 -4.8% $151.37 78.0%
FY2010 15,655 4.1% 2.1% $164.62 -1.9% $125.91 -3.8% $141.30 76.5%
FY2011 16,621 6.2% 10.4% $170.64 3.7% $135.78 7.8% $147.07 79.6%
FY2012 17,403 4.7% 4.0% $172.41 1.0% $136.21 0.3% $145.81 79.0%
FY2013 17,717 1.8% 3.6% $176.10 2.1% $141.55 3.9% $147.98 80.4%
FY2014 17,821 0.6% 3.6% $180.60 2.6% $149.48 5.6% $151.72 82.8%
FY2015 20,260 13.7% 14.3% $187.98 4.1% $156.37 4.6% $156.37 83.2%
Actual Avg FY 2001 -
20154.2% 5.3% 1.9% 2.9% 77.1%
Avg FY 11-15 5.4% 7.2% 2.7% 4.5% $149.79 81.0%
Avg FY 12-15 5.4% 7.1% 2.9% 4.7% $152.02 82.1%
Year RoomsSupply %
Chng
Demand
% ChngARR % Chng RevPAR % Chng
$2015
Real
RevPAR
Occ
FORECAST
FY2016 20,389 0.6% 2.0% $188.92 0.5% $159.28 1.9% $155.39 84.3%
FY2017 20,880 2.4% 3.5% $200.25 6.0% $170.63 7.1% $162.41 85.2%
FY2018 21,491 2.9% 3.5% $213.27 6.5% $182.74 7.1% $168.05 85.7%
Avg FY 16-18 2.0% 3.0% 4.3% 5.4% $161.95 85.1%
FY2019 22,820 6.2% 5.0% $223.93 5.0% $189.74 3.8% $169.40 84.7%
FY2020 24,424 7.0% 5.0% $232.89 4.0% $193.58 2.0% $167.81 83.1%
FY2021 25,408 4.0% 3.5% $241.04 3.5% $199.34 3.0% $167.76 82.7%
FY2022 25,916 2.0% 3.5% $248.27 3.0% $208.34 4.5% $170.23 83.9%
FY2023 26,245 1.3% 3.5% $255.72 3.0% $219.32 5.3% $173.98 85.8%
FY2024 26,577 1.3% 3.5% $263.39 3.0% $230.89 5.3% $177.82 87.7%
Avg FY19-24 3.6% 4.0% 3.6% 4.0% $171.17 84.6%
Total Forecast Avg
FY 2016-20243.1% 3.7% 3.8% 4.4% $168.10 84.8%
Long term RevPAR expectations are for average 4.4% p.a. growth, and is
largely inline with prior expectations. High growth of 5.4% in the medium term
until supply arrives. A positive supply and demand equation should enable
consistent rate growth
Year RoomsSupply
Avg
Demand
Avg ARR ARR Avg RevPAR
RevPAR
Avg
Avg Real
RevPARAvg Occ
HF 2015 23,085 2.9% 3.7% $253.19 3.6% $222.59 4.3% $168.98 84.7%
HF2016 26,245 3.3% 3.7% $255.72 3.9% $219.32 4.3% $166.88 84.4%
ABS Dataset change affected
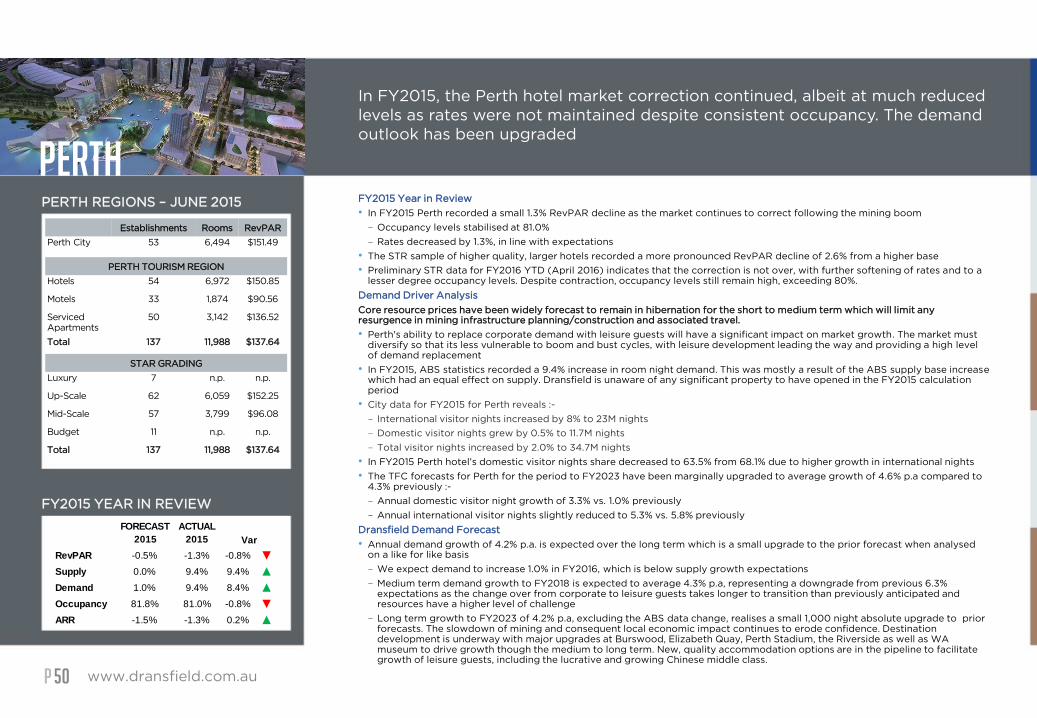
PP
Perth
www.dransfield.com.au50
In FY2015, the Perth hotel market correction continued, albeit at much reduced
levels as rates were not maintained despite consistent occupancy. The demand
outlook has been upgraded
PERTH REGIONS – JUNE 2015
FY2015 YEAR IN REVIEW
Establishments Rooms RevPAR
Perth City 53 6,494 $151.49
PERTH TOURISM REGION
Hotels 54 6,972 $150.85
Motels 33 1,874 $90.56
Serviced
Apartments
50 3,142 $136.52
Total 137 11,988 $137.64
STAR GRADING
Luxury 7 n.p. n.p.
Up-Scale 62 6,059 $152.25
Mid-Scale 57 3,799 $96.08
Budget 11 n.p. n.p.
Total 137 11,988 $137.64
FY2015 Year in Review
• In FY2015 Perth recorded a small 1.3% RevPAR decline as the market continues to correct following the mining boom
– Occupancy levels stabilised at 81.0%
– Rates decreased by 1.3%, in line with expectations
• The STR sample of higher quality, larger hotels recorded a more pronounced RevPAR decline of 2.6% from a higher base
• Preliminary STR data for FY2016 YTD (April 2016) indicates that the correction is not over, with further softening of rates and to a lesser degree occupancy levels. Despite contraction, occupancy levels still remain high, exceeding 80%.
Demand Driver Analysis
Core resource prices have been widely forecast to remain in hibernation for the short to medium term which will limit any resurgence in mining infrastructure planning/construction and associated travel.
• Perth's ability to replace corporate demand with leisure guests will have a significant impact on market growth. The market must diversify so that its less vulnerable to boom and bust cycles, with leisure development leading the way and providing a high level of demand replacement
• In FY2015, ABS statistics recorded a 9.4% increase in room night demand. This was mostly a result of the ABS supply base increase which had an equal effect on supply. Dransfield is unaware of any significant property to have opened in the FY2015 calculation period
• City data for FY2015 for Perth reveals :-
– International visitor nights increased by 8% to 23M nights
– Domestic visitor nights grew by 0.5% to 11.7M nights
– Total visitor nights increased by 2.0% to 34.7M nights
• In FY2015 Perth hotel’s domestic visitor nights share decreased to 63.5% from 68.1% due to higher growth in international nights
• The TFC forecasts for Perth for the period to FY2023 have been marginally upgraded to average growth of 4.6% p.a compared to 4.3% previously :-
– Annual domestic visitor night growth of 3.3% vs. 1.0% previously
– Annual international visitor nights slightly reduced to 5.3% vs. 5.8% previously
Dransfield Demand Forecast
• Annual demand growth of 4.2% p.a. is expected over the long term which is a small upgrade to the prior forecast when analysedon a like for like basis
– We expect demand to increase 1.0% in FY2016, which is below supply growth expectations
– Medium term demand growth to FY2018 is expected to average 4.3% p.a, representing a downgrade from previous 6.3% expectations as the change over from corporate to leisure guests takes longer to transition than previously anticipated and resources have a higher level of challenge
– Long term growth to FY2023 of 4.2% p.a, excluding the ABS data change, realises a small 1,000 night absolute upgrade to prior forecasts. The slowdown of mining and consequent local economic impact continues to erode confidence. Destination development is underway with major upgrades at Burswood, Elizabeth Quay, Perth Stadium, the Riverside as well as WA museum to drive growth though the medium to long term. New, quality accommodation options are in the pipeline to facilitate growth of leisure guests, including the lucrative and growing Chinese middle class.
FORECAST
2015
ACTUAL
2015
RevPAR -0.5% -1.3% -0.8% ▼
Supply 0.0% 9.4% 9.4% ▲
Demand 1.0% 9.4% 8.4% ▲
Occupancy 81.8% 81.0% -0.8% ▼
ARR -1.5% -1.3% 0.2% ▲
Var
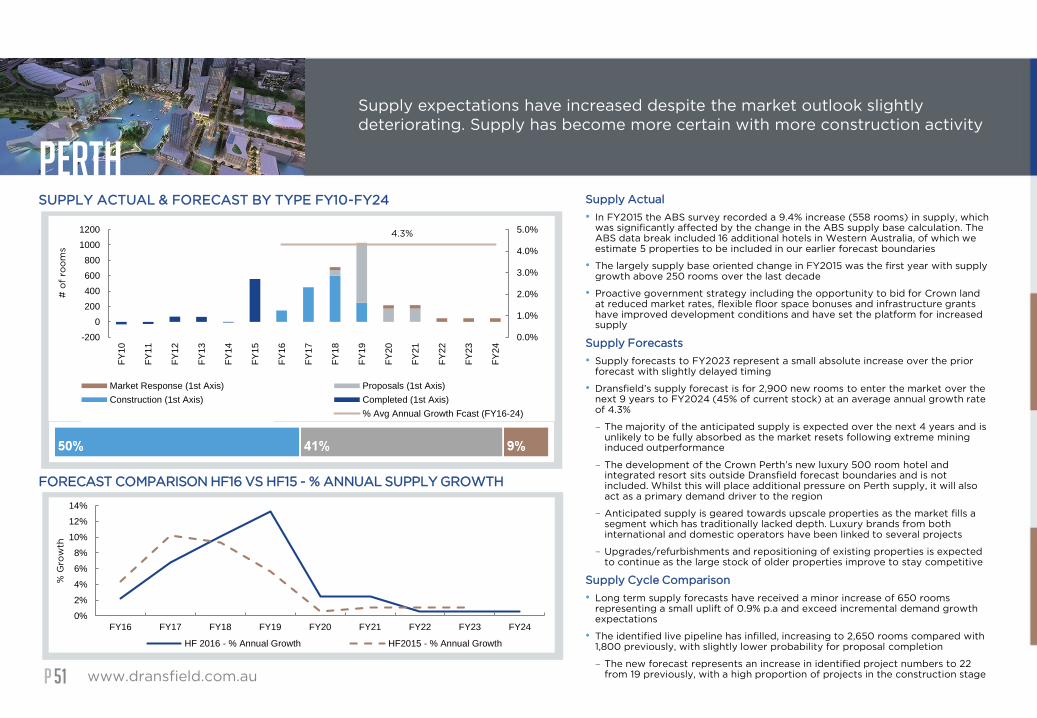
PP
Perth
www.dransfield.com.au51
Supply expectations have increased despite the market outlook slightly
deteriorating. Supply has become more certain with more construction activity
SUPPLY ACTUAL & FORECAST BY TYPE FY10-FY24
FORECAST COMPARISON HF16 VS HF15 - % ANNUAL SUPPLY GROWTH
Supply Actual
• In FY2015 the ABS survey recorded a 9.4% increase (558 rooms) in supply, which was significantly affected by the change in the ABS supply base calculation. The ABS data break included 16 additional hotels in Western Australia, of which we estimate 5 properties to be included in our earlier forecast boundaries
• The largely supply base oriented change in FY2015 was the first year with supply growth above 250 rooms over the last decade
• Proactive government strategy including the opportunity to bid for Crown land at reduced market rates, flexible floor space bonuses and infrastructure grants have improved development conditions and have set the platform for increased supply
Supply Forecasts
• Supply forecasts to FY2023 represent a small absolute increase over the prior forecast with slightly delayed timing
• Dransfield’s supply forecast is for 2,900 new rooms to enter the market over the next 9 years to FY2024 (45% of current stock) at an average annual growth rate of 4.3%
– The majority of the anticipated supply is expected over the next 4 years and is unlikely to be fully absorbed as the market resets following extreme mining induced outperformance
– The development of the Crown Perth’s new luxury 500 room hotel and integrated resort sits outside Dransfield forecast boundaries and is not included. Whilst this will place additional pressure on Perth supply, it will also act as a primary demand driver to the region
– Anticipated supply is geared towards upscale properties as the market fills a segment which has traditionally lacked depth. Luxury brands from both international and domestic operators have been linked to several projects
– Upgrades/refurbishments and repositioning of existing properties is expected to continue as the large stock of older properties improve to stay competitive
Supply Cycle Comparison
• Long term supply forecasts have received a minor increase of 650 rooms representing a small uplift of 0.9% p.a and exceed incremental demand growth expectations
• The identified live pipeline has infilled, increasing to 2,650 rooms compared with 1,800 previously, with slightly lower probability for proposal completion
– The new forecast represents an increase in identified project numbers to 22 from 19 previously, with a high proportion of projects in the construction stage
0%
2%
4%
6%
8%
10%
12%
14%
FY16 FY17 FY18 FY19 FY20 FY21 FY22 FY23 FY24
% G
row
th
HF 2016 - % Annual Growth HF2015 - % Annual Growth
4.3%
0.0%
1.0%
2.0%
3.0%
4.0%
5.0%
-200
0
200
400
600
800
1000
1200
FY
10
FY
11
FY
12
FY
13
FY
14
FY
15
FY
16
FY
17
FY
18
FY
19
FY
20
FY
21
FY
22
FY
23
FY
24
# o
f ro
om
s
Market Response (1st Axis) Proposals (1st Axis)
Construction (1st Axis) Completed (1st Axis)
% Avg Annual Growth Act (FY10-15) % Avg Annual Growth Fcast (FY16-24)
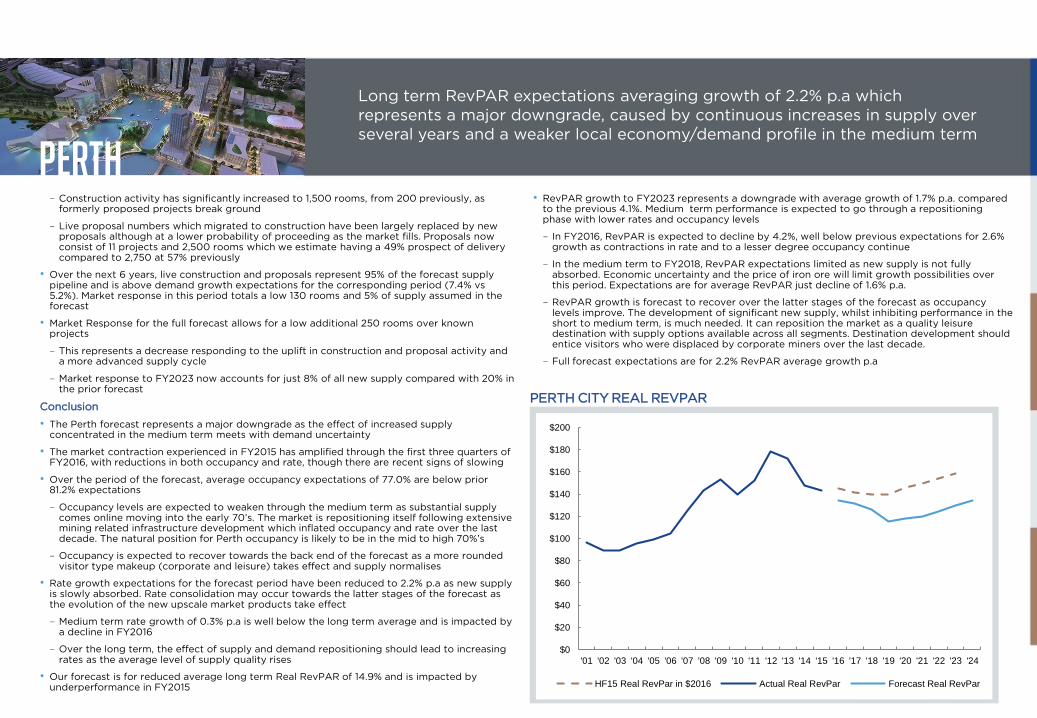
PP
Perth
www.dransfield.com.au52
Long term RevPAR expectations averaging growth of 2.2% p.a which
represents a major downgrade, caused by continuous increases in supply over
several years and a weaker local economy/demand profile in the medium term
PERTH CITY REAL REVPAR
• RevPAR growth to FY2023 represents a downgrade with average growth of 1.7% p.a. compared to the previous 4.1%. Medium term performance is expected to go through a repositioning phase with lower rates and occupancy levels
– In FY2016, RevPAR is expected to decline by 4.2%, well below previous expectations for 2.6% growth as contractions in rate and to a lesser degree occupancy continue
– In the medium term to FY2018, RevPAR expectations limited as new supply is not fully absorbed. Economic uncertainty and the price of iron ore will limit growth possibilities over this period. Expectations are for average RevPAR just decline of 1.6% p.a.
– RevPAR growth is forecast to recover over the latter stages of the forecast as occupancy levels improve. The development of significant new supply, whilst inhibiting performance in the short to medium term, is much needed. It can reposition the market as a quality leisure destination with supply options available across all segments. Destination development should entice visitors who were displaced by corporate miners over the last decade.
– Full forecast expectations are for 2.2% RevPAR average growth p.a
– Construction activity has significantly increased to 1,500 rooms, from 200 previously, as formerly proposed projects break ground
– Live proposal numbers which migrated to construction have been largely replaced by new proposals although at a lower probability of proceeding as the market fills. Proposals now consist of 11 projects and 2,500 rooms which we estimate having a 49% prospect of delivery compared to 2,750 at 57% previously
• Over the next 6 years, live construction and proposals represent 95% of the forecast supply pipeline and is above demand growth expectations for the corresponding period (7.4% vs 5.2%). Market response in this period totals a low 130 rooms and 5% of supply assumed in the forecast
• Market Response for the full forecast allows for a low additional 250 rooms over known projects
– This represents a decrease responding to the uplift in construction and proposal activity and a more advanced supply cycle
– Market response to FY2023 now accounts for just 8% of all new supply compared with 20% in the prior forecast
Conclusion
• The Perth forecast represents a major downgrade as the effect of increased supply concentrated in the medium term meets with demand uncertainty
• The market contraction experienced in FY2015 has amplified through the first three quarters of FY2016, with reductions in both occupancy and rate, though there are recent signs of slowing
• Over the period of the forecast, average occupancy expectations of 77.0% are below prior 81.2% expectations
– Occupancy levels are expected to weaken through the medium term as substantial supply comes online moving into the early 70’s. The market is repositioning itself following extensive mining related infrastructure development which inflated occupancy and rate over the last decade. The natural position for Perth occupancy is likely to be in the mid to high 70%’s
– Occupancy is expected to recover towards the back end of the forecast as a more rounded visitor type makeup (corporate and leisure) takes effect and supply normalises
• Rate growth expectations for the forecast period have been reduced to 2.2% p.a as new supply is slowly absorbed. Rate consolidation may occur towards the latter stages of the forecast as the evolution of the new upscale market products take effect
– Medium term rate growth of 0.3% p.a is well below the long term average and is impacted by a decline in FY2016
– Over the long term, the effect of supply and demand repositioning should lead to increasing rates as the average level of supply quality rises
• Our forecast is for reduced average long term Real RevPAR of 14.9% and is impacted by underperformance in FY2015
$0
$20
$40
$60
$80
$100
$120
$140
$160
$180
$200
'01 '02 '03 '04 '05 '06 '07 '08 '09 '10 '11 '12 '13 '14 '15 '16 '17 '18 '19 '20 '21 '22 '23 '24
HF15 Real RevPar in $2016 Actual Real RevPar Forecast Real RevPar
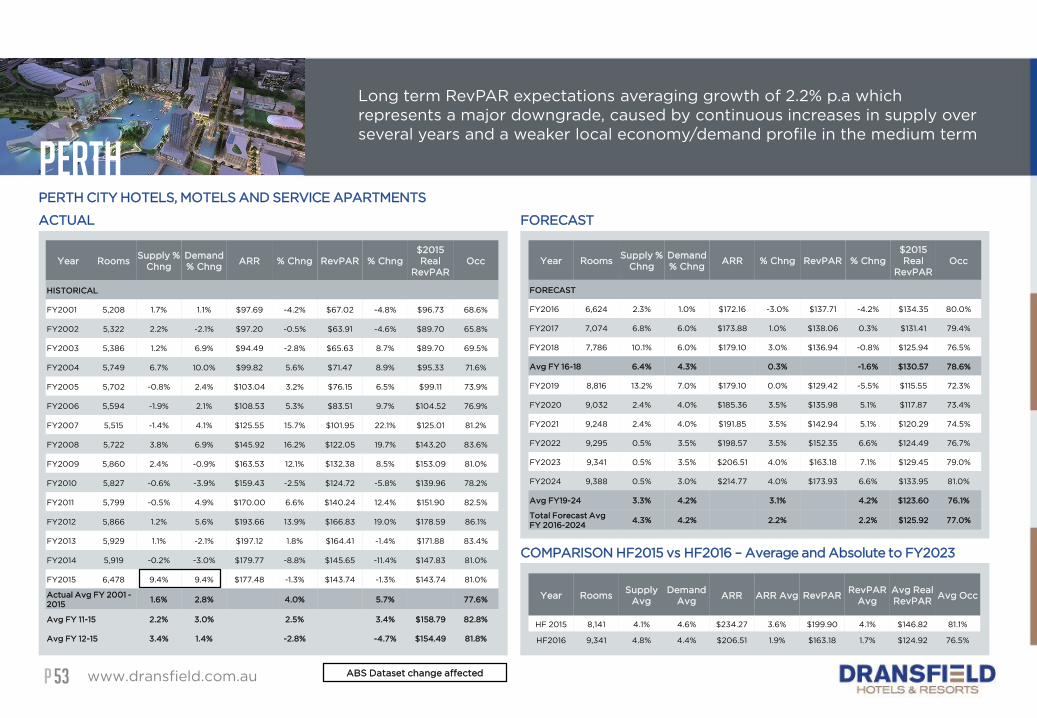
PP
COMPARISON HF2015 vs HF2016 – Average and Absolute to FY2023
Perth
www.dransfield.com.au53
Long term RevPAR expectations averaging growth of 2.2% p.a which
represents a major downgrade, caused by continuous increases in supply over
several years and a weaker local economy/demand profile in the medium term
PERTH CITY HOTELS, MOTELS AND SERVICE APARTMENTS
ACTUAL FORECAST
Year RoomsSupply %
Chng
Demand
% ChngARR % Chng RevPAR % Chng
$2015
Real
RevPAR
Occ
HISTORICAL
FY2001 5,208 1.7% 1.1% $97.69 -4.2% $67.02 -4.8% $96.73 68.6%
FY2002 5,322 2.2% -2.1% $97.20 -0.5% $63.91 -4.6% $89.70 65.8%
FY2003 5,386 1.2% 6.9% $94.49 -2.8% $65.63 8.7% $89.70 69.5%
FY2004 5,749 6.7% 10.0% $99.82 5.6% $71.47 8.9% $95.33 71.6%
FY2005 5,702 -0.8% 2.4% $103.04 3.2% $76.15 6.5% $99.11 73.9%
FY2006 5,594 -1.9% 2.1% $108.53 5.3% $83.51 9.7% $104.52 76.9%
FY2007 5,515 -1.4% 4.1% $125.55 15.7% $101.95 22.1% $125.01 81.2%
FY2008 5,722 3.8% 6.9% $145.92 16.2% $122.05 19.7% $143.20 83.6%
FY2009 5,860 2.4% -0.9% $163.53 12.1% $132.38 8.5% $153.09 81.0%
FY2010 5,827 -0.6% -3.9% $159.43 -2.5% $124.72 -5.8% $139.96 78.2%
FY2011 5,799 -0.5% 4.9% $170.00 6.6% $140.24 12.4% $151.90 82.5%
FY2012 5,866 1.2% 5.6% $193.66 13.9% $166.83 19.0% $178.59 86.1%
FY2013 5,929 1.1% -2.1% $197.12 1.8% $164.41 -1.4% $171.88 83.4%
FY2014 5,919 -0.2% -3.0% $179.77 -8.8% $145.65 -11.4% $147.83 81.0%
FY2015 6,478 9.4% 9.4% $177.48 -1.3% $143.74 -1.3% $143.74 81.0%
Actual Avg FY 2001 -
20151.6% 2.8% 4.0% 5.7% 77.6%
Avg FY 11-15 2.2% 3.0% 2.5% 3.4% $158.79 82.8%
Avg FY 12-15 3.4% 1.4% -2.8% -4.7% $154.49 81.8%
Year RoomsSupply %
Chng
Demand
% ChngARR % Chng RevPAR % Chng
$2015
Real
RevPAR
Occ
FORECAST
FY2016 6,624 2.3% 1.0% $172.16 -3.0% $137.71 -4.2% $134.35 80.0%
FY2017 7,074 6.8% 6.0% $173.88 1.0% $138.06 0.3% $131.41 79.4%
FY2018 7,786 10.1% 6.0% $179.10 3.0% $136.94 -0.8% $125.94 76.5%
Avg FY 16-18 6.4% 4.3% 0.3% -1.6% $130.57 78.6%
FY2019 8,816 13.2% 7.0% $179.10 0.0% $129.42 -5.5% $115.55 72.3%
FY2020 9,032 2.4% 4.0% $185.36 3.5% $135.98 5.1% $117.87 73.4%
FY2021 9,248 2.4% 4.0% $191.85 3.5% $142.94 5.1% $120.29 74.5%
FY2022 9,295 0.5% 3.5% $198.57 3.5% $152.35 6.6% $124.49 76.7%
FY2023 9,341 0.5% 3.5% $206.51 4.0% $163.18 7.1% $129.45 79.0%
FY2024 9,388 0.5% 3.0% $214.77 4.0% $173.93 6.6% $133.95 81.0%
Avg FY19-24 3.3% 4.2% 3.1% 4.2% $123.60 76.1%
Total Forecast Avg
FY 2016-20244.3% 4.2% 2.2% 2.2% $125.92 77.0%
Year RoomsSupply
Avg
Demand
Avg ARR ARR Avg RevPAR
RevPAR
Avg
Avg Real
RevPARAvg Occ
HF 2015 8,141 4.1% 4.6% $234.27 3.6% $199.90 4.1% $146.82 81.1%
HF2016 9,341 4.8% 4.4% $206.51 1.9% $163.18 1.7% $124.92 76.5%
ABS Dataset change affected
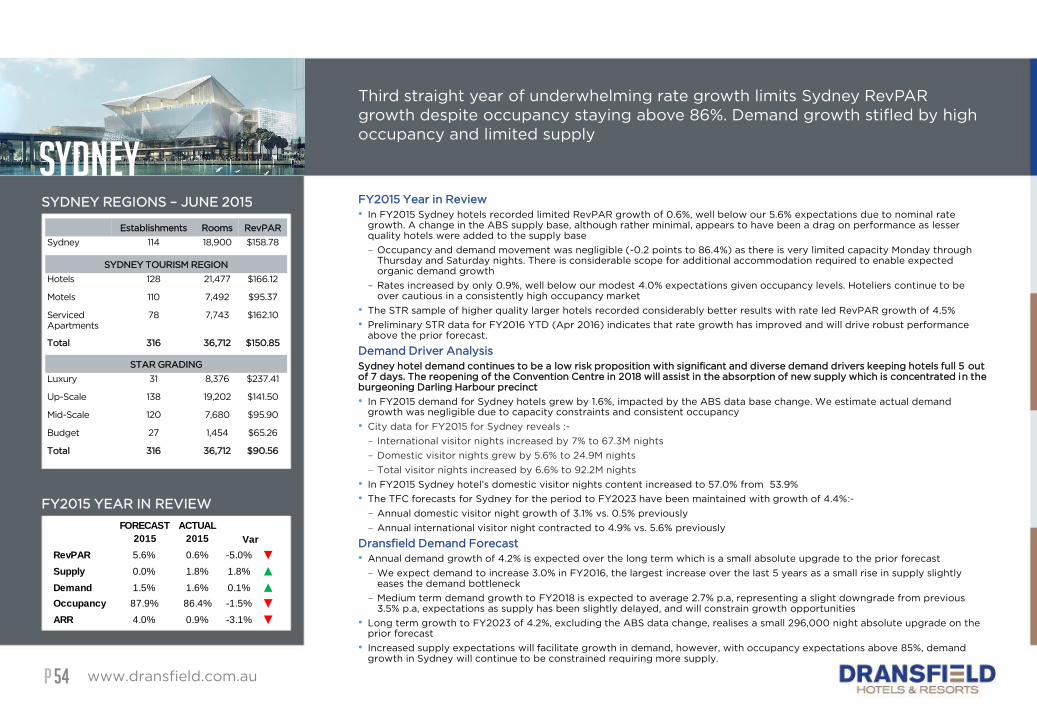
PP
Sydney
www.dransfield.com.au54
Third straight year of underwhelming rate growth limits Sydney RevPAR
growth despite occupancy staying above 86%. Demand growth stifled by high
occupancy and limited supply
FY2015 Year in Review
• In FY2015 Sydney hotels recorded limited RevPAR growth of 0.6%, well below our 5.6% expectations due to nominal rate growth. A change in the ABS supply base, although rather minimal, appears to have been a drag on performance as lesser quality hotels were added to the supply base
– Occupancy and demand movement was negligible (-0.2 points to 86.4%) as there is very limited capacity Monday through Thursday and Saturday nights. There is considerable scope for additional accommodation required to enable expected organic demand growth
– Rates increased by only 0.9%, well below our modest 4.0% expectations given occupancy levels. Hoteliers continue to be over cautious in a consistently high occupancy market
• The STR sample of higher quality larger hotels recorded considerably better results with rate led RevPAR growth of 4.5%
• Preliminary STR data for FY2016 YTD (Apr 2016) indicates that rate growth has improved and will drive robust performance above the prior forecast.
Demand Driver Analysis
Sydney hotel demand continues to be a low risk proposition with significant and diverse demand drivers keeping hotels full 5 outof 7 days. The reopening of the Convention Centre in 2018 will assist in the absorption of new supply which is concentrated in the burgeoning Darling Harbour precinct
• In FY2015 demand for Sydney hotels grew by 1.6%, impacted by the ABS data base change. We estimate actual demand growth was negligible due to capacity constraints and consistent occupancy
• City data for FY2015 for Sydney reveals :-
– International visitor nights increased by 7% to 67.3M nights
– Domestic visitor nights grew by 5.6% to 24.9M nights
– Total visitor nights increased by 6.6% to 92.2M nights
• In FY2015 Sydney hotel’s domestic visitor nights content increased to 57.0% from 53.9%
• The TFC forecasts for Sydney for the period to FY2023 have been maintained with growth of 4.4%:-
– Annual domestic visitor night growth of 3.1% vs. 0.5% previously
– Annual international visitor night contracted to 4.9% vs. 5.6% previously
Dransfield Demand Forecast
• Annual demand growth of 4.2% is expected over the long term which is a small absolute upgrade to the prior forecast
– We expect demand to increase 3.0% in FY2016, the largest increase over the last 5 years as a small rise in supply slightly eases the demand bottleneck
– Medium term demand growth to FY2018 is expected to average 2.7% p.a, representing a slight downgrade from previous 3.5% p.a, expectations as supply has been slightly delayed, and will constrain growth opportunities
• Long term growth to FY2023 of 4.2%, excluding the ABS data change, realises a small 296,000 night absolute upgrade on the prior forecast
• Increased supply expectations will facilitate growth in demand, however, with occupancy expectations above 85%, demand growth in Sydney will continue to be constrained requiring more supply.
SYDNEY REGIONS – JUNE 2015
FY2015 YEAR IN REVIEW
Establishments Rooms RevPAR
Sydney 114 18,900 $158.78
SYDNEY TOURISM REGION
Hotels 128 21,477 $166.12
Motels 110 7,492 $95.37
Serviced
Apartments
78 7,743 $162.10
Total 316 36,712 $150.85
STAR GRADING
Luxury 31 8,376 $237.41
Up-Scale 138 19,202 $141.50
Mid-Scale 120 7,680 $95.90
Budget 27 1,454 $65.26
Total 316 36,712 $90.56
FORECAST
2015
ACTUAL
2015
RevPAR 5.6% 0.6% -5.0% ▼
Supply 0.0% 1.8% 1.8% ▲
Demand 1.5% 1.6% 0.1% ▲
Occupancy 87.9% 86.4% -1.5% ▼
ARR 4.0% 0.9% -3.1% ▼
Var

PP
Sydney
www.dransfield.com.au55
Meaningful supply is expected to come online over the back half of the next 6
years. New supply will relieve growing demand pressures, although much of our
longer term supply forecast remains as anticipated Market Response rather than
more certain live projects with sponsorship
SUPPLY ACTUAL & FORECAST BY TYPE FY10-FY24
FORECAST COMPARISON HF16 VS HF15 - % ANNUAL SUPPLY GROWTH
0%
2%
4%
6%
8%
10%
FY16 FY17 FY18 FY19 FY20 FY21 FY22 FY23 FY24
% G
row
th
HF 2016 - % Annual Growth HF2015 - % Annual Growth
We have
tempered the
rate forecast for
the back end of
the forecast as
supply slightly
eases occupancy
pressure. There
remains
opportunity for
outperformance
at the back end if
demand takes up
Supply Actual
• In FY2015 the ABS survey recorded a 1.8% increase (342 rooms) in supply which appears based on the ABS supply base change. There were no large properties that came online
• FY2015 marked just the second year of recorded supply growth over the past 6 years
Supply Forecasts
• Supply forecasts to FY2023 represent a slight increase to our prior forecast with delayed timing
• Dransfield’s supply forecast is for 9,350 new rooms to enter the market over the next 9 years to FY2024 (48% of current stock) at an average annual growth rate of 4.6%
– In the short to medium term, supply will be balanced by several hotel closures including the recently closed 226 room Mercure Potts Point and the soon to close 446 room Menzies
– Supply growth in the medium term to FY2018 of 2.3% p.a is below the full forecast average and will create ongoing rate pressure
– There is wide diversity in the Sydney pipeline with all tiers of accommodation well represented including luxury
– Sydney hotel development has finally emerged from obscurity as high barriers to entry (land value, best use etc) reduce with rising hotel earnings and planning concessions. Record sales values and hungry capital markets have reset feasibility and opened the door to developers
– Development activity in the Barrangaroo/Darling Harbour precinct leads the way with several high quality hotels in construction and in proposal stages. The precinct’s development activity, bookended by two casinos, will improve the already prominent leisure destination supported by major co-located residential and commercial development
– Supply remains below market needs and capacity
Supply Cycle Comparison
• Long term supply forecasts have received a minor increase of 900 rooms representing a small uplift of 0.4% p.a. and are well below incremental demand growth expectations
• The identified live pipeline has infilled, increasing to 3,600 rooms compared with 1,800 previously, with similar 66% probability for proposal completion assumed
4.6%
-2.0%
-1.0%
0.0%
1.0%
2.0%
3.0%
4.0%
5.0%
-1000
-500
0
500
1000
1500
2000
2500
FY
10
FY
11
FY
12
FY
13
FY
14
FY
15
FY
16
FY
17
FY
18
FY
19
FY
20
FY
21
FY
22
FY
23
FY
24
# o
f ro
om
s
Market Response (1st Axis) Proposals (1st Axis)
Construction (1st Axis) Completed (1st Axis)
% Avg Annual Growth Act (FY10-15) % Avg Annual Growth Fcast (FY16-24)
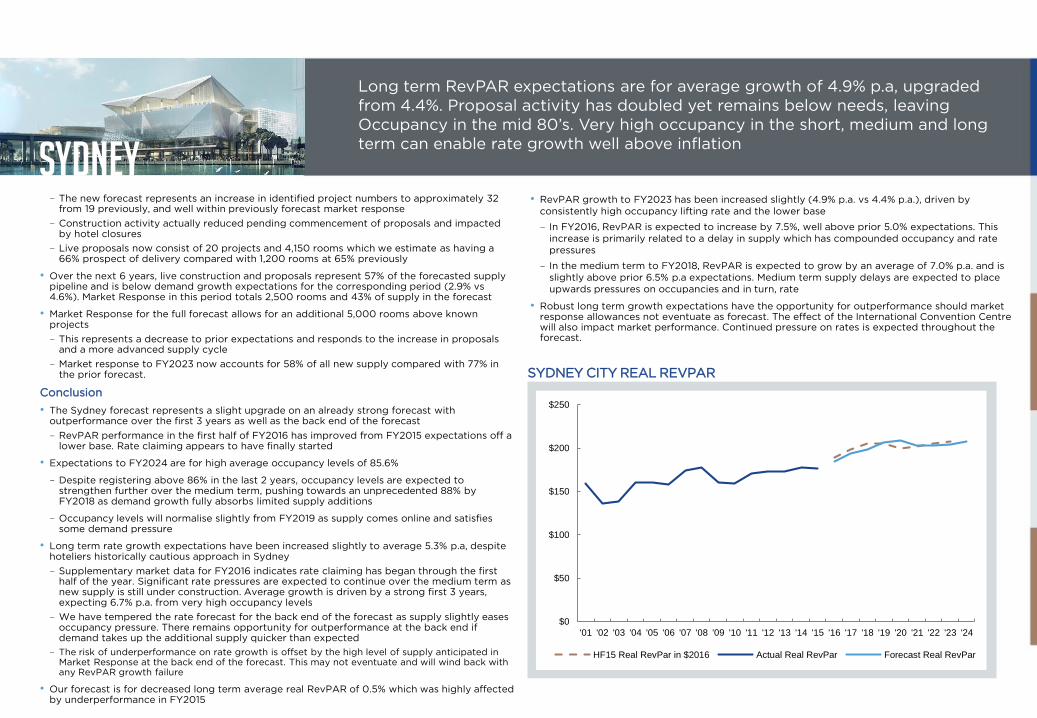
PP
Sydney
www.dransfield.com.au56
Long term RevPAR expectations are for average growth of 4.9% p.a, upgraded
from 4.4%. Proposal activity has doubled yet remains below needs, leaving
Occupancy in the mid 80’s. Very high occupancy in the short, medium and long
term can enable rate growth well above inflation
• RevPAR growth to FY2023 has been increased slightly (4.9% p.a. vs 4.4% p.a.), driven by
consistently high occupancy lifting rate and the lower base
– In FY2016, RevPAR is expected to increase by 7.5%, well above prior 5.0% expectations. This
increase is primarily related to a delay in supply which has compounded occupancy and rate
pressures
– In the medium term to FY2018, RevPAR is expected to grow by an average of 7.0% p.a. and is
slightly above prior 6.5% p.a expectations. Medium term supply delays are expected to place
upwards pressures on occupancies and in turn, rate
• Robust long term growth expectations have the opportunity for outperformance should market response allowances not eventuate as forecast. The effect of the International Convention Centre will also impact market performance. Continued pressure on rates is expected throughout the forecast.
We have tempered the rate forecast for
the back end of the forecast as supply
slightly eases occupancy pressure. There
remains opportunity for outperformance
at the back end if demand takes up the
additional supply quicker than expected
– The new forecast represents an increase in identified project numbers to approximately 32 from 19 previously, and well within previously forecast market response
– Construction activity actually reduced pending commencement of proposals and impacted by hotel closures
– Live proposals now consist of 20 projects and 4,150 rooms which we estimate as having a 66% prospect of delivery compared with 1,200 rooms at 65% previously
• Over the next 6 years, live construction and proposals represent 57% of the forecasted supply pipeline and is below demand growth expectations for the corresponding period (2.9% vs 4.6%). Market Response in this period totals 2,500 rooms and 43% of supply in the forecast
• Market Response for the full forecast allows for an additional 5,000 rooms above known projects
– This represents a decrease to prior expectations and responds to the increase in proposals and a more advanced supply cycle
– Market response to FY2023 now accounts for 58% of all new supply compared with 77% in the prior forecast.
Conclusion
• The Sydney forecast represents a slight upgrade on an already strong forecast with outperformance over the first 3 years as well as the back end of the forecast
– RevPAR performance in the first half of FY2016 has improved from FY2015 expectations off a lower base. Rate claiming appears to have finally started
• Expectations to FY2024 are for high average occupancy levels of 85.6%
– Despite registering above 86% in the last 2 years, occupancy levels are expected to strengthen further over the medium term, pushing towards an unprecedented 88% by FY2018 as demand growth fully absorbs limited supply additions
– Occupancy levels will normalise slightly from FY2019 as supply comes online and satisfies some demand pressure
• Long term rate growth expectations have been increased slightly to average 5.3% p.a, despite hoteliers historically cautious approach in Sydney
– Supplementary market data for FY2016 indicates rate claiming has began through the first half of the year. Significant rate pressures are expected to continue over the medium term as new supply is still under construction. Average growth is driven by a strong first 3 years, expecting 6.7% p.a. from very high occupancy levels
– We have tempered the rate forecast for the back end of the forecast as supply slightly eases occupancy pressure. There remains opportunity for outperformance at the back end if demand takes up the additional supply quicker than expected
– The risk of underperformance on rate growth is offset by the high level of supply anticipated in Market Response at the back end of the forecast. This may not eventuate and will wind back with any RevPAR growth failure
• Our forecast is for decreased long term average real RevPAR of 0.5% which was highly affected by underperformance in FY2015
We have
tempered the
rate forecast for
the back end of
the forecast as
supply slightly
eases occupancy
pressure. There
remains
opportunity for
outperformance
at the back end if
demand takes up
SYDNEY CITY REAL REVPAR
$0
$50
$100
$150
$200
$250
'01 '02 '03 '04 '05 '06 '07 '08 '09 '10 '11 '12 '13 '14 '15 '16 '17 '18 '19 '20 '21 '22 '23 '24
HF15 Real RevPar in $2016 Actual Real RevPar Forecast Real RevPar
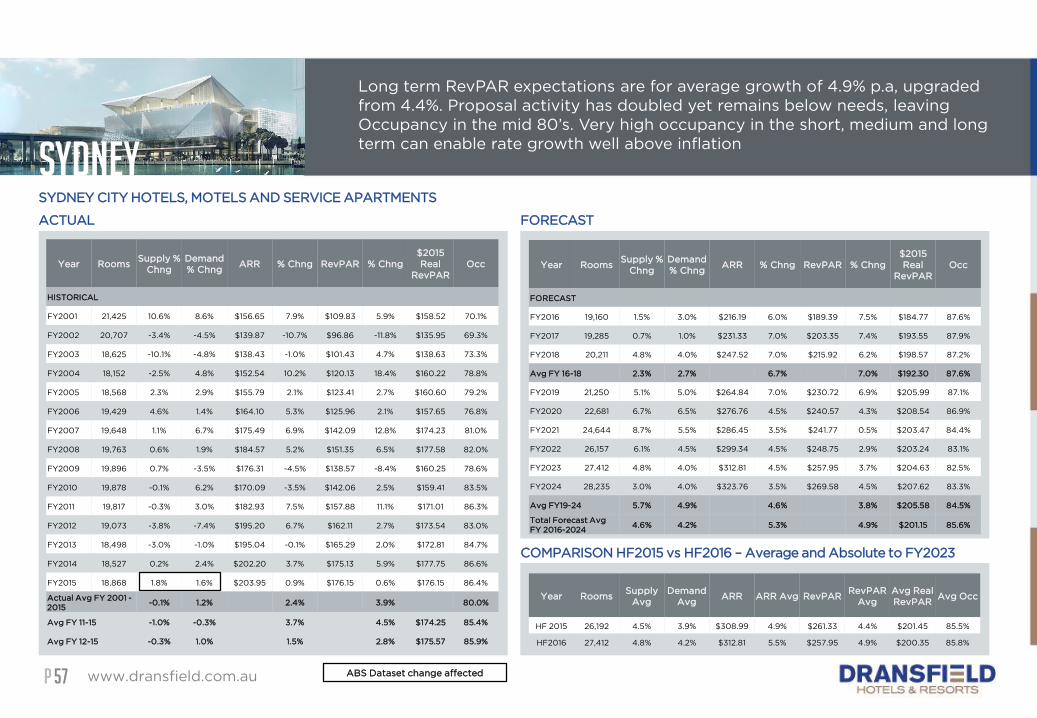
PP
COMPARISON HF2015 vs HF2016 – Average and Absolute to FY2023
Sydney
www.dransfield.com.au57
Long term RevPAR expectations are for average growth of 4.9% p.a, upgraded
from 4.4%. Proposal activity has doubled yet remains below needs, leaving
Occupancy in the mid 80’s. Very high occupancy in the short, medium and long
term can enable rate growth well above inflation
SYDNEY CITY HOTELS, MOTELS AND SERVICE APARTMENTS
ACTUAL FORECAST
Year RoomsSupply %
Chng
Demand
% ChngARR % Chng RevPAR % Chng
$2015
Real
RevPAR
Occ
HISTORICAL
FY2001 21,425 10.6% 8.6% $156.65 7.9% $109.83 5.9% $158.52 70.1%
FY2002 20,707 -3.4% -4.5% $139.87 -10.7% $96.86 -11.8% $135.95 69.3%
FY2003 18,625 -10.1% -4.8% $138.43 -1.0% $101.43 4.7% $138.63 73.3%
FY2004 18,152 -2.5% 4.8% $152.54 10.2% $120.13 18.4% $160.22 78.8%
FY2005 18,568 2.3% 2.9% $155.79 2.1% $123.41 2.7% $160.60 79.2%
FY2006 19,429 4.6% 1.4% $164.10 5.3% $125.96 2.1% $157.65 76.8%
FY2007 19,648 1.1% 6.7% $175.49 6.9% $142.09 12.8% $174.23 81.0%
FY2008 19,763 0.6% 1.9% $184.57 5.2% $151.35 6.5% $177.58 82.0%
FY2009 19,896 0.7% -3.5% $176.31 -4.5% $138.57 -8.4% $160.25 78.6%
FY2010 19,878 -0.1% 6.2% $170.09 -3.5% $142.06 2.5% $159.41 83.5%
FY2011 19,817 -0.3% 3.0% $182.93 7.5% $157.88 11.1% $171.01 86.3%
FY2012 19,073 -3.8% -7.4% $195.20 6.7% $162.11 2.7% $173.54 83.0%
FY2013 18,498 -3.0% -1.0% $195.04 -0.1% $165.29 2.0% $172.81 84.7%
FY2014 18,527 0.2% 2.4% $202.20 3.7% $175.13 5.9% $177.75 86.6%
FY2015 18,868 1.8% 1.6% $203.95 0.9% $176.15 0.6% $176.15 86.4%
Actual Avg FY 2001 -
2015-0.1% 1.2% 2.4% 3.9% 80.0%
Avg FY 11-15 -1.0% -0.3% 3.7% 4.5% $174.25 85.4%
Avg FY 12-15 -0.3% 1.0% 1.5% 2.8% $175.57 85.9%
Year RoomsSupply %
Chng
Demand
% ChngARR % Chng RevPAR % Chng
$2015
Real
RevPAR
Occ
FORECAST
FY2016 19,160 1.5% 3.0% $216.19 6.0% $189.39 7.5% $184.77 87.6%
FY2017 19,285 0.7% 1.0% $231.33 7.0% $203.35 7.4% $193.55 87.9%
FY2018 20,211 4.8% 4.0% $247.52 7.0% $215.92 6.2% $198.57 87.2%
Avg FY 16-18 2.3% 2.7% 6.7% 7.0% $192.30 87.6%
FY2019 21,250 5.1% 5.0% $264.84 7.0% $230.72 6.9% $205.99 87.1%
FY2020 22,681 6.7% 6.5% $276.76 4.5% $240.57 4.3% $208.54 86.9%
FY2021 24,644 8.7% 5.5% $286.45 3.5% $241.77 0.5% $203.47 84.4%
FY2022 26,157 6.1% 4.5% $299.34 4.5% $248.75 2.9% $203.24 83.1%
FY2023 27,412 4.8% 4.0% $312.81 4.5% $257.95 3.7% $204.63 82.5%
FY2024 28,235 3.0% 4.0% $323.76 3.5% $269.58 4.5% $207.62 83.3%
Avg FY19-24 5.7% 4.9% 4.6% 3.8% $205.58 84.5%
Total Forecast Avg
FY 2016-20244.6% 4.2% 5.3% 4.9% $201.15 85.6%
Year RoomsSupply
Avg
Demand
Avg ARR ARR Avg RevPAR
RevPAR
Avg
Avg Real
RevPARAvg Occ
HF 2015 26,192 4.5% 3.9% $308.99 4.9% $261.33 4.4% $201.45 85.5%
HF2016 27,412 4.8% 4.2% $312.81 5.5% $257.95 4.9% $200.35 85.8%
ABS Dataset change affected
PP www.dransfield.com.au58
METHODOLOGY & BACKGROUNDIn producing Hotel Futures, Dransfield
have committed to making available
to investors, long term historical
information and one view of what the
future might look like. Investors now
have available to them forecasts of
key demand drivers, published by
Tourism Research Australia (TRA),
and a number of other government
and private sources. Supply
information is provided by local and
state governments as well as private
organisations. Hotel Futures seeks to
interpret the impact of these
expectations on hotel revenues, when
combined together in a
supply/demand equation.
In presenting a market forecast it is
important for readers to accept that
individual hotels will be influenced by
the market, but will not behave in an
identical manner. The market forecast
is therefore a guide against which the
past and future performance
expectations for any particular hotel
may be reviewed.
Australian Bureau of Statistics – Adjustment in Reporting
In FY2015 a break in the ABS data series occurred, with
the inclusion of an additional 17,828 rooms across 279
STA properties in Australia which were previously
overlooked. Whilst these additional rooms are not solely
included in Hotel Futures city borders, the effect has
made supply and demand growth figures unreliable for
FY2015 as data from the September quarter 2014
onwards is not directly comparable to the past
For more information on the change visit www.abs.gov.au
Effect of changes to Australian Bureau of Statistics
Classifications
Following the ABS change in the supply base, Dransfield
identified a general downgrade in reported FY2015 data,
which appears to be brought about by the change in
methodology.
The impact varies across individual cities and is related to
the amount and quality of additional stock added to the
market base.
Dransfield identified performance below other market
reports and expectations, that suggest the newly
identified properties are typically based at the lower end
of the performance spectrum from both a rate and
occupancy level.
Where possible we have provided our supply and
demand estimates excluding the base change. These are
only an estimate and should not be relied on as being
completely accurate.
Sources of Historic Forecast Data
Where it is noted that ABS data has been used in our
analysis, this refers only to historic data. Forecasts are
solely the product of Dransfield, though the construction
of the forecast may rely on information published by
Tourism Research Australia.
Tourism Research Australia was created on 1 July 2004
and brings together the Australian Tourism Commission,
See Australia, the Bureau of Tourism Research and the
Tourism Forecasting Council. The Tourism Forecasting
Committee (TFC) was also established following the
formation of Tourism Australia (TA). The TFC remains an
independent body providing forecasts of activity across
international, domestic and outbound tourism sectors.
The resources for the TFC are provided by Tourism
Research Australia (TRA), which is a division of Tourism
Australia.
STR Global
STR Global provides global hotel data covering daily and
monthly performance data, forecasts, annual profitability,
pipeline and census information. STR collects data from
46,000 hotels globally, representing 5.3 million rooms.
The Australian and New Zealand Hotel Review provides a
sample of the whole market and coverage typically sits
within a range of 50-75% of the entire census. The data
consists of the majority of larger and branded operators
but also contains information from many smaller
operators and independents. This sample is on average of
a higher quality than the market covered in the full ABS
survey.
Typically, STR sample data outperforms ABS survey data
and provides a slightly skewed top end performance
review, based on subject properties who participate in
the survey.
PP
Other Historical Changes to Australian Bureau of Statistics and TFC Methodology
As a result of the introduction of the Goods and Services Tax (GST) on 1 July 2000, the
ABS reports data inclusive of GST. To enable meaningful comparison to the previous
years, we have adjusted the post 1 July 2000 data by reducing revenues by 1/11th,
making them net of GST.
In the June 2003 quarter, an additional 132 establishments (5,918 rooms) were added
to the Australian Bureau of Statistic’s Survey of Tourist Accommodation room stock
count. The addition of these establishments resulted in a break in the time series
between the March and June quarters 2003 and would tend to overstate supply
growth. To offset this, the base figures for quarters June 2002 to June 2003 have been
increased by a factor, provided by the ABS, to take into account the effect of the break
in the series. The factor used varies for different cities and ranges from an increase of
1.9% to 6.2%. In 2007 the ABS redrew the geographical boundaries of the Sydney City
Region and divided the City Region into four sub-regions: Inner, South, East and West.
The changes to the boundaries has not impacted the total Sydney City region, rather
the sub parts of the region have been redrawn.
In the 2012 TFC forecast, historical performance and forecasts are being reported on a
financial year basis. Previous calendar year forecast of November 2011 have been
adjusted to report on a financial year basis for comparative purposes. They are at best
an indication of what the financial year forecasts would have been if prepared on that
basis.
Effective from 1 January 2012, the ABS has replaced the Australian Standard
Geographical Classification (ASGC) with the new Australian Statistical Geography
Standard (ASGS) as the geographic framework for its survey data. For the purposes of
our Hotel Futures analysis, this changes the boundaries applicable to the Darwin and
Cairns regions.
Accordingly, comparisons with prior period data for these two regions is not exactly
like for like, however the effect of the change in coverage is relatively minimal. We
have taken the opportunity through these classification changes to include Port
Douglas in our Cairns market forecasts.
From 1 July 2013, the ABS changed the collection and release activity of the survey of
tourist accommodation small area data (STA). The collection frequency of the STA
moved from a quarterly to annual release and from a calendar to financial year basis.
Supply Expectations
In calculating supply expectations, Dransfield considers three stages of development:-
1) Under construction or recently completed
2) Proposals
3) Market Response
Our forecast recognises that not all project proposals will proceed as anticipated, and
probability estimates have been applied to sites where construction has not yet
started and may not start or could be delayed. Following consideration of mooted and
under construction supply, and likely market performance, Dransfield allows a “Market
Response” provision which seeks to estimate the volume of additional rooms that may
be delivered during the forecast period that do not relate to current known projects
Eg. the Market Response to forward supply and demand conditions. This is informed by
past market behavior, including identified trigger points in key revenue metrics.
Demand
Our demand forecasts are partly based on international and domestic visitor forecasts
published by Tourism Research Australia (TRA) through the Tourism Forecasting
Committee (TFC). They also require a level of subjective judgment. In December 2015,
TRA released revised forecasts updating those issued in July 2014 which were relied
upon in the 2015 edition of Hotel Futures. TFC forecasts are produced on a financial
year basis.
There are multiple indicators of future demand for the major cities considered in Hotel
Futures. The TFC publishes a range of related actual and forecast national statistics
including:
www.dransfield.com.au59
METHODOLOGY & BACKGROUND
PP
• International Arrivals;
• International Visitor nights;
• International Visitor nights in Hotels, Motels, Guest Houses and Serviced Apartments
(HMGSA);
• Domestic Visitor Nights
• Domestic Visitor nights in Hotels, Motels, Guest Houses and Serviced Apartments
(HMGSA).
International visitor forecasts are now undertaken on a state by state basis, similar to
what has historically been provided for the domestic forecasts. We have undertaken
correlation testing on each of the above demand indicators and found varying degrees
of correlation to actual results in different years. None of the individual indicators have
a very strong historical correlation with the room nights occupied in the cities that
Hotel Futures reports on. This is partly due to the differing proportions of international
and domestic visitors in each city, though we do take regard of the known changes in
market mix. It is also due to the differing geographic boundaries of the indicators and
the subject, for example, using the international forecast for the whole state has only
an indirect relationship with an individual city.
Changes in the level of supply in each city also alter travel patterns as room availability
improves.
The difficulty in using raw statistics/forecasts is demonstrated by considering the lack
of growth in International Arrivals in 2009 compared to the 5% increase in
International Visitor nights and 6% reduction in International Visitor Nights to Hotels.
The demand figures estimated in Hotel Futures therefore require a significant
subjective assessment.
In our analysis, the TFC visitor forecasts and customer market mix in individual states
are blended and adjusted to reflect historical differences between these key drivers,
actual results and the impact of additional supply. Supply often stimulates demand
growth and there are differing expectations for individual city growth rates compared
to the whole state. Historically, actual performance and our forecasts for a city’s
demand growth have exceeded ‘melded’ growth rates (combined weighted
International and Domestic forecasts) based on TFC data for larger geographic areas,
sometimes quite substantially.
Room Rate Methodology
Real room rate change is mostly impacted by occupancy levels. Changes upward
generally lag occupancy movements by approximately twelve months, whilst hoteliers
respond to new market circumstances and contract prices move. Regression analysis
has been used to analyse historic real rate growth and is used as a guide to forecasting
likely future growth rates based on expected occupancy levels. Room rates are
presented net of GST.
Room Yield/RevPAR Methodology
The most reliable indicator of hotel profitability is the RevPAR (revenue per available
room or yield) which indicates the revenue available from which profit is derived.
Given the change in inflation over the last decade, we have calculated a ‘real RevPAR’
curve in each market so that a more realistic comparison of future expectations and
past performance can be made. The real RevPAR is also a good guide as to when new
projects might be considered viable, and therefore likely to proceed.
Nominal growth rates depend on the starting base, (e.g. growth rates calculated from
a peak will be lower and often negative compared to growth rates calculated from a
trough). Comparing the average real RevPAR of a whole forecast to prior forecasts is
therefore the most objective and complete way to determine if it has been upgraded
or downgraded. For the purposes of comparing current forecast real RevPAR with our
previous forecasts, CPI data has been used.
.
www.dransfield.com.au60
METHODOLOGY & BACKGROUND
PP www.dransfield.com.au61
Glossary of Terms
The Average Room Rate is the average daily revenue per occupied room. Calculated as Total Room Revenue
divided by occupied room nights. This rate is calculated net of GST. Also known as Average Daily Rate (ADR).
Average Room Rate (ARR)
The ABS is Australia’s national statistical authority and provides survey based statistics of hotels, motels
and serviced apartments.
Australian Bureau of Statistics (ABS)
Dransfield’s annual Hotel Futures publicationHF
Hotels with guest facilities, licensed to operate a public bar. References made to the ‘hotel market’ generally
include motels, guest houses and serviced apartments.
Hotels
Hotels, Motels, Guest Houses and Serviced Apartments, a statistical basket of competitorsHMGSA
Prior corresponding periodP.C.P
Self contained units with full cooking facilities, daily service and provision of linen and laundry.Serviced Apartments
The Occupancy is the number of rooms occupied divided by the number of rooms available.Occupancy
The RevPAR is the revenue per available room night, calculated as occupancy multiplied by Average Room
Rate or total room revenue divided by available room nights. Also known as and previously defined in Hotel
Futures as Yield.
RevPAR
The RevPAR calculated in 2015 dollars to remove the effect of inflation. Previously defined in Hotel Futures as
Real Yield.
Real RevPAR
PP www.dransfield.com.au62
Glossary of TermsThe Room Yield is the revenue per available room night calculated as occupancy multiplied by Average Room
Rate. Also known as RevPAR.
Yield/Room Yield
STR GlobalSTR
A division of Tourism Australia. The TFC is an independent body charged with providing consensus forecasts
of activity across international, domestic and outbound tourism sectors.
Tourism Forecasting Committee
(TFC)
TABLE REFERENCE
This is the annual percentage change in the sum of the number of rooms available for each night of the year
(supply). Supply is not always the same as a calculation of the number of rooms times the number of days in
the year, as rooms are not always available for the whole year when new supply is introduced, or old supply
withdrawn part way through the year.
Supply % Change
This figure is based on the equivalent rooms available for the full year calculated by dividing supply by the
number of days in the year.
Rooms
This is the annual percentage change in the sum of the number of rooms occupied for each night of the year
(demand). Demand information is not directly supplied by the ABS and is calculated by multiplying supply by
the reported occupancy.
Demand % Change
PP www.dransfield.com.au63
Data from to STR for year on year growth rates as published in:
• 2016 STR Global, Ltd. Australia and New Zealand Hotel Review
STR
www.str.com
Actual Data to FY2015 relating to Room Night Supply, Occupancy, Takings/Rate and RevPAR actuals, and
calculated historical growth rates as published in:
• Survey of Tourist Accommodation (STA), Tourist Accommodation, Small Area Data (Cat. No. 8635).
• International Visitor Arrivals to Australia, 3401.0 Table 1: Total Movement, Visitor Arrivals – Category of
Movement.
• Resident Departures, 3401.0 Table 2: Total Movement, Resident Departures – Category of Movement (Short
Term less than 1 year)
ABS – Australian Bureau of Statistics
www.abs.gov.au
Data relating to historical and forecast demand as published through TRA and its affiliate TFC:
• State and Territory Tourism Forecasts 2015 (tables), Tourism Research Australia, Canberra.
Data relating to latest publications and forecasts
• IVS – International Visitors in Australia: Quarterly results of the International Visitor Survey
• NVS – Travel by Australians: Quarterly results from of National Visitor Survey
• TRA Special Request: NVS and IVS overnight visitors in Hotel/Resort or Motor Inn
Tourism Research Australia (TRA) and
The Tourism Forecasting Committee
(TFC) www.tourism.australia.com
Sources of Data