Embed Size (px)
Citation preview
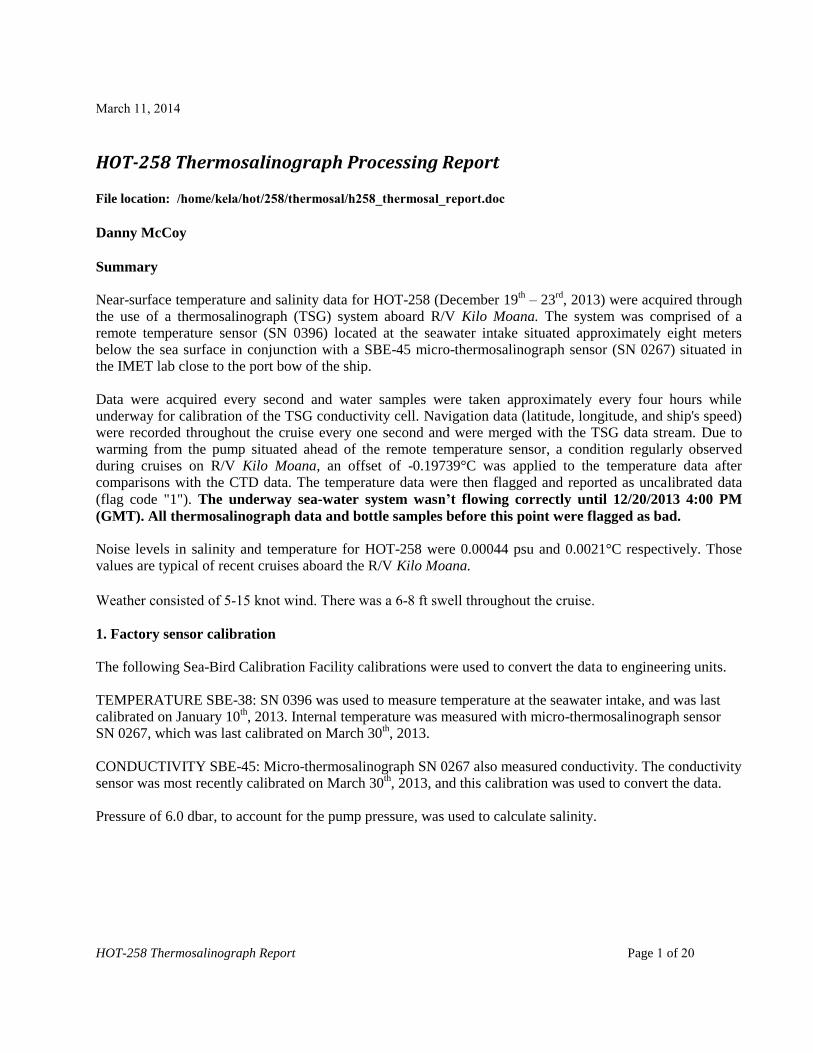
March 11, 2014
HOT-258 Thermosalinograph Report Page 1 of 20
HOT-258 Thermosalinograph Processing Report
File location: /home/kela/hot/258/thermosal/h258_thermosal_report.doc
Danny McCoy
Summary Near-surface temperature and salinity data for HOT-258 (December 19
th – 23
rd, 2013) were acquired through
the use of a thermosalinograph (TSG) system aboard R/V Kilo Moana. The system was comprised of a remote temperature sensor (SN 0396) located at the seawater intake situated approximately eight meters below the sea surface in conjunction with a SBE-45 micro-thermosalinograph sensor (SN 0267) situated in the IMET lab close to the port bow of the ship. Data were acquired every second and water samples were taken approximately every four hours while underway for calibration of the TSG conductivity cell. Navigation data (latitude, longitude, and ship's speed) were recorded throughout the cruise every one second and were merged with the TSG data stream. Due to warming from the pump situated ahead of the remote temperature sensor, a condition regularly observed during cruises on R/V Kilo Moana, an offset of -0.19739°C was applied to the temperature data after comparisons with the CTD data. The temperature data were then flagged and reported as uncalibrated data
(flag code "1"). The underway sea-water system wasn’t flowing correctly until 12/20/2013 4:00 PM
(GMT). All thermosalinograph data and bottle samples before this point were flagged as bad. Noise levels in salinity and temperature for HOT-258 were 0.00044 psu and 0.0021°C respectively. Those values are typical of recent cruises aboard the R/V Kilo Moana.
Weather consisted of 5-15 knot wind. There was a 6-8 ft swell throughout the cruise.
1. Factory sensor calibration
The following Sea-Bird Calibration Facility calibrations were used to convert the data to engineering units.
TEMPERATURE SBE-38: SN 0396 was used to measure temperature at the seawater intake, and was last calibrated on January 10
th, 2013. Internal temperature was measured with micro-thermosalinograph sensor
SN 0267, which was last calibrated on March 30th, 2013.
CONDUCTIVITY SBE-45: Micro-thermosalinograph SN 0267 also measured conductivity. The conductivity sensor was most recently calibrated on March 30
th, 2013, and this calibration was used to convert the data.
Pressure of 6.0 dbar, to account for the pump pressure, was used to calculate salinity.
March 11, 2014
HOT-258 Thermosalinograph Report Page 2 of 20
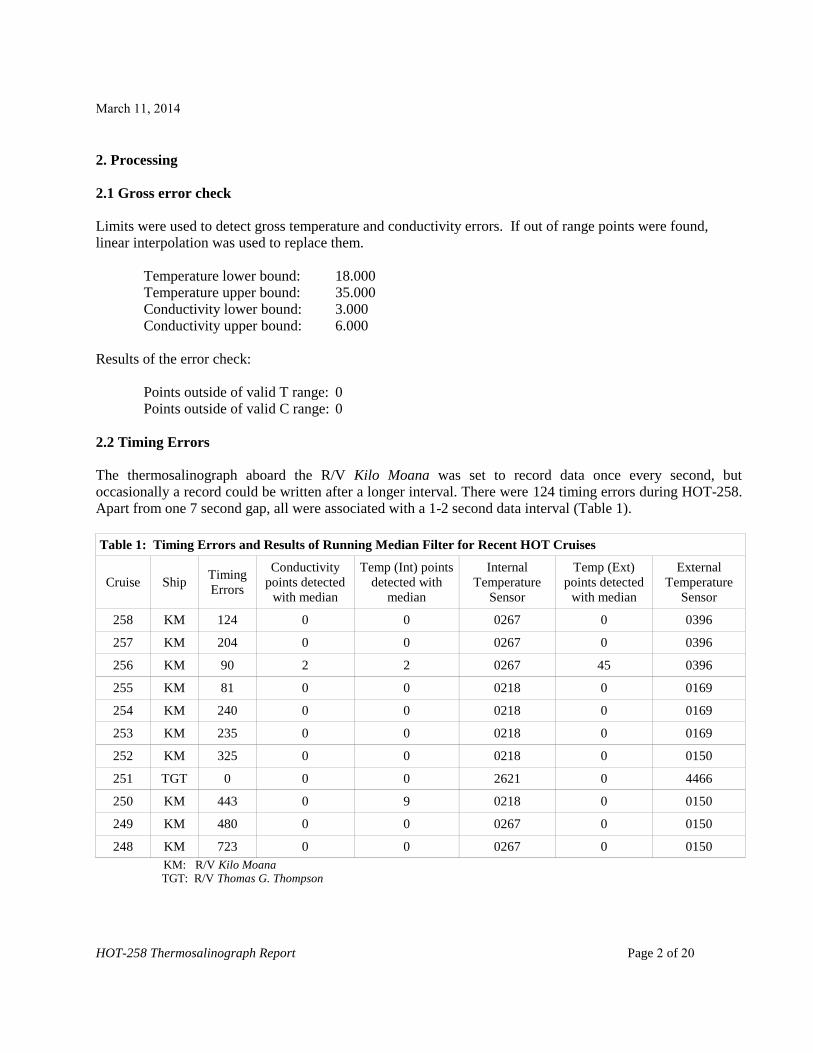
2. Processing
2.1 Gross error check Limits were used to detect gross temperature and conductivity errors. If out of range points were found, linear interpolation was used to replace them. Temperature lower bound: 18.000 Temperature upper bound: 35.000 Conductivity lower bound: 3.000 Conductivity upper bound: 6.000 Results of the error check: Points outside of valid T range: 0 Points outside of valid C range: 0
2.2 Timing Errors
The thermosalinograph aboard the R/V Kilo Moana was set to record data once every second, but occasionally a record could be written after a longer interval. There were 124 timing errors during HOT-258. Apart from one 7 second gap, all were associated with a 1-2 second data interval (Table 1).
Table 1: Timing Errors and Results of Running Median Filter for Recent HOT Cruises
Cruise Ship Timing Errors
Conductivity points detected
with median
Temp (Int) points detected with
median
Internal Temperature
Sensor
Temp (Ext) points detected
with median
External Temperature
Sensor
258 KM 124 0 0 0267 0 0396
257 KM 204 0 0 0267 0 0396
256 KM 90 2 2 0267 45 0396
255 KM 81 0 0 0218 0 0169
254 KM 240 0 0 0218 0 0169
253 KM 235 0 0 0218 0 0169
252 KM 325 0 0 0218 0 0150
251 TGT 0 0 0 2621 0 4466
250 KM 443 0 9 0218 0 0150
249 KM 480 0 0 0267 0 0150
248 KM 723 0 0 0267 0 0150
KM: R/V Kilo Moana TGT: R/V Thomas G. Thompson
March 11, 2014
HOT-258 Thermosalinograph Report Page 3 of 20
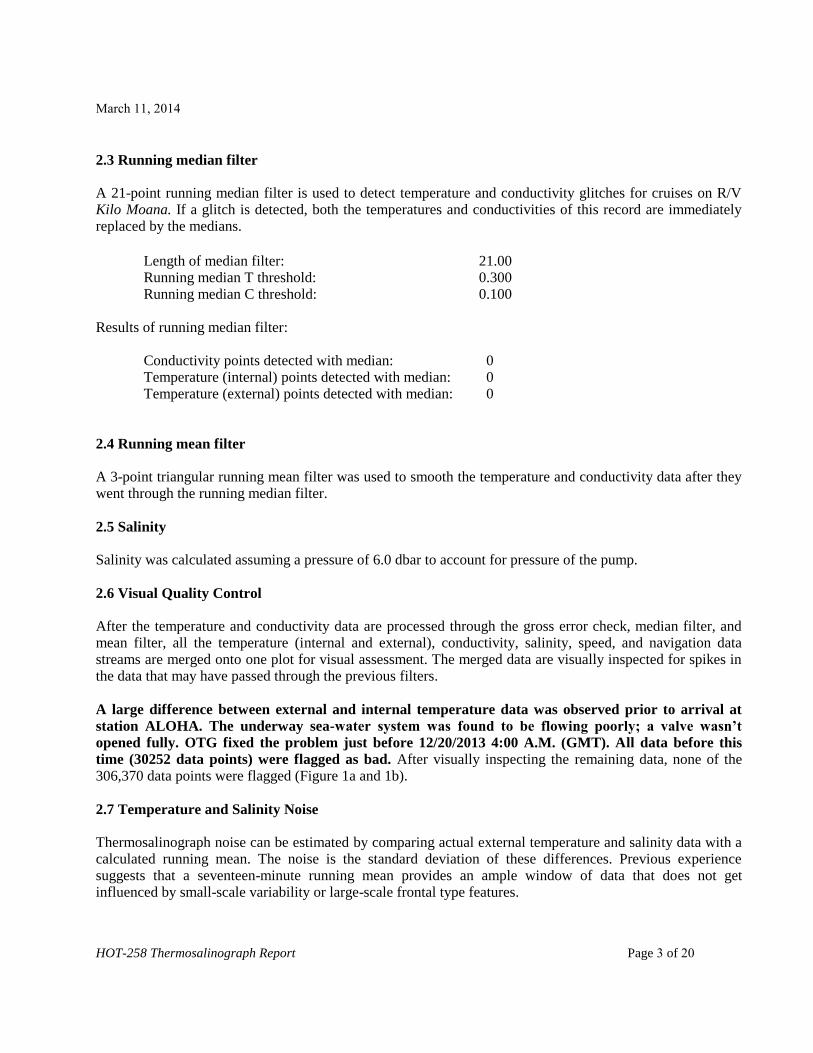
2.3 Running median filter A 21-point running median filter is used to detect temperature and conductivity glitches for cruises on R/V Kilo Moana. If a glitch is detected, both the temperatures and conductivities of this record are immediately replaced by the medians.
Length of median filter: 21.00 Running median T threshold: 0.300 Running median C threshold: 0.100 Results of running median filter: Conductivity points detected with median: 0 Temperature (internal) points detected with median: 0 Temperature (external) points detected with median: 0
2.4 Running mean filter A 3-point triangular running mean filter was used to smooth the temperature and conductivity data after they went through the running median filter.
2.5 Salinity Salinity was calculated assuming a pressure of 6.0 dbar to account for pressure of the pump.
2.6 Visual Quality Control After the temperature and conductivity data are processed through the gross error check, median filter, and mean filter, all the temperature (internal and external), conductivity, salinity, speed, and navigation data streams are merged onto one plot for visual assessment. The merged data are visually inspected for spikes in the data that may have passed through the previous filters.
A large difference between external and internal temperature data was observed prior to arrival at
station ALOHA. The underway sea-water system was found to be flowing poorly; a valve wasn’t
opened fully. OTG fixed the problem just before 12/20/2013 4:00 A.M. (GMT). All data before this
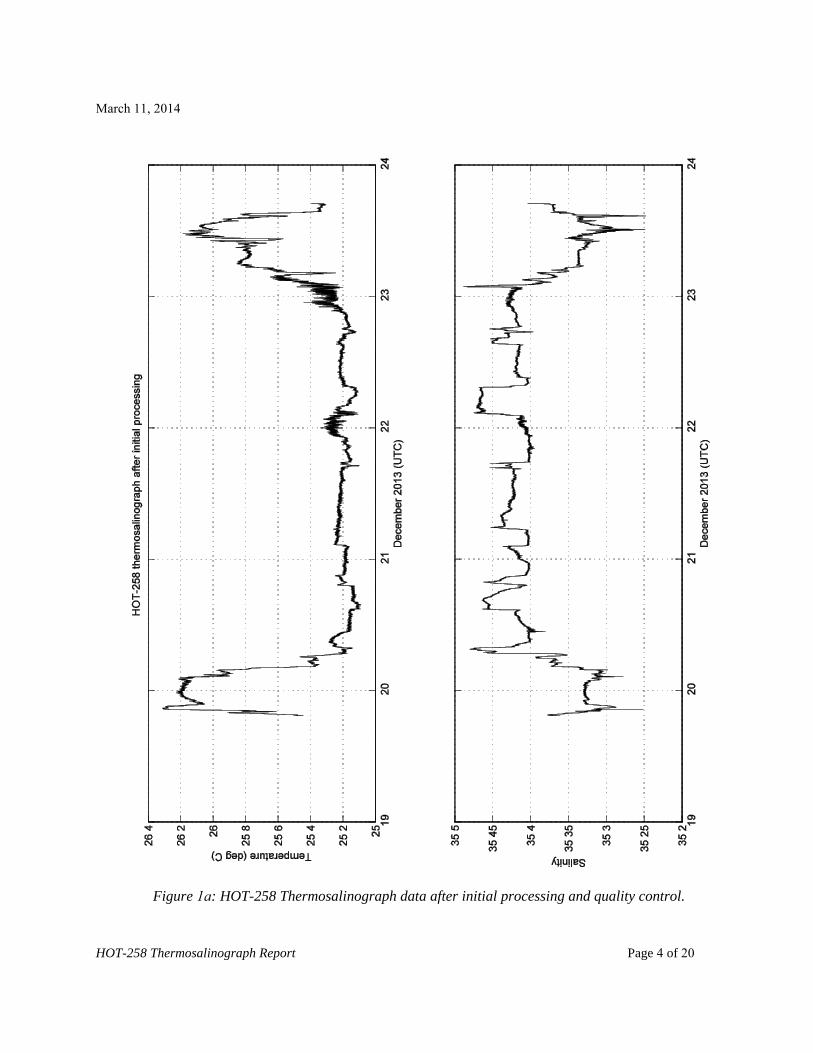
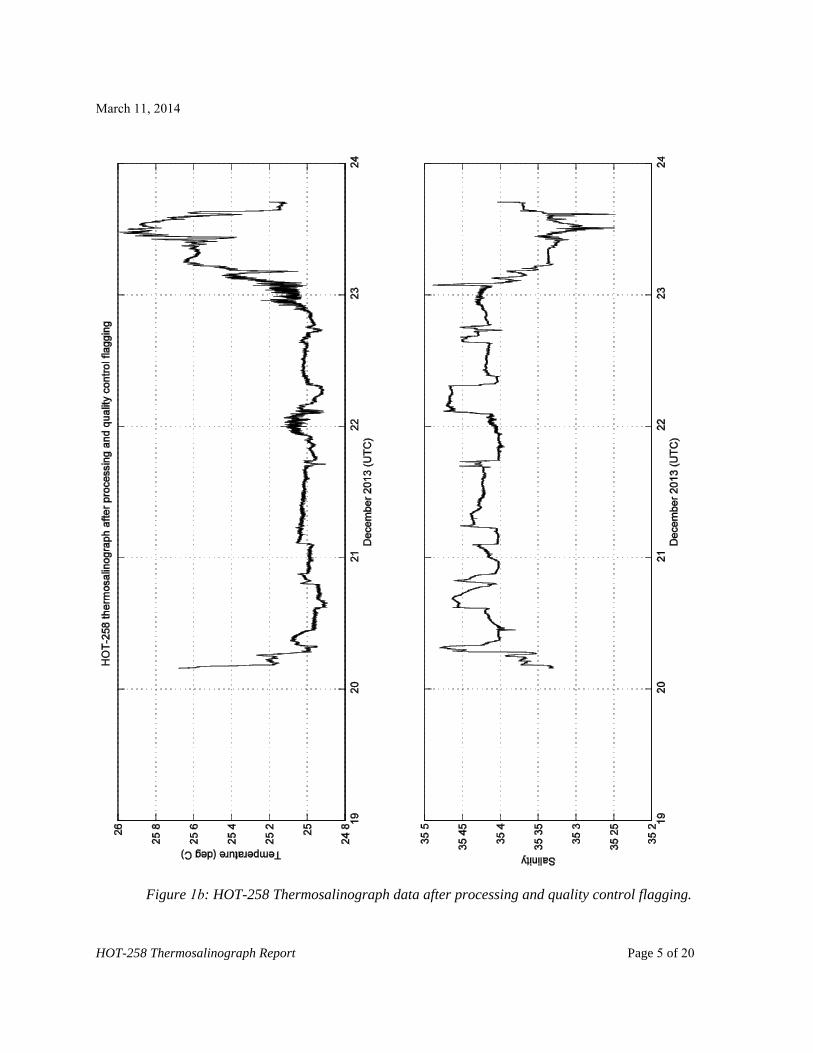
time (30252 data points) were flagged as bad. After visually inspecting the remaining data, none of the 306,370 data points were flagged (Figure 1a and 1b).
2.7 Temperature and Salinity Noise Thermosalinograph noise can be estimated by comparing actual external temperature and salinity data with a calculated running mean. The noise is the standard deviation of these differences. Previous experience suggests that a seventeen-minute running mean provides an ample window of data that does not get influenced by small-scale variability or large-scale frontal type features.
March 11, 2014
HOT-258 Thermosalinograph Report Page 4 of 20
Figure 1a: HOT-258 Thermosalinograph data after initial processing and quality control.
March 11, 2014
HOT-258 Thermosalinograph Report Page 5 of 20
Figure 1b: HOT-258 Thermosalinograph data after processing and quality control flagging.
March 11, 2014
HOT-258 Thermosalinograph Report Page 6 of 20
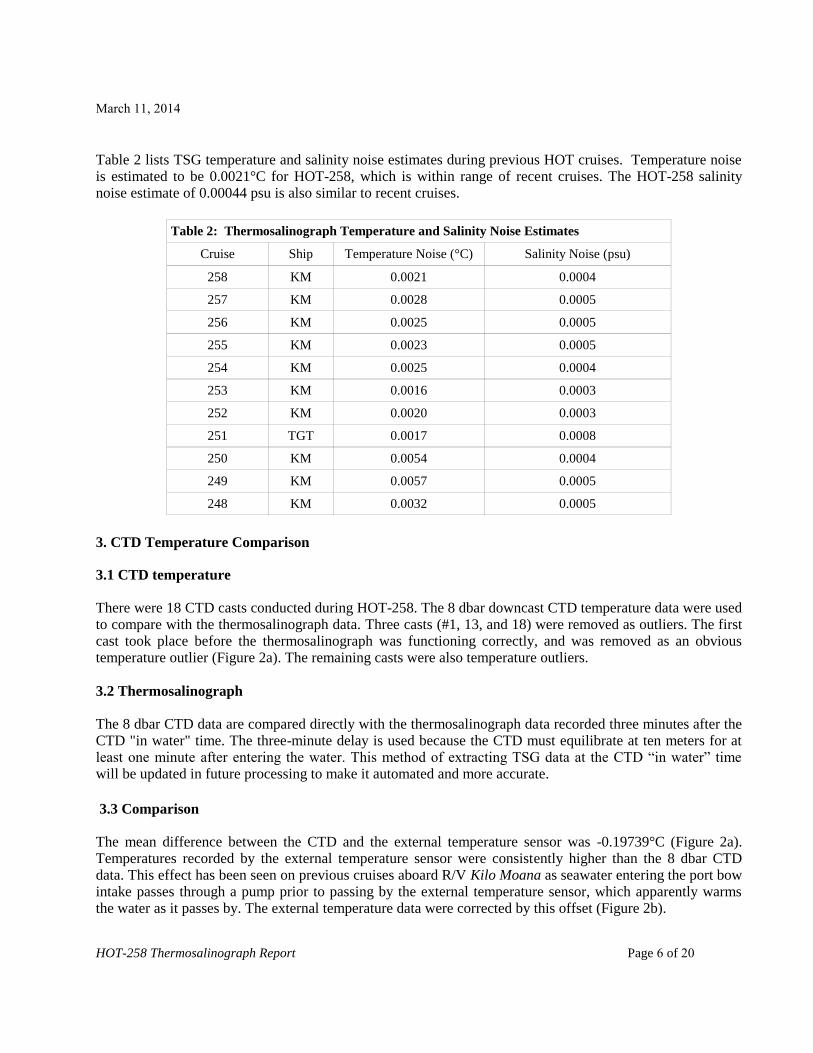
Table 2 lists TSG temperature and salinity noise estimates during previous HOT cruises. Temperature noise is estimated to be 0.0021°C for HOT-258, which is within range of recent cruises. The HOT-258 salinity noise estimate of 0.00044 psu is also similar to recent cruises.
Table 2: Thermosalinograph Temperature and Salinity Noise Estimates
Cruise Ship Temperature Noise (°C) Salinity Noise (psu)
258 KM 0.0021 0.0004
257 KM 0.0028 0.0005
256 KM 0.0025 0.0005
255 KM 0.0023 0.0005
254 KM 0.0025 0.0004
253 KM 0.0016 0.0003
252 KM 0.0020 0.0003
251 TGT 0.0017 0.0008
250 KM 0.0054 0.0004
249 KM 0.0057 0.0005
248 KM 0.0032 0.0005
3. CTD Temperature Comparison
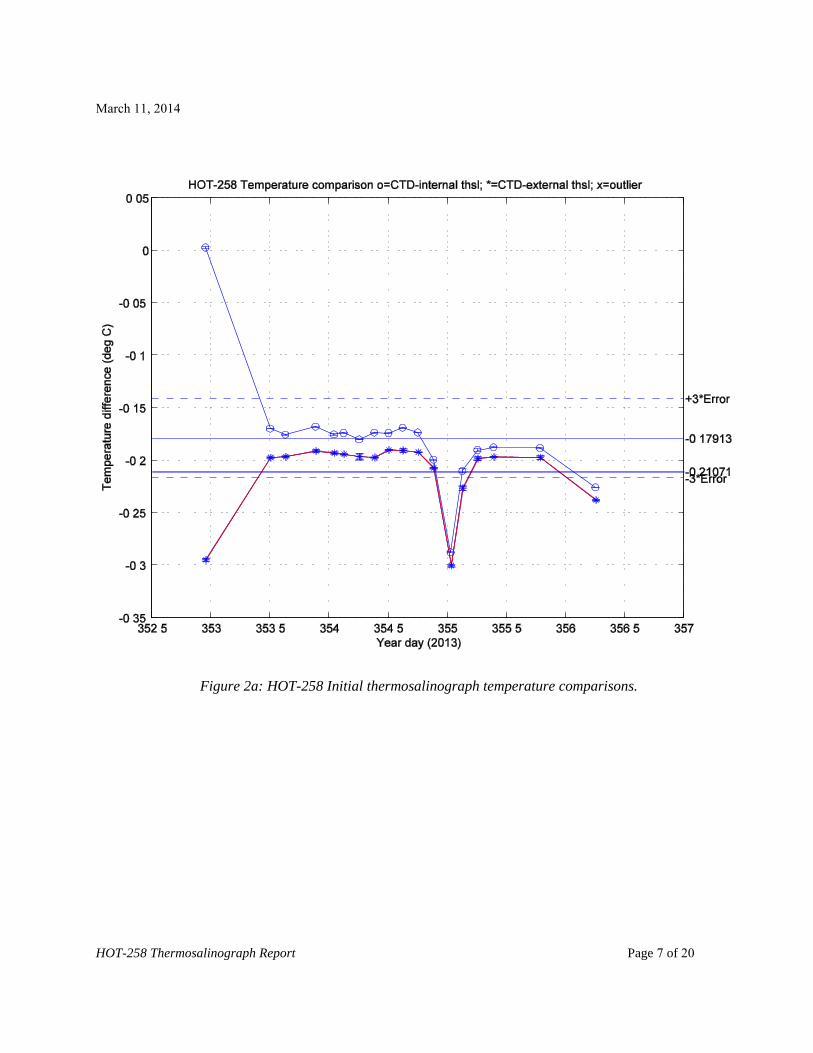
3.1 CTD temperature There were 18 CTD casts conducted during HOT-258. The 8 dbar downcast CTD temperature data were used to compare with the thermosalinograph data. Three casts (#1, 13, and 18) were removed as outliers. The first cast took place before the thermosalinograph was functioning correctly, and was removed as an obvious temperature outlier (Figure 2a). The remaining casts were also temperature outliers.
3.2 Thermosalinograph The 8 dbar CTD data are compared directly with the thermosalinograph data recorded three minutes after the CTD "in water" time. The three-minute delay is used because the CTD must equilibrate at ten meters for at least one minute after entering the water. This method of extracting TSG data at the CTD “in water” time will be updated in future processing to make it automated and more accurate.
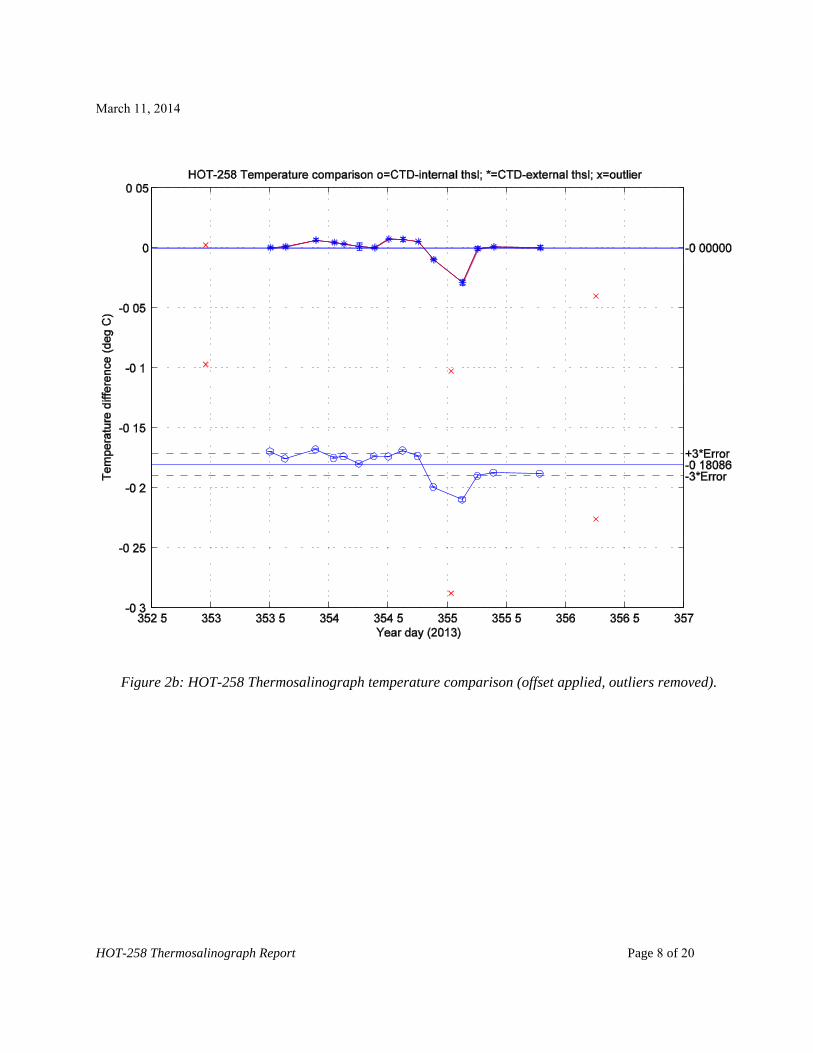
3.3 Comparison The mean difference between the CTD and the external temperature sensor was -0.19739°C (Figure 2a). Temperatures recorded by the external temperature sensor were consistently higher than the 8 dbar CTD data. This effect has been seen on previous cruises aboard R/V Kilo Moana as seawater entering the port bow intake passes through a pump prior to passing by the external temperature sensor, which apparently warms the water as it passes by. The external temperature data were corrected by this offset (Figure 2b).
March 11, 2014
HOT-258 Thermosalinograph Report Page 7 of 20
Figure 2a: HOT-258 Initial thermosalinograph temperature comparisons.
March 11, 2014
HOT-258 Thermosalinograph Report Page 8 of 20
Figure 2b: HOT-258 Thermosalinograph temperature comparison (offset applied, outliers removed).
March 11, 2014
HOT-258 Thermosalinograph Report Page 9 of 20
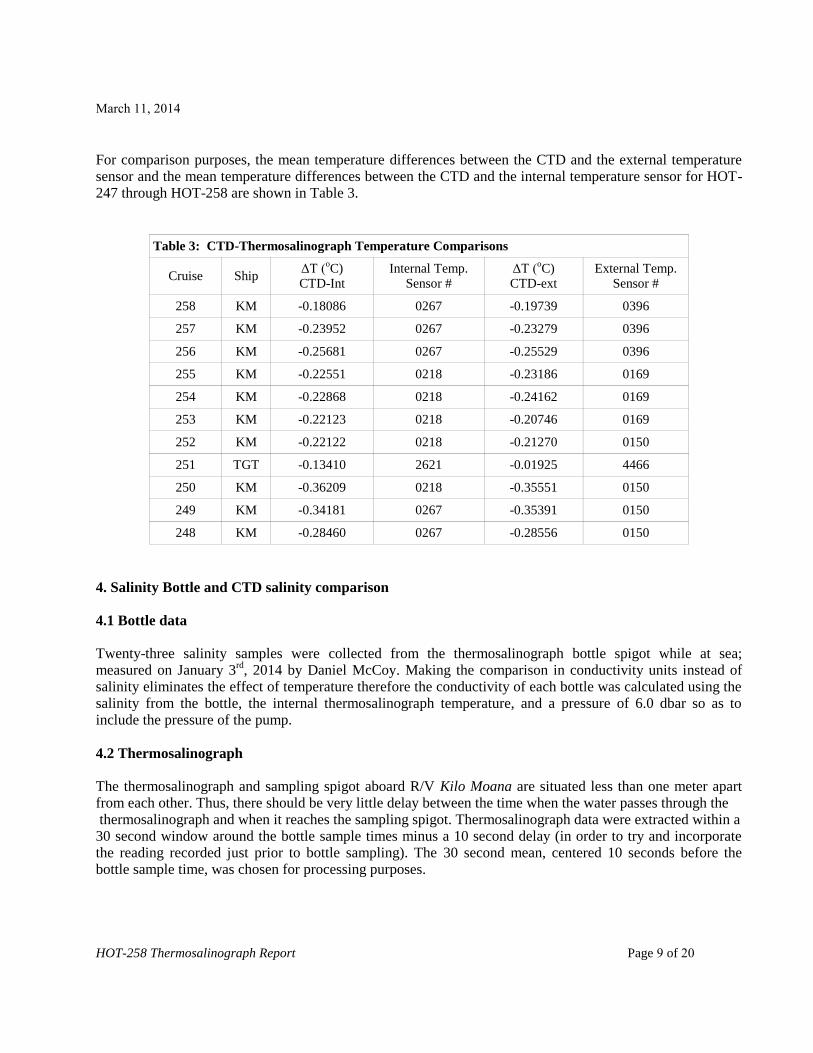
For comparison purposes, the mean temperature differences between the CTD and the external temperature sensor and the mean temperature differences between the CTD and the internal temperature sensor for HOT-247 through HOT-258 are shown in Table 3.
Table 3: CTD-Thermosalinograph Temperature Comparisons
Cruise Ship ΔT (
oC)
CTD-Int Internal Temp.
Sensor # ΔT (
oC)
CTD-ext External Temp.
Sensor #
258 KM -0.18086 0267 -0.19739 0396
257 KM -0.23952 0267 -0.23279 0396
256 KM -0.25681 0267 -0.25529 0396
255 KM -0.22551 0218 -0.23186 0169
254 KM -0.22868 0218 -0.24162 0169
253 KM -0.22123 0218 -0.20746 0169
252 KM -0.22122 0218 -0.21270 0150
251 TGT -0.13410 2621 -0.01925 4466
250 KM -0.36209 0218 -0.35551 0150
249 KM -0.34181 0267 -0.35391 0150
248 KM -0.28460 0267 -0.28556 0150
4. Salinity Bottle and CTD salinity comparison
4.1 Bottle data Twenty-three salinity samples were collected from the thermosalinograph bottle spigot while at sea; measured on January 3
rd, 2014 by Daniel McCoy. Making the comparison in conductivity units instead of
salinity eliminates the effect of temperature therefore the conductivity of each bottle was calculated using the salinity from the bottle, the internal thermosalinograph temperature, and a pressure of 6.0 dbar so as to include the pressure of the pump.
4.2 Thermosalinograph The thermosalinograph and sampling spigot aboard R/V Kilo Moana are situated less than one meter apart from each other. Thus, there should be very little delay between the time when the water passes through the thermosalinograph and when it reaches the sampling spigot. Thermosalinograph data were extracted within a 30 second window around the bottle sample times minus a 10 second delay (in order to try and incorporate the reading recorded just prior to bottle sampling). The 30 second mean, centered 10 seconds before the bottle sample time, was chosen for processing purposes.
March 11, 2014
HOT-258 Thermosalinograph Report Page 10 of 20
4.3 CTD Conductivity In order to make the comparison in conductivity units, the CTD conductivity was calculated using the 8 dbar downcast CTD salinity, the internal thermosalinograph temperature, and a pressure of 6.0 dbar. There were 18 CTD casts conducted while the thermosalinograph was running.
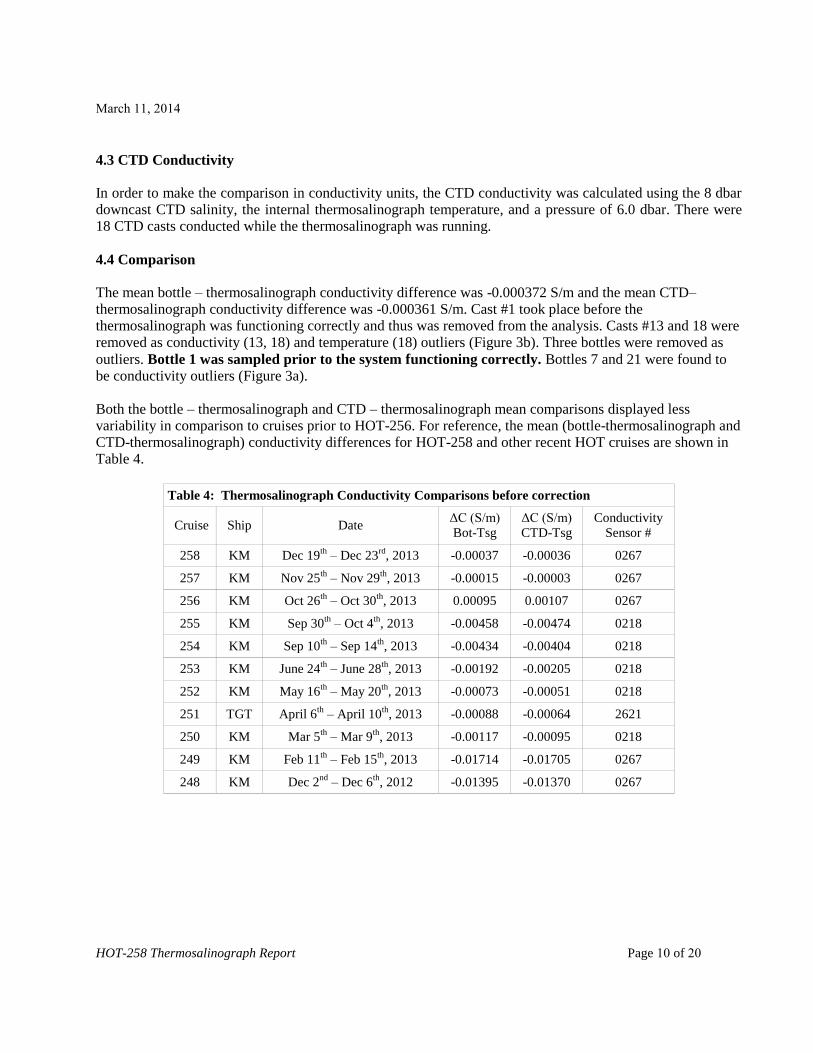
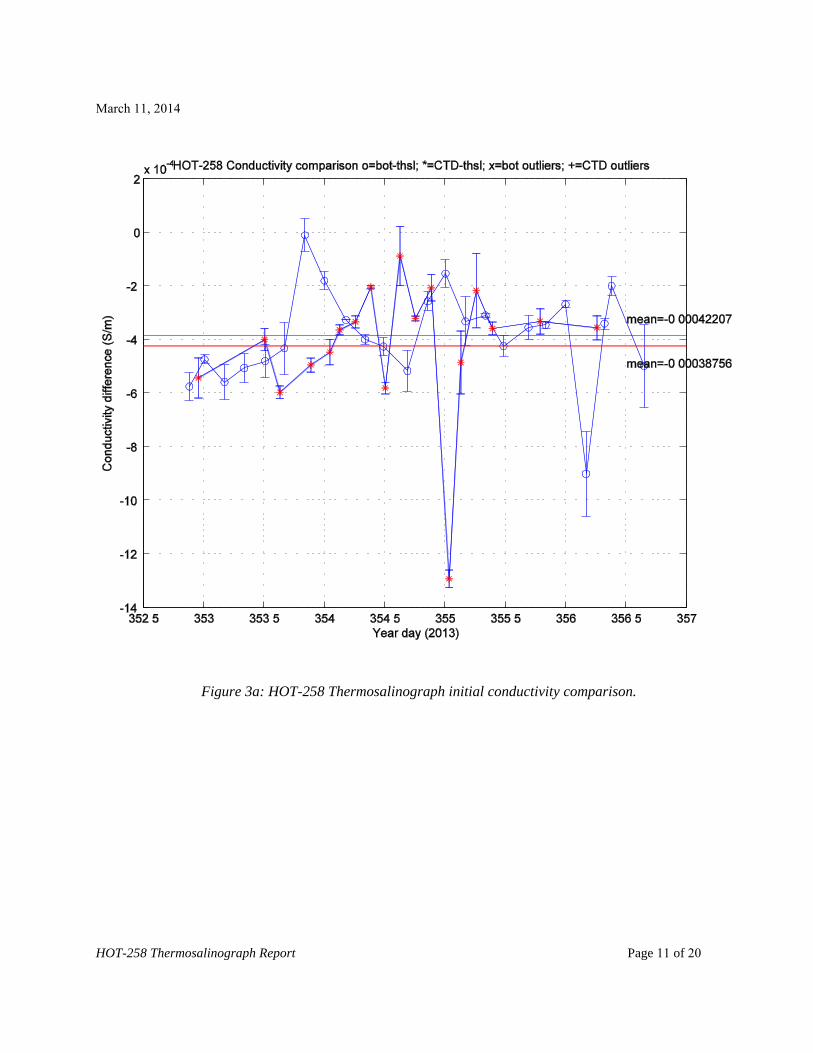
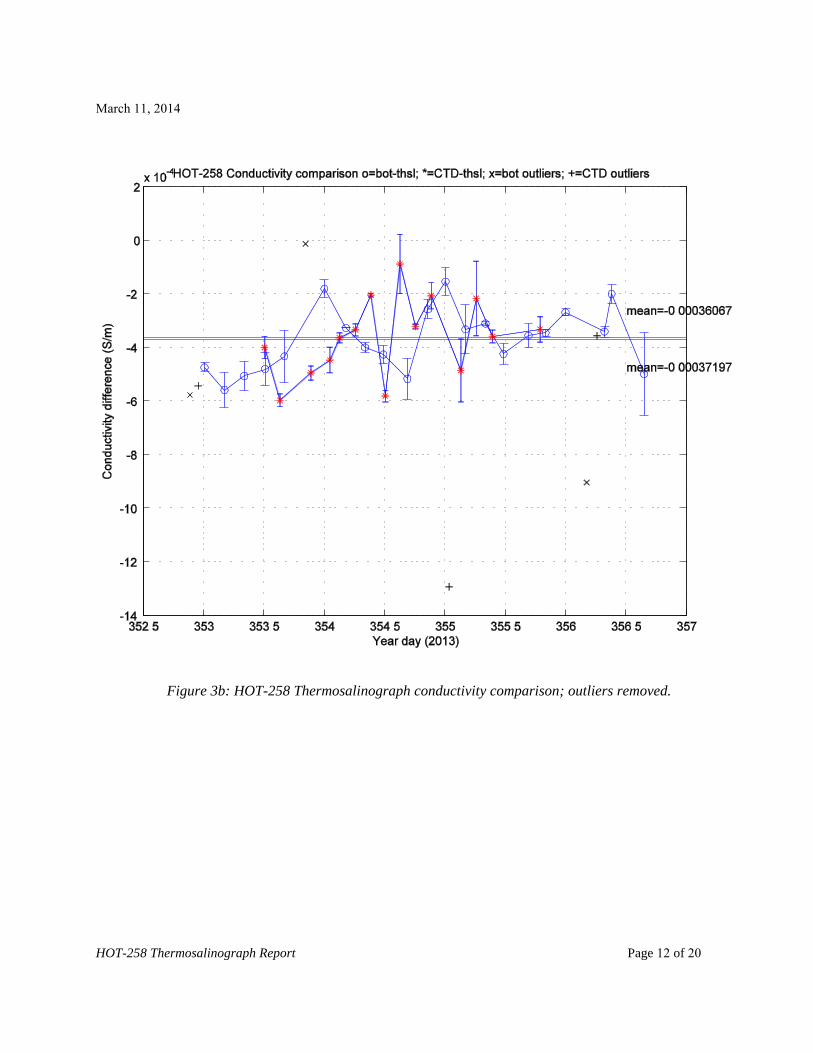
4.4 Comparison The mean bottle – thermosalinograph conductivity difference was -0.000372 S/m and the mean CTD–thermosalinograph conductivity difference was -0.000361 S/m. Cast #1 took place before the thermosalinograph was functioning correctly and thus was removed from the analysis. Casts #13 and 18 were removed as conductivity (13, 18) and temperature (18) outliers (Figure 3b). Three bottles were removed as
outliers. Bottle 1 was sampled prior to the system functioning correctly. Bottles 7 and 21 were found to be conductivity outliers (Figure 3a). Both the bottle – thermosalinograph and CTD – thermosalinograph mean comparisons displayed less variability in comparison to cruises prior to HOT-256. For reference, the mean (bottle-thermosalinograph and CTD-thermosalinograph) conductivity differences for HOT-258 and other recent HOT cruises are shown in Table 4.
Table 4: Thermosalinograph Conductivity Comparisons before correction
Cruise Ship Date ΔC (S/m) Bot-Tsg
ΔC (S/m) CTD-Tsg
Conductivity Sensor #
258 KM Dec 19th
– Dec 23rd
, 2013 -0.00037 -0.00036 0267
257 KM Nov 25th
– Nov 29th
, 2013 -0.00015 -0.00003 0267
256 KM Oct 26th
– Oct 30th
, 2013 0.00095 0.00107 0267
255 KM Sep 30th
– Oct 4th
, 2013 -0.00458 -0.00474 0218
254 KM Sep 10th
– Sep 14th
, 2013 -0.00434 -0.00404 0218
253 KM June 24th
– June 28th
, 2013 -0.00192 -0.00205 0218
252 KM May 16th
– May 20th
, 2013 -0.00073 -0.00051 0218
251 TGT April 6th
– April 10th
, 2013 -0.00088 -0.00064 2621
250 KM Mar 5th
– Mar 9th
, 2013 -0.00117 -0.00095 0218
249 KM Feb 11th
– Feb 15th
, 2013 -0.01714 -0.01705 0267
248 KM Dec 2nd
– Dec 6th
, 2012 -0.01395 -0.01370 0267
March 11, 2014
HOT-258 Thermosalinograph Report Page 11 of 20
Figure 3a: HOT-258 Thermosalinograph initial conductivity comparison.
March 11, 2014
HOT-258 Thermosalinograph Report Page 12 of 20
Figure 3b: HOT-258 Thermosalinograph conductivity comparison; outliers removed.
March 11, 2014
HOT-258 Thermosalinograph Report Page 13 of 20
5. Corrected comparison (Bottle and CTD)
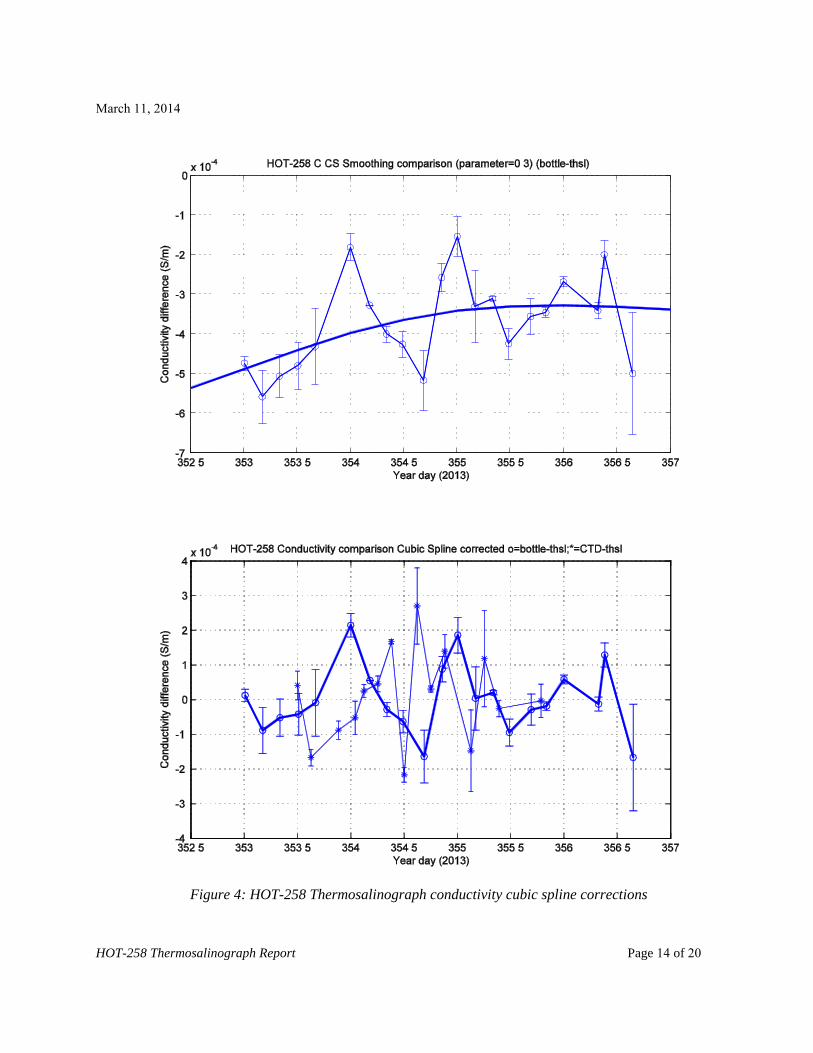
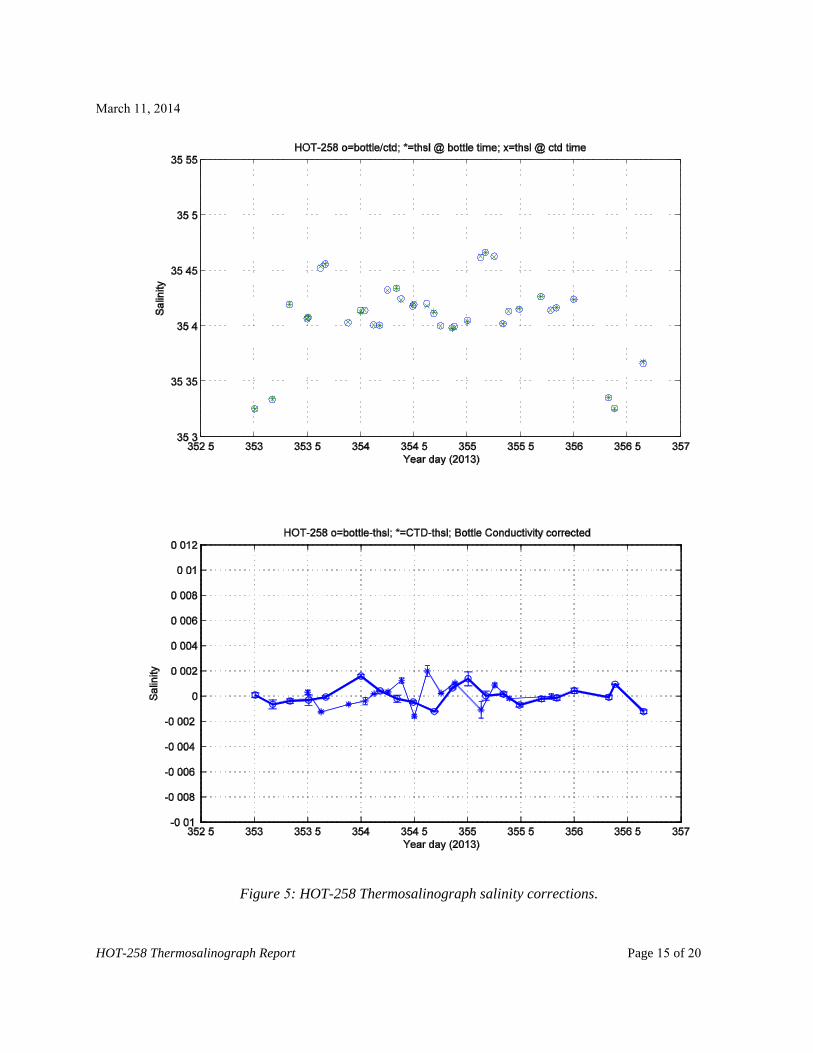
A cubic spline fit was superimposed on the salinity bottle – thermosalinograph comparison. The cubic spline fit was calculated using a Matlab cubic spline routine entitled "csaps". A smoothing parameter between 0 and 1 can be entered into the "csaps" routine. A parameter of 0 applies a least squares fit straight line fit to the data. On the other extreme, a smoothing parameter of 1 applies a "natural" cubic spline interpolant. After examining the effect of different smoothing parameters, a parameter of 0.3 was chosen and plotted in Figure 4 (top). The lower panel shows the bottle-thermosalinograph comparison after correcting the thermosalinograph using the cubic spline fit. This fit was then used to correct the thermosalinograph conductivities. Salinity was calculated using the cubic spline corrected conductivities, thermosalinograph internal temperatures, and pressure of 8 dbar (Figure 4). With these corrections, the mean bottle-thermosalinograph salinity difference is -0.000000 +/- 0.0002 psu. The CTD-thermosalinograph comparison differs by 0.00007 +/- 0.003 psu. The CTD-thermosalinograph salinity difference was significantly smaller than in previous cruises, while the bottle – thermosalinograph
difference was similar to recent results. A small conductivity drift of 2 x 10⁻⁴
S/m was observed on HOT-
258. This will be monitored on HOT-259. For comparison purposes, the mean (bottle-thermosalinograph) differences and the mean (CTD-thermosalinograph) differences for other recent HOT cruises are shown in Table 5.
Table 5: Thermosalinograph Salinity Differences after spline fit correction
Cruise Ship ΔS (psu) Bot-Tsg ΔS (psu) CTD-Tsg
258 KM -0.000000 0.000069
257 KM -0.000000 -0.007150
256 KM -0.000001 0.001215
255 KM 0.000000 -0.001552
254 KM 0.000000 -0.002228
253 KM 0.000001 -0.000712
252 KM 0.000001 0.001560
251 TGT 0.000003 -0.002504
250 KM 0.000002 0.001766
249 KM -0.000004 -0.000376
248 KM -0.000000 -0.001993
March 11, 2014
HOT-258 Thermosalinograph Report Page 14 of 20
Figure 4: HOT-258 Thermosalinograph conductivity cubic spline corrections
March 11, 2014
HOT-258 Thermosalinograph Report Page 15 of 20
Figure 5: HOT-258 Thermosalinograph salinity corrections.
March 11, 2014
HOT-258 Thermosalinograph Report Page 16 of 20
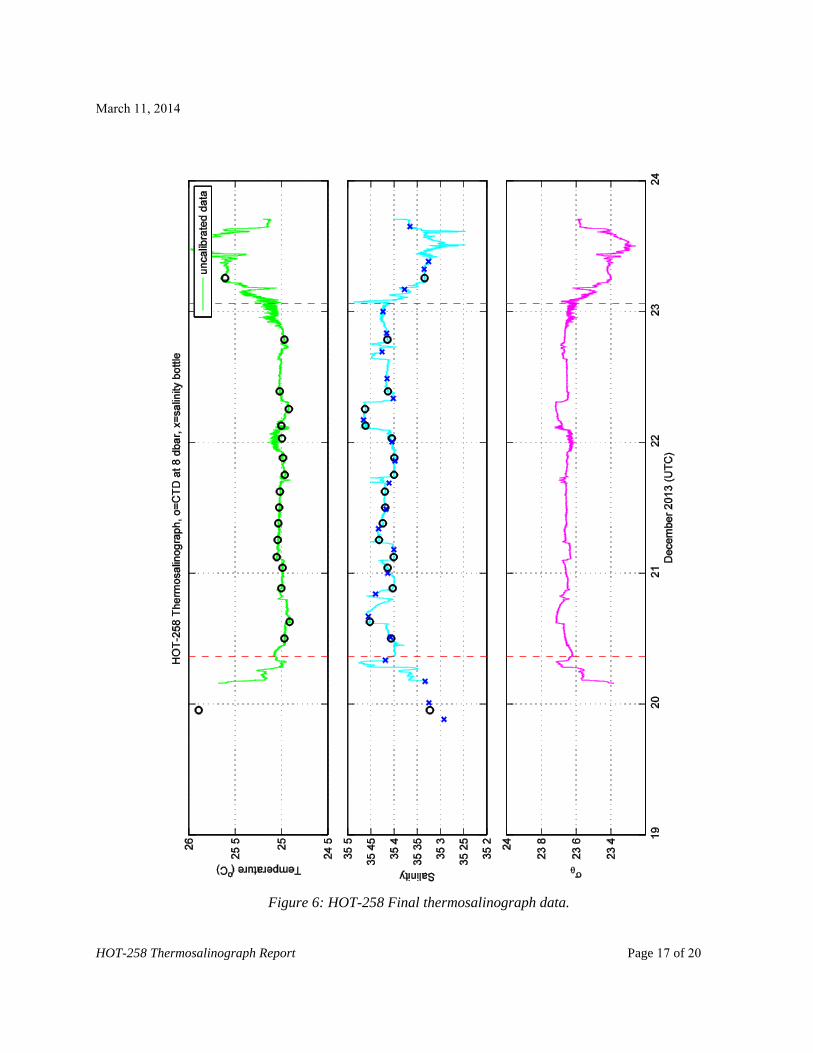
6. Final Products Located in directory: /home/malino5/hot/258/thermosal Final data is in file: hot258thsl.dat File hot258thsl.dat contains seven variables per line: Year, time (UTC), longitude, latitude, temperature (°C), salinity (psu), and the error flags. The first number of the error flag variable refers to the temperature data while the second number refers to the salinity data. All external (remote) temperature sensor data were offset and were corrected using the mean CTD – external temperature difference of -0.19739°C (see Section 3.3)
and flagged as uncalibrated. All data before 12/20/2013 4:00 (UTC) were flagged as bad; the
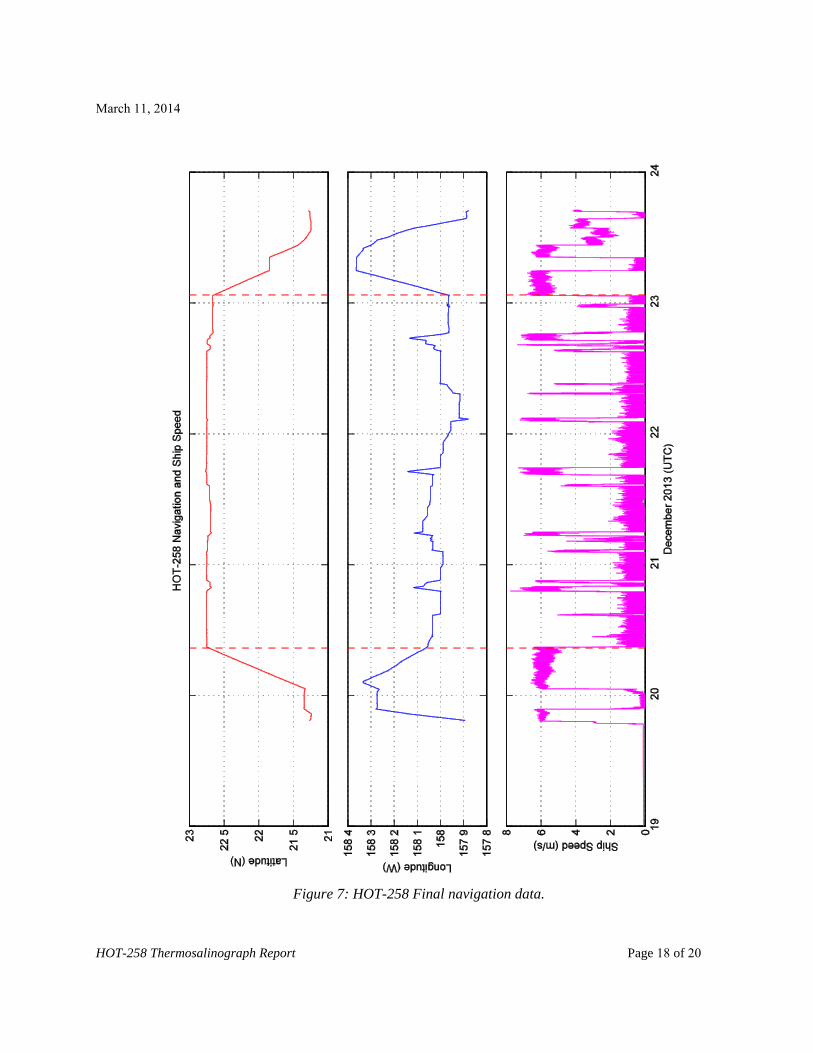
thermosalinograph was functioning poorly due to problems with the sea-water system. For the error flags, a "1" denotes uncalibrated data, a "2" denotes good data, a "3" denotes suspicious data, and a "4" denotes bad data. The data manager will decide if suspicious data are either a "3" suspicious or a "4" bad. A final plot of the temperature and salinity can be seen in Figure 7 and shows that the thermosalinograph data correspond well with the CTD data and salinity bottles. Sigma theta is also computed and plotted. A time-series of latitude, longitude, and ship's speed can be seen in Figure 8 at the same scale. The vertical dashed lines on Figure 6 and Figure 7 indicate the period of time when Station ALOHA was occupied during HOT-258.
March 11, 2014
HOT-258 Thermosalinograph Report Page 17 of 20
Figure 6: HOT-258 Final thermosalinograph data.
March 11, 2014
HOT-258 Thermosalinograph Report Page 18 of 20
Figure 7: HOT-258 Final navigation data.
March 11, 2014
HOT-258 Thermosalinograph Report Page 19 of 20
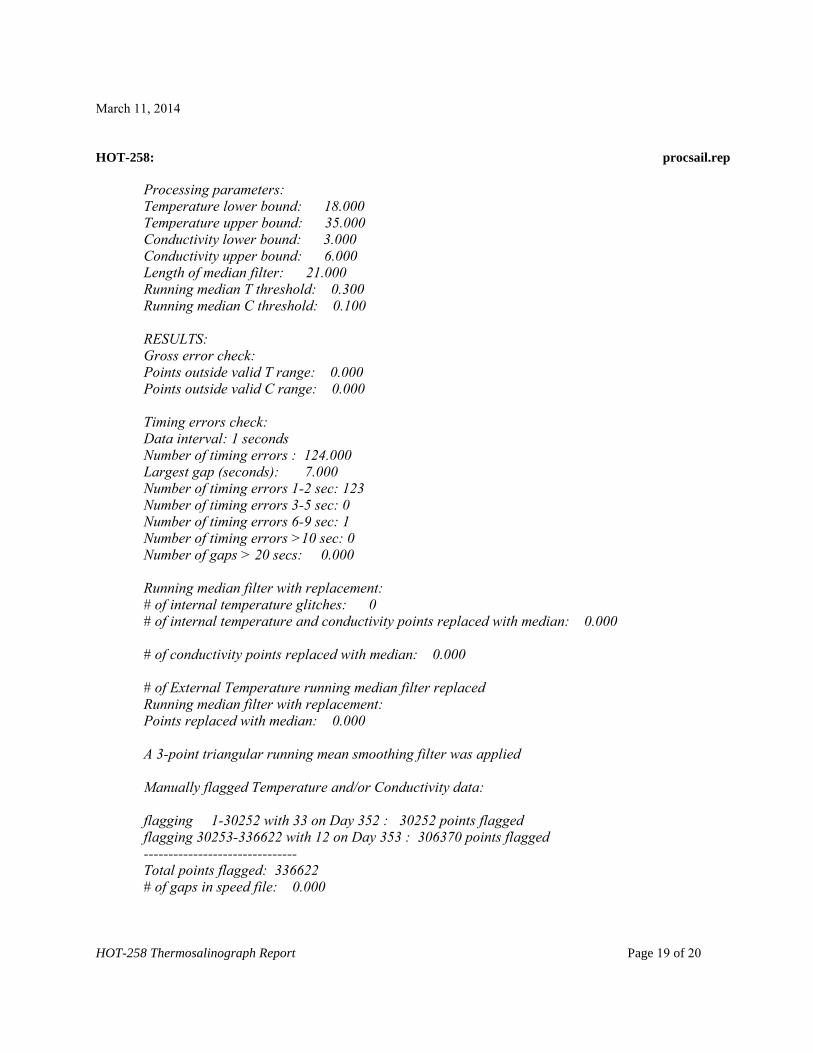
HOT-258: procsail.rep
Processing parameters: Temperature lower bound: 18.000 Temperature upper bound: 35.000 Conductivity lower bound: 3.000 Conductivity upper bound: 6.000 Length of median filter: 21.000 Running median T threshold: 0.300 Running median C threshold: 0.100 RESULTS: Gross error check: Points outside valid T range: 0.000 Points outside valid C range: 0.000 Timing errors check: Data interval: 1 seconds Number of timing errors : 124.000 Largest gap (seconds): 7.000 Number of timing errors 1-2 sec: 123 Number of timing errors 3-5 sec: 0 Number of timing errors 6-9 sec: 1 Number of timing errors >10 sec: 0 Number of gaps > 20 secs: 0.000 Running median filter with replacement: # of internal temperature glitches: 0 # of internal temperature and conductivity points replaced with median: 0.000 # of conductivity points replaced with median: 0.000 # of External Temperature running median filter replaced Running median filter with replacement: Points replaced with median: 0.000 A 3-point triangular running mean smoothing filter was applied Manually flagged Temperature and/or Conductivity data: flagging 1-30252 with 33 on Day 352 : 30252 points flagged flagging 30253-336622 with 12 on Day 353 : 306370 points flagged ------------------------------- Total points flagged: 336622 # of gaps in speed file: 0.000
March 11, 2014
HOT-258 Thermosalinograph Report Page 20 of 20
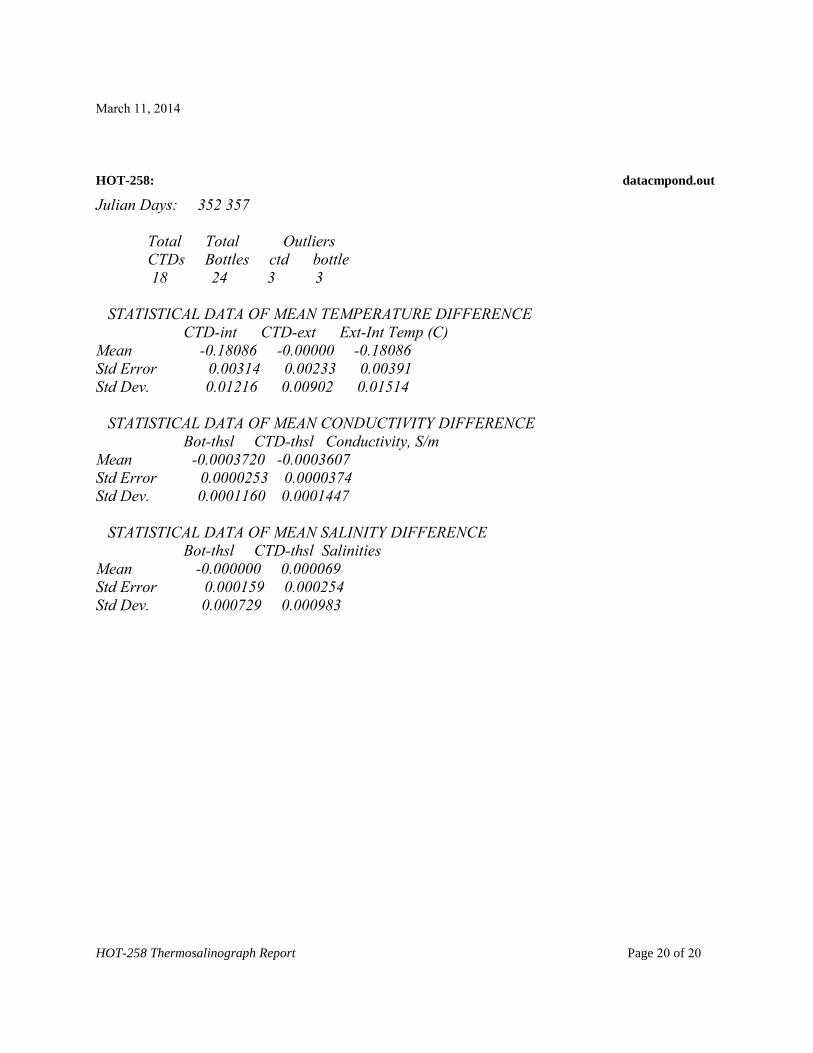
HOT-258: datacmpond.out
Julian Days: 352 357
Total Total Outliers
CTDs Bottles ctd bottle
18 24 3 3
STATISTICAL DATA OF MEAN TEMPERATURE DIFFERENCE
CTD-int CTD-ext Ext-Int Temp (C)
Mean -0.18086 -0.00000 -0.18086
Std Error 0.00314 0.00233 0.00391
Std Dev. 0.01216 0.00902 0.01514
STATISTICAL DATA OF MEAN CONDUCTIVITY DIFFERENCE
Bot-thsl CTD-thsl Conductivity, S/m
Mean -0.0003720 -0.0003607
Std Error 0.0000253 0.0000374
Std Dev. 0.0001160 0.0001447
STATISTICAL DATA OF MEAN SALINITY DIFFERENCE
Bot-thsl CTD-thsl Salinities
Mean -0.000000 0.000069
Std Error 0.000159 0.000254
Std Dev. 0.000729 0.000983