Embed Size (px)
Citation preview
Journal of Hospitality Financial ManagementThe Professional Refereed Journal of the Association of Hospitality FinancialManagement Educators
Volume 19 | Issue 2 Article 2
1-1-2011
Hospitality Industry Professionals’ Perceptions ofthe Importance of Content Areas in the Financeand Accounting CurriculumStephanie G. HeinMissouri State University - Springfield, [email protected]
Carl D. RiegelMissouri State University, [email protected]
This Refereed Article is brought to you for free and open access by ScholarWorks@UMass Amherst. It has been accepted for inclusion in Journal ofHospitality Financial Management by an authorized administrator of ScholarWorks@UMass Amherst. For more information, please [email protected].
Recommended CitationHein, Stephanie G. and Riegel, Carl D. (2011) "Hospitality Industry Professionals’ Perceptions of the Importance of Content Areas inthe Finance and Accounting Curriculum," Journal of Hospitality Financial Management: Vol. 19: Iss. 2, Article 2.Available at: http://scholarworks.umass.edu/jhfm/vol19/iss2/2
3
Hospitality Industry Professionals’ Perceptions of the Importance of Content
Areas in the Finance and Accounting Curriculum
Introduction
The hospitality industry is a major contributor to and a key component of the United
States’ economy. The American Hotel and Lodging Association (2011), for example, reports that
the lodging sector alone, had $127 billion in sales, operated about 51,000 properties and
employed 1.7 billion people in 2010. Similarly, the National Restaurant Association (2011)
estimates that restaurants will generate $604 billion in sales at almost a million locations, employ
12.8 billion people, and consume about half of all food dollars in 2011. As the hospitality
segment continues to evolve and increase in complexity, it has become increasingly important
for hospitality programs to provide students with a curriculum that develops the abilities and
skills necessary for long-term success in the industry.
Recent economic and industry trends have encouraged many hospitality programs to
closely evaluate the effectiveness of their curriculum with respect to how well it prepares
graduates to perform in an increasingly complicated and results driven environment. Pavesic
(1993) noted that review and development of curriculum should be ongoing with attention given
to “any signs that students, graduates, industry, and general economic trends are calling for a
change in course or program emphasis” (p. 291). Nelson and Dopson (2001) further proposed
that “curriculum relevancy to industry needs is one of the top strategic concerns in hospitality
education” (p. 58). The top hospitality schools are cognizant of the need to adapt to a changing
environment and taking steps to revise curricula, better utilize technology, and network with the
industry so that students are better equipped to achieve success and meet the needs of industry
(Freed, 2010).
4
The complex nature of the industry coupled with present day economic realities and
concerns has resulted in many programs adopting curricula that not only focuses on traditional
management and operations course work but which also include a comprehensive approach to
the “business of hospitality”. (Rappole, 2000). Included in this business-focused approach is
coursework that stresses a comprehensive understanding of the financial and accounting
requirements of hospitality organizations. The degree to which the curriculum focuses on
financial and accounting practices varies among hospitality programs. As hospitality operations
become more business oriented, the need to develop students’ finance and accounting knowledge
increases. Kay and Russette (2000) proposed hospitality curricula could better serve the industry
by placing greater emphasis on financial and revenue based content. Some research has indicated
that both the content and delivery of the curriculum exerts substantial influence on graduates’
fluency in financial and accounting related concepts. For example, Solnet, Kralj, Moncarz, and
Kay (2010) found that the formal education process, more than anything else, has the greatest
impact on graduates’ attainment of financial management acuity compared to other competencies
such as marketing, leadership, management, and service orientation.
Literature Review
The existing literature supports the notion of accounting and finance as critical
components of the hospitality curriculum and strongly backs the importance of a well defined
nexus involving multiple stakeholders when assessing and developing the hospitality curriculum.
As the curriculum evolves, educators and industry professionals are concerned that students are
adequately equipped to succeed in the industry (Chung-Herrera, Enz, & Lankau, 2003; Dopson
& Nelson, 2003; Kay & Russette, 2000; Solnet, Kralj, Moncarz, & Kay, 2010; William, 2005).
5
Taking this a step further, Ricci (2010) found lodging recruiters consistently had higher
expectations of newly hired hospitality graduates, than new employees from other sources.
Paulson (2001) noted “postsecondary education institutions must reach a working
relationship with business and industry to create educated competent workers…the result must
be a partnership” (p. 51). Consequently, the curriculum of many hospitality programs has
changed to meet the requirements of all stakeholders. Industry influence and involvement in
curriculum planning has gained support as educators realize the necessity of developing a
curriculum that reflects industry realities (Assante, Huffman, & Harp, 2007; Cavanaugh, 1994;
Dopson & Nelson, 2003; Solnet, Robinson, & Cooper, 2007).
Milman (2001) proposed that curriculum and program development involves three levels
including the university, the hospitality program, and the university’s external relationships. All
three levels must be acknowledged and addressed accordingly to ensure that an appropriate
curriculum is developed and resources are utilized effectively. Assante, Huffman, and Harp
(2010) further suggested hospitality programs’ quality indicators are most often detected in three
constructs: a) students/alumni, industry support, and faculty; b) facilities and curriculum; and c)
research. Educators can use these quality indicators for multiple purposes. They noted that
quality indicators “can be used as a standard for student, alumni, and advisory board evaluation
of programs to ensure curriculum is industry focused” and “can assist in employing selected
industry linkage factors and faculty expertise factors in a balanced scorecard approach” (Assante,
Huffman, & Harp, 2010, p. 180).
A number of researchers have proposed models for developing hospitality curricula that
are significantly influenced by industry. Tsai, Chen, and Hu (2004) found, discrepancies
frequently exist between academics and industry professionals with respect to what should be
6
included in course content. Thus for the curriculum to be relevant to industry, academics cannot
assume they know what industry needs in regards to course content. In an attempt to provide a
comprehensive approach to curriculum development, Dopson and Tas (2004) proposed a model
of curriculum development based on skills, abilities and content deemed to be important by
industry professionals, students, and faculty. Similarly, Gursoy and Swanger (2004) proposed a
curriculum model for hospitality programs located in business schools accredited by the
Association to Advance Collegiate Schools of Business (AACSB). The suggested curriculum
included specific courses that were based on industry professionals’ perceptions of the
importance of course subject area. In a follow-up study, Gursoy and Swanger (2005) proposed
specific content areas that should be addressed in each course subject area based on industry
perceptions. Specific finance and accounting content areas, however, were not addressed in the
study as these course subjects were not controlled by the hospitality program and were instead
offered in the core business curriculum. For those hospitality programs that do manage and
deliver the finance and accounting content areas, there is an opportunity to develop subject
matter that includes hospitality industry participation.
Developing appropriate hospitality finance and accounting curricula supports not only the
needs of industry, but more importantly contributes to the future success of graduates. Chung
(2000) suggested a link between financial and accounting knowledge with career success in the
lodging industry. According to Chung, finance and accounting courses are:
indispensible ones in that such courses significantly influenced career success and
contributed the most to cultivate the ‘management analysis techniques’ factor dimension
of competency, which is the second most influential contributor to career success, and
7
‘adaptation of environment changes and procurement of knowledge’ factor dimension of
competency. (p. 485)
Kay and Moncarz (2007) further supported this idea finding that financial management
knowledge was a strong indicator of top-level success in the lodging industry. Additionally, Kay
and Moncarz (2004) noted financial management expertise had a significant, positive
relationship with increased levels of compensation and was important to receiving top-level
lodging positions.
Comparable results have been established in the foodservice and club management industries.
Rivera, DiPietro, Murphy, and Muller (2008) found multi-unit managers in the restaurant
industry perceived a need for additional training in the areas of finance and controls in order to
receive a promotion to the next level of management. In a similar vein, Enz’s (2004) research on
the issues and concerns of restaurant managers and owner-operators, noted that managing
increasing costs was a key accounting concern for managers and owner-operators alike.
Furthermore, owner-operators reported the areas of cash-flow management and financing to be
critical accounting concerns. Regarding the club management industry, Perdue, Ninemeier, and
Woods (2000) indicated that finance and accounting skills were the areas that were perceived as
the most important and most frequently used by club managers.
Purpose of the Study
The challenge for those charged with developing and delivering curricula then, is to ensure that
the academic content utilized to develop financial and accounting competencies that address the
needs of students as well as current industry demands and practices. However, the success of
hospitality graduates is logically related to the needs and requirements of the industry. For that
reason, the purpose of this study is to gain an enhanced understanding of the level of importance
8
hospitality professionals place on a variety of financial and accounting curriculum content areas
to assist educators in delivering a curriculum that is relevant and responsive to the needs of the
industry.
Research Questions
1. What specific finance and accounting curriculum content areas do hospitality
professionals perceive as being the most and least important in contributing to the long-
term success of hospitality graduates?
2. Are there significant differences in the perceived importance of finance and accounting
curriculum content areas among hospitality professionals working in hotels and resorts
segments as compared to those employed in food and beverage segments?
3. Are there significant differences in the perceived importance of specific finance and
accounting curriculum content areas between hospitality professionals in senior
management, operations management, and support services roles?
4. Are there significant differences in the perceived importance of specific finance and
accounting curriculum content areas among hospitality industry professionals with
varying years of industry experience?
5. Are there significant differences in the perceived importance of specific finance and
accounting curriculum content areas among hospitality industry professionals with
varying levels of educational attainment?
Methodology
A quantitative research design was used to conduct this study. Using a quantitative approach, the
researchers were able to formulate assumptions from a postpositive, objective perspective
(Creswell, 2003). Additionally, the quantitative data collection tools used in this study enabled
9
the researchers to collect and analyze a large quantity of numerical data in an efficient manner
(Patten, 2007) while remaining independent of the results (Johnson & Onwuegbuzie, 2004).
Finally, the ability to collect and analyze data from a large sample provided the opportunity to
generalize the findings and contribute to the body of undergraduate hospitality curriculum
research.
Sample
When conducting quantitative research, attention must be given to the sample size for the results
to be meaningful. Fraenkel and Wallen (2006) recommended a minimum sample size of at least
100 for a descriptive study. Therefore, a target response rate of at least 100 participants was
established for this study with the understanding that an increased sample size would reduce
sampling errors (Fink, 2006). To achieve the target response rate, an electronic survey was
distributed to 190 hospitality industry professionals. These professionals represented a variety of
hospitality industry segments and positions, years of experience, educational backgrounds, and
nation-wide geographical locations. A snowball sampling technique (Fink, 2006) was employed
to distribute the survey. This permitted members of the sample to identify and forward the
survey link to other potential participants. Snowball sampling, also called referral sampling, is a
non-probability sampling technique used by researchers to identify potential subjects in studies
where subjects are difficult to locate. Ravichandran and Arendt (2008) have observed that a
snowball sampling technique is useful in increasing the number of participants in hospitality
curriculum-related research.
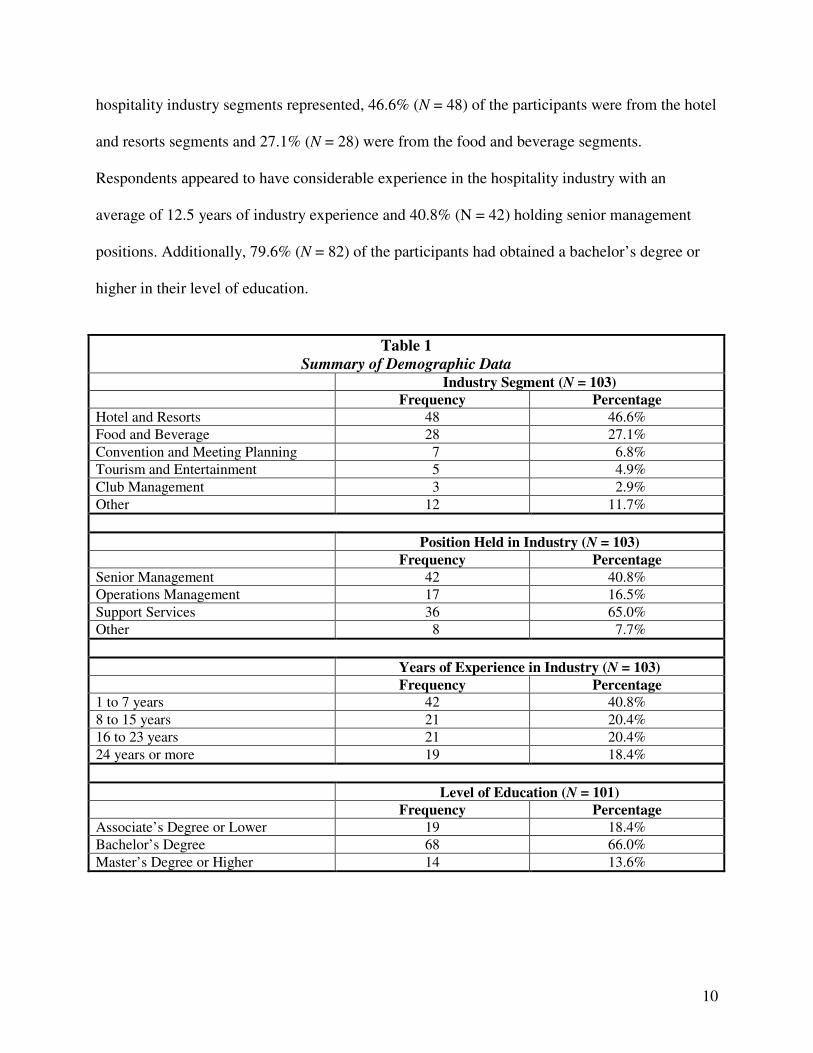
In total, 103 useable surveys were received. Respondents were not required to reply to
every question, and as a result, there were minor variations in population size in some areas of
analysis. Table 1 summarizes the demographic data of respondents. When examining the
10
hospitality industry segments represented, 46.6% (N = 48) of the participants were from the hotel
and resorts segments and 27.1% (N = 28) were from the food and beverage segments.
Respondents appeared to have considerable experience in the hospitality industry with an
average of 12.5 years of industry experience and 40.8% (N = 42) holding senior management
positions. Additionally, 79.6% (N = 82) of the participants had obtained a bachelor’s degree or
higher in their level of education.
Table 1
Summary of Demographic Data Industry Segment (N = 103)
Frequency Percentage
Hotel and Resorts 48 46.6%
Food and Beverage 28 27.1%
Convention and Meeting Planning 7 6.8%
Tourism and Entertainment 5 4.9%
Club Management 3 2.9%
Other 12 11.7%
Position Held in Industry (N = 103)
Frequency Percentage
Senior Management 42 40.8%
Operations Management 17 16.5%
Support Services 36 65.0%
Other 8 7.7%
Years of Experience in Industry (N = 103)
Frequency Percentage
1 to 7 years 42 40.8%
8 to 15 years 21 20.4%
16 to 23 years 21 20.4%
24 years or more 19 18.4%
Level of Education (N = 101)
Frequency Percentage
Associate’s Degree or Lower 19 18.4%
Bachelor’s Degree 68 66.0%
Master’s Degree or Higher 14 13.6%
11
Data Collection
A web-based survey was developed and electronically distributed to respondents. This survey
elicited responses regarding finance and accounting content areas but was also part of a larger
survey that was designed to examine industry’s assessment of the Accreditation Commission for
Programs in Hospitality Administration’s (ACPHA) specified common body of knowledge
standards (2008). Since ACPHA’s description of each area was necessarily general and broad, a
systematic approach was developed and utilized (Hein & Riegel, 2011) to determine the specific
elements that made up each component of the common body of knowledge. This included
analysis of courses in these knowledge areas at a variety of institutions with hospitality
programs, analysis of leading texts reflecting hospitality treatment of these knowledge areas, as
well as analysis of general texts in these areas, and finally reviews by content area specialists.
Using this information to propose curricular content, a survey was designed to gain
insight into how hospitality professionals view the importance of each content area in
contributing to the long-term success of hospitality graduates. In total, the survey included 138
items. Of particular importance to this study were the 10 items that addressed financial
management areas, the 8 items that addressed accounting practices, and 4 items of the
demographic information collected. The financial management and accounting practices content
areas considered are noted in the tables that follow.
Participants reported the degree to which they believed each area was important to the
long-term success of hospitality graduates. Response selections for each area were based on a
five point Likert scale of 1 to 5 (1 = Not Necessary, 2 = Of Little Importance, 3 = Moderately
Important, 4 = Important, and 5 = Essential). Respondents were also allowed to note additional
subject matter they believed to be important through open-ended questions.
12
Data Analysis
The Statistical Program for the Social Sciences (SPSS) 17.0 edition was employed to
analyze the data for this study. The data analysis process began by scoring and organizing the
demographic data. Separate overall mean scores were computed for both the perceived
importance of financial management and the perceived importance of accounting practices. To
calculate the overall mean for financial management, participants’ numerical responses for each
of the content areas were added and divided by 10. The same process was used to determine the
participants’ perception of the importance of accounting practices except that the sum of
numerical responses was divided by 8.
Additionally, mean scores for each content area were computed. A variety of statistical
analysis methods were used to address each research question. For research question one, mean
responses were computed for each of the 10 financial management content areas and the 8
accounting curriculum content areas to determine which areas were perceived as being the most
and least important to the long-term success of hospitality graduates. Using frequency
distributions, each mean was analyzed to determine which areas were perceived to be the most
and least important. The means for each content area were then presented in rank order and
comparisons between the highest and lowest scores were made.
A number of data analysis techniques were then performed to compare the means of
various groups of participants. To address research question two, 18 independent samples t-tests
were calculated to determine if there were significant differences in the importance of finance
and accounting curriculum content areas between hospitality professionals working in hotels and
resorts segments as compared to those in food and beverage segments. According to Field
(2009), independent samples t-tests are “used when there are two experimental conditions and
13
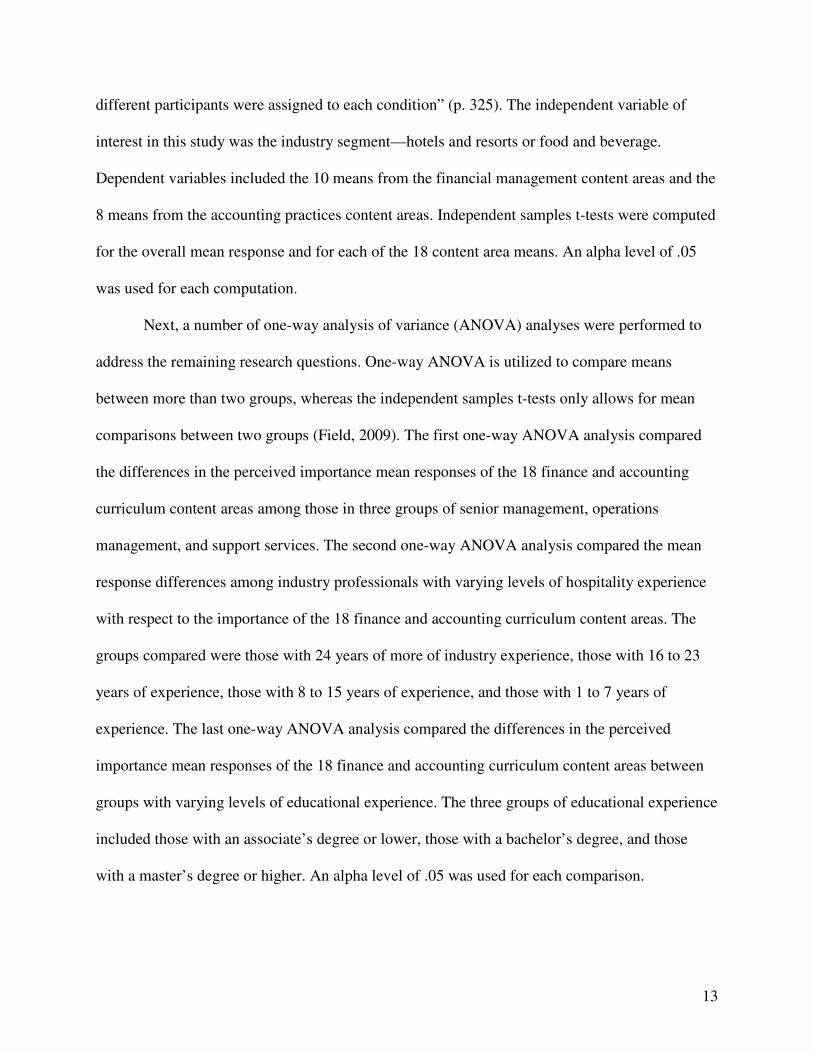
different participants were assigned to each condition” (p. 325). The independent variable of
interest in this study was the industry segment—hotels and resorts or food and beverage.
Dependent variables included the 10 means from the financial management content areas and the
8 means from the accounting practices content areas. Independent samples t-tests were computed
for the overall mean response and for each of the 18 content area means. An alpha level of .05
was used for each computation.
Next, a number of one-way analysis of variance (ANOVA) analyses were performed to
address the remaining research questions. One-way ANOVA is utilized to compare means
between more than two groups, whereas the independent samples t-tests only allows for mean
comparisons between two groups (Field, 2009). The first one-way ANOVA analysis compared
the differences in the perceived importance mean responses of the 18 finance and accounting
curriculum content areas among those in three groups of senior management, operations
management, and support services. The second one-way ANOVA analysis compared the mean
response differences among industry professionals with varying levels of hospitality experience
with respect to the importance of the 18 finance and accounting curriculum content areas. The
groups compared were those with 24 years of more of industry experience, those with 16 to 23
years of experience, those with 8 to 15 years of experience, and those with 1 to 7 years of
experience. The last one-way ANOVA analysis compared the differences in the perceived
importance mean responses of the 18 finance and accounting curriculum content areas between
groups with varying levels of educational experience. The three groups of educational experience
included those with an associate’s degree or lower, those with a bachelor’s degree, and those
with a master’s degree or higher. An alpha level of .05 was used for each comparison.
14
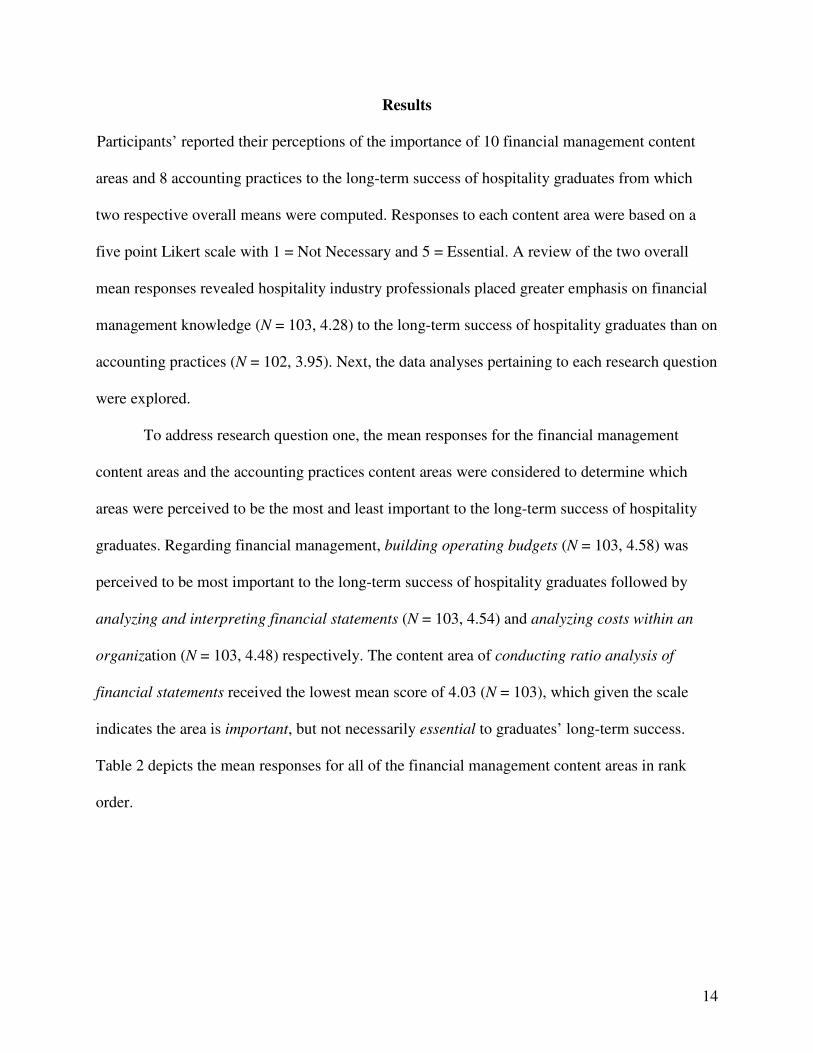
Results
Participants’ reported their perceptions of the importance of 10 financial management content
areas and 8 accounting practices to the long-term success of hospitality graduates from which
two respective overall means were computed. Responses to each content area were based on a
five point Likert scale with 1 = Not Necessary and 5 = Essential. A review of the two overall
mean responses revealed hospitality industry professionals placed greater emphasis on financial
management knowledge (N = 103, 4.28) to the long-term success of hospitality graduates than on
accounting practices (N = 102, 3.95). Next, the data analyses pertaining to each research question
were explored.
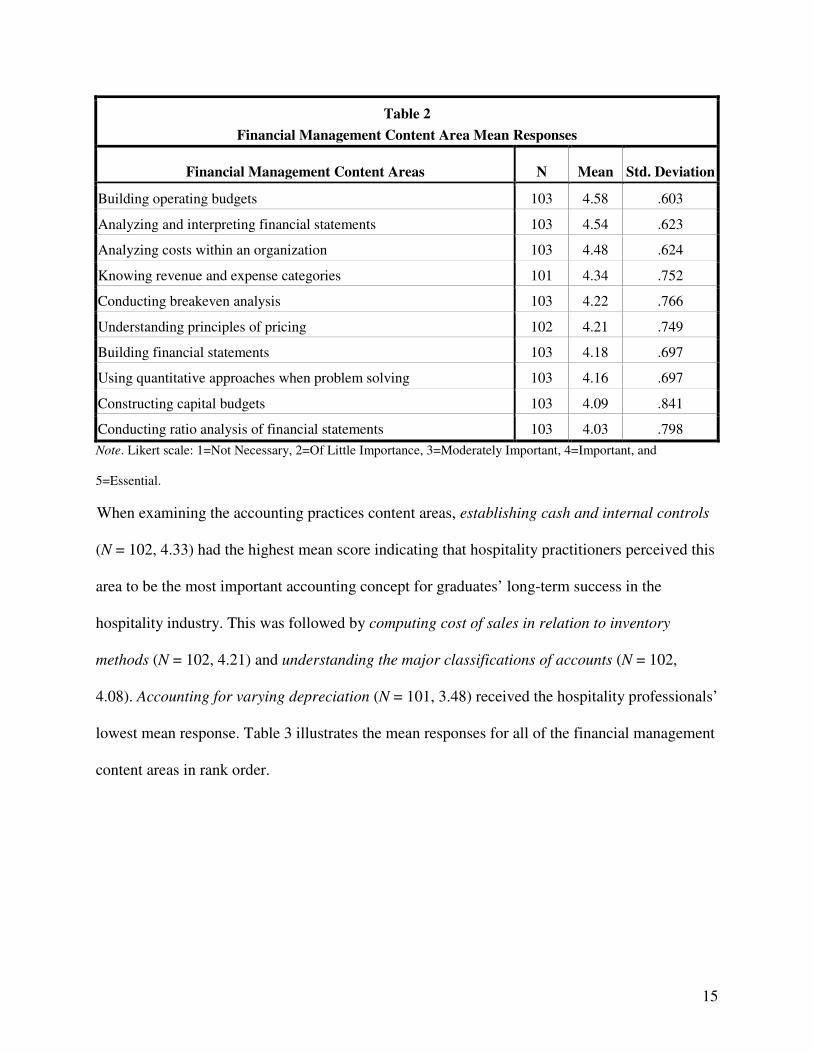
To address research question one, the mean responses for the financial management
content areas and the accounting practices content areas were considered to determine which
areas were perceived to be the most and least important to the long-term success of hospitality
graduates. Regarding financial management, building operating budgets (N = 103, 4.58) was
perceived to be most important to the long-term success of hospitality graduates followed by
analyzing and interpreting financial statements (N = 103, 4.54) and analyzing costs within an
organization (N = 103, 4.48) respectively. The content area of conducting ratio analysis of
financial statements received the lowest mean score of 4.03 (N = 103), which given the scale
indicates the area is important, but not necessarily essential to graduates’ long-term success.
Table 2 depicts the mean responses for all of the financial management content areas in rank
order.
15
Table 2
Financial Management Content Area Mean Responses
Financial Management Content Areas N Mean Std. Deviation
Building operating budgets 103 4.58 .603
Analyzing and interpreting financial statements 103 4.54 .623
Analyzing costs within an organization 103 4.48 .624
Knowing revenue and expense categories 101 4.34 .752
Conducting breakeven analysis 103 4.22 .766
Understanding principles of pricing 102 4.21 .749
Building financial statements 103 4.18 .697
Using quantitative approaches when problem solving 103 4.16 .697
Constructing capital budgets 103 4.09 .841
Conducting ratio analysis of financial statements 103 4.03 .798
Note. Likert scale: 1=Not Necessary, 2=Of Little Importance, 3=Moderately Important, 4=Important, and
5=Essential.
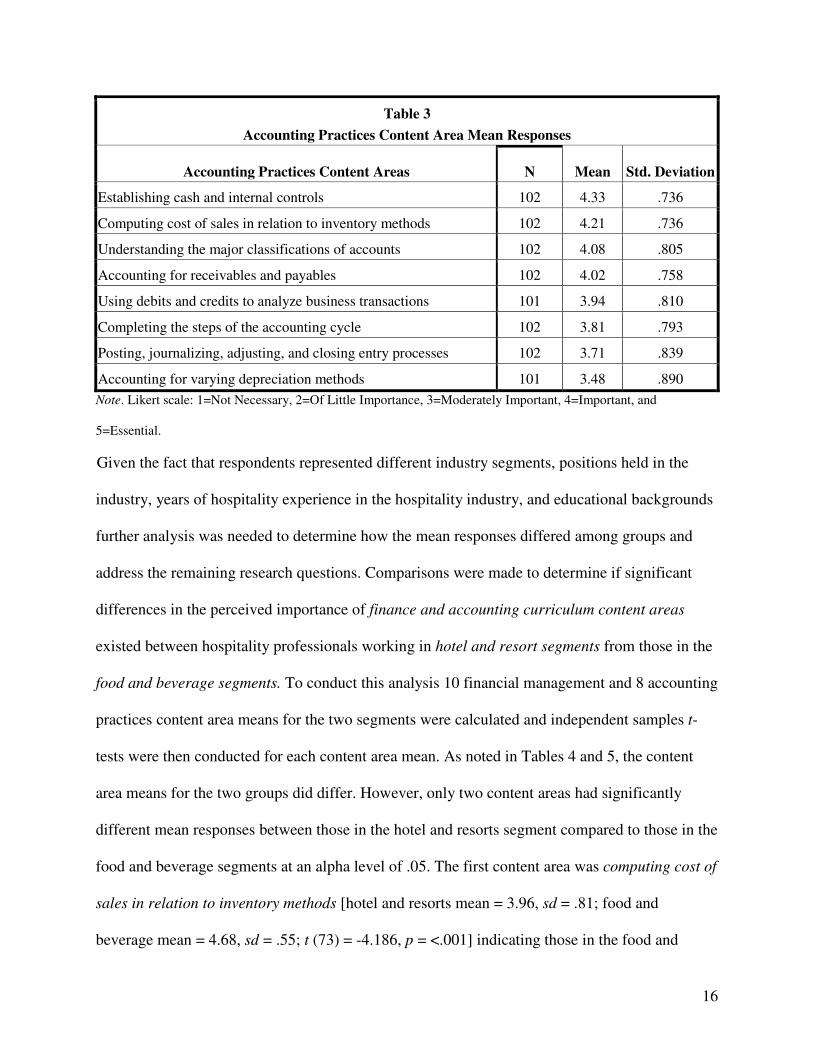
When examining the accounting practices content areas, establishing cash and internal controls
(N = 102, 4.33) had the highest mean score indicating that hospitality practitioners perceived this
area to be the most important accounting concept for graduates’ long-term success in the
hospitality industry. This was followed by computing cost of sales in relation to inventory
methods (N = 102, 4.21) and understanding the major classifications of accounts (N = 102,
4.08). Accounting for varying depreciation (N = 101, 3.48) received the hospitality professionals’
lowest mean response. Table 3 illustrates the mean responses for all of the financial management
content areas in rank order.
16
Table 3
Accounting Practices Content Area Mean Responses
Accounting Practices Content Areas N Mean Std. Deviation
Establishing cash and internal controls 102 4.33 .736
Computing cost of sales in relation to inventory methods 102 4.21 .736
Understanding the major classifications of accounts 102 4.08 .805
Accounting for receivables and payables 102 4.02 .758
Using debits and credits to analyze business transactions 101 3.94 .810
Completing the steps of the accounting cycle 102 3.81 .793
Posting, journalizing, adjusting, and closing entry processes 102 3.71 .839
Accounting for varying depreciation methods 101 3.48 .890
Note. Likert scale: 1=Not Necessary, 2=Of Little Importance, 3=Moderately Important, 4=Important, and
5=Essential.
Given the fact that respondents represented different industry segments, positions held in the
industry, years of hospitality experience in the hospitality industry, and educational backgrounds
further analysis was needed to determine how the mean responses differed among groups and
address the remaining research questions. Comparisons were made to determine if significant
differences in the perceived importance of finance and accounting curriculum content areas
existed between hospitality professionals working in hotel and resort segments from those in the
food and beverage segments. To conduct this analysis 10 financial management and 8 accounting
practices content area means for the two segments were calculated and independent samples t-
tests were then conducted for each content area mean. As noted in Tables 4 and 5, the content
area means for the two groups did differ. However, only two content areas had significantly
different mean responses between those in the hotel and resorts segment compared to those in the
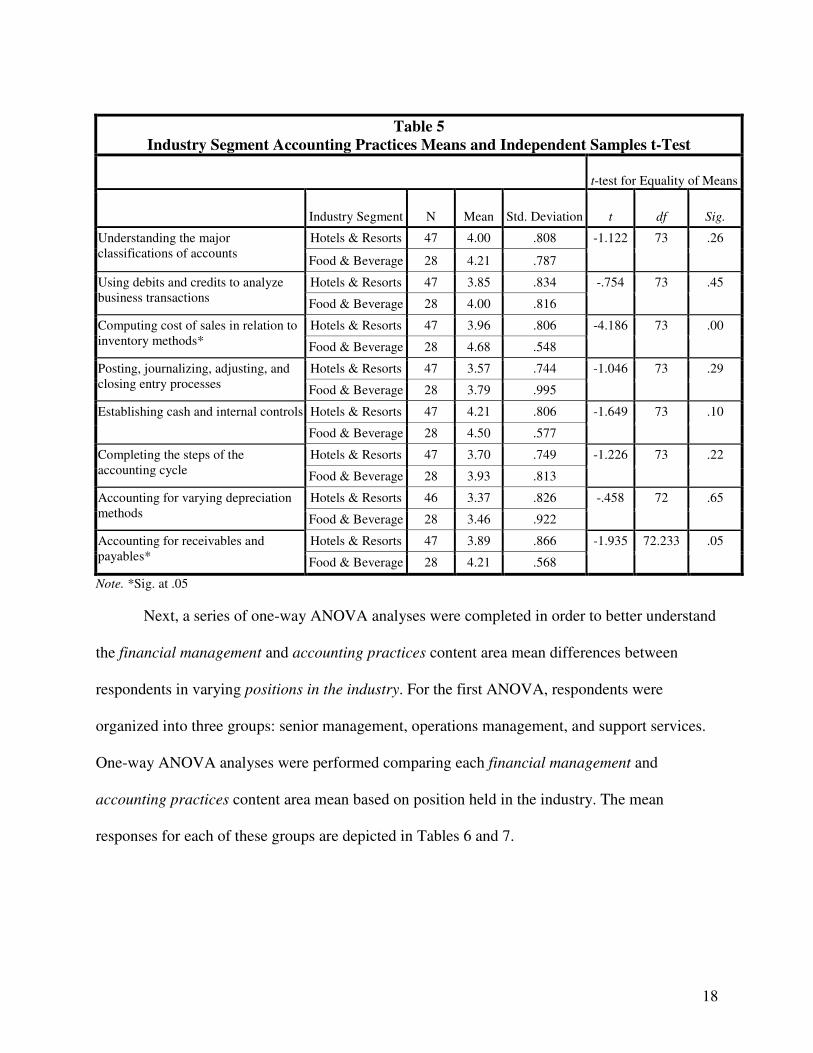
food and beverage segments at an alpha level of .05. The first content area was computing cost of
sales in relation to inventory methods [hotel and resorts mean = 3.96, sd = .81; food and
beverage mean = 4.68, sd = .55; t (73) = -4.186, p = <.001] indicating those in the food and
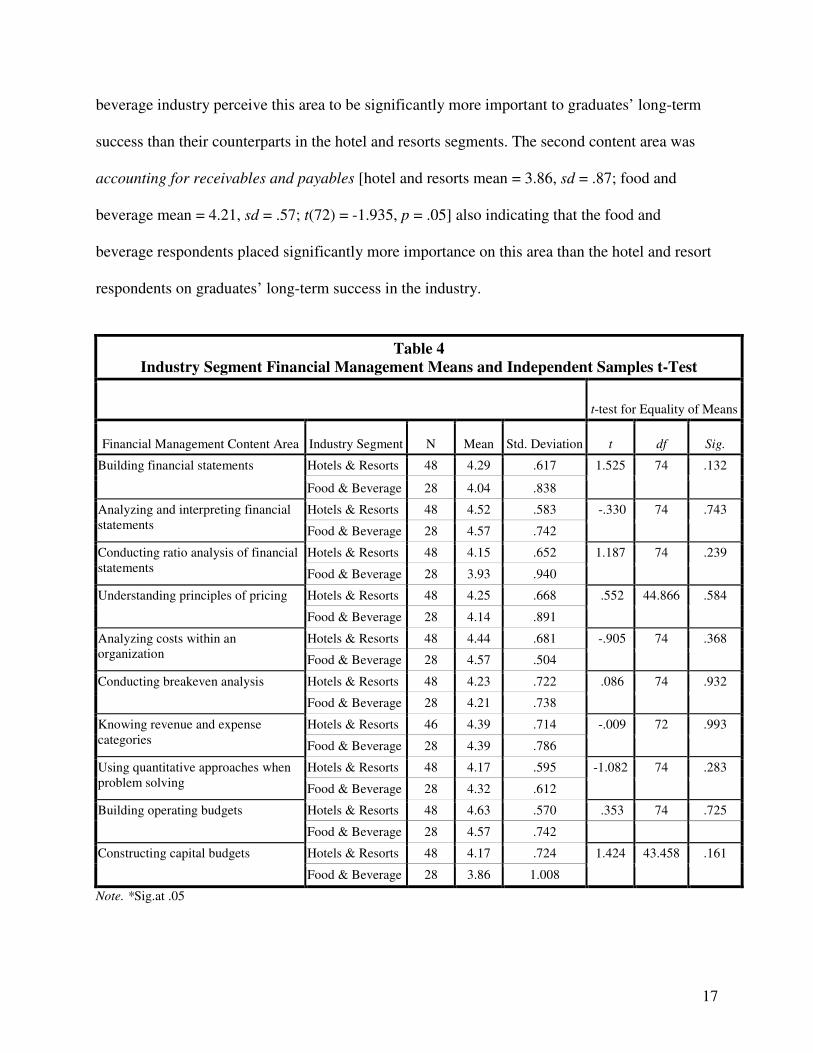
17
beverage industry perceive this area to be significantly more important to graduates’ long-term
success than their counterparts in the hotel and resorts segments. The second content area was
accounting for receivables and payables [hotel and resorts mean = 3.86, sd = .87; food and
beverage mean = 4.21, sd = .57; t(72) = -1.935, p = .05] also indicating that the food and
beverage respondents placed significantly more importance on this area than the hotel and resort
respondents on graduates’ long-term success in the industry.
Table 4
Industry Segment Financial Management Means and Independent Samples t-Test
t-test for Equality of Means
Financial Management Content Area Industry Segment N Mean Std. Deviation t df Sig.
Building financial statements Hotels & Resorts 48 4.29 .617 1.525 74 .132
Food & Beverage 28 4.04 .838
Analyzing and interpreting financial statements
Hotels & Resorts 48 4.52 .583 -.330 74 .743
Food & Beverage 28 4.57 .742
Conducting ratio analysis of financial statements
Hotels & Resorts 48 4.15 .652 1.187 74 .239
Food & Beverage 28 3.93 .940
Understanding principles of pricing Hotels & Resorts 48 4.25 .668 .552 44.866 .584
Food & Beverage 28 4.14 .891
Analyzing costs within an organization
Hotels & Resorts 48 4.44 .681 -.905 74 .368
Food & Beverage 28 4.57 .504
Conducting breakeven analysis Hotels & Resorts 48 4.23 .722 .086 74 .932
Food & Beverage 28 4.21 .738
Knowing revenue and expense categories
Hotels & Resorts 46 4.39 .714 -.009 72 .993
Food & Beverage 28 4.39 .786
Using quantitative approaches when problem solving
Hotels & Resorts 48 4.17 .595 -1.082 74 .283
Food & Beverage 28 4.32 .612
Building operating budgets Hotels & Resorts 48 4.63 .570 .353 74 .725
Food & Beverage 28 4.57 .742
Constructing capital budgets Hotels & Resorts 48 4.17 .724 1.424 43.458 .161
Food & Beverage 28 3.86 1.008
Note. *Sig.at .05
18
Table 5
Industry Segment Accounting Practices Means and Independent Samples t-Test
t-test for Equality of Means
Industry Segment N Mean Std. Deviation t df Sig.
Understanding the major classifications of accounts
Hotels & Resorts 47 4.00 .808 -1.122 73 .26
Food & Beverage 28 4.21 .787
Using debits and credits to analyze business transactions
Hotels & Resorts 47 3.85 .834 -.754 73 .45
Food & Beverage 28 4.00 .816
Computing cost of sales in relation to inventory methods*
Hotels & Resorts 47 3.96 .806 -4.186 73 .00
Food & Beverage 28 4.68 .548
Posting, journalizing, adjusting, and closing entry processes
Hotels & Resorts 47 3.57 .744 -1.046 73 .29
Food & Beverage 28 3.79 .995
Establishing cash and internal controls Hotels & Resorts 47 4.21 .806 -1.649 73 .10
Food & Beverage 28 4.50 .577
Completing the steps of the accounting cycle
Hotels & Resorts 47 3.70 .749 -1.226 73 .22
Food & Beverage 28 3.93 .813
Accounting for varying depreciation methods
Hotels & Resorts 46 3.37 .826 -.458 72 .65
Food & Beverage 28 3.46 .922
Accounting for receivables and payables*
Hotels & Resorts 47 3.89 .866 -1.935 72.233 .05
Food & Beverage 28 4.21 .568
Note. *Sig. at .05
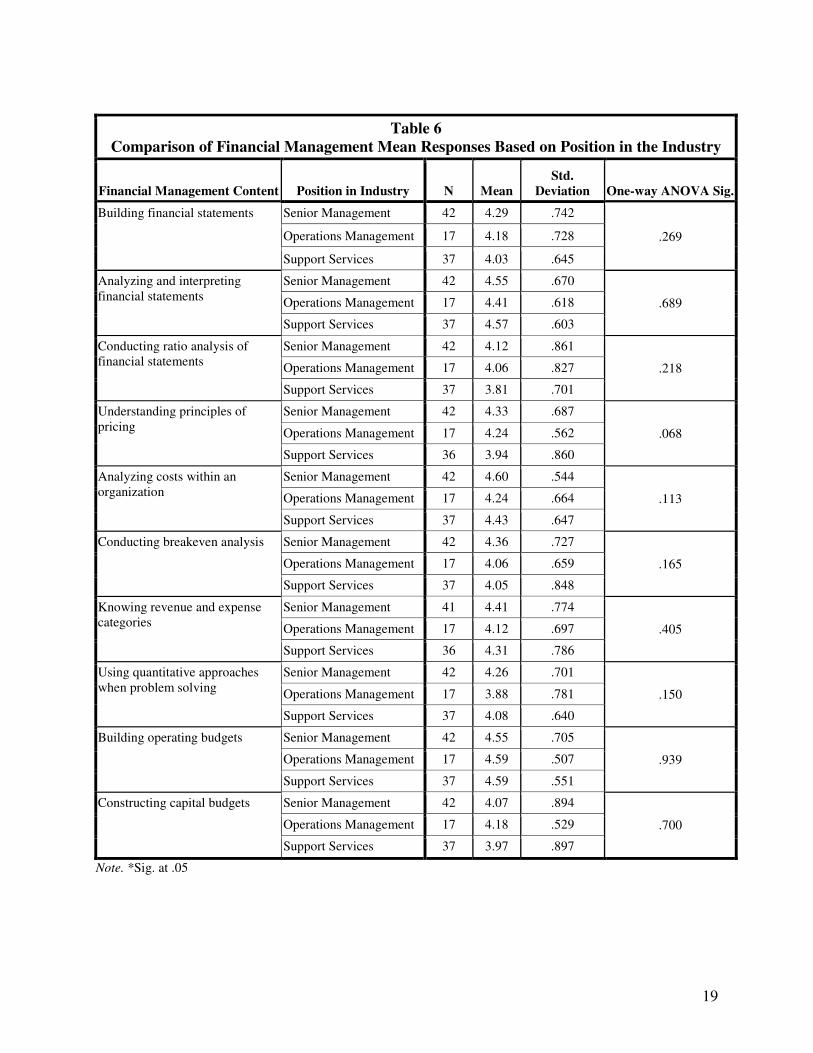
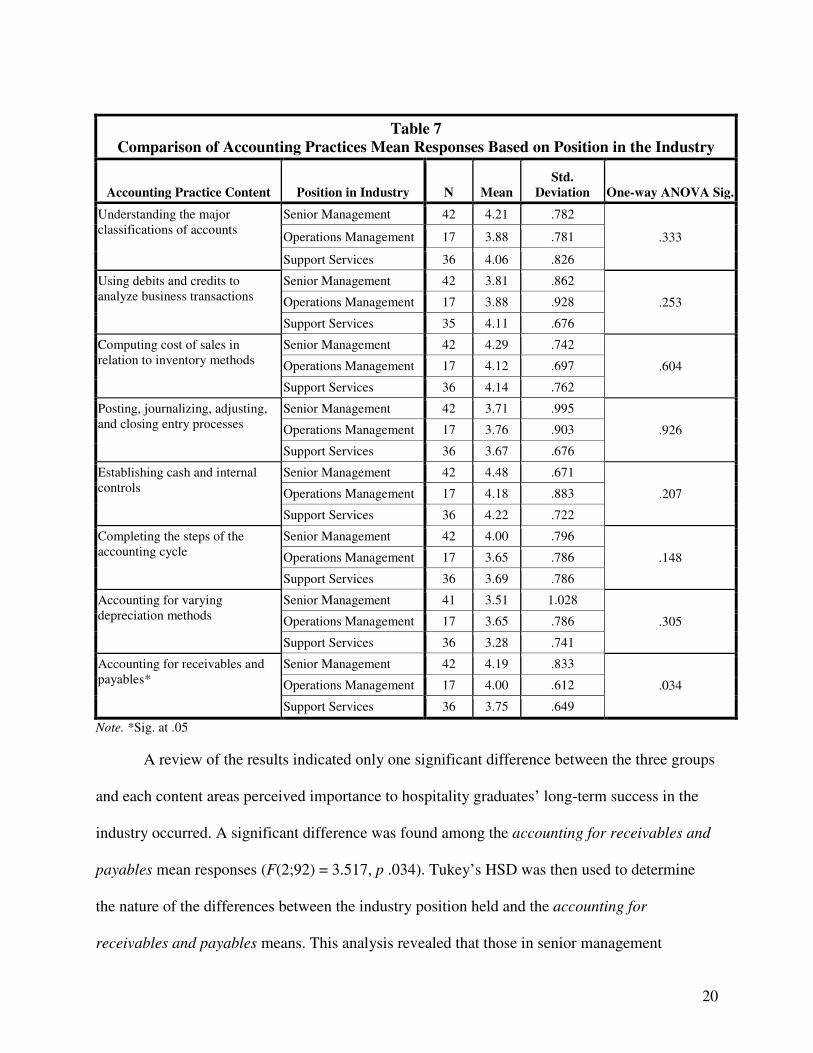
Next, a series of one-way ANOVA analyses were completed in order to better understand
the financial management and accounting practices content area mean differences between
respondents in varying positions in the industry. For the first ANOVA, respondents were
organized into three groups: senior management, operations management, and support services.
One-way ANOVA analyses were performed comparing each financial management and
accounting practices content area mean based on position held in the industry. The mean
responses for each of these groups are depicted in Tables 6 and 7.
19
Table 6
Comparison of Financial Management Mean Responses Based on Position in the Industry
Financial Management Content Position in Industry N Mean
Std.
Deviation One-way ANOVA Sig.
Building financial statements Senior Management 42 4.29 .742
.269 Operations Management 17 4.18 .728
Support Services 37 4.03 .645
Analyzing and interpreting financial statements
Senior Management 42 4.55 .670
.689 Operations Management 17 4.41 .618
Support Services 37 4.57 .603
Conducting ratio analysis of financial statements
Senior Management 42 4.12 .861
.218 Operations Management 17 4.06 .827
Support Services 37 3.81 .701
Understanding principles of pricing
Senior Management 42 4.33 .687
.068 Operations Management 17 4.24 .562
Support Services 36 3.94 .860
Analyzing costs within an organization
Senior Management 42 4.60 .544
.113 Operations Management 17 4.24 .664
Support Services 37 4.43 .647
Conducting breakeven analysis Senior Management 42 4.36 .727
.165 Operations Management 17 4.06 .659
Support Services 37 4.05 .848
Knowing revenue and expense categories
Senior Management 41 4.41 .774
.405 Operations Management 17 4.12 .697
Support Services 36 4.31 .786
Using quantitative approaches when problem solving
Senior Management 42 4.26 .701
.150 Operations Management 17 3.88 .781
Support Services 37 4.08 .640
Building operating budgets Senior Management 42 4.55 .705
.939 Operations Management 17 4.59 .507
Support Services 37 4.59 .551
Constructing capital budgets Senior Management 42 4.07 .894
.700 Operations Management 17 4.18 .529
Support Services 37 3.97 .897
Note. *Sig. at .05
20
Table 7
Comparison of Accounting Practices Mean Responses Based on Position in the Industry
Accounting Practice Content Position in Industry N Mean
Std.
Deviation One-way ANOVA Sig.
Understanding the major classifications of accounts
Senior Management 42 4.21 .782
.333 Operations Management 17 3.88 .781
Support Services 36 4.06 .826
Using debits and credits to analyze business transactions
Senior Management 42 3.81 .862
.253 Operations Management 17 3.88 .928
Support Services 35 4.11 .676
Computing cost of sales in relation to inventory methods
Senior Management 42 4.29 .742
.604 Operations Management 17 4.12 .697
Support Services 36 4.14 .762
Posting, journalizing, adjusting, and closing entry processes
Senior Management 42 3.71 .995
.926 Operations Management 17 3.76 .903
Support Services 36 3.67 .676
Establishing cash and internal controls
Senior Management 42 4.48 .671
.207 Operations Management 17 4.18 .883
Support Services 36 4.22 .722
Completing the steps of the accounting cycle
Senior Management 42 4.00 .796
.148 Operations Management 17 3.65 .786
Support Services 36 3.69 .786
Accounting for varying depreciation methods
Senior Management 41 3.51 1.028
.305 Operations Management 17 3.65 .786
Support Services 36 3.28 .741
Accounting for receivables and payables*
Senior Management 42 4.19 .833
.034 Operations Management 17 4.00 .612
Support Services 36 3.75 .649
Note. *Sig. at .05
A review of the results indicated only one significant difference between the three groups
and each content areas perceived importance to hospitality graduates’ long-term success in the
industry occurred. A significant difference was found among the accounting for receivables and
payables mean responses (F(2;92) = 3.517, p .034). Tukey’s HSD was then used to determine
the nature of the differences between the industry position held and the accounting for
receivables and payables means. This analysis revealed that those in senior management
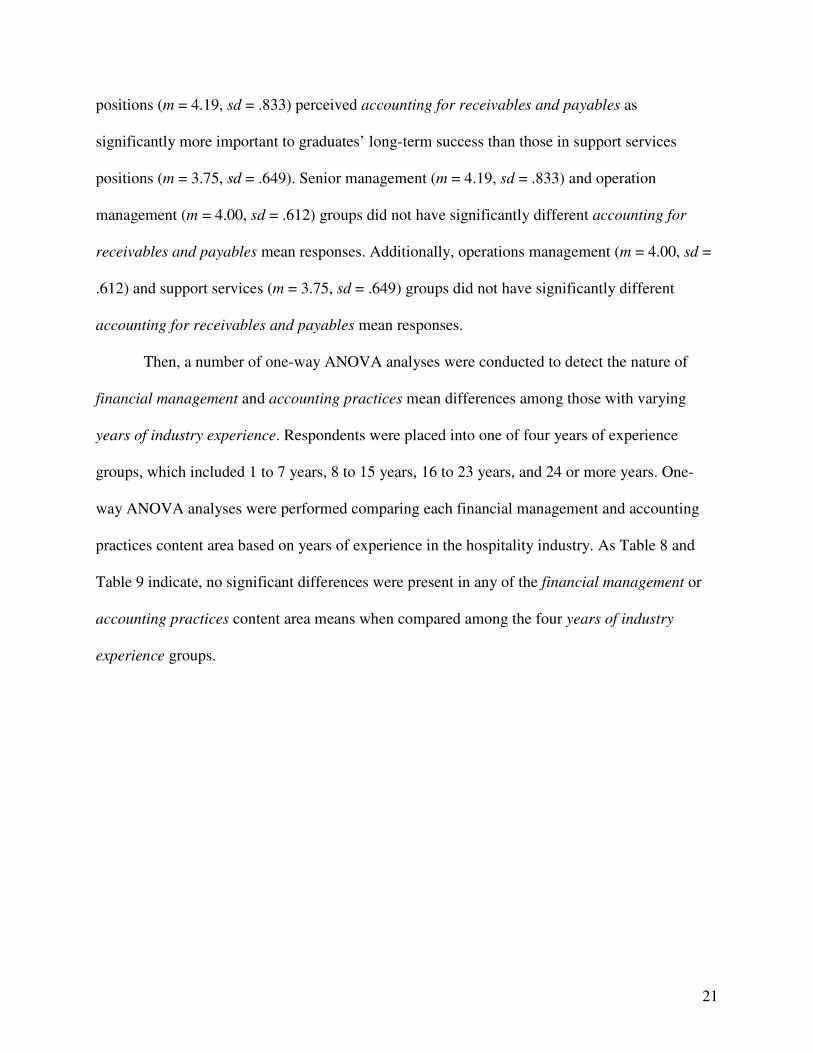
21
positions (m = 4.19, sd = .833) perceived accounting for receivables and payables as
significantly more important to graduates’ long-term success than those in support services
positions (m = 3.75, sd = .649). Senior management (m = 4.19, sd = .833) and operation
management (m = 4.00, sd = .612) groups did not have significantly different accounting for
receivables and payables mean responses. Additionally, operations management (m = 4.00, sd =
.612) and support services (m = 3.75, sd = .649) groups did not have significantly different
accounting for receivables and payables mean responses.
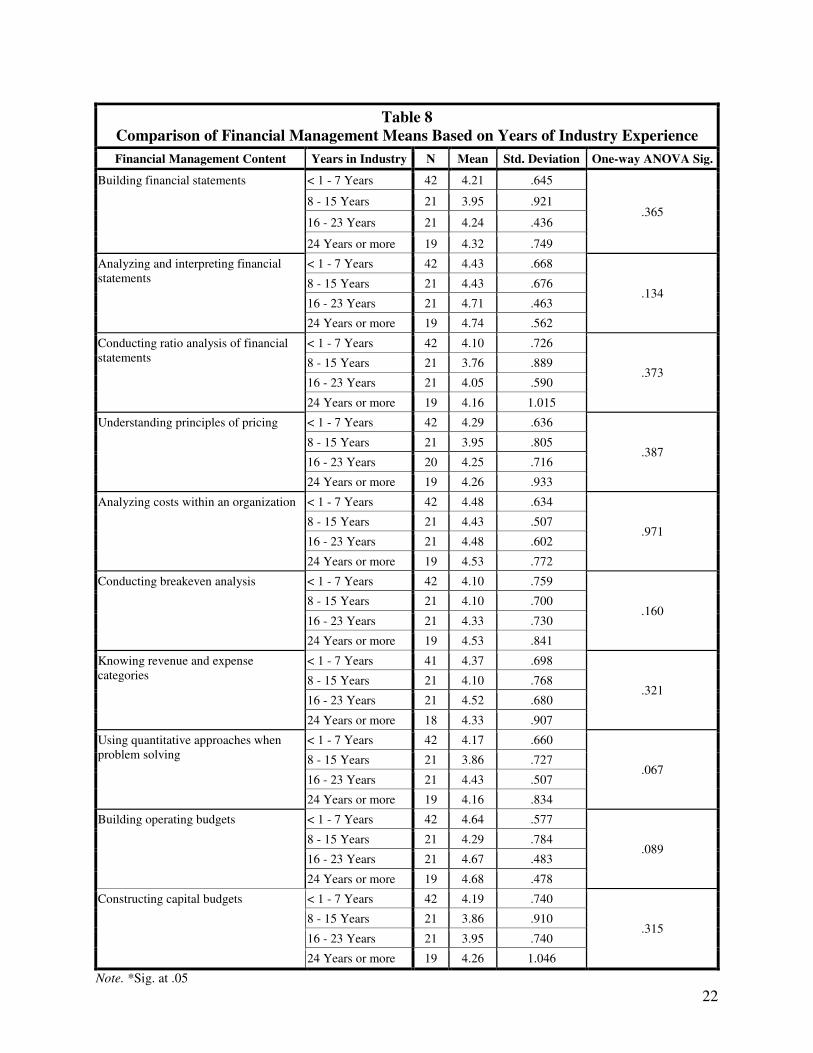
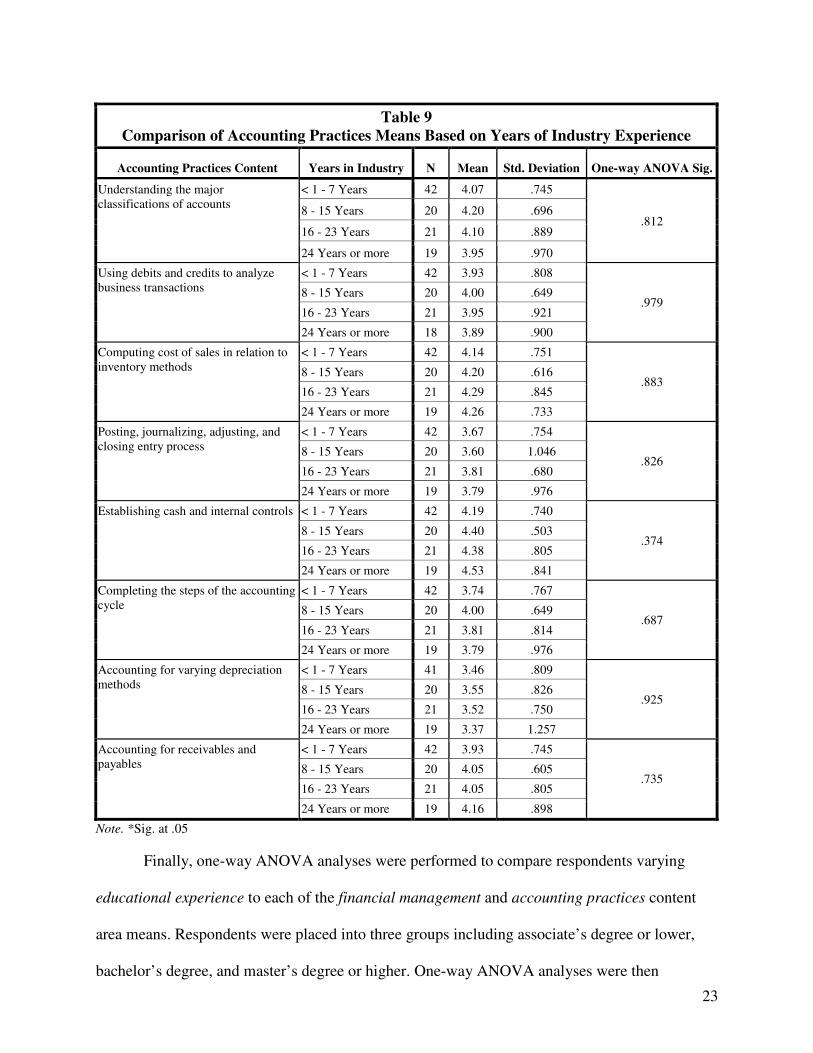
Then, a number of one-way ANOVA analyses were conducted to detect the nature of
financial management and accounting practices mean differences among those with varying
years of industry experience. Respondents were placed into one of four years of experience
groups, which included 1 to 7 years, 8 to 15 years, 16 to 23 years, and 24 or more years. One-
way ANOVA analyses were performed comparing each financial management and accounting
practices content area based on years of experience in the hospitality industry. As Table 8 and
Table 9 indicate, no significant differences were present in any of the financial management or
accounting practices content area means when compared among the four years of industry
experience groups.
22
Table 8
Comparison of Financial Management Means Based on Years of Industry Experience
Financial Management Content Years in Industry N Mean Std. Deviation One-way ANOVA Sig.
Building financial statements < 1 - 7 Years 42 4.21 .645
.365 8 - 15 Years 21 3.95 .921
16 - 23 Years 21 4.24 .436
24 Years or more 19 4.32 .749
Analyzing and interpreting financial statements
< 1 - 7 Years 42 4.43 .668
.134 8 - 15 Years 21 4.43 .676
16 - 23 Years 21 4.71 .463
24 Years or more 19 4.74 .562
Conducting ratio analysis of financial statements
< 1 - 7 Years 42 4.10 .726
.373 8 - 15 Years 21 3.76 .889
16 - 23 Years 21 4.05 .590
24 Years or more 19 4.16 1.015
Understanding principles of pricing < 1 - 7 Years 42 4.29 .636
.387 8 - 15 Years 21 3.95 .805
16 - 23 Years 20 4.25 .716
24 Years or more 19 4.26 .933
Analyzing costs within an organization < 1 - 7 Years 42 4.48 .634
.971 8 - 15 Years 21 4.43 .507
16 - 23 Years 21 4.48 .602
24 Years or more 19 4.53 .772
Conducting breakeven analysis < 1 - 7 Years 42 4.10 .759
.160 8 - 15 Years 21 4.10 .700
16 - 23 Years 21 4.33 .730
24 Years or more 19 4.53 .841
Knowing revenue and expense categories
< 1 - 7 Years 41 4.37 .698
.321 8 - 15 Years 21 4.10 .768
16 - 23 Years 21 4.52 .680
24 Years or more 18 4.33 .907
Using quantitative approaches when problem solving
< 1 - 7 Years 42 4.17 .660
.067 8 - 15 Years 21 3.86 .727
16 - 23 Years 21 4.43 .507
24 Years or more 19 4.16 .834
Building operating budgets < 1 - 7 Years 42 4.64 .577
.089 8 - 15 Years 21 4.29 .784
16 - 23 Years 21 4.67 .483
24 Years or more 19 4.68 .478
Constructing capital budgets < 1 - 7 Years 42 4.19 .740
.315 8 - 15 Years 21 3.86 .910
16 - 23 Years 21 3.95 .740
24 Years or more 19 4.26 1.046
Note. *Sig. at .05
23
Table 9
Comparison of Accounting Practices Means Based on Years of Industry Experience
Accounting Practices Content Years in Industry N Mean Std. Deviation One-way ANOVA Sig.
Understanding the major classifications of accounts
< 1 - 7 Years 42 4.07 .745
.812 8 - 15 Years 20 4.20 .696
16 - 23 Years 21 4.10 .889
24 Years or more 19 3.95 .970
Using debits and credits to analyze business transactions
< 1 - 7 Years 42 3.93 .808
.979 8 - 15 Years 20 4.00 .649
16 - 23 Years 21 3.95 .921
24 Years or more 18 3.89 .900
Computing cost of sales in relation to inventory methods
< 1 - 7 Years 42 4.14 .751
.883 8 - 15 Years 20 4.20 .616
16 - 23 Years 21 4.29 .845
24 Years or more 19 4.26 .733
Posting, journalizing, adjusting, and closing entry process
< 1 - 7 Years 42 3.67 .754
.826 8 - 15 Years 20 3.60 1.046
16 - 23 Years 21 3.81 .680
24 Years or more 19 3.79 .976
Establishing cash and internal controls < 1 - 7 Years 42 4.19 .740
.374 8 - 15 Years 20 4.40 .503
16 - 23 Years 21 4.38 .805
24 Years or more 19 4.53 .841
Completing the steps of the accounting cycle
< 1 - 7 Years 42 3.74 .767
.687 8 - 15 Years 20 4.00 .649
16 - 23 Years 21 3.81 .814
24 Years or more 19 3.79 .976
Accounting for varying depreciation methods
< 1 - 7 Years 41 3.46 .809
.925 8 - 15 Years 20 3.55 .826
16 - 23 Years 21 3.52 .750
24 Years or more 19 3.37 1.257
Accounting for receivables and payables
< 1 - 7 Years 42 3.93 .745
.735 8 - 15 Years 20 4.05 .605
16 - 23 Years 21 4.05 .805
24 Years or more 19 4.16 .898
Note. *Sig. at .05
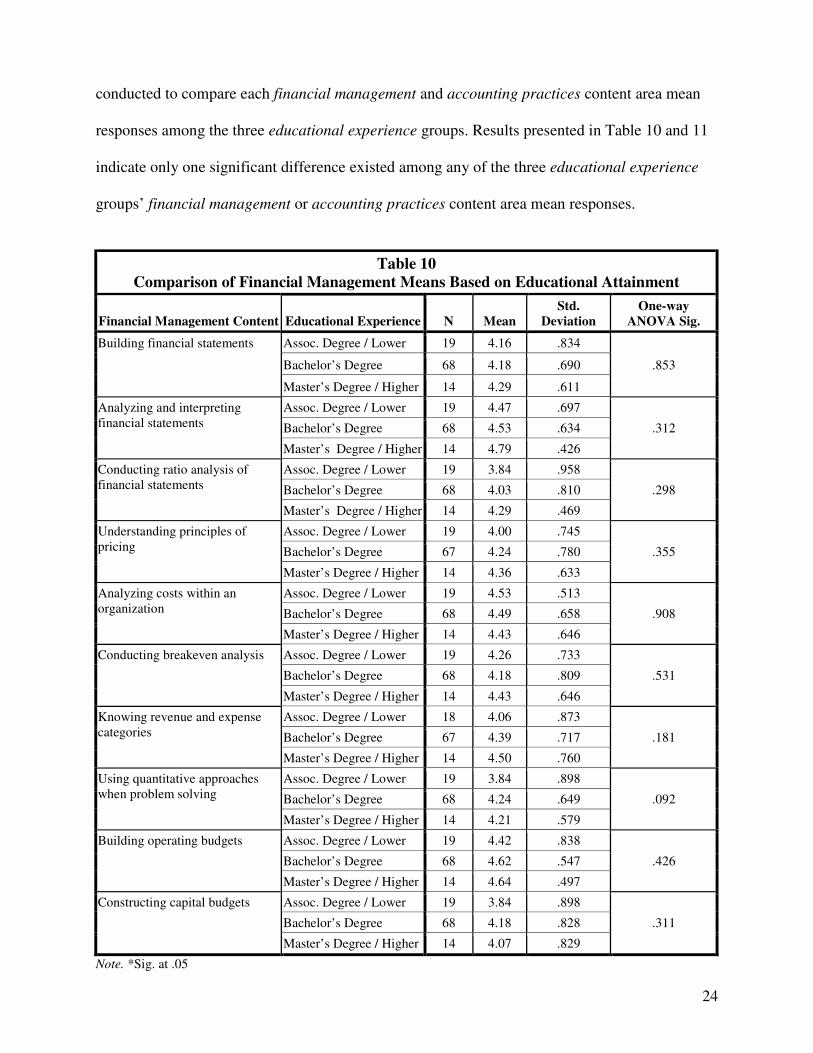
Finally, one-way ANOVA analyses were performed to compare respondents varying
educational experience to each of the financial management and accounting practices content
area means. Respondents were placed into three groups including associate’s degree or lower,
bachelor’s degree, and master’s degree or higher. One-way ANOVA analyses were then
24
conducted to compare each financial management and accounting practices content area mean
responses among the three educational experience groups. Results presented in Table 10 and 11
indicate only one significant difference existed among any of the three educational experience
groups’ financial management or accounting practices content area mean responses.
Table 10
Comparison of Financial Management Means Based on Educational Attainment
Financial Management Content Educational Experience N Mean
Std.
Deviation
One-way
ANOVA Sig.
Building financial statements Assoc. Degree / Lower 19 4.16 .834
.853 Bachelor’s Degree 68 4.18 .690
Master’s Degree / Higher 14 4.29 .611
Analyzing and interpreting financial statements
Assoc. Degree / Lower 19 4.47 .697
.312 Bachelor’s Degree 68 4.53 .634
Master’s Degree / Higher 14 4.79 .426
Conducting ratio analysis of financial statements
Assoc. Degree / Lower 19 3.84 .958
.298 Bachelor’s Degree 68 4.03 .810
Master’s Degree / Higher 14 4.29 .469
Understanding principles of pricing
Assoc. Degree / Lower 19 4.00 .745
.355 Bachelor’s Degree 67 4.24 .780
Master’s Degree / Higher 14 4.36 .633
Analyzing costs within an organization
Assoc. Degree / Lower 19 4.53 .513
.908 Bachelor’s Degree 68 4.49 .658
Master’s Degree / Higher 14 4.43 .646
Conducting breakeven analysis Assoc. Degree / Lower 19 4.26 .733
.531 Bachelor’s Degree 68 4.18 .809
Master’s Degree / Higher 14 4.43 .646
Knowing revenue and expense categories
Assoc. Degree / Lower 18 4.06 .873
.181 Bachelor’s Degree 67 4.39 .717
Master’s Degree / Higher 14 4.50 .760
Using quantitative approaches when problem solving
Assoc. Degree / Lower 19 3.84 .898
.092 Bachelor’s Degree 68 4.24 .649
Master’s Degree / Higher 14 4.21 .579
Building operating budgets Assoc. Degree / Lower 19 4.42 .838
.426 Bachelor’s Degree 68 4.62 .547
Master’s Degree / Higher 14 4.64 .497
Constructing capital budgets Assoc. Degree / Lower 19 3.84 .898
.311 Bachelor’s Degree 68 4.18 .828
Master’s Degree / Higher 14 4.07 .829
Note. *Sig. at .05
25
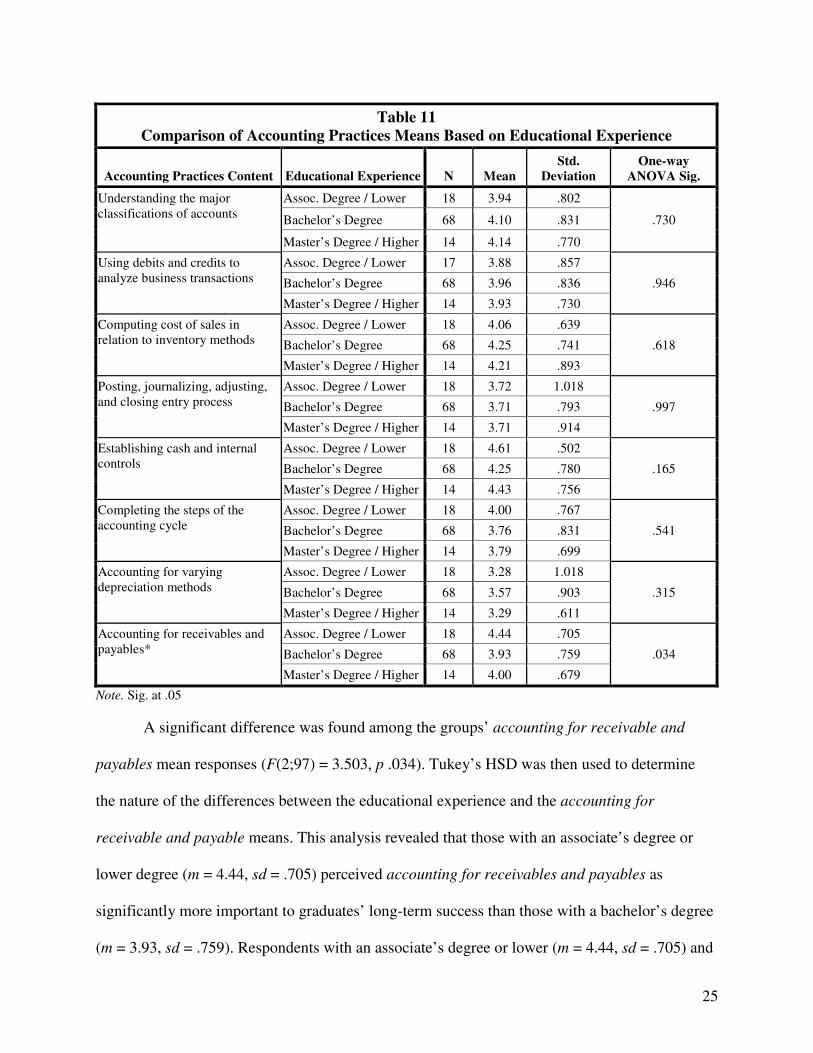
Table 11
Comparison of Accounting Practices Means Based on Educational Experience
Accounting Practices Content Educational Experience N Mean
Std.
Deviation
One-way
ANOVA Sig.
Understanding the major classifications of accounts
Assoc. Degree / Lower 18 3.94 .802
.730 Bachelor’s Degree 68 4.10 .831
Master’s Degree / Higher 14 4.14 .770
Using debits and credits to analyze business transactions
Assoc. Degree / Lower 17 3.88 .857
.946 Bachelor’s Degree 68 3.96 .836
Master’s Degree / Higher 14 3.93 .730
Computing cost of sales in relation to inventory methods
Assoc. Degree / Lower 18 4.06 .639
.618 Bachelor’s Degree 68 4.25 .741
Master’s Degree / Higher 14 4.21 .893
Posting, journalizing, adjusting, and closing entry process
Assoc. Degree / Lower 18 3.72 1.018
.997 Bachelor’s Degree 68 3.71 .793
Master’s Degree / Higher 14 3.71 .914
Establishing cash and internal controls
Assoc. Degree / Lower 18 4.61 .502
.165 Bachelor’s Degree 68 4.25 .780
Master’s Degree / Higher 14 4.43 .756
Completing the steps of the accounting cycle
Assoc. Degree / Lower 18 4.00 .767
.541 Bachelor’s Degree 68 3.76 .831
Master’s Degree / Higher 14 3.79 .699
Accounting for varying depreciation methods
Assoc. Degree / Lower 18 3.28 1.018
.315 Bachelor’s Degree 68 3.57 .903
Master’s Degree / Higher 14 3.29 .611
Accounting for receivables and payables*
Assoc. Degree / Lower 18 4.44 .705
.034 Bachelor’s Degree 68 3.93 .759
Master’s Degree / Higher 14 4.00 .679
Note. Sig. at .05
A significant difference was found among the groups’ accounting for receivable and
payables mean responses (F(2;97) = 3.503, p .034). Tukey’s HSD was then used to determine
the nature of the differences between the educational experience and the accounting for
receivable and payable means. This analysis revealed that those with an associate’s degree or
lower degree (m = 4.44, sd = .705) perceived accounting for receivables and payables as
significantly more important to graduates’ long-term success than those with a bachelor’s degree
(m = 3.93, sd = .759). Respondents with an associate’s degree or lower (m = 4.44, sd = .705) and
26
a master’s degree or higher (m = 4.00, sd = .679) did not have significantly different mean
results. Additionally, those with a bachelor’s degree (m = 3.93, sd = .759) and a master’s degree
or higher (m = 4.00, sd = .679) did not have significantly different perceptions of the importance
of accounting for receivables and payables to graduates’ long-term success in the industry.
Discussion, Limitations and Recommendations
At the outset, it is important to note the limitations of this effort in order to put the
discussion in context. In many respects, this study is preliminary. While others have probed the
perceived importance of various hospitality curricular content areas there has been no research
on how hospitality industry professionals view the importance of the various components of the
finance and accounting curriculum. Thus, a systematic approach to defining those areas had to be
developed to delineate them. While this categorization was carefully planned and constructed, in
many respects a more rigorous attempt at validation should be undertaken. However, all of the
competencies described are taught in many, if not most, courses related to hospitality finance and
accounting. As well, opened ended questions in the survey that requested comments on
omissions and additions to content, resulted in no noteworthy observations.
On another note, while a sample size of 100 might be optimal for questions to the entire
cohort, it may have been too small to produce significant differences of perception when
analyzing subsets of the sample cohort. Additionally, without further research, it is difficult to
establish any comparative position on the perception of the importance of finance and accounting
data with respect to other areas of the body of knowledge. Finally, the compression of
demographic data into subsets most likely compromised some homogeneity and this may have
impacted the usefulness of these subsets in detecting significance differences.
Nevertheless, this inquiry does lend support to the notion that industry professionals and
practitioners as a group believe that finance and accounting knowledge is important to the
success of hospitality graduates. When analyzing the data from the point of view of the entire
27
cohort, it appears that not only are finance and accounting skills perceived as essential and
necessary, but there is also a clear preference for financial skills over accounting skills. Although
this is speculation, it also appears that the ranking of various content areas increases with their
relevance to operations. For example, in the finance area, constructing capital budgets and
conducting ratio analysis of financial statements are perceived as important, but visual
inspection of the data indicates that they are viewed as less important than those components
more closely aligned with operations such as building operating budgets, analyzing and
interpreting financial statements, or analyzing costs within an organization. In the accounting
section, this demarcation is even more pronounced. Knowledge associated more closely with the
duties of operating managers such as establishing cash and internal controls is viewed as being
much more essential to graduates success than skills related to the work of accounting such as
accounting for varying depreciation methods.
Although the analysis of subsets, with respect to the various components, produced few
significant results, the results do seem to suggest that differences of opinion do exist among the
subsets. This is particularly true, in the segment, position, and educational attainment groups and
should be the subject of further research that relies on larger and more homogenous subgroups.
The results of further study in this area would be invaluable in constructing future curricula in
these areas as the need for accounting and finance knowledge most likely increases as graduates
advance in their careers.
In addition to the above suggestion for further research, the perception of finance and
accounting skills necessary in comparison to other content areas in the body of knowledge
should be investigated to determine a rank ordering, if it exists, of the relative importance of
knowledge areas that contribute to the success of hospitality graduates. And, further inquiry into
validating the constructs that comprise the field of study in finance and accounting should be
undertaken to determine if these concepts do capture, at least, the essential elements of these
28
fields. It would also be interesting to investigate how hospitality finance and accounting
professionals perceive the importance of the content areas considered in this study to the long-
term success of hospitality graduates.
To summarize, this investigation strongly suggests that practitioners, view accounting
and finance knowledge as critical to the success of hospitality graduates. This is consistent with
the increasing awareness of both researchers and curricular planners that these content areas are
essential in building a curriculum for an increasingly sophisticated and business oriented
hospitality industry. Finance skills were valued over accounting skills but not overwhelming so.
It appears that in both the case of finance and accounting, greater importance was attached to
those skills attached directly to managing the business. Finally, although few significant
differences were found with respect to various subgroups, the investigation strongly indicates
that differences exists and that further investigation is needed to uncover the significance of these
differences.
References
Accreditation Commission for Programs in Hospitality Administration. (2008, July 14). ACPHA
Documents. Retrieved September 8, 2011, from ACPHA: http://www.acpha-
cahm.org/forms.cfm
American Hotel and Lodging Association. (2011). Lodging Industry Profile. Retrieved October
2, 2011, from AHLA Web site: http://www.ahla.com/content.aspx?id=30505
Assante, L. M., Huffman, L., & Harp, S. S. (2007). Conceptualization of quality indicators for
U.S. based four-year undergraduate hospitality management programs. Journal of
Teaching in Travel & Tourism, 7(2), 51-71.
Assante, L. M., Huffman, L., & Harp, S. S. (2010). A taxonomy of academic quality indicators
for U.S.-based 4-year undergraduate hospitality management programs. Journal of
Hospitality & Tourism Research, 34(2), 164-184.
29
Cavanaugh, S. (1994, July 18). Hospitality leaders mull assets students need for job market.
Nation's Restaurant News, 28(28), p. 46.
Chung, K. Y. (2000). Hotel management curriculum reform based on required competencies of
hotel employees and career success in the hotel industry. Tourism Management, 21(5),
473-487.
Chung-Herrera, B. G., Enz, C. A., & Lankau, M. J. (2003). A competencies model: Grooming
future hospitality leaders. Cornell Hotel and Restaurant Administration Quarterly, 44(3),
17-25.
Creswell, J. W. (2003). Research design: Qualitative, quantitative, and mixed methods
approaches (2nd ed.). Thousand Oaks: Sage.
Dopson, L. R., & Tas, R. F. (2004). A practical approach to curriculum development: A case
study. Journal of Hospitality & Tourism Education, 16(1), 39-46.
Dopson, L., & Nelson, A. A. (2003). Future of hotel education: Required program content areas
for graduates of U.S. hospitality programs beyond the year 2000 - part two. Journal of
Hospitality & Toursim Education, 15(2), 11-17.
Enz, C. A. (2004). Issues of concern for restaurant owners and manangers. Cornell Hotel and
Restaurant Administration Quarterly, 45(4), 315-332.
Field, A. (2009). Discovering statistics using SPSS: and sex and drugs and rock 'n' roll. (3rd,
Ed.) Thousand Oaks: Sage.
Fink, A. (2006). How to conduct surveys: A step-by-step guide. Thousand Oaks: Sage.
Fraenkel, J. R., & Wallen, N. E. (2006). How to design and evaluate research in education. (6th,
Ed.) Boston: McGraw Hill.
Freed, J. Q. (2010, February). Industry needs flexible graduates. Hotel & Motel Management,
225(2), p. 1 .
30
Gursoy, D., & Swanger, N. (2004). An industry driven model of hospitality curriculum for
programs housed in accredited colleges of business, part I. Journal of Hospitality &
Tourism Education, 16(4), 13-20.
Gursoy, D., & Swanger, N. (2005). An industry driven model of hospitality curriculum for
programs housed in accredited colleges of business, part II. Journal of Hospitality &
Tourism Education, 17(2), 46-56.
Hein, S. G., & Riegel, C. D. (2011). A systematic model for program evaluation and curricular
transformation: A tale from the trenches. Annual ICHRIE Summer Conference. Denver:
ICHRIE.
Johnson, R. B., & Onwuegbuzie, A. J. (2004). Mixed methods research: A research paradigm
whose time has come. Educational Researcher, 33(7), 14-26.
Kay, C., & Moncarz, E. (2004). Knowledge, Skills, and Abilities for Lodging Management.
Cornell Hotel and Restaurant Administration Quarterly, 45(3), 285-298.
Kay, C., & Moncarz, E. (2007). Lodging management success: Personal antecedents,
achievements, KSAs and situational influencers. International Journal of Hospitality
Management, 26(1), 33-48.
Kay, C., & Russette, J. (2000). Hospitality-management competencies: Identifying managers'
essential skills. 41(2), 52-63.
Milman, A. (2001). Hospitality and tourism curriculum development: A qualitative case-study
approach. Journal of Teaching in Travel & Tourism, 1(4), 65-76.
National Restaurant Association. (2011). Restaurant Industry Forecast: Facts at a Glance.
Retrieved October 2, 2011, from National Restaurant Association Web site:
http://restaurant.org/research/facts/
31
Nelson, A. A., & Dopson, L. (2001). Future of hotel education: Required skills and knowledge
for graduates of U.S. hospitality programs beyond the year 2000 - part one. Journal of
Hospitality & Tourism Education, 13(5), 58-67.
Patten, M. L. (2007). Understanding research methods: An overview of the essentials (6th ed.).
Glendale: Pyrczak.
Paulson, K. (2001). Using competencies to connect the workplace and postsecondary education.
New Directions for Institutional Research, 2001(110), 41-54.
Pavesic, D. V. (1993). Hospitality education 2005: Curricular and programmatic trends. Journal
of Hospitality & Tourism Research, 17(1), 285-294.
Perdue, J., Ninemeier, J., & Woods, R. (2000). Competencies required for club managers.
Cornell Hotel and Restaurant Administration Quarterly, 41(2), 70-85.
Rappole, C. (2000). Update of the chronological development, enrollment patterns, and
education models of four-year, master's, and doctoral hospitality programs in the United
States. Journal of Hospitality & Tourism Education, 12(3), 24-28.
Ravichandran, S., & Arendt, S. W. (2008). How to increase response rates when surveying
hospitality managers for curriculum-related research: Lessons from past studies and
interviews with lodging professionals. Journal of Teaching in Travel & Tourism, 8(1),
47-71.
Ricci, P. (2010). Do lodging managers expect more from hospitality graduates? A comparison of
job competency expectations. Journal of Human Resources in Hospitality & Tourism,
9(2), 218-232.
Riegel, C. D., & Dallas, M. (2006). Hospitality and Tourism: Careers in the World's Largest
Industry. In I. CHRIE, Guide to College Programs in Hospitality, Tourism, & Culinary
Arts (pp. 5-47). Richmond, VA: International CHRIE.
32
Rivera, M., DiPietro, R. B., Murphy, K. S., & Muller, C. C. (2008). Multi-unit managers:
Training needs and competencies for casual dining restaurants. International Journal of
Contemporary Hospitality Management, 20(6), 616-630.
Solnet, D. J., Kralj, A. L., Moncarz, E., & Kay, C. (2010). Formal education effectiveness and
relevance: Lodging managers perceptions. Journal of Hospitality & Tourism Education,
22(4), 15-24.
Solnet, D., Robinson, R., & Cooper, C. (2007). An industry partnerships approach to tourism
education. Journal of Hospitality, Leisure, Sport & Tourism Education, 6(1), 66-70.
Tsai, H., Chen, S., & Hu, C. (2004). Academia meet industry: A need analysis of course contents
in U.S. gaming education. Journal of Hospitality & Tourism Education, 16(4), 32-39.
William, D. A. (2005). Contemporary curriculum design in higher education. The Consortium
Journal, 9(2), 69-83.
Stephanie G. Hein, Ed.D., is an Assistant Professor and Carl Riegel, EdD, is a Professor in the Department of Hospitality and Restaurant Administration, Missouri State University – Springfield.