Embed Size (px)
DESCRIPTION
Hospital Systems. Impacts on Cost and Quality Walton Hancock. What Systems?. Inpatient Admissions Operating Room Nurse Staffing Nurse Daily Assignments Ancillary Staffing Outpatient Scheduling Transporters. Selection Rationale. There are approximately 5000 hospitals in the US. - PowerPoint PPT Presentation
Citation preview

Hospital Systems
Impacts on Cost and Quality
Walton Hancock
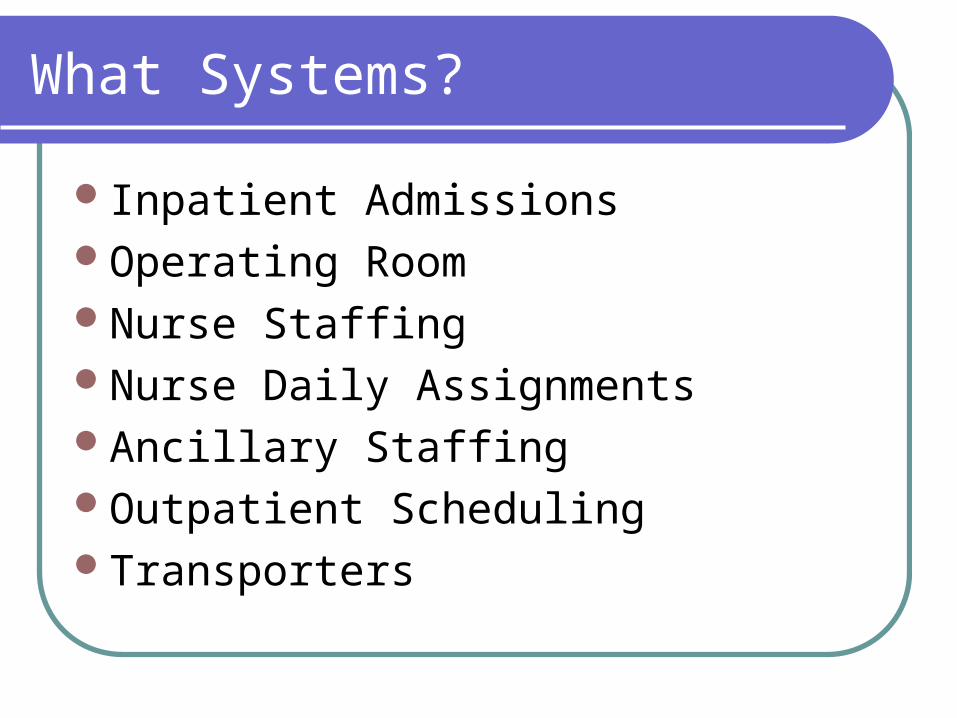
What Systems?
Inpatient AdmissionsOperating RoomNurse StaffingNurse Daily AssignmentsAncillary StaffingOutpatient SchedulingTransporters
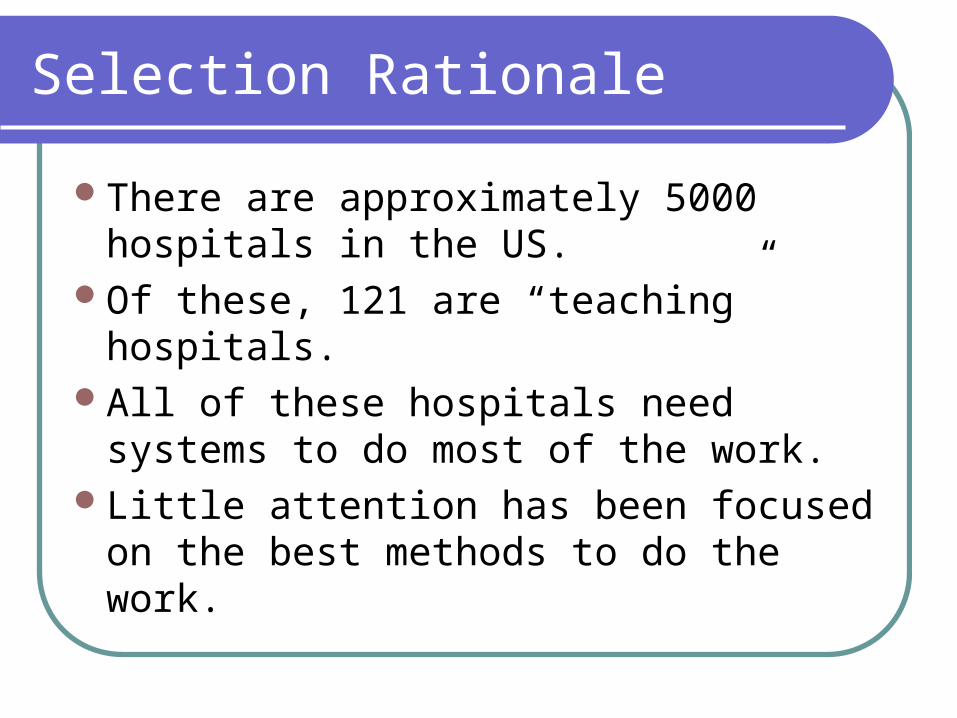
Selection Rationale
There are approximately 5000 hospitals in the US.
Of these, 121 are “teaching” hospitals.All of these hospitals need systems to do
most of the work.Little attention has been focused on the
best methods to do the work.
Selection Rationale Continued
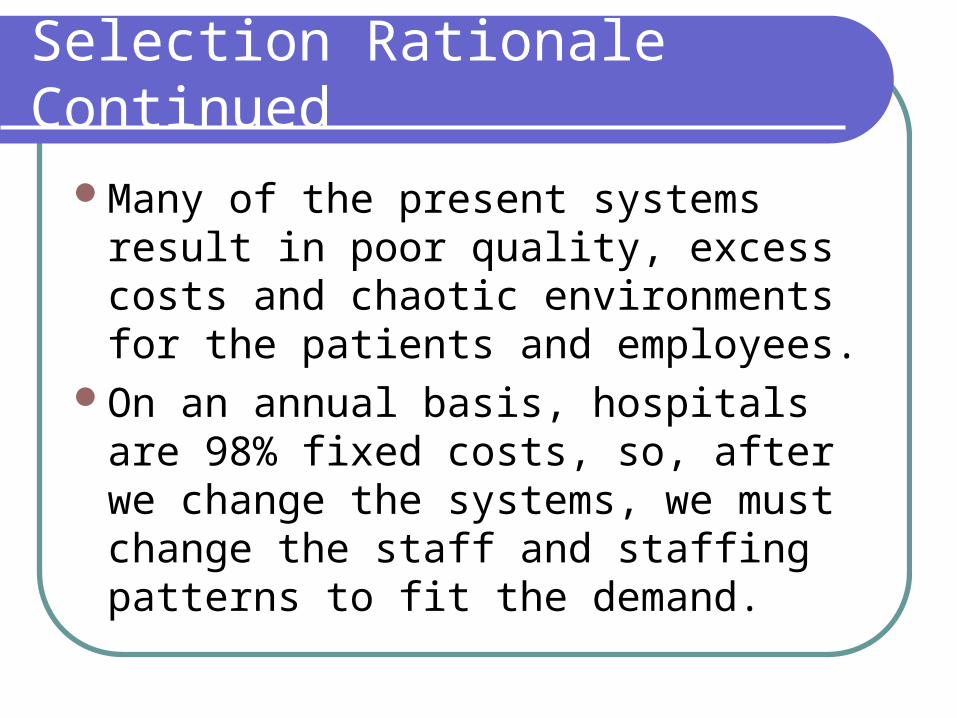
Many of the present systems result in poor quality, excess costs and chaotic environments for the patients and employees.
On an annual basis, hospitals are 98% fixed costs, so, after we change the systems, we must change the staff and staffing patterns to fit the demand.
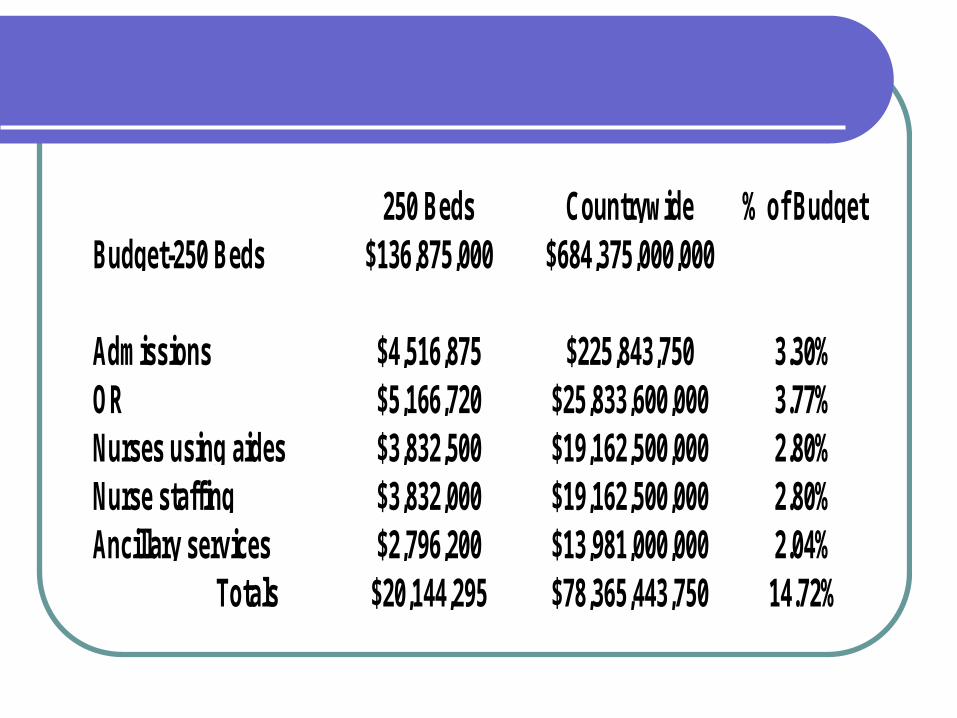
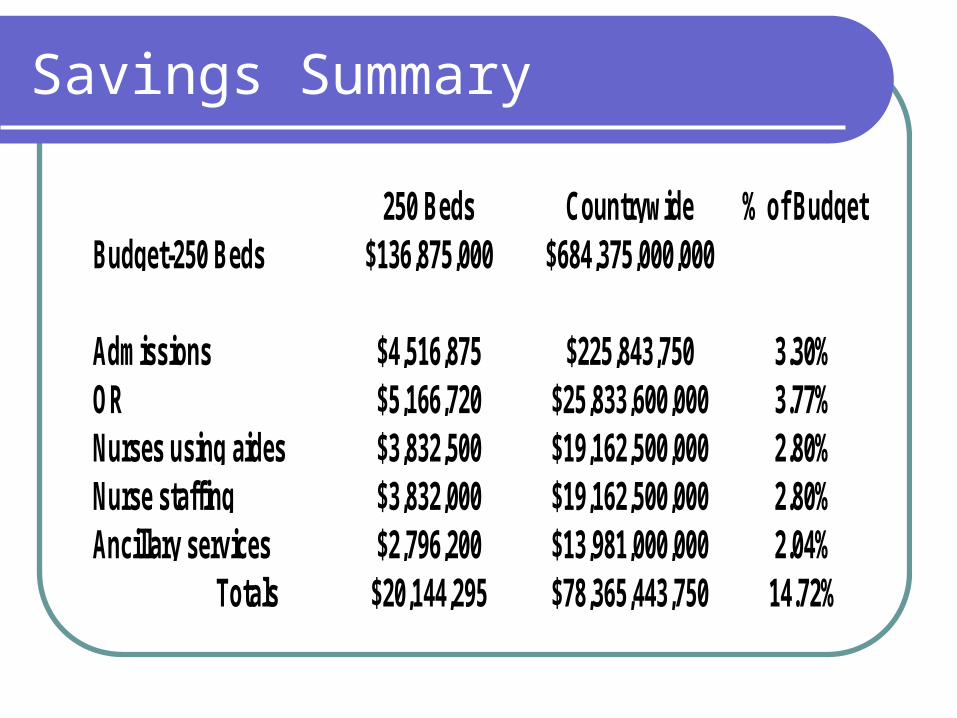
250 Beds Countrywide % of BudgetBudget-250 Beds $136,875,000 $684,375,000,000
Admissions $4,516,875 $225,843,750 3.30%OR $5,166,720 $25,833,600,000 3.77%Nurses using aides $3,832,500 $19,162,500,000 2.80%Nurse staffing $3,832,000 $19,162,500,000 2.80%Ancillary services $2,796,200 $13,981,000,000 2.04%
Totals $20,144,295 $78,365,443,750 14.72%
Selection Rationale Continued
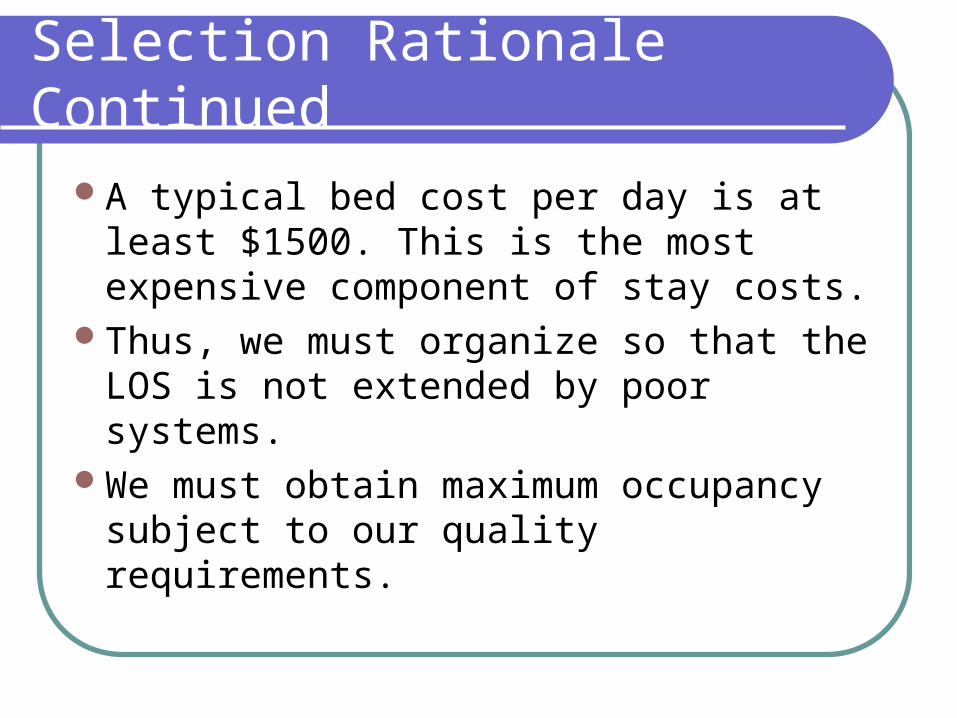
A typical bed cost per day is at least $1500. This is the most expensive component of stay costs.
Thus, we must organize so that the LOS is not extended by poor systems.
We must obtain maximum occupancy subject to our quality requirements.
Inpatient Admissions Systems
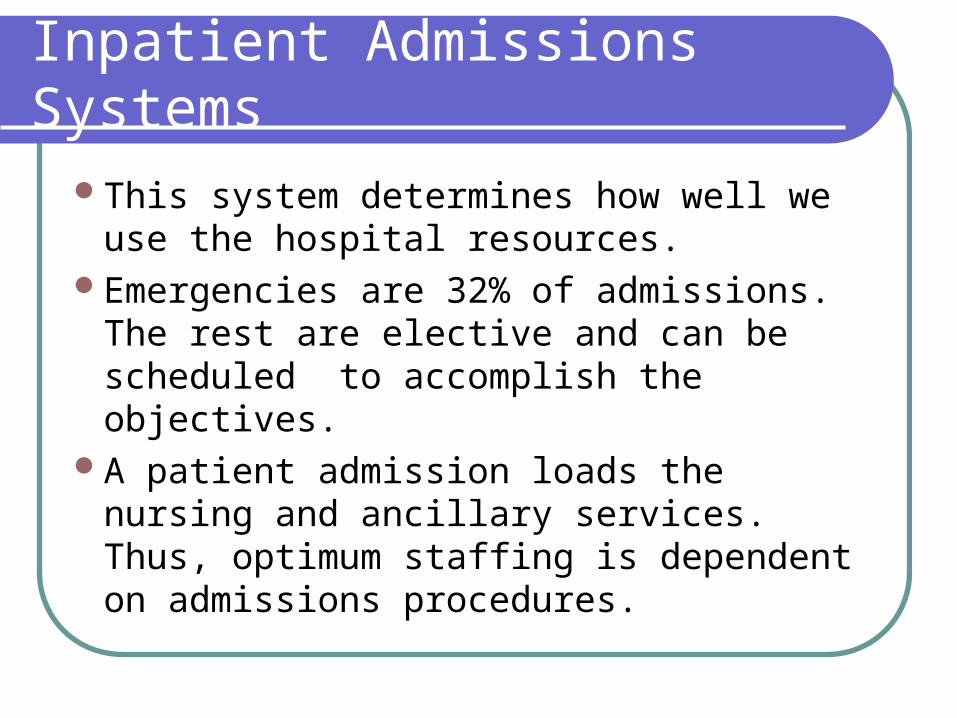
This system determines how well we use the hospital resources.
Emergencies are 32% of admissions. The rest are elective and can be scheduled to accomplish the objectives.
A patient admission loads the nursing and ancillary services. Thus, optimum staffing is dependent on admissions procedures.
Inpatient Admissions Systems
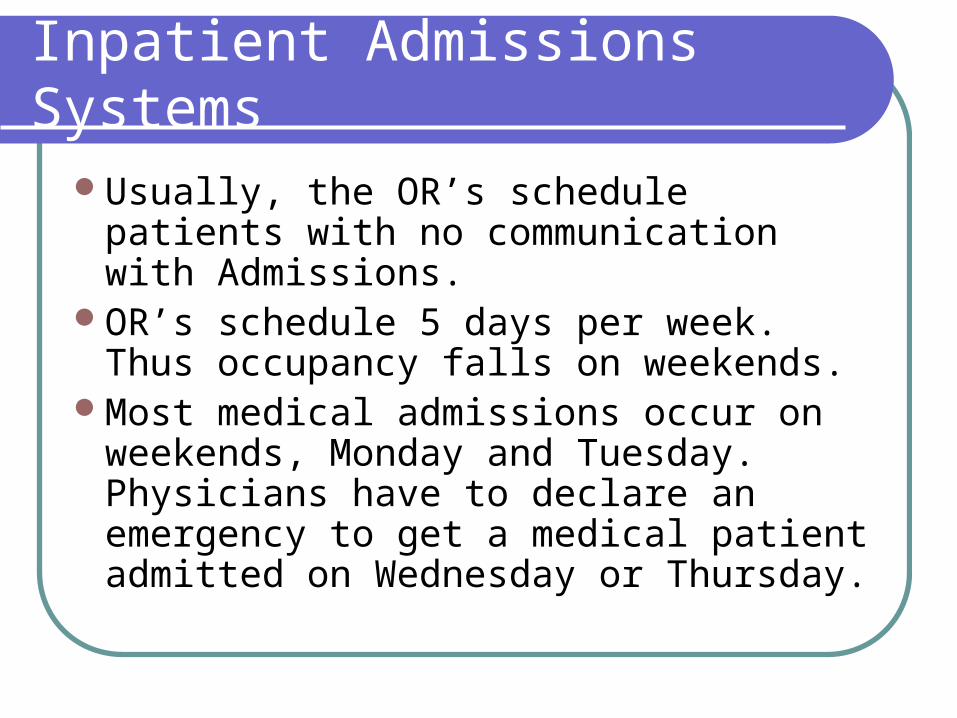
Usually, the OR’s schedule patients with no communication with Admissions.
OR’s schedule 5 days per week. Thus occupancy falls on weekends.
Most medical admissions occur on weekends, Monday and Tuesday. Physicians have to declare an emergency to get a medical patient admitted on Wednesday or Thursday.
Inpatient Admissions Systems
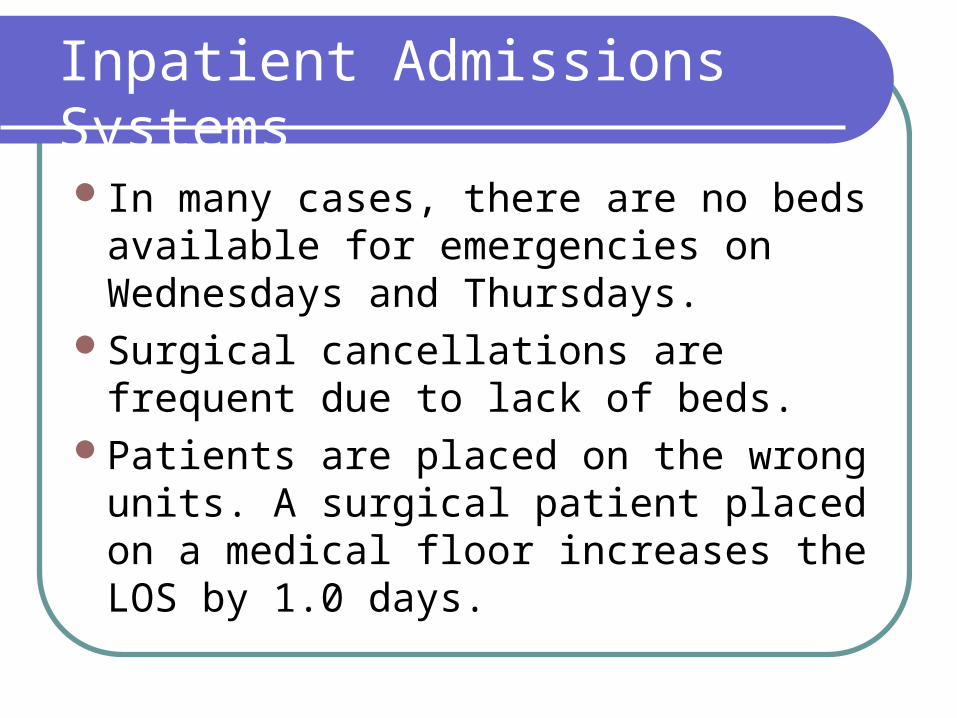
In many cases, there are no beds available for emergencies on Wednesdays and Thursdays.
Surgical cancellations are frequent due to lack of beds.
Patients are placed on the wrong units. A surgical patient placed on a medical floor increases the LOS by 1.0 days.

Inpatient Admissions Systems
Ironically, the patients who receive the best care are those who are placed in the hall!
These problems cause the Admissions department to reduce average occupancy to cut down the tension.
Inpatient Admissions Systems
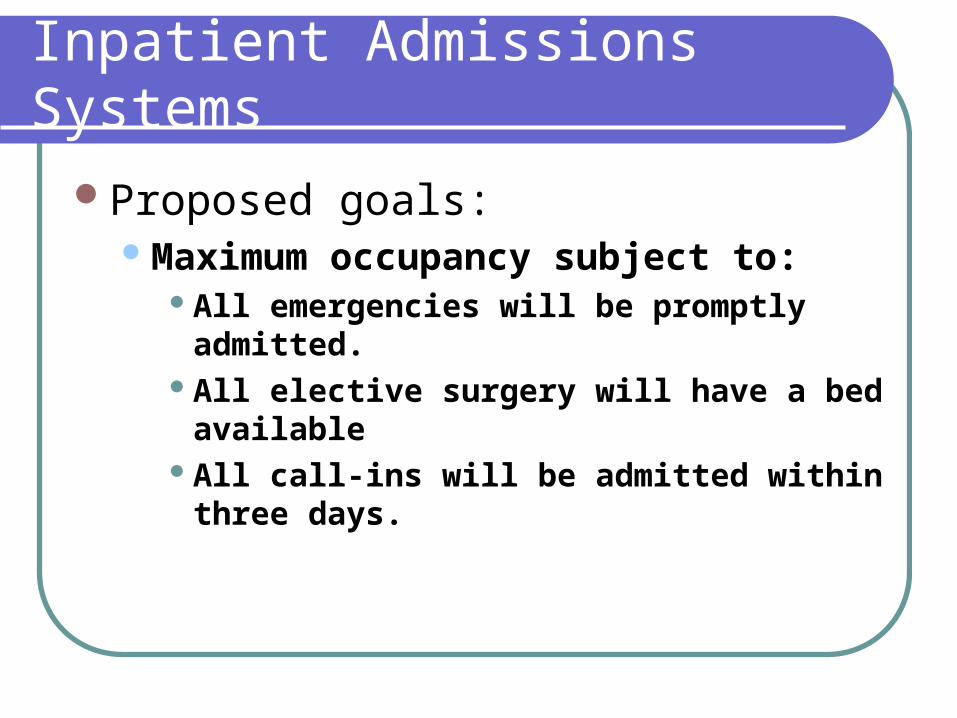
Proposed goals:Maximum occupancy subject to:
All emergencies will be promptly admitted.All elective surgery will have a bed availableAll call-ins will be admitted within three days.
Inpatient Admissions Systems
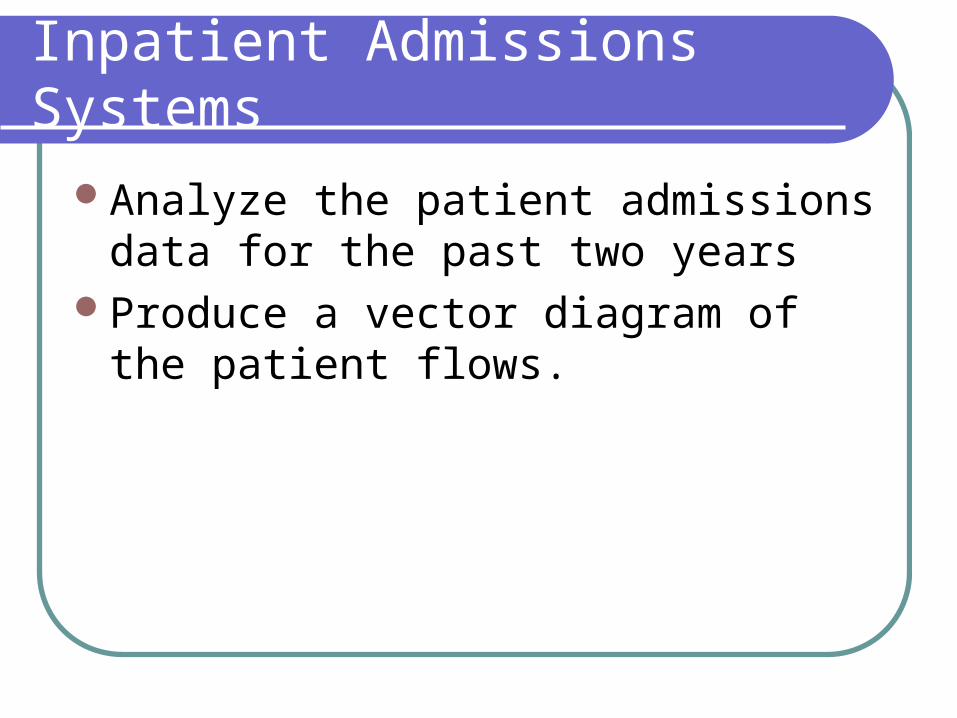
Analyze the patient admissions data for the past two years
Produce a vector diagram of the patient flows.
Inpatient Admissions Systems
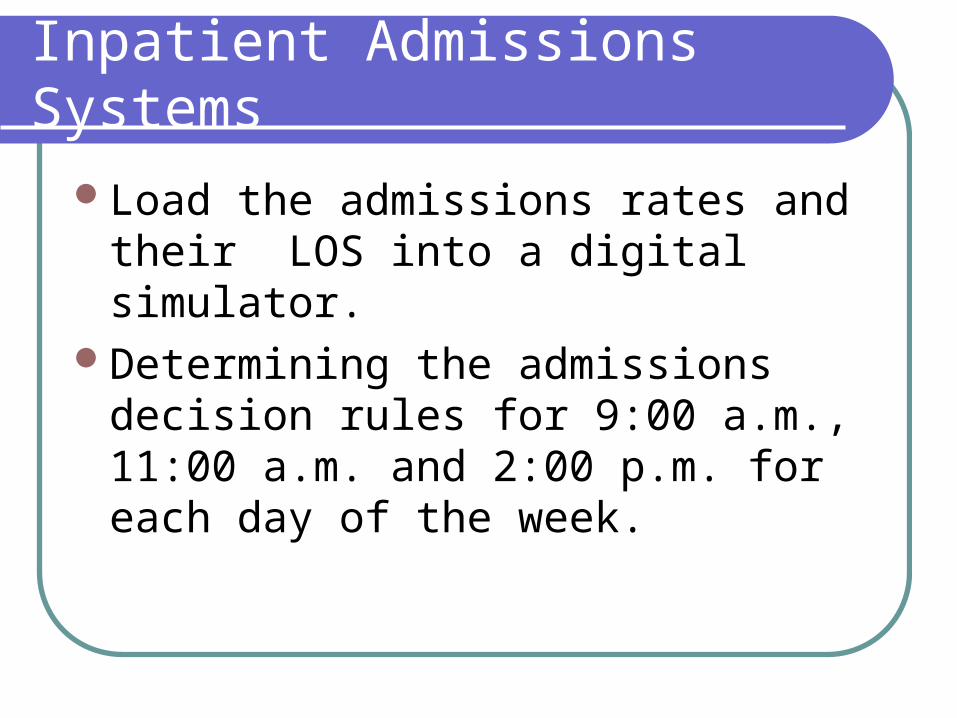
Load the admissions rates and their LOS into a digital simulator.
Determining the admissions decision rules for 9:00 a.m., 11:00 a.m. and 2:00 p.m. for each day of the week.

Patient Flow Diagram
Inpatient Admissions Systems
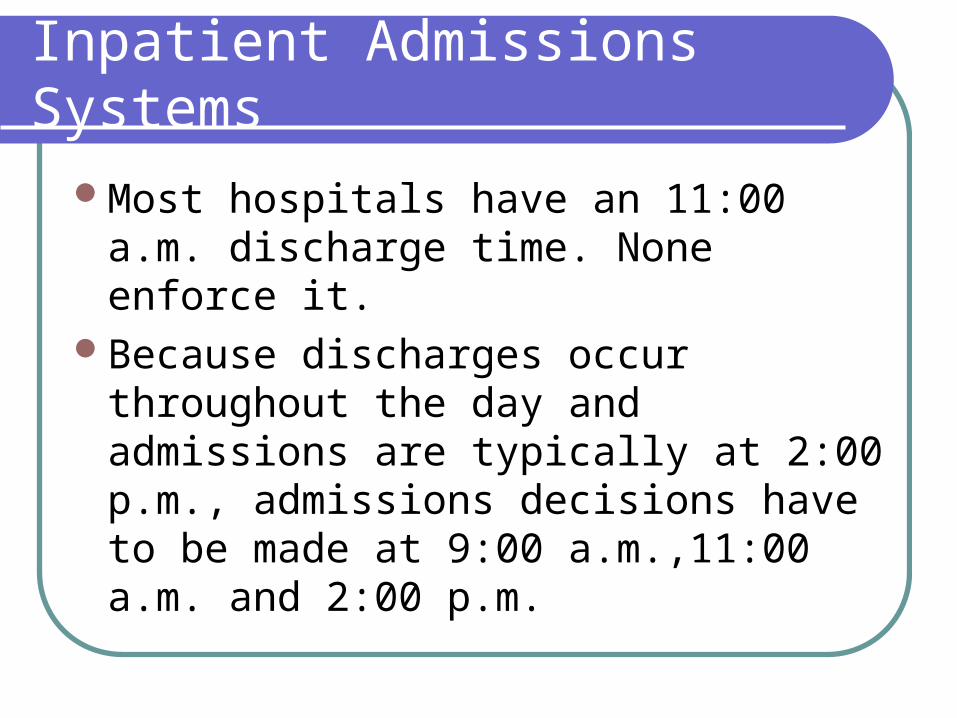
Most hospitals have an 11:00 a.m. discharge time. None enforce it.
Because discharges occur throughout the day and admissions are typically at 2:00 p.m., admissions decisions have to be made at 9:00 a.m.,11:00 a.m. and 2:00 p.m.
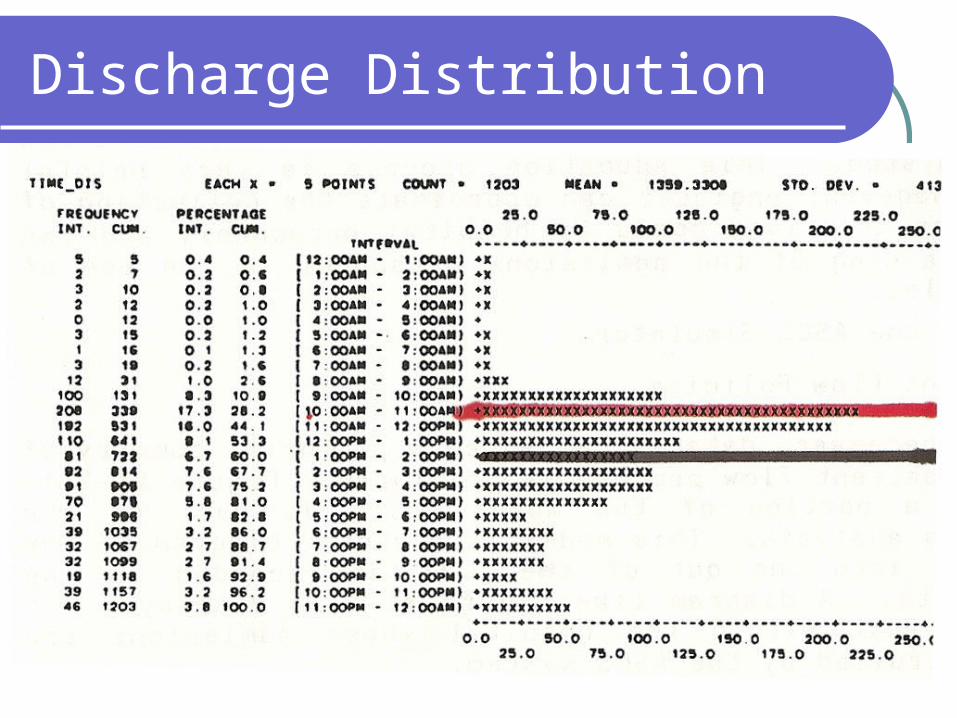
Discharge Distribution
Inpatient Admissions Systems
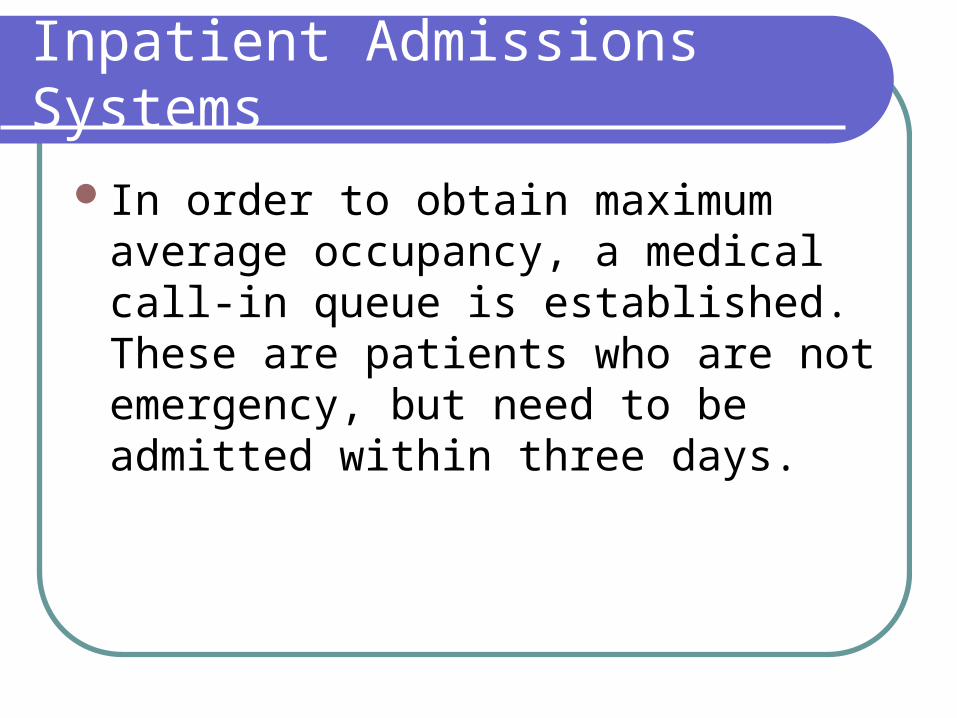
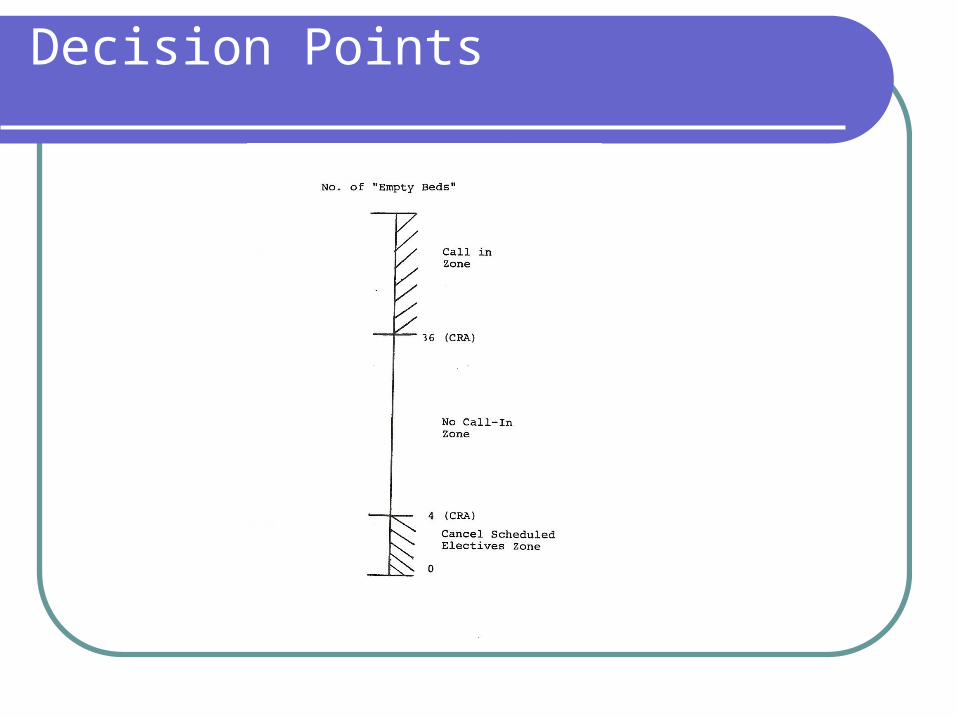
In order to obtain maximum average occupancy, a medical call-in queue is established. These are patients who are not emergency, but need to be admitted within three days.
Decision Points
Admissions Worksheet
Specific numbers are obtained from the simulator for each day .
A worksheet is prepared for the admissions clerk.
Sometimes the worksheet is put on a computer, but not immediately.
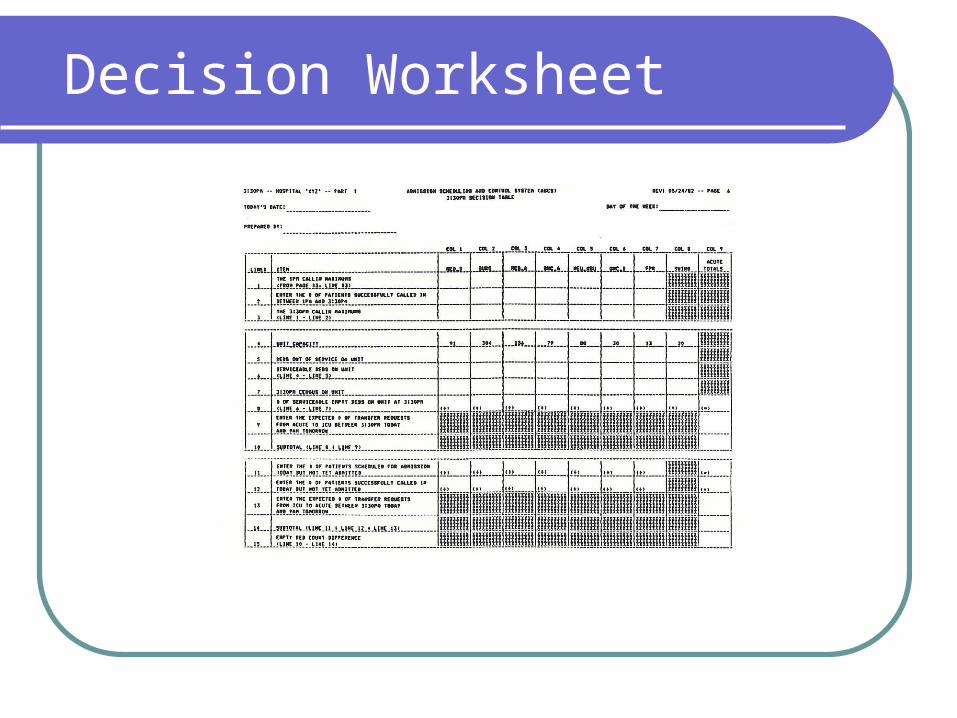
Decision Worksheet
Occupancy Curves
Maximum average occupancy is a function of several factors.
Curves are develop to show the relationships and to help understanding.
More specific maximum average occupancy numbers are obtained using a 23 term regression equation.

Max Avg. Curves
Results
The average increase in occupancy using 14 hospitals is 5.5%
To prevent problems, the resultant chaos, and quality problems, we cannot exceed a maximum average occupancy.
The OR schedule must be stabilized. Specific numbers of surgeries should be done each day.
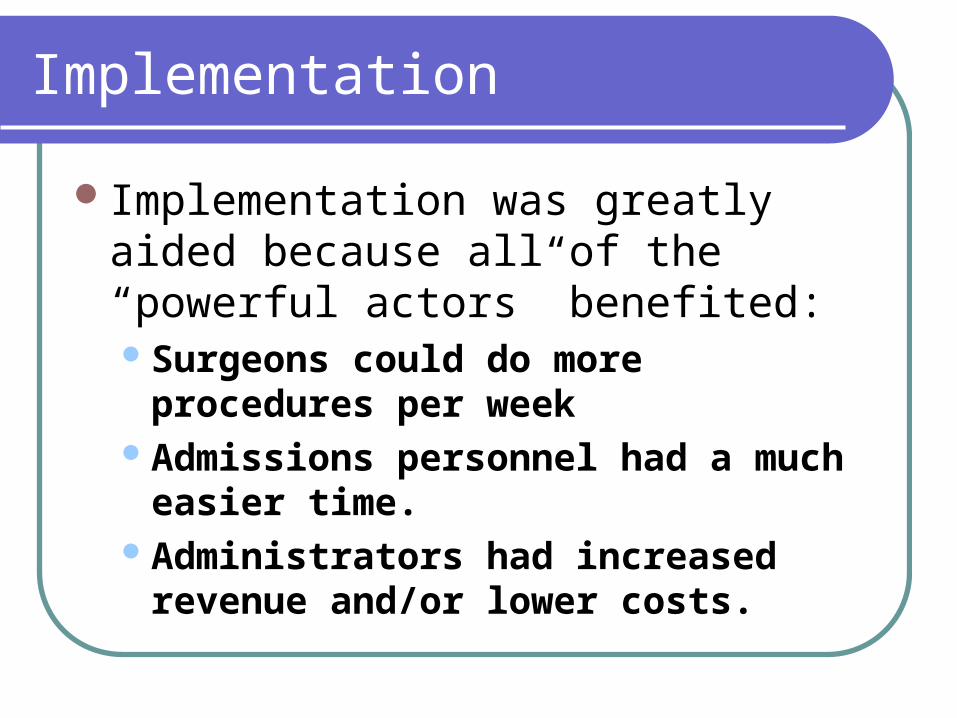
Implementation
Implementation was greatly aided because all of the “powerful actors” benefited:Surgeons could do more procedures per
weekAdmissions personnel had a much
easier time.Administrators had increased revenue
and/or lower costs.
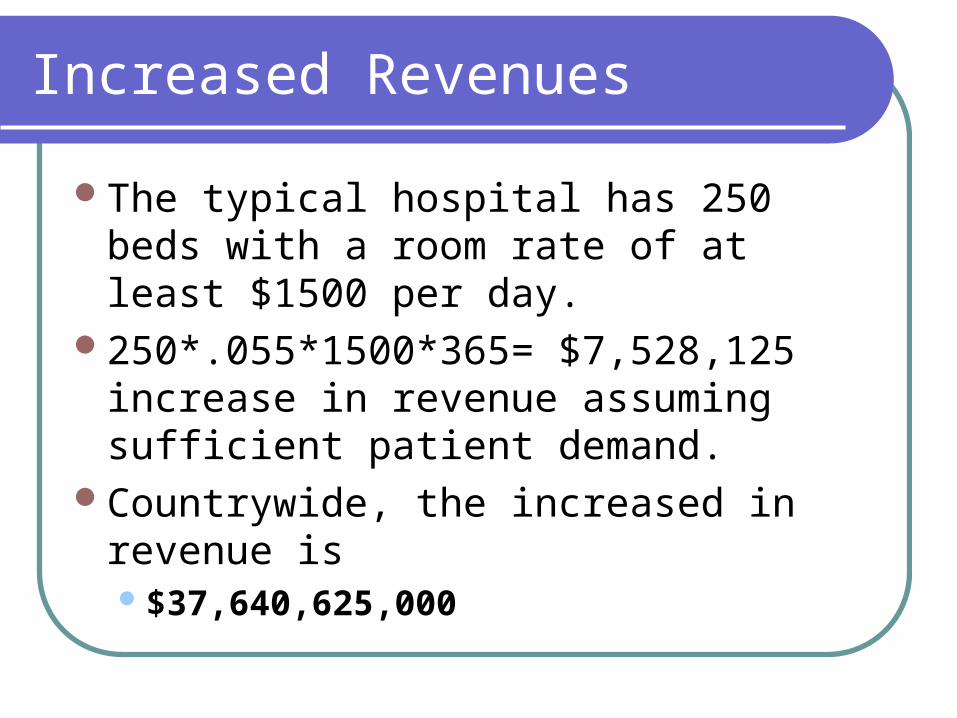
Increased Revenues
The typical hospital has 250 beds with a room rate of at least $1500 per day.
250*.055*1500*365= $7,528,125 increase in revenue assuming sufficient patient demand.
Countrywide, the increased in revenue is $37,640,625,000
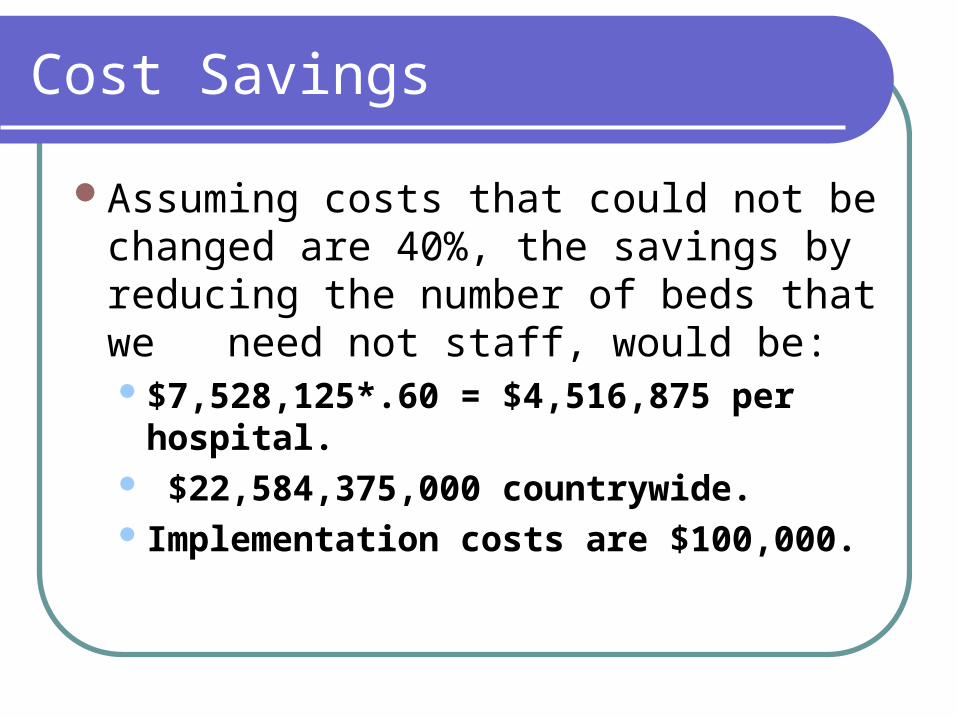
Cost Savings
Assuming costs that could not be changed are 40%, the savings by reducing the number of beds that we need not staff, would be:$7,528,125*.60 = $4,516,875 per hospital. $22,584,375,000 countrywide. Implementation costs are $100,000.
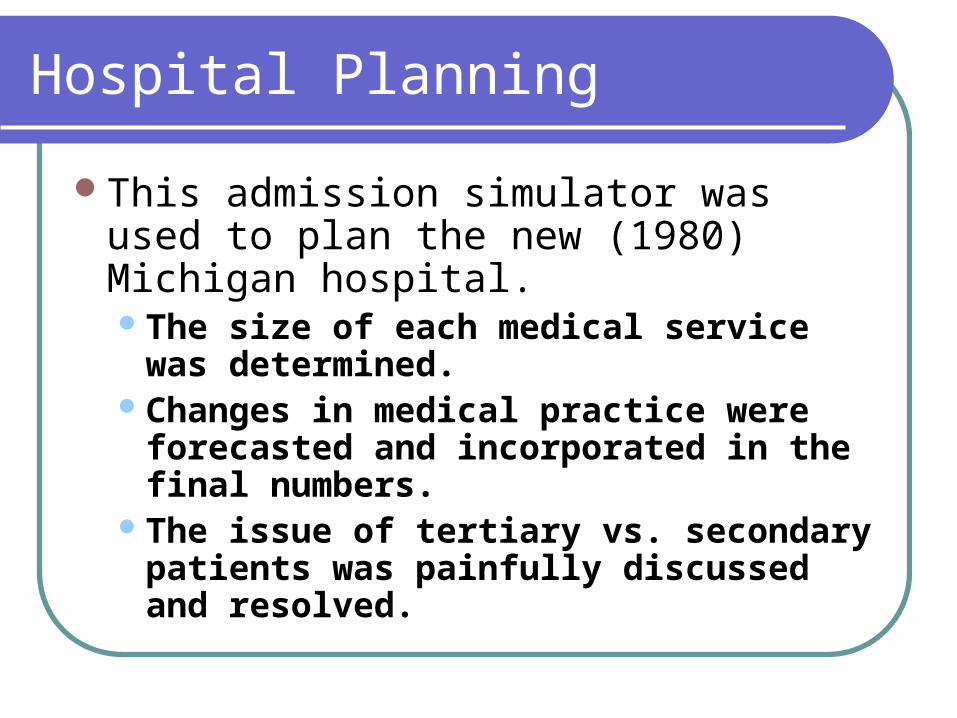
Hospital Planning
This admission simulator was used to plan the new (1980) Michigan hospital. The size of each medical service was
determined.Changes in medical practice were
forecasted and incorporated in the final numbers.
The issue of tertiary vs. secondary patients was painfully discussed and resolved.
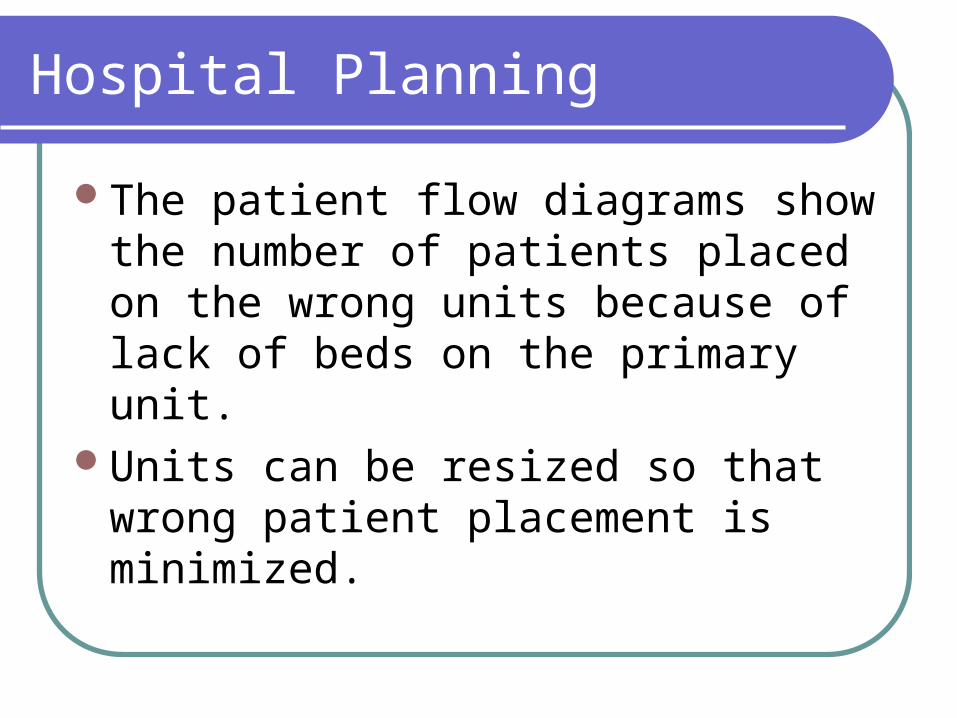
Hospital Planning
The patient flow diagrams show the number of patients placed on the wrong units because of lack of beds on the primary unit.
Units can be resized so that wrong patient placement is minimized.
Operation Room Systems
Scheduling OR’s
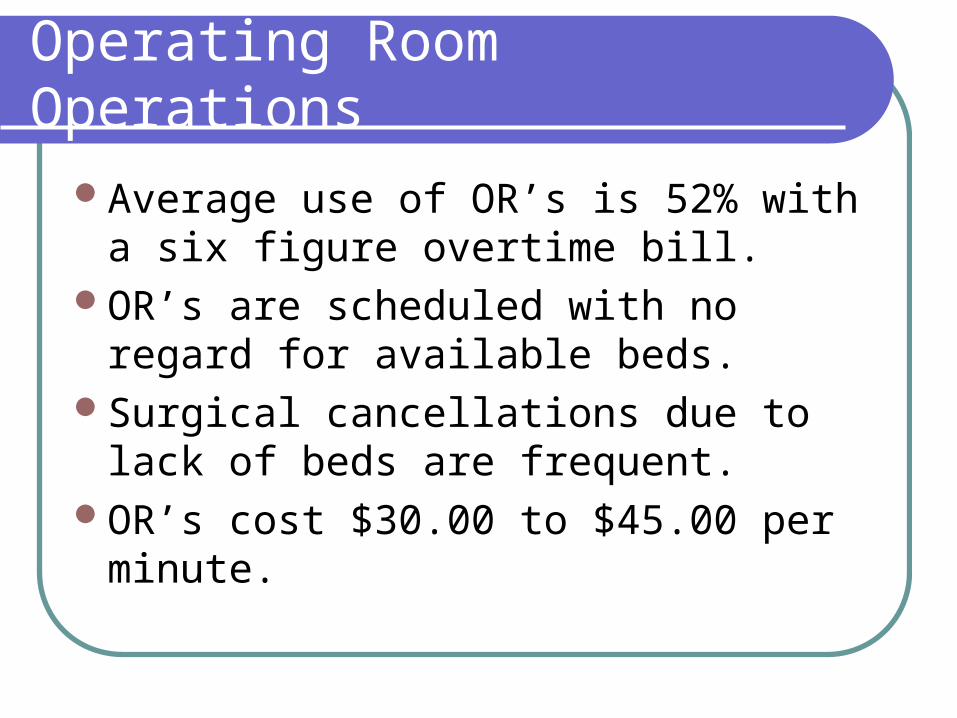
Operating Room Operations
Average use of OR’s is 52% with a six figure overtime bill.
OR’s are scheduled with no regard for available beds.
Surgical cancellations due to lack of beds are frequent.
OR’s cost $30.00 to $45.00 per minute.
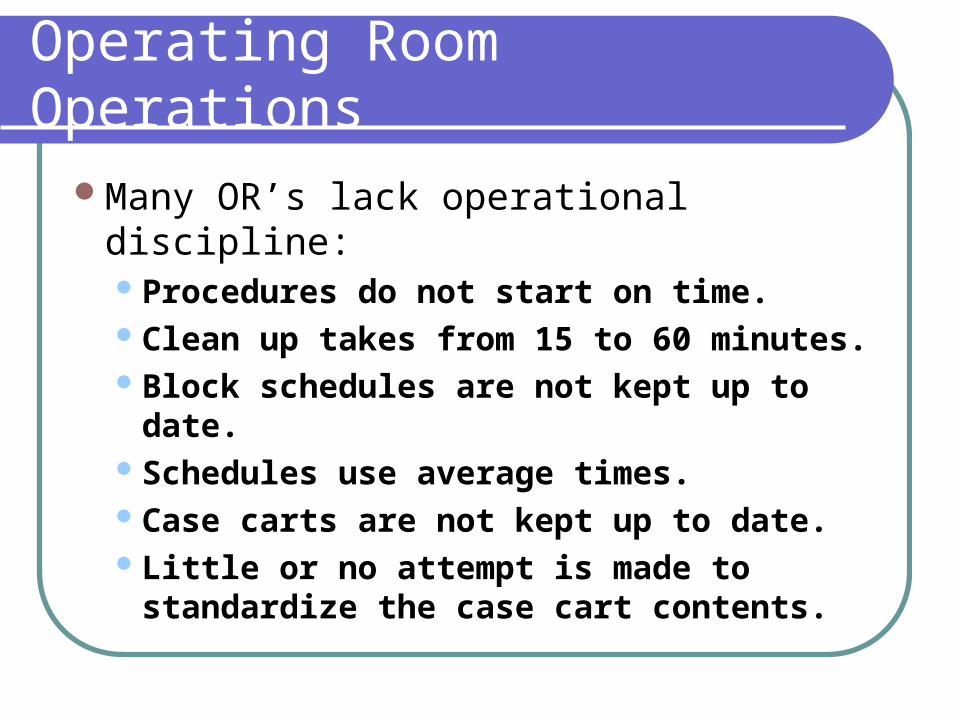
Operating Room Operations
Many OR’s lack operational discipline:Procedures do not start on time.Clean up takes from 15 to 60 minutes.Block schedules are not kept up to date.Schedules use average times.Case carts are not kept up to date.Little or no attempt is made to
standardize the case cart contents.
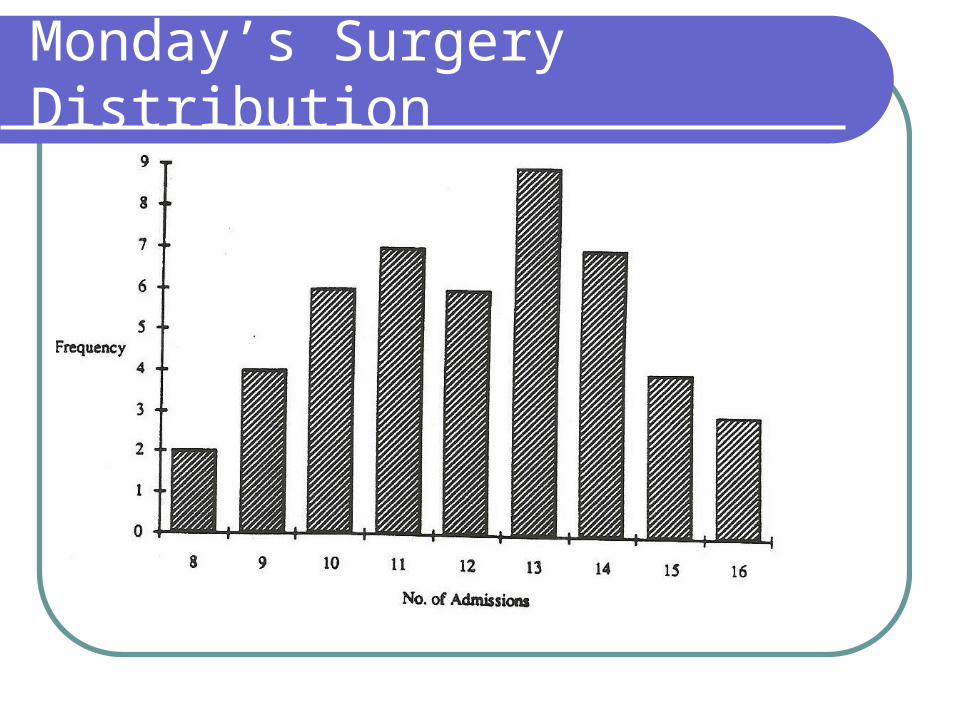
Monday’s Surgery Distribution
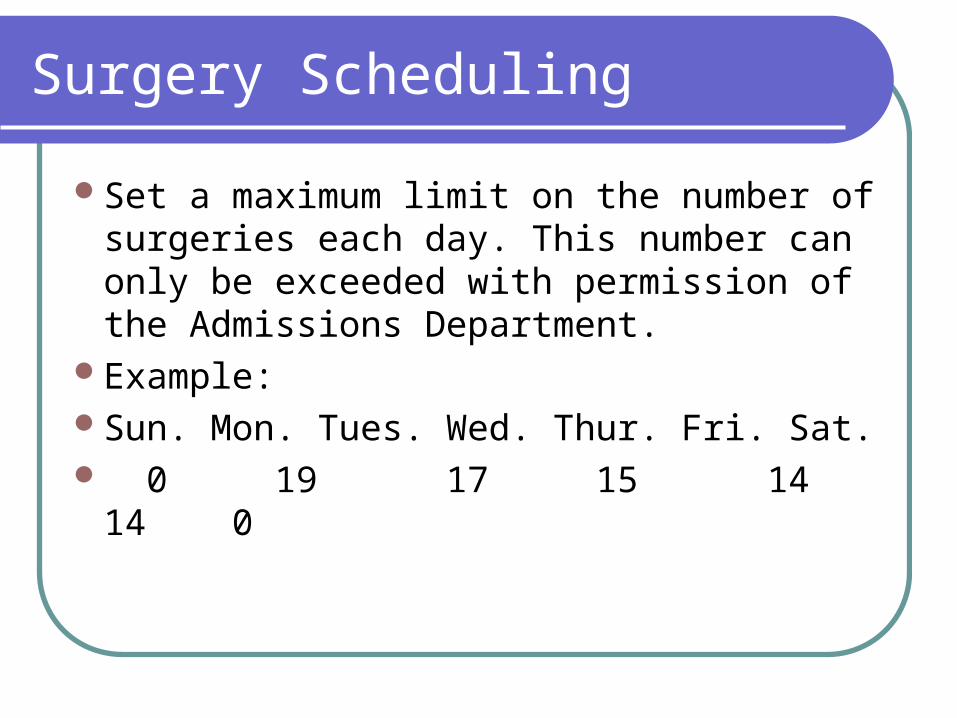
Surgery Scheduling
Set a maximum limit on the number of surgeries each day. This number can only be exceeded with permission of the Admissions Department.
Example:Sun. Mon. Tues. Wed. Thur. Fri. Sat. 0 19 17 15 14 14 0
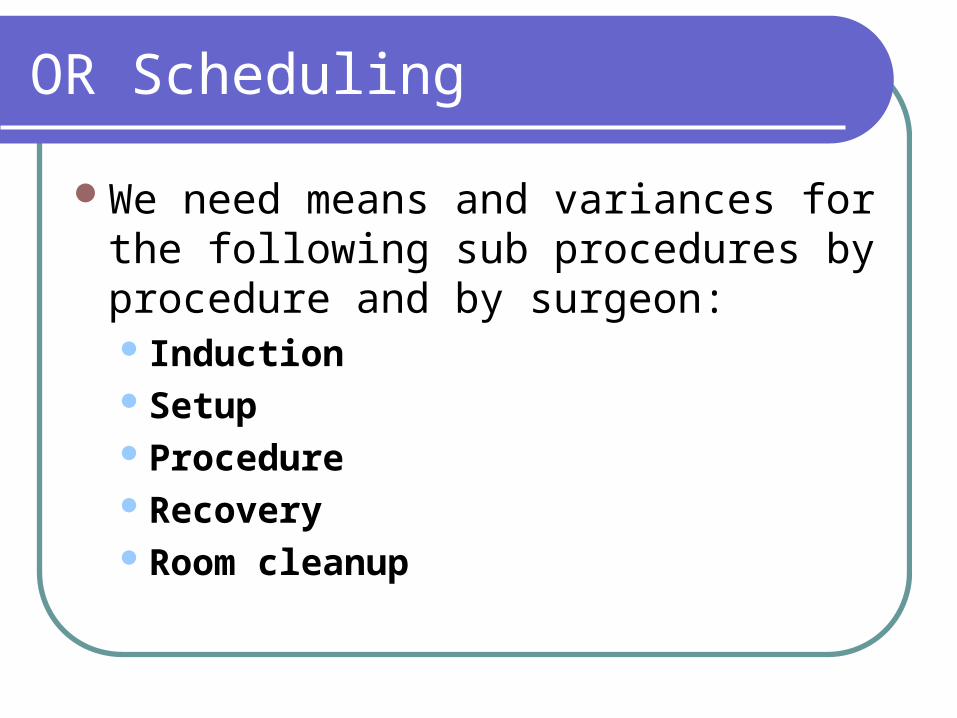
OR Scheduling
We need means and variances for the following sub procedures by procedure and by surgeon: InductionSetupProcedureRecoveryRoom cleanup
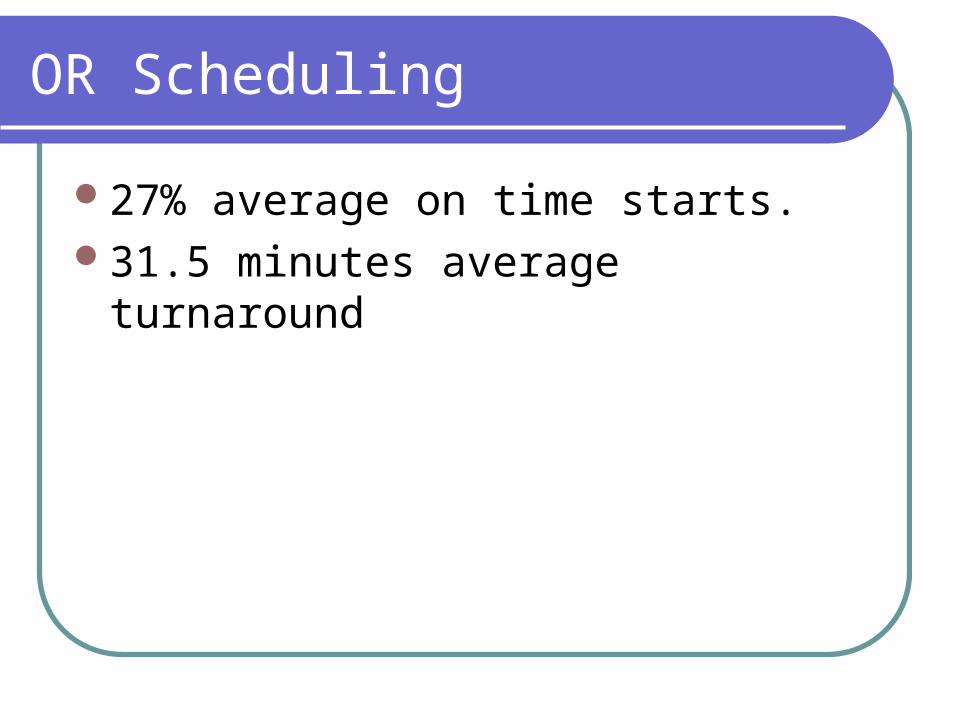
OR Scheduling
27% average on time starts.31.5 minutes average turnaround
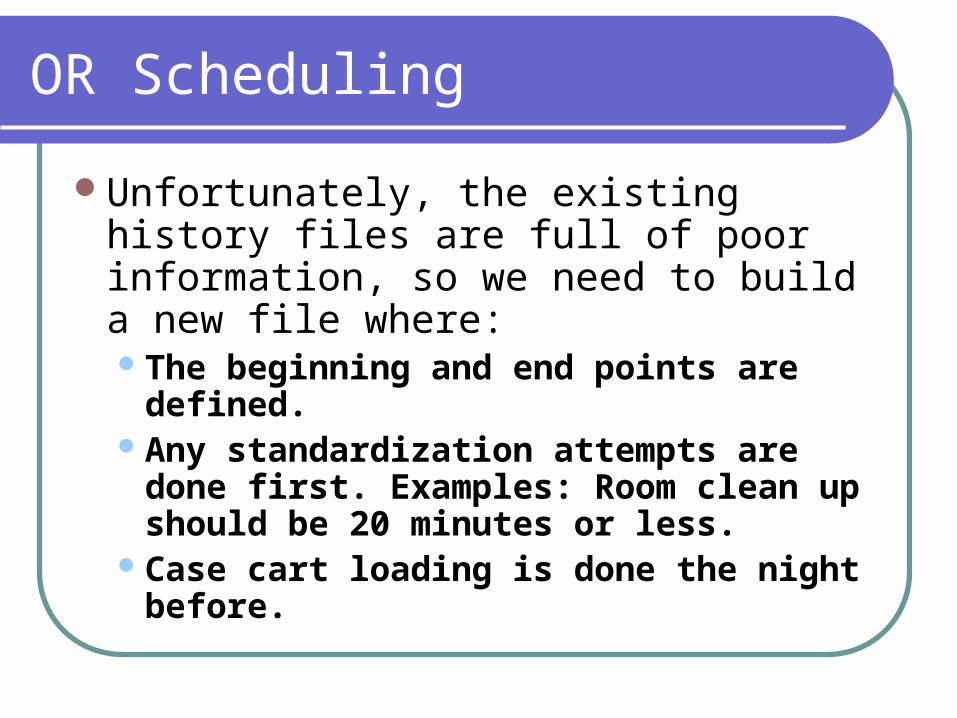
OR Scheduling
Unfortunately, the existing history files are full of poor information, so we need to build a new file where:The beginning and end points are
defined.Any standardization attempts are done
first. Examples: Room clean up should be 20 minutes or less.
Case cart loading is done the night before.
Surgery Scheduling
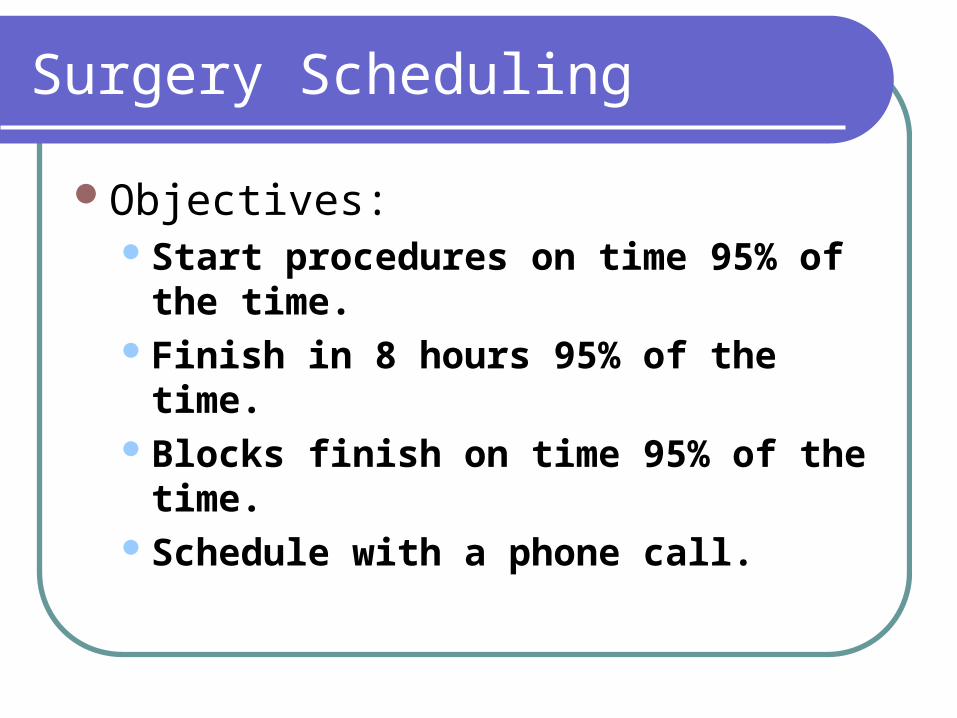
Objectives:Start procedures on time 95% of the
time.Finish in 8 hours 95% of the time.Blocks finish on time 95% of the time.Schedule with a phone call.
Savings Summary
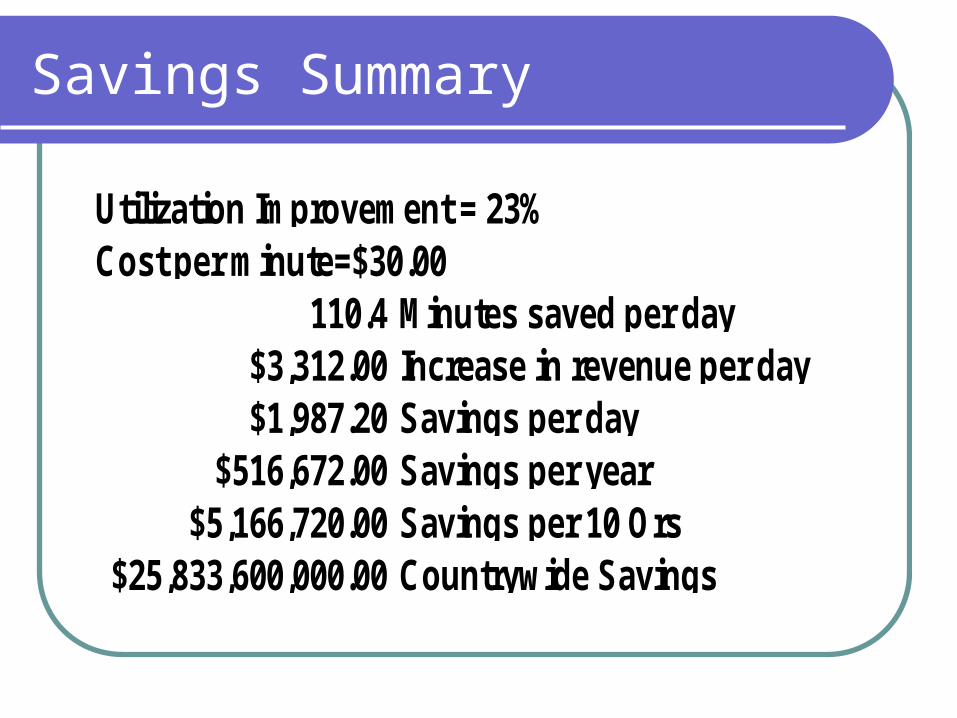
Utilization Improvement = 23%Cost per minute=$30.00
110.4 Minutes saved per day$3,312.00 Increase in revenue per day$1,987.20 Savings per day
$516,672.00 Savings per year$5,166,720.00 Savings per 10 Ors
$25,833,600,000.00 Countrywide Savings
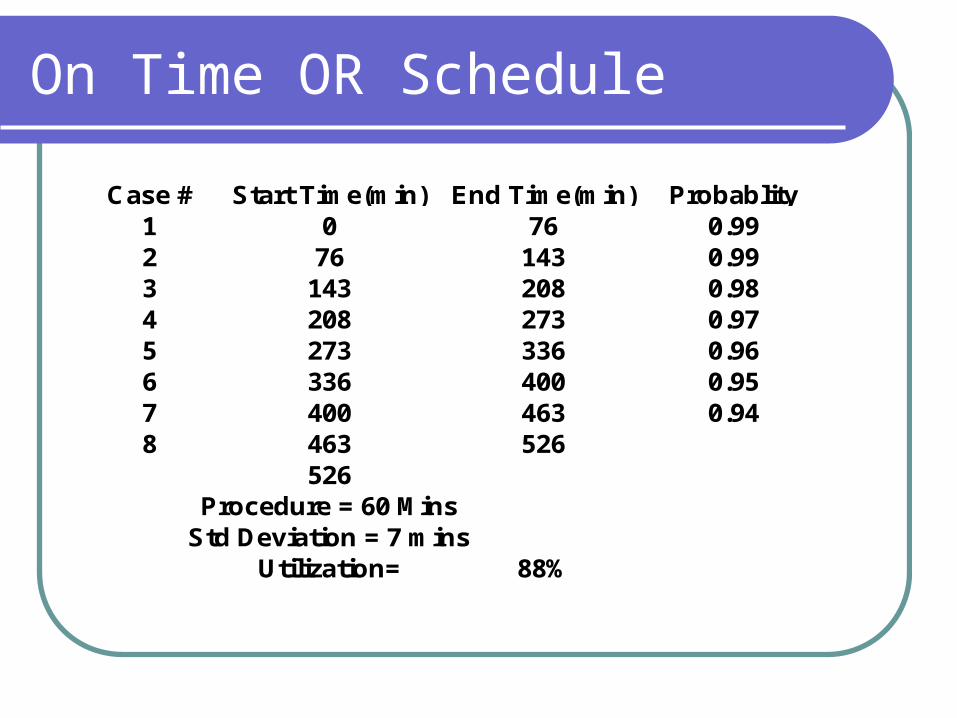
On Time OR Schedule
Case # Start Time(min) End Time(min) Probablity1 0 76 0.992 76 143 0.993 143 208 0.984 208 273 0.975 273 336 0.966 336 400 0.957 400 463 0.948 463 526 526
Procedure = 60 MinsStd Deviation = 7 mins
Utilization= 88%
Nursing Operations
Staffing
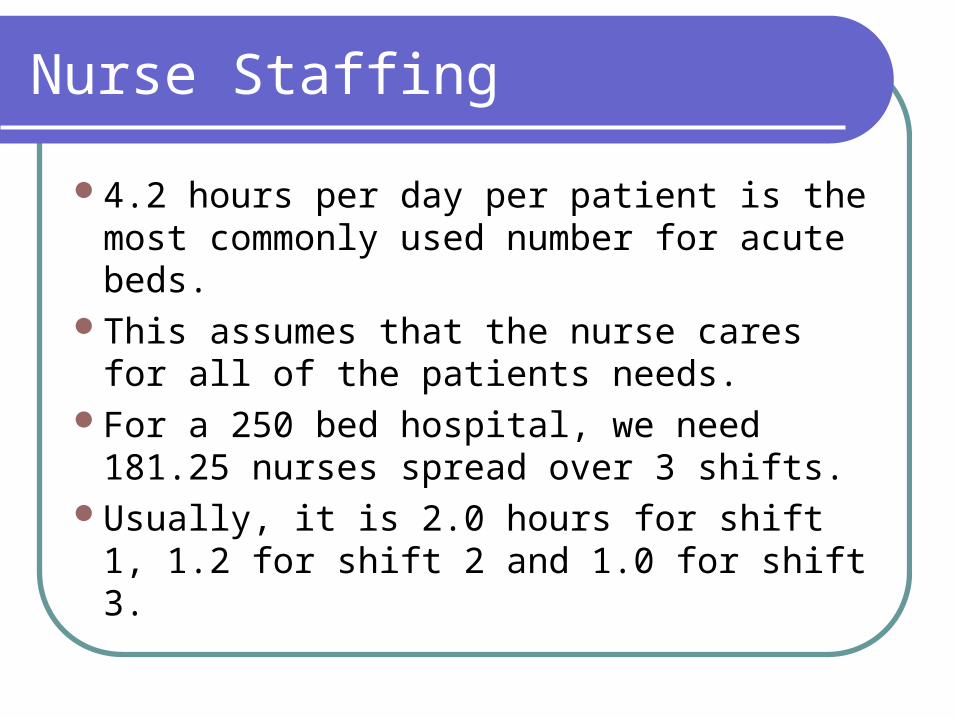
Nurse Staffing
4.2 hours per day per patient is the most commonly used number for acute beds.
This assumes that the nurse cares for all of the patients needs.
For a 250 bed hospital, we need 181.25 nurses spread over 3 shifts.
Usually, it is 2.0 hours for shift 1, 1.2 for shift 2 and 1.0 for shift 3.
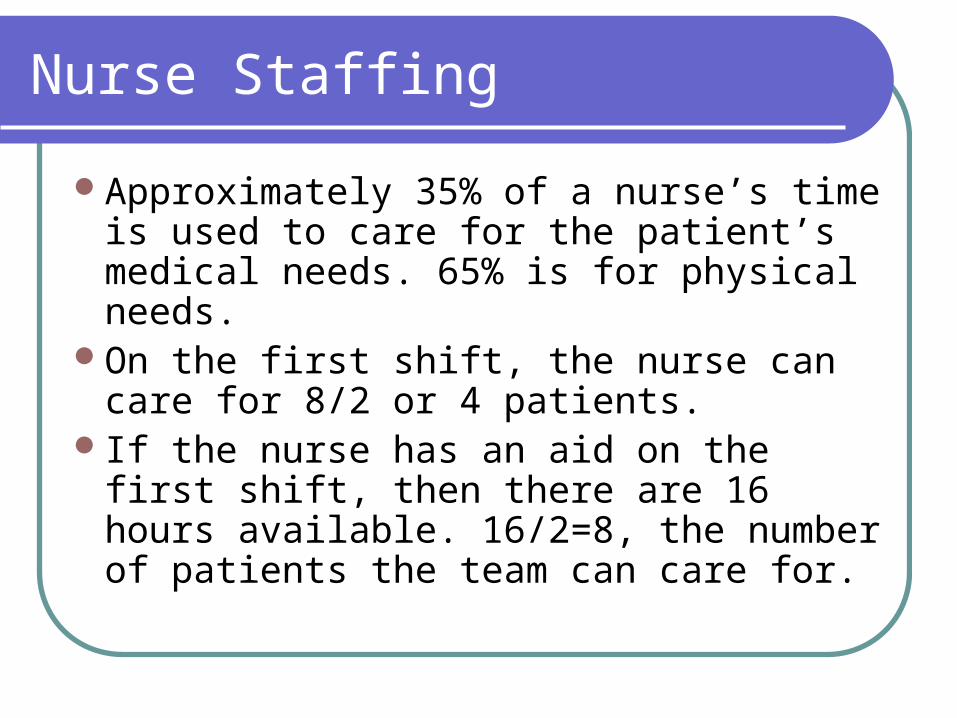
Nurse Staffing
Approximately 35% of a nurse’s time is used to care for the patient’s medical needs. 65% is for physical needs.
On the first shift, the nurse can care for 8/2 or 4 patients.
If the nurse has an aid on the first shift, then there are 16 hours available. 16/2=8, the number of patients the team can care for.
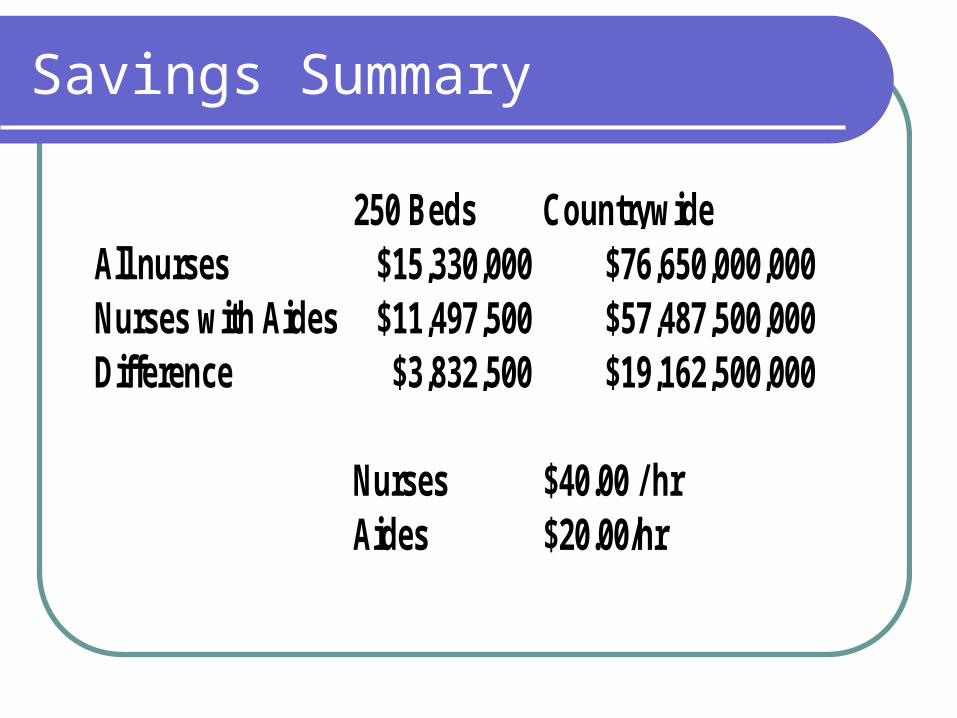
Savings Summary
250 Beds CountrywideAll nurses $15,330,000 $76,650,000,000Nurses with Aides $11,497,500 $57,487,500,000Difference $3,832,500 $19,162,500,000
Nurses $40.00 / hrAides $20.00/hr
Nursing Procedures
Lack of Standarized Work
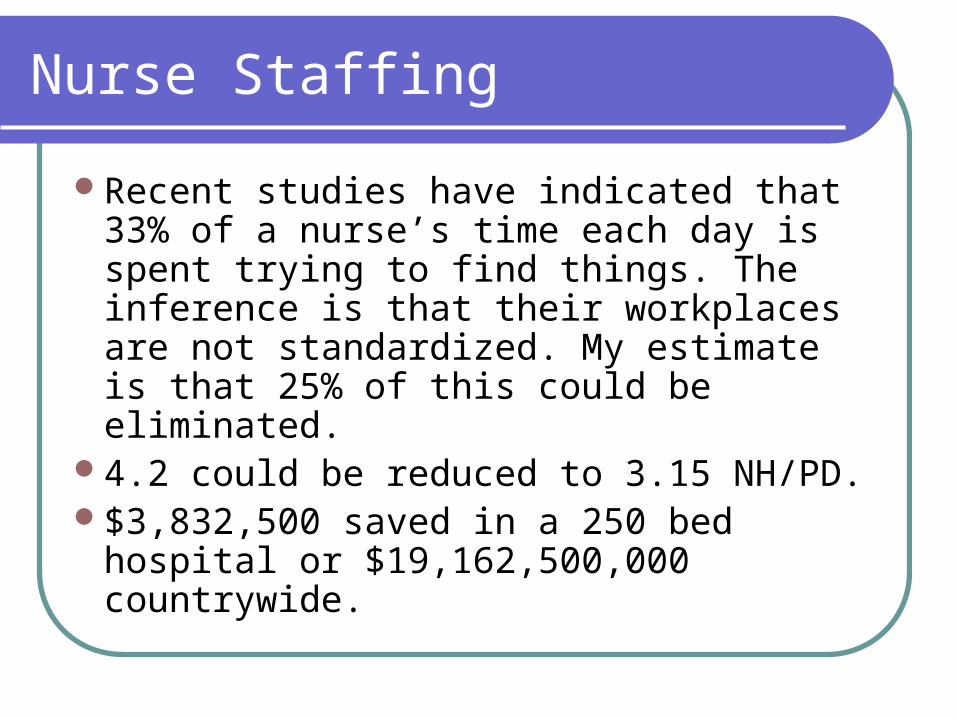
Nurse Staffing
Recent studies have indicated that 33% of a nurse’s time each day is spent trying to find things. The inference is that their workplaces are not standardized. My estimate is that 25% of this could be eliminated.
4.2 could be reduced to 3.15 NH/PD.$3,832,500 saved in a 250 bed hospital
or $19,162,500,000 countrywide.

Nursing Operations
Nurse Assingments

Nurse Assignments
Each patient needs certain care. How do we assign the nurses so there is a high probability needs will be met?
We need to classify each patient at the end of the previous shift so that assignment takes place within the first five minutes of the next shift.
We need to provide the admissions dept. with knowledge of where there is an excess of nursing staff.
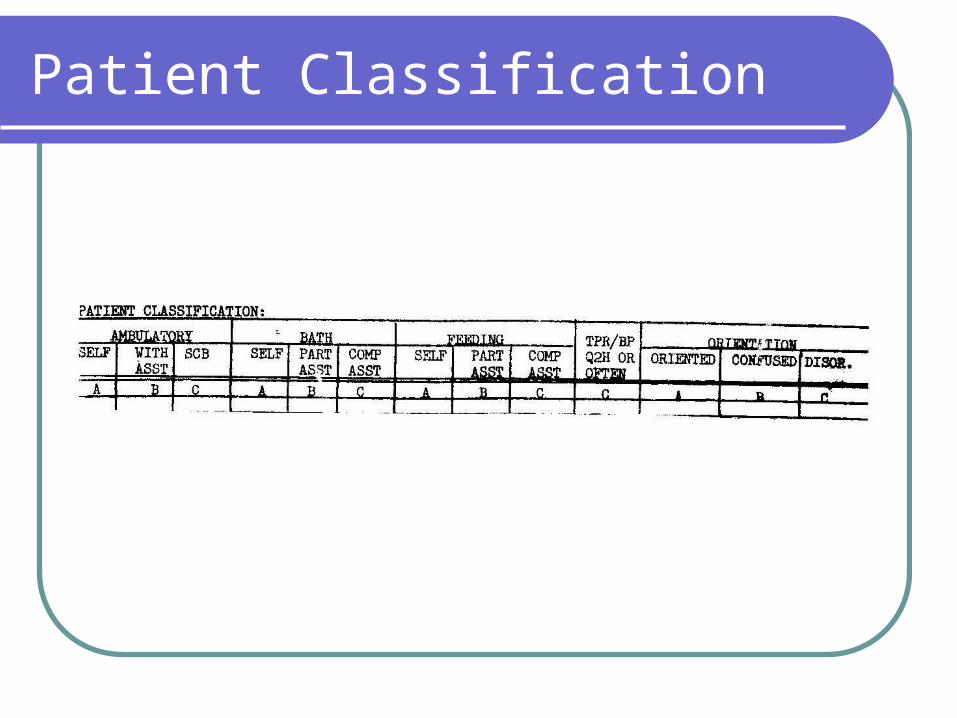
Patient Classification
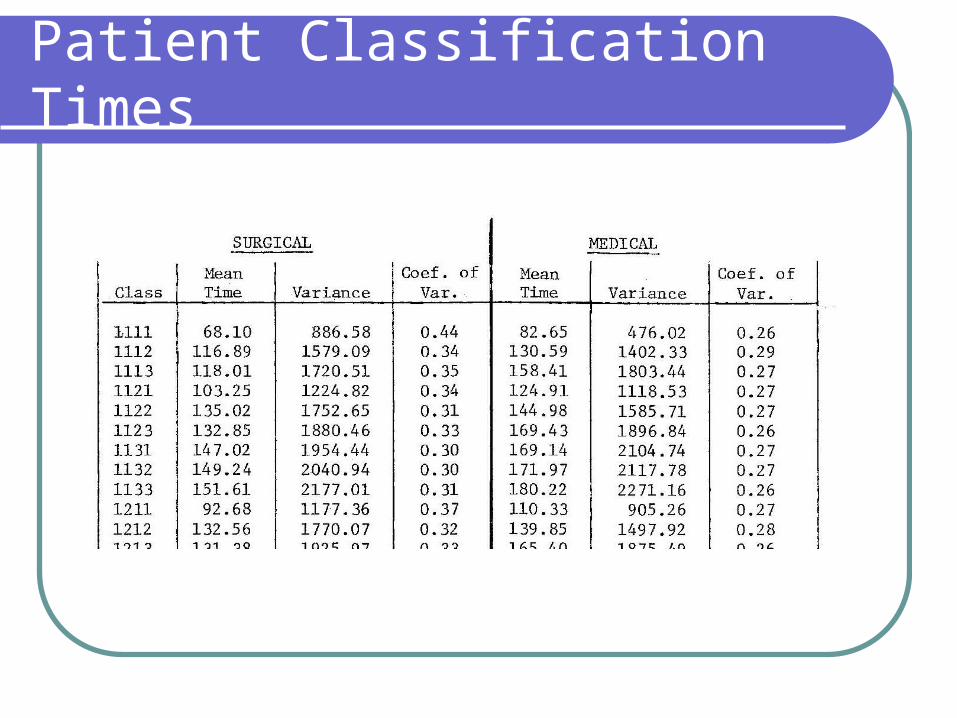
Patient Classification Times

Nurse Data Collection Sheet
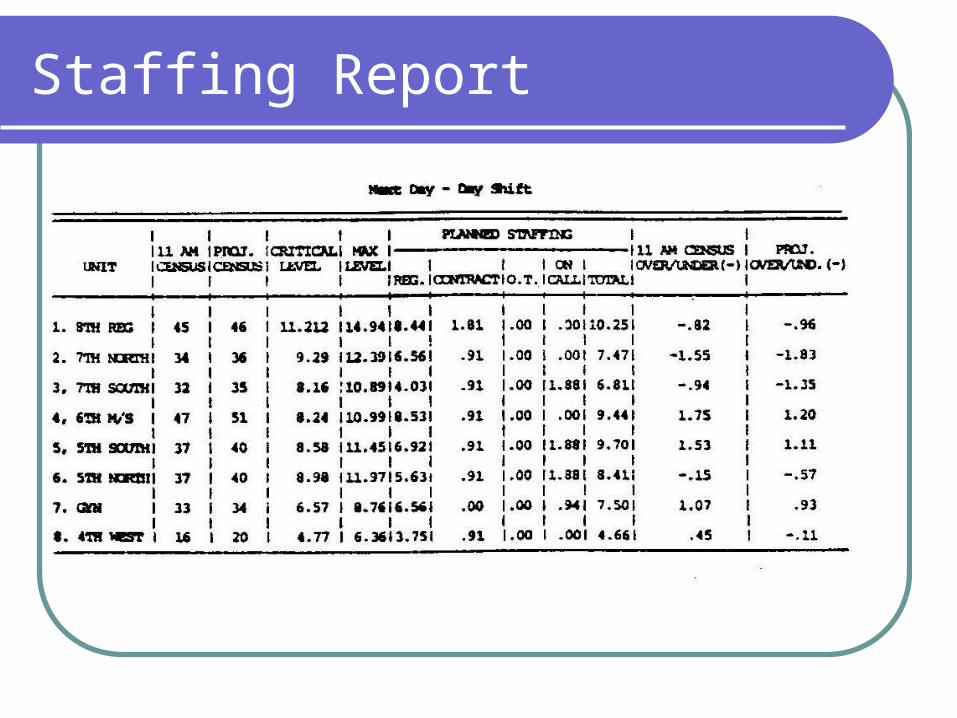
Staffing Report

Learning Curve Adjustments
Ancillary Staffing
Determination of Staffing Levels
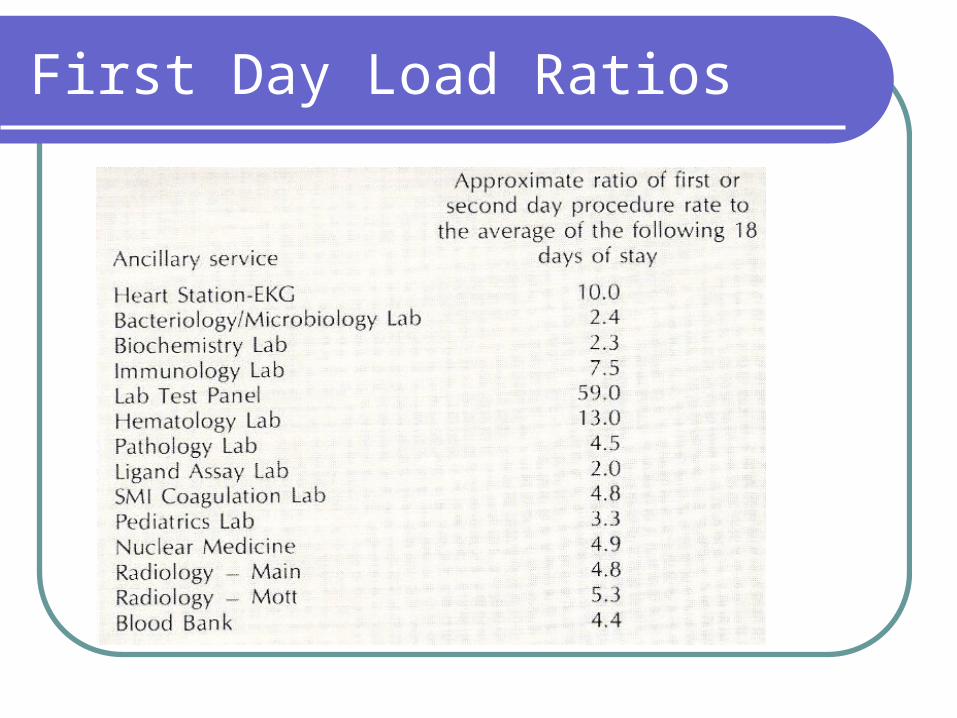
First Day Load Ratios
Ancillary Staffing
Ancillary professional groups have labor standards for procedures.
These standards are generally “loose.”Part of the reason for the loose
standards is because data were obtained on partially trained employees.
Partially trained is the typical state of most hospital personnel because of the lack of practice opportunity.
Ancillary Staffing
By extending the procedures to their labor hours, we can obtain an estimate of the hours needed on each shift.
We know that people work at their maximum rate when highly motivated. Motivation is highest when there is a lot of work to do.
A sustainable rate is 1/4 less than the maximum rate.
Ancillary Staffing
Unfortunately, the number of procedure orders on the first shift are not uniformly received during the shift. Orders for blood work are received after the physician makes rounds. Thus, idleness may occur during the early part of the shift.
The working hours of ancillary services need to be changed to reflect when orders are received.
Ancillary Staffing
When work is standardized, output increases by 1/3. Except for certain laboratory procedures, very little of the work has been standardized.
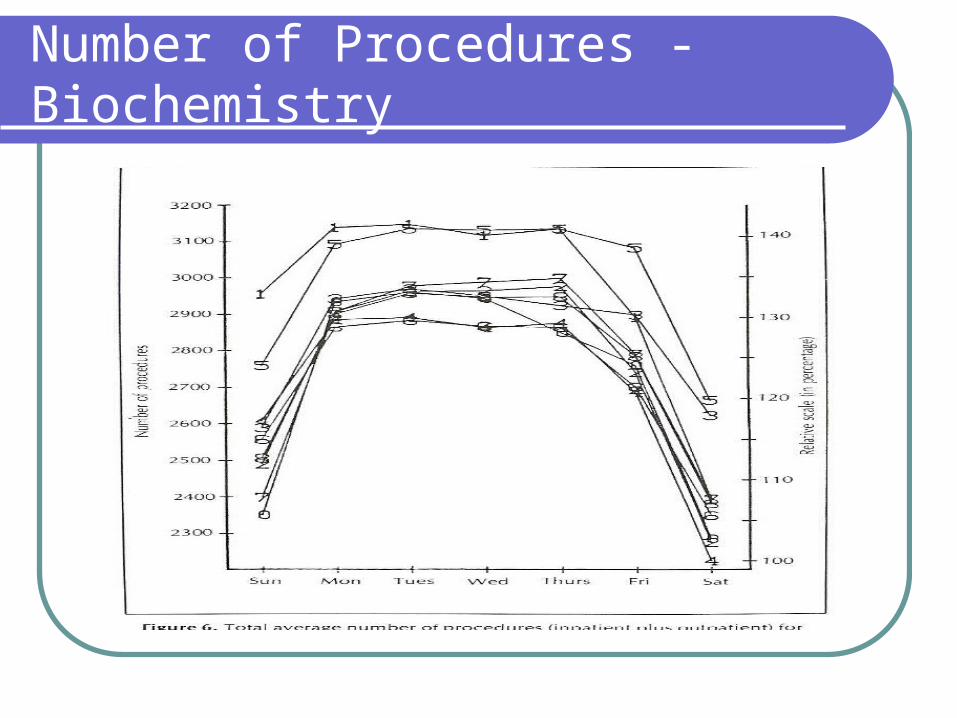
Number of Procedures - Biochemistry
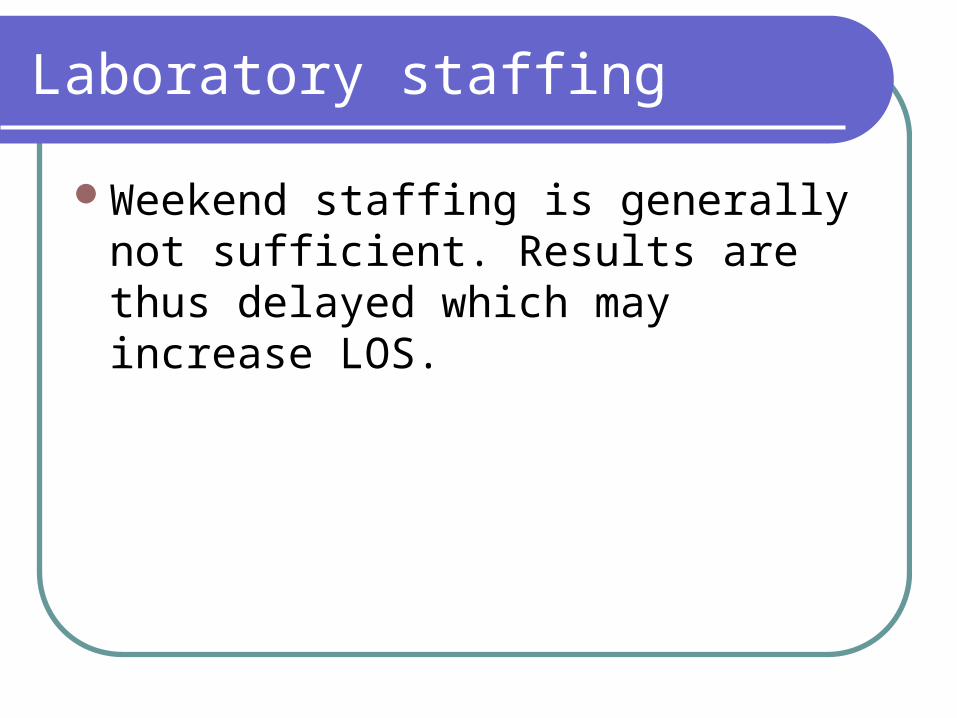
Laboratory staffing
Weekend staffing is generally not sufficient. Results are thus delayed which may increase LOS.
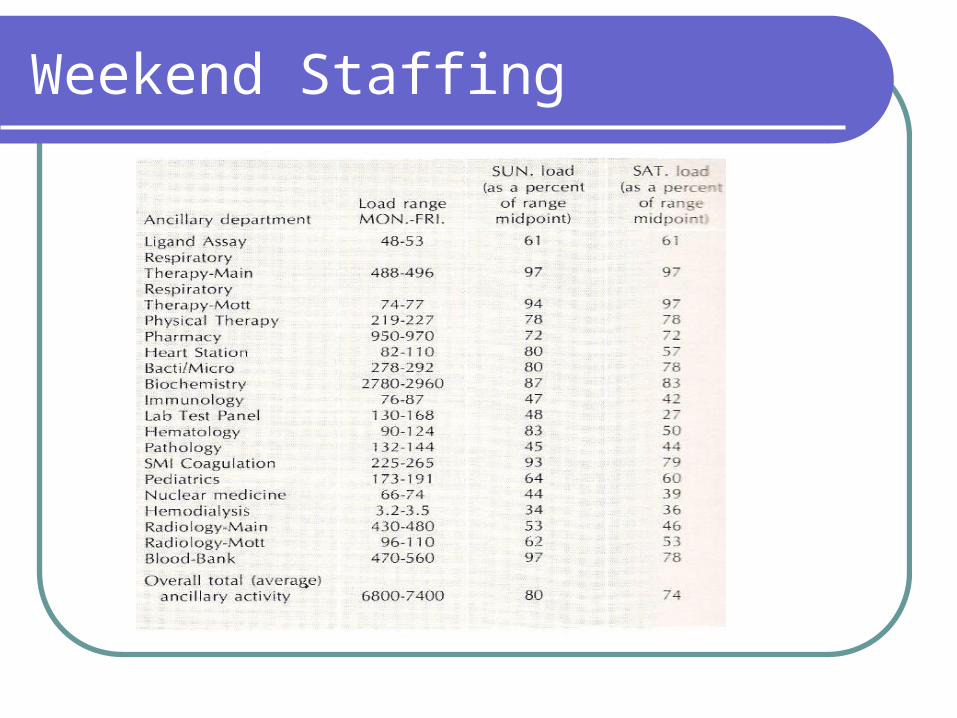
Weekend Staffing

Ancillary Staffing Analysis
Ancillary Savings
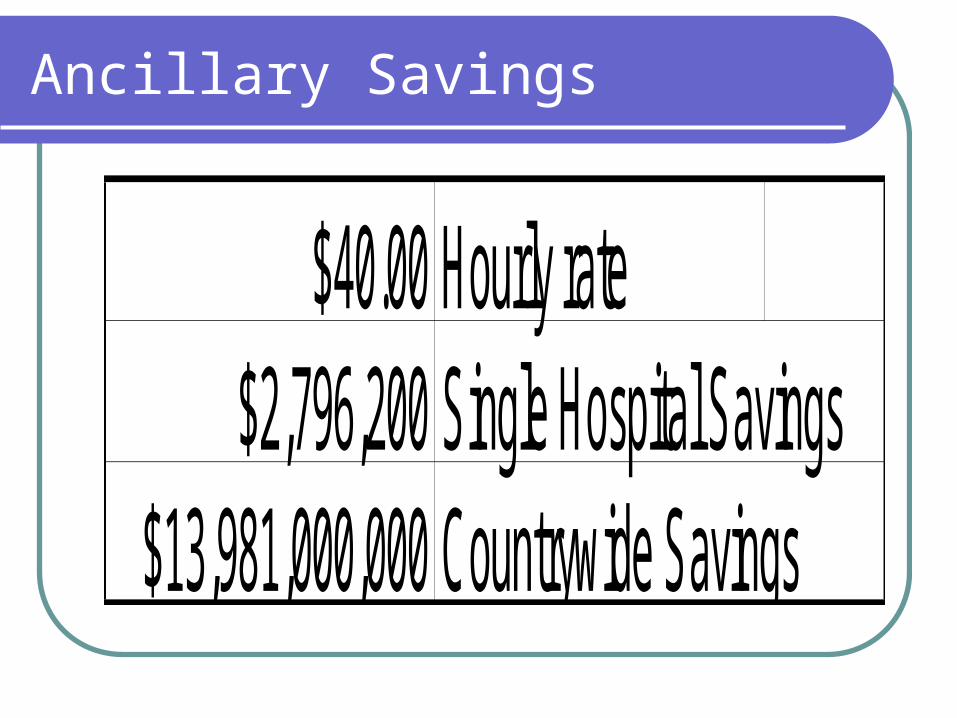
$40.00 Hourly rate$2,796,200 Single Hospital Savings
$13,981,000,000 Countrywide Savings
Outpatient Scheduling
Patient Waiting
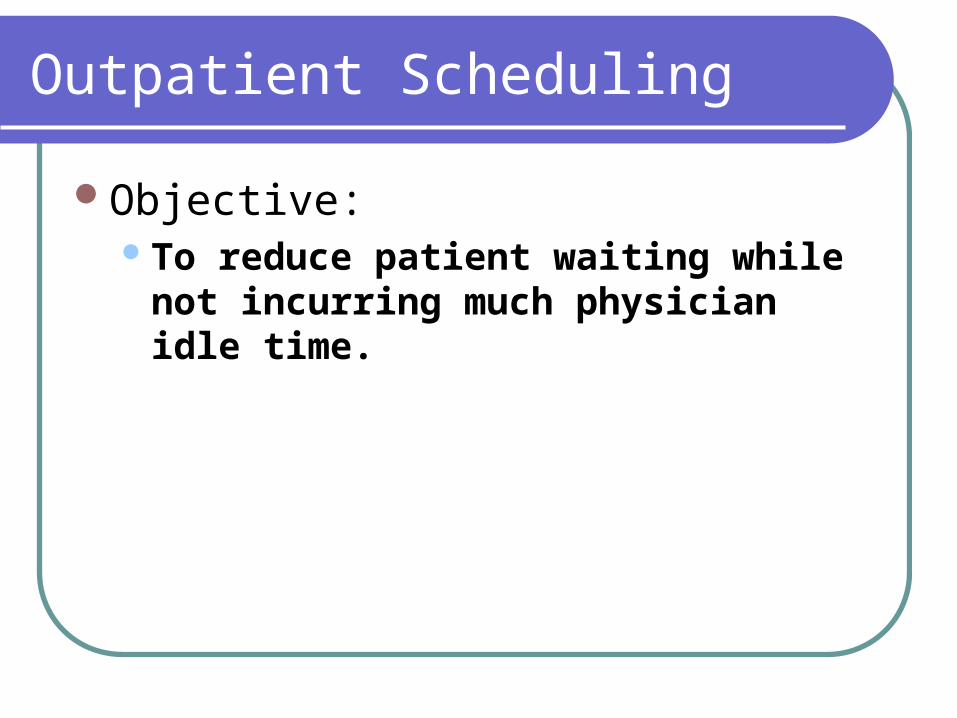
Outpatient Scheduling
Objective:To reduce patient waiting while not
incurring much physician idle time.
Background for Outpatients
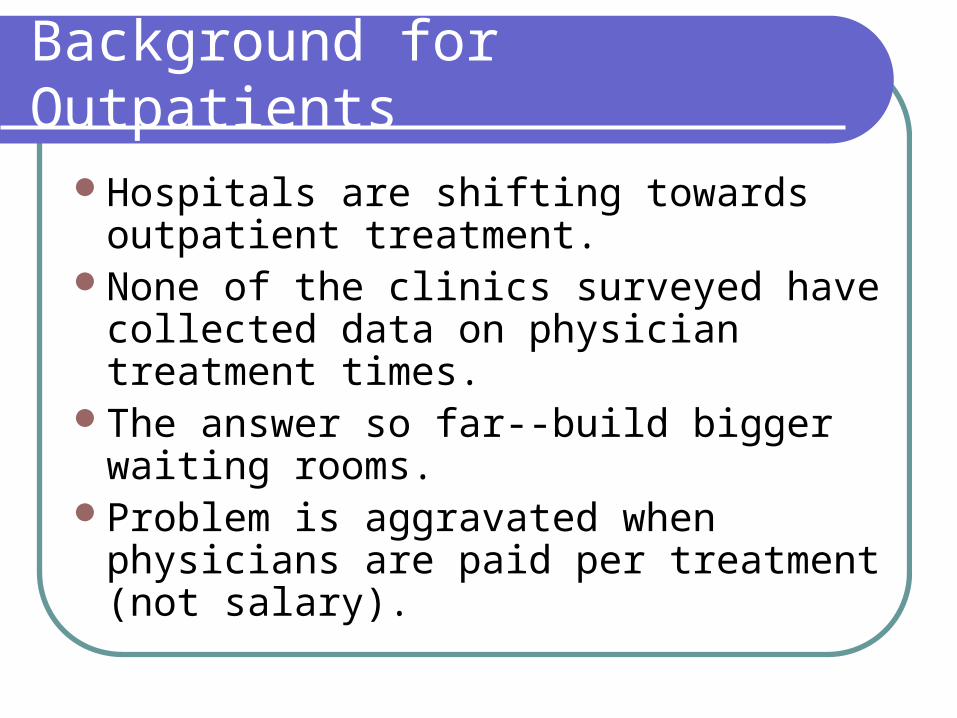
Hospitals are shifting towards outpatient treatment.
None of the clinics surveyed have collected data on physician treatment times.
The answer so far--build bigger waiting rooms.
Problem is aggravated when physicians are paid per treatment (not salary).
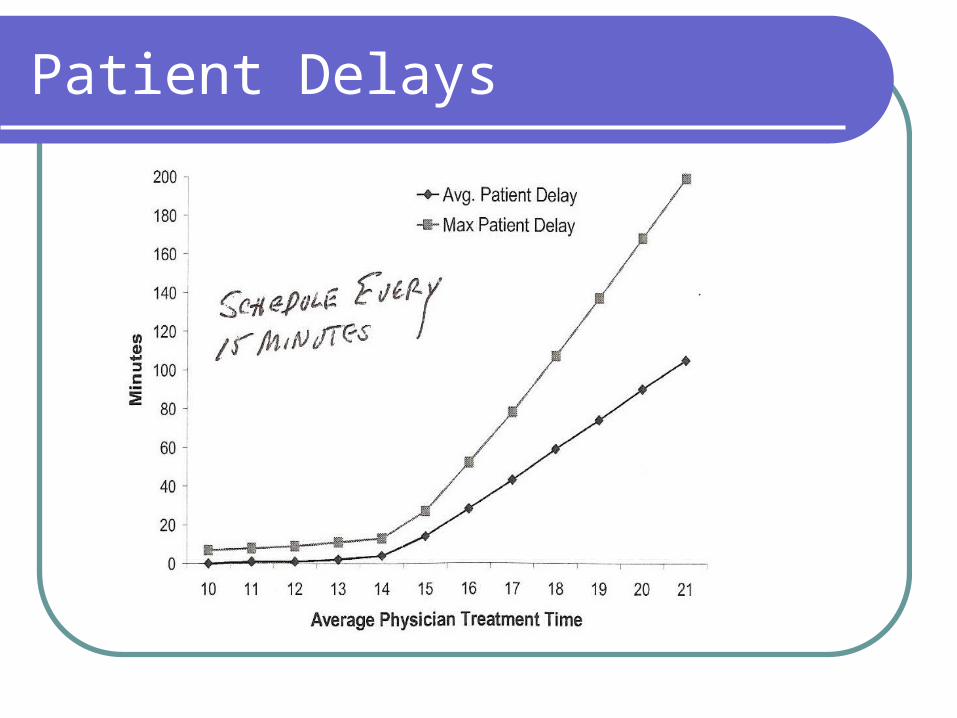
Patient Delays
Outpatient Scheduling Results
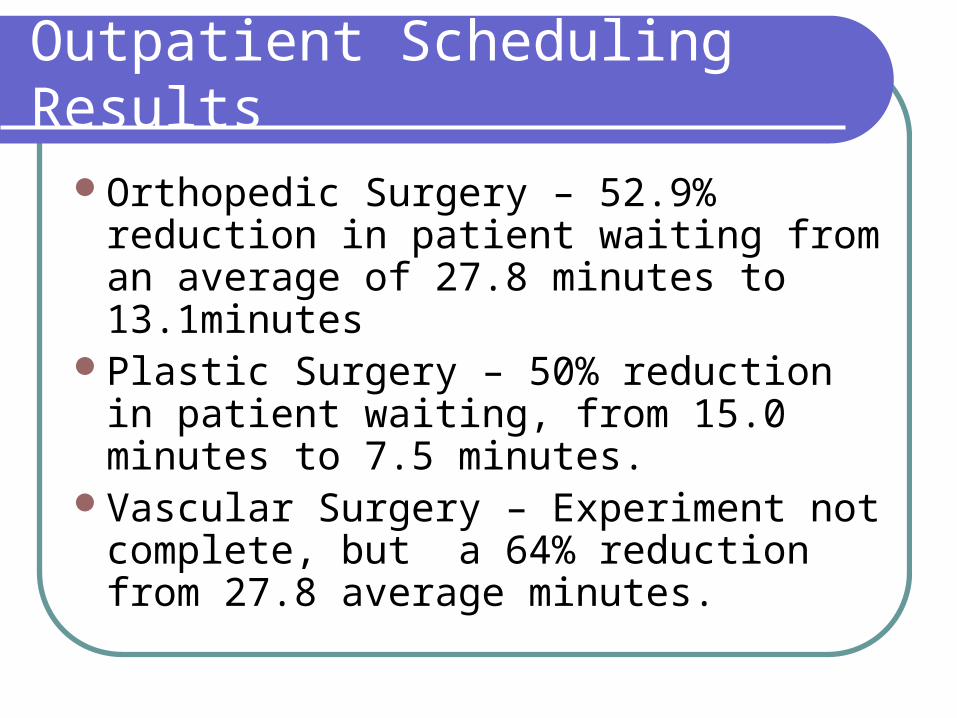
Orthopedic Surgery – 52.9% reduction in patient waiting from an average of 27.8 minutes to 13.1minutes
Plastic Surgery – 50% reduction in patient waiting, from 15.0 minutes to 7.5 minutes.
Vascular Surgery – Experiment not complete, but a 64% reduction from 27.8 average minutes.
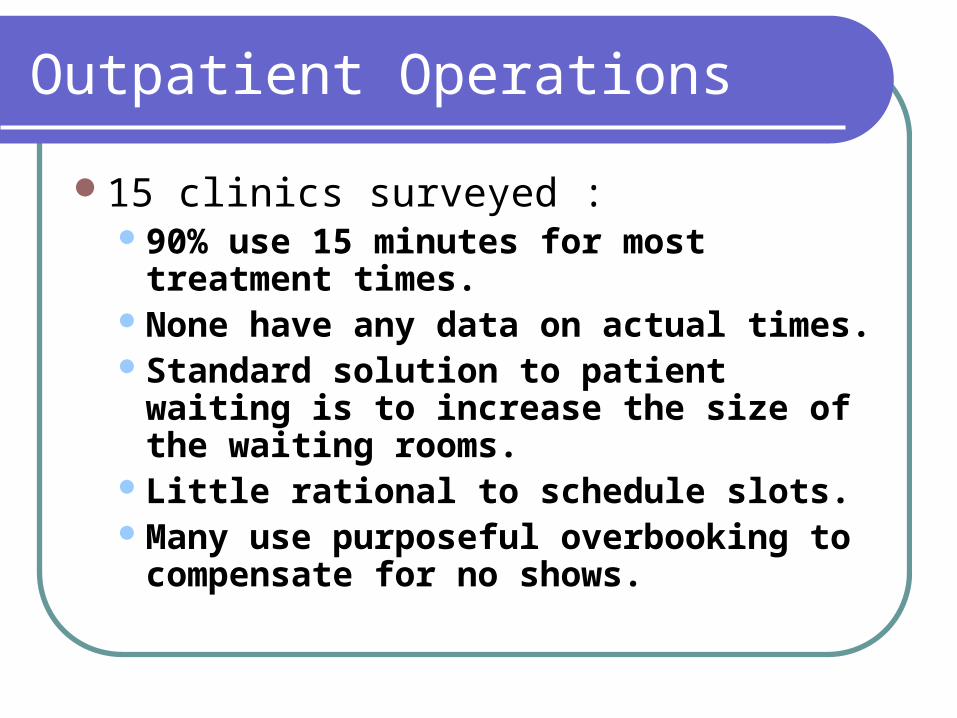
Outpatient Operations
15 clinics surveyed :90% use 15 minutes for most treatment
times.None have any data on actual times.Standard solution to patient waiting is to
increase the size of the waiting rooms.Little rational to schedule slots.Many use purposeful overbooking to
compensate for no shows.
Transporters
Limiting Factor to Service Flows
Transporters
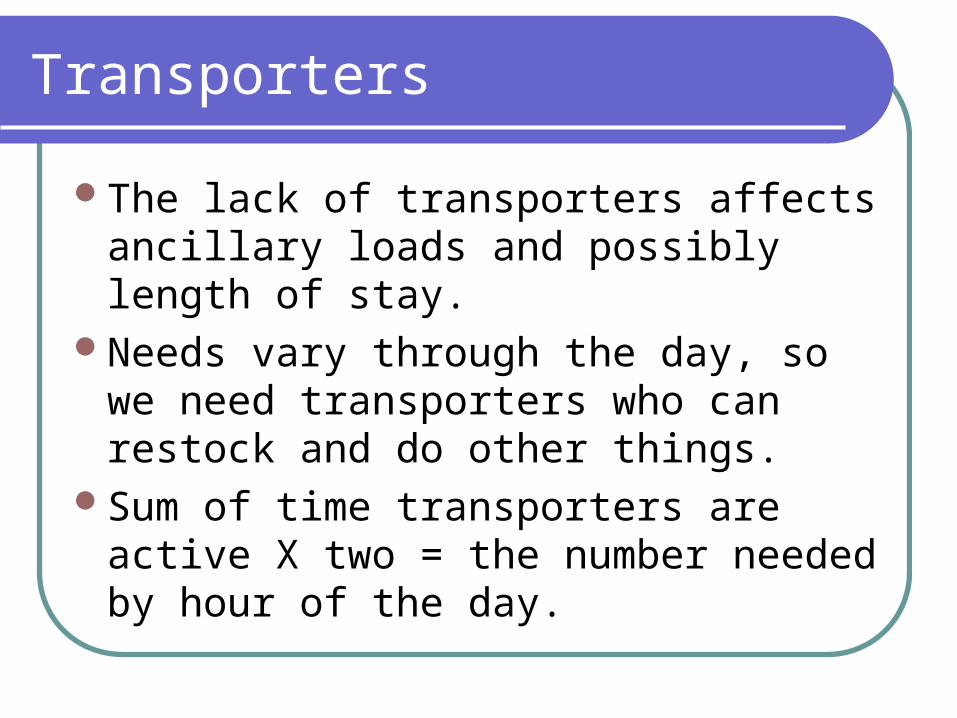
The lack of transporters affects ancillary loads and possibly length of stay.
Needs vary through the day, so we need transporters who can restock and do other things.
Sum of time transporters are active X two = the number needed by hour of the day.
Savings Summary
250 Beds Countrywide % of BudgetBudget-250 Beds $136,875,000 $684,375,000,000
Admissions $4,516,875 $225,843,750 3.30%OR $5,166,720 $25,833,600,000 3.77%Nurses using aides $3,832,500 $19,162,500,000 2.80%Nurse staffing $3,832,000 $19,162,500,000 2.80%Ancillary services $2,796,200 $13,981,000,000 2.04%
Totals $20,144,295 $78,365,443,750 14.72%