Embed Size (px)
Citation preview

Start Spreading the News:
A Structural Estimate of the Effects of New York Hospital Report Cards
David Dranove
and
Andrew Sfekas
Northwestern University
2/20/2008
1
Start Spreading the News:
A Structural Estimate of the Effects of New York Hospital Report Cards
1. Introduction
One of the key strategies for improving health care quality is the release of ―report cards‖
on everything from enrollee satisfaction with their health plans to cardiovascular surgery
mortality. Report cards may improve the performance of health care markets in at least
two ways. First, they may enable enrollees and patients to identify and patronize higher
quality payers and providers. Second, they may encourage payers and providers to
further improve quality so as to increase demand.1 The latter is predicated on the former,
because improvements in quality will not increase demand if consumers are unaware of
them. Thus, if report cards fail to influence demand, both of these benefits may be lost.
As we describe below, several researchers have studied whether report cards
affect demand, with mixed results. Dafny and Dranove (2005) suggest that one reason for
the mixed findings may be that report card rankings could comport with prior beliefs
about quality. For example, it seems doubtful that any positive report card could elevate
the reputation of the Mayo Clinic above its current stature. Thus, even a glowing report
might not increase Mayo‘s market share. Report cards will likely have the largest impact
on market shares when the results are contrary to prior beliefs.
In this study we propose and implement a methodology to assess the effectiveness
of the ―news‖ that report cards provide to the market. Studying the immediate aftermath
of the introduction of New York‘s cardiovascular surgery report cards in December 1990,
1 Report cards may also allow payers and providers to better assess their own performance. Payers and
providers who are self-motivated to improve performance may thus improve their quality even if there is no
market response. Report cards may also enable patients to better ―match‖ themselves to providers based on
their specific needs.
2
we find that higher ranking hospitals did not appear to gain market share. However, once
we control for prior beliefs about quality, we find that when report card scores differ from
prior beliefs, patients do respond by changing their choice of hospital. We conclude that
report cards may be valuable in precisely those situations where they are needed most,
when the facts about quality differ from preconceptions. This effect is not symmetric,
however—hospitals whose report card rankings were lower than prior beliefs experienced
a statistically significant decrease in demand, but hospitals with higher-than-expected
scores appear to reap no benefits from the positive news. This is consistent with an
earlier finding by Scanlon et al. (2002) who found a similar asymmetric response to
health insurance report cards. Based on these findings as well as anecdotal conversations
with health care executives, we speculate that this asymmetric response might prove to be
a consistent expression of health consumer behavior.
2. Brief Background on Report Cards
Detailed discussions of health care provider report cards appear elsewhere, so we
will summarize some of the key facts, especially those pertaining to the New York report
cards that we study.2 The Health Care Financing Administration (now the Center for
Medicare and Medicaid Services) released the first publicly disseminated provider report
cards in 1984. These reported hospital mortality rates for a wide range of conditions and
procedures. The HCFA report cards were not well received, due in part to concerns
about risk adjustment, and were dropped by 1992.
In December 1990, New York State published the first comprehensive hospital
cardiovascular surgery report cards. As with the HCFA reports, New York uses mortality
2 For example, see Dranove et al. (2003).
3
as its measure of quality. Their risk adjustments are based on highly detailed clinical
data. Although the New York report cards represent the state-of-the-art, they are not
immune from gaming by providers, for example by admitting patients who are healthier
than average in ways that are not measured by the statisticians preparing the reports.3
Such gaming would not necessarily alter the rankings of hospitals, however, and
therefore might not diminish the value of report cards to patients. From their outset, the
New York report cards were well-publicized with coverage in The New York Times and
other regional papers (Altman, 1990; Altman, 1992; Davis, 1992; Smith, 1990).
Moreover, there was coverage in medical journals such as the Journal of the American
Medical Association, indicating that referring physicians may have learned of the reports
even if their patients did not (Hannan et al., 1990).
3. Previous Literature
Numerous researchers have attempted to study the effects of report cards on
market shares. Unless otherwise mentioned, none of these studies account for patient
prior beliefs.
Mennemeyer et al. (1997) examined the effects of the report cards published by
HCFA between 1986 and 1992. They found that hospitals with higher than expected
mortality rates (where the expectations were based on patient characteristics, not market
perceptions of quality) experienced almost no effect on market share, but that press
reports of unexpected deaths had a substantial impact on market share.
Romano & Zhou (2004) examined the effect of New York and California hospital
report cards. They estimated volumes using discharge data prior to the first published
3 Dranove et al. (2003).
4
date of the report cards and used their model to predict volume for the post-report card
time periods. They found that the report cards had minimal effect on volumes.
Cutler et al. (2004) examined hospital volume in New York following the
introduction of cardiac care report cards. They find that hospitals receiving a high-
mortality flag experienced a decrease in volume relative to other hospitals.
Pope (2006) studies the effects of rankings in US News and World Reports, which
ranks a small minority of hospitals in each market. Pope estimates demand as a function
of both the continuous measure of quality reported by US News and the discrete ranking,
and finds that changes in discrete rankings affect patient choice, even after controlling for
continuous quality.
Mukamel et al.‘s (2004/2005) study of surgeon report cards is the first study that,
to our knowledge, recognizes the potential importance of prior beliefs. They assume that
patients base their prior beliefs about a surgeon‘s quality on observable characteristics
including years of experience, the surgeon‘s hospital, Medicare participation, and the
copayment rate. In their ad hoc specification, the key predictor variable is the ―residual‖
risk adjusted mortality rate (RRAMR) – the difference between the actual rate and that
predicted by the observable characteristics. They find that RRAMR predicts changes in
market share after two years (but not after one year).
Three studies of payer report cards also account for prior beliefs. Chernew et al.
(forthcoming) study a health insurance report card program for employees of General
Motors. They estimate models of employee choice of health plan prior to the report
cards. The model includes plan characteristics as well as plan-specific fixed effects (i.e.,
plan indicator variables.) The fixed-effects capture general employee assessments of
5
quality, holding other factors constant. They found that prior beliefs about quality were
an important predictor of post-report card market shares. The report cards themselves
had only a small effect on the market shares of the plans involved, once prior beliefs were
controlled for.
Dafny and Dranove (2005) study Medicare HMO report cards. They show that
plans receiving high marks on the Medicare & You report cards were gaining share prior
to its release in 2000. Even so, the publication of the report card in Medicare & You led
to further gains in market share for high scoring plans.
Jin and Sorensen (2006) study health plans rated by the National Committee for
Quality Assurance. They assume that ratings are correlated with patients‘ prior beliefs,
and take advantage of the fact that some ratings were not publicized to control for this
correlation. They find that the public ratings had a significant impact on patients‘
choices.
4. Why Report Cards?
The additional information afforded by report cards might provide two critical
benefits:4
(B1) Report cards could enable patients to find the providers who best meet their
needs
(B2) Report cards could motivate providers to improve their report card scores
4 Dranove et al. (2003). That paper suggests that providers could improve their scores through selective
choice of patients, but does not rule out that in the long run providers can best improve their scores by
improving underlying quality. We implicitly take the more optimistic view in this paper, namely that better
report card scores reflect better underlying quality.
6
Most previous studies of provider report cards found little evidence that patients were
responding. One might pessimistically conclude that report cards are failing to generate
the desired benefits.
But suppose that report cards have the following two outcomes:
(O1) At those hospitals where report cards comport with prior expectations, there
is no movement of market share;
(O2) At those hospitals where the report cards provide news about quality, there is
movement in market share.
If outcome O2 is the norm then researchers will document a significant report card effect
on market shares and would conclude that benefits B1 and B2 will both be realized.
What if outcome O2 is the exception rather than the rule? Although researchers would
fail to document a report card effect, it would be premature to conclude that report cards
offered no benefits. Consider that each individual hospital will still expect to gain share
if it could boost its quality above prior expectations (and will avoid losing share by
preventing quality from slipping below expectations.) Thus, if we can document that O2
occurs, even infrequently, then report cards will generate benefit B1 for some patients
and benefit B2 for all patients.
To sort out these issues, we develop a model of patient choice of hospital in which
patients use Bayesian updating to evaluate hospital quality after the release of report
cards. If the report card scores are consistent with prior beliefs, patients do not update
their relative rankings of hospitals and market shares are unchanged. But if a particular
hospital‘s report card score is out of line with prior beliefs, then patients will revise their
ranking of that hospital and its market share will change. Moreover, the extent to which

7
patients revise their rankings should depend on the relative precision of their prior
rankings and the report card scores.
4. Model
In this section we present a highly stylized model that shows how to incorporate
prior beliefs into estimates of the impact of report cards. This approach is similar to that
of Chernew et al. (forthcoming), although the empirical implementation is somewhat
different. Suppose that an individual i who visits hospital j expects to obtain utility Uij
based on their expectation of the hospital‘s quality Qj, their travel time, Tij, and a random
component ηij distributed according to the type-I extreme value:
(1) Uij = β0 + Qj + βxTij + ηij
With no independent information about quality Qj, the researcher can estimate equation
(1) using a conditional choice model incorporating hospital fixed effects. The
coefficients on the fixed effects will be estimates of the Qj‘s. Note that these estimates
may incorporate information from report cards that have already been released. As our
empirical work focuses on the initial impact of the first report cards, we will refer to a
―pre‖ period in which Qi is based on other sources of information besides report cards,
and a ―post‖ period in which consumers update their beliefs based on the release of the
report cards. Our model may be applied more generally, however, to assess how
information from updated report cards further affects consumer demand.
We assume that in the ―pre‖ period before report cards, consumers have an initial
estimate of Qj. This estimate is normally distributed with mean Hj and precision τH.

8
Thus, the expected utility of visiting a hospital j prior to learning the report card score is
given by:
(2) Uijpre
= β0 + Hjpre
+ βxTij + ηij
In the ―post‖ period, consumers learn the report card score Rj. They believe that
this is a normally distributed measure of quality Qj with mean Rj and precision τR. Thus,
a Bayesian consumer will update their expected belief about quality and their expected
utility will now equal:
(3) Uijpost
= β0 + λHjpost
+ (1-λ)Rj + βxTij + ηij
where λ = τH/(τH+τR)
We can rearrange terms in (3) to obtain:
(4) Uijpost
= β0 + Hjpost
+ (1-λ)(Rj - Hjpost
) + βxTij + ηij
This is our main estimation equation.
We obtain estimates of the Hj‘s from equation (2) using a conditional choice
model incorporating hospital fixed effects and hospital specific trends (in case
information about quality is disseminating prior to the release of report cards. See Dafny
and Dranove; 2005.) The coefficients on the fixed effects and trends will, in effect,
provide estimates of the Hj‘s.
Most prior models estimate an equation like:
(5) Uijpost
= β0 + Hj + βRRj + βxTij + ηij
The key difference between equation (5) and our specification is that, in equation (5),
beliefs about hospital quality are assumed to be the same in the pre- and post-periods.
Our model reflects the fact that, due to changes in demographics and information,
patients‘ beliefs about hospital quality would have changed somewhat regardless of
9
whether report cards were released. Equation (5) does not capture the changes in beliefs
that occurred independently of the report card issue, and thus could potentially lead to
incorrect conclusions. 5
In Mukamel et al. (2004/2005), patients have prior beliefs about mortality in
particular rather than overall quality and update this belief when they receive the report
card scores. Mukamel et al. then estimate a variant of our equation:
(6) Uijpost
= β0 + βhf(hj) + βR(Rj – f(hj)) + βxTij + ηij
where hj is a vector of observable provider characteristics. Unfortunately, Mukamel et al.
do not have a large or compelling set of variables to include in hj and they do not report
the first stage model f(hj). Thus, it is difficult to ascertain whether f(hj) differs
appreciably from the mean of R for the population. Note also that if one allows for other
dimensions of quality besides mortality, then it is straightforward to show that the correct
structural specification includes provider fixed effects. We estimated this alternative
model as developed by Mukamel et al. and obtained an insignificant coefficient on Rj –
f(hj).
5. Data and Methods
Our data come primarily from New York state hospital inpatient records for the
years 1989 to 1991. Data from 1990-1991 were collected as part of the Healthcare Cost
and Utilization Project State Inpatient Databases (SID). Data from 1989 were collected
as part of New York State‘s SPARCS program. The two data sources are equivalent:
they are collected from the same hospital records and contain the same information. The
5 Pope (2006) uses discontinuity analysis. Both the ―pre‖ period measure of quality and the ―post‖ period
measure of report card news (the discretized ranking) are derived from the information used to construct
the report card.
10
data include diagnoses, procedures performed, hospital identifiers, and basic patient
demographics for all patients in the state. We focus on cardiac surgery (specifically
coronary artery bypass graft, or CABG). New York State first released risk-adjusted
hospital CABG mortality rates in December of 1990. Details about these report cards
may be found in Mukamel et al. (2004/2005). The time period we have selected allows
us to observe patient choices before and after the introduction of the report cards and
does not require us to make some assessment of how much additional news is afforded by
each additional report card.
We restricted our sample to the 18 hospitals in the New York City metropolitan
area and to the patients from the counties in this area. This market is well-defined
geographically and contains enough hospitals in close proximity that the travel time
effect will not overwhelm the quality effect. Our sample consists of all New York-area
patients who underwent CABG surgery between 1989 and 1991. In all, this sample
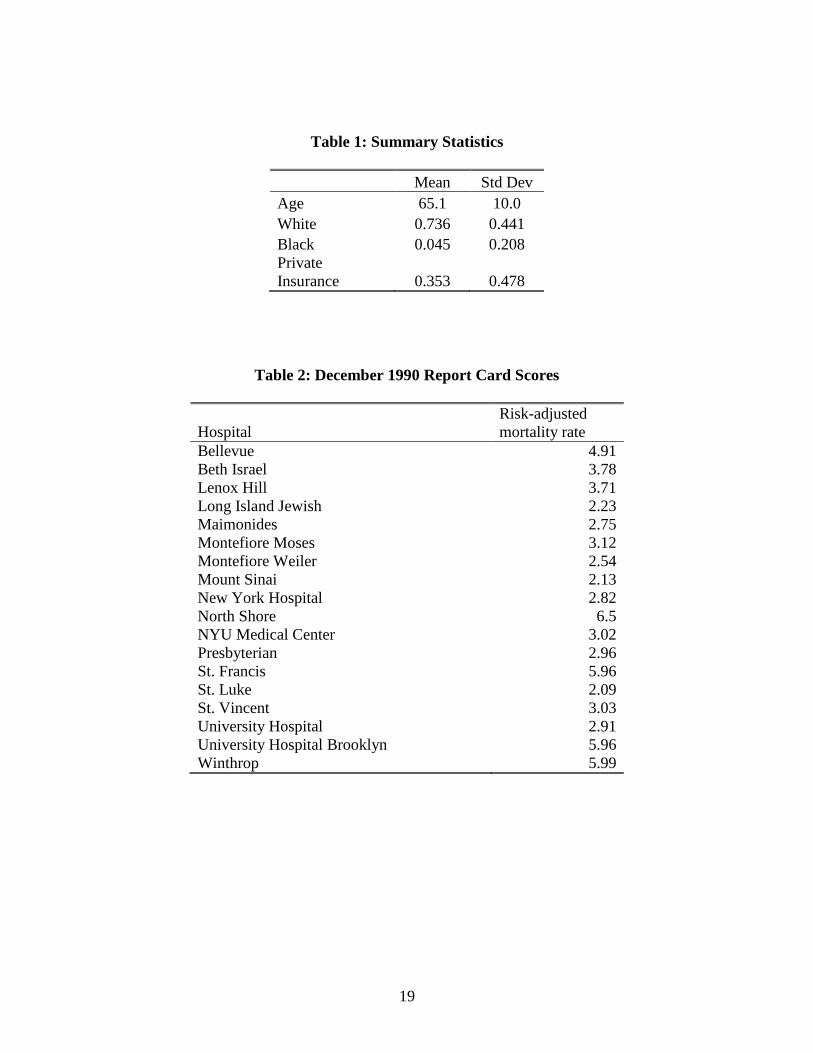
contains 6,978 patients in 1989, 7,916 patients in 1990 and 8,960 patients in 1991. Table
1 provides summary statistics for the variables used in our analysis and Table 2 presents
the 1991 report card scores for the 18 hospitals.
We estimate our model in two steps. We first estimate equation (2) to obtain
unbiased estimates of the Hj‘s, using data from the pre-period only (in this case, 1989-
1990). In this estimate, we interact the hospital fixed effects with the following patient
characteristics: age, sex, race, and insurance status (private insurance and Medicaid
indicators). We also add a hospital-specific trend, a squared trend term, and the
interaction of the patient characteristics with the trend term. To increase the precision of
the model, we use a six-month time period for the trend, which also allows us to identify
11
the square trend term. The trend accounts for the possibility that the hospitals that gained
market share in 1991 were already trending upwards in market share prior to the release
of the report cards. Chernew et al. (forthcoming) also estimate prior beliefs in a first
stage; however, since they only have two years of data, they account for potential trends
in types of insurance plan (rather than trends in actual plan enrollment) using data from
outside sources.
We compute the average value of Hj separately by year for each demographic
group. Thus, we allow for the fact that different demographic groups may have different
initial beliefs about hospital quality. To calculate the 1991 value of Hj, we extend the
hospital-specific trends (main effects and interactions with demographics) estimated in
the first stage. In order to solve the practical problem that the fixed effects and report
card scores are not measured on the same scale, we convert the demographic-specific
Hj‘s to Z-scores Hjz. Likewise we convert the report card scores to Z-scores Rjz and then
take the difference. We then estimate equation (4) using the normalized difference Rjz-
Hjz and incorporate hospital fixed effects interacted with patient demographics.
Confidentiality restrictions prevent us from reporting the normalized prior beliefs
for each hospital. We can report that the overall correlation between the scores is 0.11,
suggesting that prior beliefs generally do not reflect true hospital quality. The differences
between these scores also show that the level of news (i.e. the difference between prior
belief and report card score) can be very different from the absolute report card score.
While the mean difference is -0.02, the differences range from -1.95 to 1.70. This
underscores the importance of accounting for prior beliefs.
12
This procedure implicitly assumes that patients assign the same value of λ – the
weight given to the priors relative to the report cards – to all hospitals. This may seem
inappropriate inasmuch as the precision of the report card scores is roughly inversely
proportional to √n, where n is the number of surgeries performed, and n varies markedly
across hospitals.6 But it is also the case that the precision of the priors is roughly
inversely proportional to volume. This implies that λ, which reflects the relative
precision of the two scores, should also be roughly independent of volume. Even so, we
tried several specifications in which λ varied with n or √n. Consistent with the above
argument, we obtained the best fit with unweighted regressions, which we report below.
6. Results
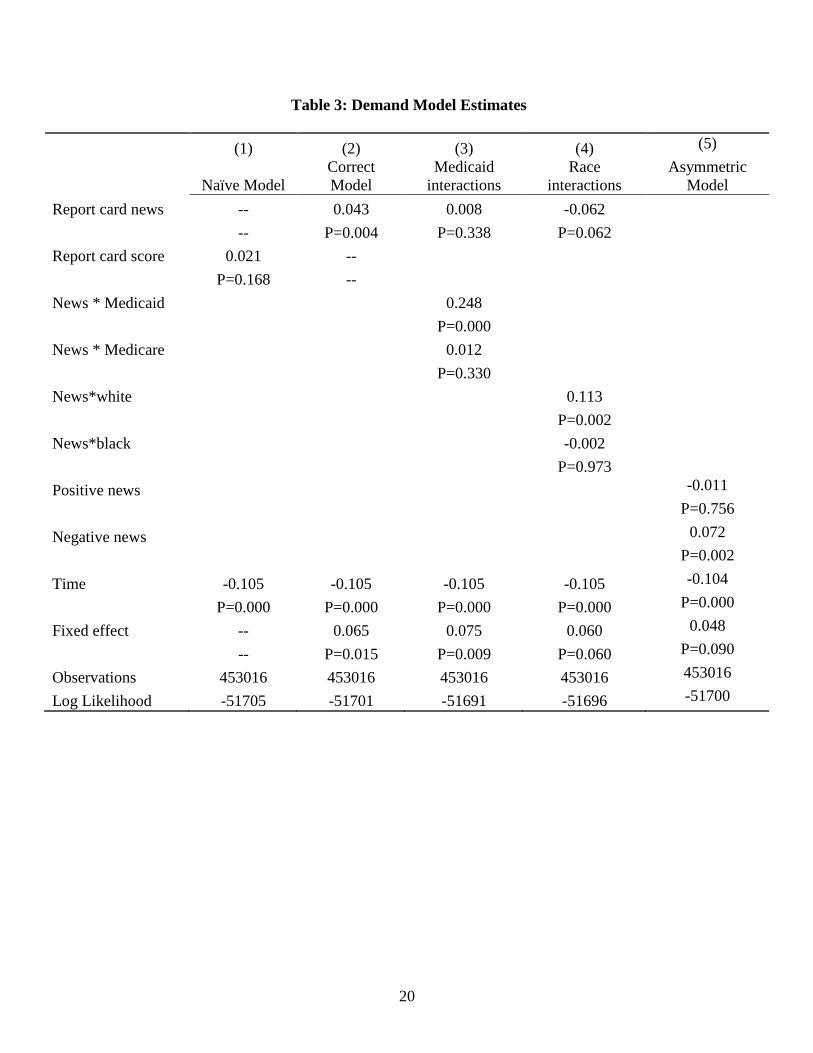
Table 3 contains the estimate of equation (4). For comparison sake, we also
include an estimate of ―naïve‖ equation (5). Both models include interactions between
age, race, sex, and private insurance and the hospital fixed effects. We also include the
travel time to the hospital, the travel time interacted with patient characteristics, and the
estimated fixed effect by hospital and year. Because these hospital-year effects were
estimated in a previous step, we adjusted the standard errors of the coefficients to reflect
the two-stage design (see Murphy & Topel, 1984). Table 3 shows that even though
report card scores, by themselves, seem to be uncorrelated with changes in market share,
changes in share are statistically significantly affected by positive report card news.
When report card scores are news, the scores matter.
6 The state of New York did not report standard errors of their report card scores but did report asymmetric
confidence intervals. The width of the confidence intervals is roughly inversely proportional to the square
root of the number of surgeries.
13
In alternative models, we interacted the news variable with patient demographic
characteristics. We show the interactions with Medicaid and Medicare, and with white
and black race. The interactions with insurance status show that Medicaid patients are
more responsive to report card scores than privately insured patients. The total effect of
report cards on Medicare patients is insignificant, indicating that Medicare patients are
not responding to the news in these report cards. In the model with race interactions, the
coefficient on the interaction of the report card with white race is significant, while the
report card*black interaction is insignificant. The total effects follow the same pattern:
the overall effect of report cards is positive and significant for whites and insignificant for
blacks. The insignificant coefficient on the main effect indicates that report cards do not
have a significant effect on patients of other races.
In an additional analysis, we split the report card news into positive and negative
news to determine if the response to news is symmetric. The ―asymmetric model‖ results
in Table 3 show that negative news makes respondents less likely to choose a hospital,
but positive news does not have a significant impact. This result is similar to that found
by Scanlon et al. (2002) in regard to HMO quality report cards. That paper found that
individuals were more likely to avoid plans with negative reports, but not more likely to
seek out plans with positive reports.
To interpret our results, we computed the predicted change in demand at two
hospitals with very positive news and two with very negative news. Using the result
from model (2), we calculate that the report card information increased the combined
annual number of patients at the two ―best news‖ hospitals by about 28 (about 6 percent
of the baseline number of patients) and decreased the number of patients at the two

14
―worst news‖ hospitals by about 42 (about 7.5 percent). Using the results of the
asymmetric model (5), the two worst hospitals experienced a decrease of about 64
patients as a result of the report cards.
7. What is an Improved Report Card Score Worth?
The results of model (5) indicate that a hospital receiving negative news can
expect to gain approximately 7 percent in market share for each one standard deviation
increase in report card score. To get a feel for what a good report card is worth, consider
a hospital that currently performs 500 surgeries, was perceived to be two standard
deviations below average in quality, but receives a mean report card score. That hospital
would perform an additional 70 surgeries as a result of the report card. Currently,
Medicare pays hospitals in New York City approximately $40,000 for performing open
heart surgery. Private insurers generally pay slightly more than this; Medicaid somewhat
less. If we assume that half of this payment represents incremental profit,7 then the report
card improvement would generate $1.4 million in incremental profits.
Now consider the welfare effects of quality improvement at this hypothetical
hospital. Suppose that the quality news reflected by the two standard deviation
improvement in the report card score is genuine – surgical mortality is 2.9 percent lower
than what would have been expected given prior beliefs about quality. Given a baseline
of 500 surgeries, this translates into 14 fewer deaths. If we conservatively peg the value
of a life at $1 million, then this amounts to a benefit of $14 million, which is 10 times
larger than the extra profit reaped by the hospital. This suggests that unless the patient
7One study suggesting that variable costs are approximately half of total costs is Friedman and Pauly
(1981). This is generally confirmed by examining direct and indirect costs reported on hospital financial
statements.
15
response to report cards increases dramatically, they will fail to provide sufficient
incentives for hospitals to make optimum socially investments in quality.
8. Conclusions
In this study, we showed that when hospital report cards provide information that
differs from patients‘ prior beliefs, patients respond to this information by moving to
higher-quality hospitals. We also showed that this effect is primarily due to shifting
away from hospitals with negative news, rather than shifting towards hospitals with
positive news. This finding may explain why hospital executives with whom we have
spoken indicate that their hospital governing boards pay considerable attention to poor
report card scores cards.8 Board members may simply want to avoid the stigma of low
quality, or may fear (correctly as our results suggest) that poor report card scores might
cause a loss in market share.
Our findings suggest that hospital report cards are not a wasted effort—they do
provide a valuable service to patients. Even so, patients currently value report card
improvements far less than the implied increases in the value of life. And while hospitals
can prosper from reducing mortality and improving their scores, the financial gains again
are dwarfed by the increased value of life. As a result, report cards alone cannot provide
hospitals with optimal incentives to improve quality.
Our study improves on the work of Mukamel et al. (2004/2005) by deriving a
model of patient response to new information from first principles and using this model
8 Dranove has spoken about report cards at several conferences attended by hospital executives, where they
have expressed these views.

16
to more completely account for patients‘ prior beliefs. Thus, our study paints a more
complete and accurate picture of the effects of hospital report cards.
While our study suggests that hospital report cards do help patients seek out
higher quality care, we do not address several issues. First, there is a direct cost of
collecting, analyzing, and publishing the report card information. We do not address
whether this cost is justified in terms of the effect on patients‘ choices. Second, we focus
on the year immediately after publication of report cards. There was considerable
publicity given to the initial release. It is not obvious whether subsequent report cards
will have a diminished effect (less publicity) or stronger effect (greater acceptance).
Finally, as Dafny and Dranove (2005) point out, hospitals may attempt to game the
system by refusing to treat high-risk patients. Policy-makers should take all of these
issues into account when evaluating the effectiveness of the report card program.

17
References
Altman, Lawrence (1990). ―Heart-surgery death rates decline in New York.‖ The New
York Times, December 5, sec. B.
Altman, Lawrence (1992). ―Surgical scorecards: Can doctors be rated just like
ballplayers?‖ The New York Times, January 14, sec. C.
Chernew, Michael; Gowrisankaran, Gautam; Scanlon, Dennis (2004). ―Learning and the
value of information: The case of hospital report cards.‖ Working paper.
Cutler, David; Huckman, Robert; Landrum, Mary Beth (2004). ―The role of information
in medical markets: An analysis of publicly reported outcomes in cardiac
surgery.‖ American Economic Review 94: 342-346.
Dafny, D. and D. Dranove, (2005). ―Do Report Cards Tell Patients Anything They Don‘t
Already Know? The Case of Medicare HMO Report Cards. NBER Working
Paper #11420.
Davis, Henry (1992). ―Heart surgery mortality declines 36% across state; improvement
in WNY matches the average.‖ Buffalo News December 9, local section.
Dranove, David; Kessler, David; McLellan, Mark; Satterthwaite, Mark (2003). ―Is more
information better? The effects of ‗report cards‘ on health care providers.‖
Journal of Political Economy 111 (3): 555-588.
Friedman, B. and M. Pauly (1981). ―Cost Functions for a Service Firm with Variable
Quality and Stochastic Demand: The Case of Hospitals‖ Review of Economics
and Statistics 63(4): 620-24.
Hannan, EL; Kilburn, H; O‘Donnell, JF; Lukacik, G; Shields, EP (1990). ―Adult open-
18
heart surgery in New York state: An analysis of risk factors and hospital mortality
rates.‖ Journal of the American Medical Association 264 (21): 2768-2774.
Jin, GZ; Sorenson, AT (2006). ―Information and consumer choice: the value of
publicized health plan ratings.‖ Journal of Health Economics 25: 248-275
Marshall, Martin; Shekelle, Paul; Leatherman, Sheila; Brook, Robert (2000). ―The public
release of report card data: What do we expect to gain? A review of the
evidence.‖ JAMA 283 (14): 1866-1874.
Mennemeyer, ST; Morrisey, MA; Howard, LZ (1997). ―Death and reputation: how
consumers acted upon HCFA mortality information.‖ Inquiry 34(2):117-28.
Mukamel DB; Weimer DL; Zwanziger J; Gorthy SF; Mushlin AI (2004/2005). ―Quality
report cards, selection of cardiac surgeons, and racial disparities: a study of the
publication of the New York State Cardiac Surgery Reports.‖ Inquiry 41:435-46.
Murphy, KM; Topel, RH (1984). ―Estimation and Inference in 2-Stage Econometric
Models.‖ Journal of Business and Economic Statistics 3:4 (370-379).
Pope, D. (2006). ―Reacting to Rankings: Evidence from ‗America‘s Best Hospitals and
Colleges‘‖ Ph.D. Dissertation, University of California, Berkeley.
Romano, PS; Zhou, H (2004). ―Do well-publicized risk-adjusted outcomes reports affect
hospital volume?‖ Medical Care 42 (4): 367-377.
Scanlon, D; Chernew, M; McLaughlin, K; Solon, G (2002). ―The impact of health plan
report cards on managed care enrollment.‖ Journal of Health Economics 21 (1):
19-41.
Smith, Amber (1990). ―Hospital has high death rate from heart surgery.‖ The Post-
Standard (Syracuse) December 5, sec. A.
19
Table 1: Summary Statistics
Mean Std Dev
Age 65.1 10.0
White 0.736 0.441
Black 0.045 0.208
Private
Insurance 0.353 0.478
Table 2: December 1990 Report Card Scores
Hospital
Risk-adjusted
mortality rate
Bellevue 4.91
Beth Israel 3.78
Lenox Hill 3.71
Long Island Jewish 2.23
Maimonides 2.75
Montefiore Moses 3.12
Montefiore Weiler 2.54
Mount Sinai 2.13
New York Hospital 2.82
North Shore 6.5
NYU Medical Center 3.02
Presbyterian 2.96
St. Francis 5.96
St. Luke 2.09
St. Vincent 3.03
University Hospital 2.91
University Hospital Brooklyn 5.96
Winthrop 5.99
20
Table 3: Demand Model Estimates
(1) (2) (3) (4) (5)
Naïve Model
Correct
Model
Medicaid
interactions
Race
interactions
Asymmetric
Model
Report card news -- 0.043 0.008 -0.062
-- P=0.004 P=0.338 P=0.062
Report card score 0.021 --
P=0.168 --
News * Medicaid 0.248
P=0.000
News * Medicare 0.012
P=0.330
News*white 0.113
P=0.002
News*black -0.002
P=0.973
Positive news -0.011
P=0.756
Negative news 0.072
P=0.002
Time -0.105 -0.105 -0.105 -0.105 -0.104
P=0.000 P=0.000 P=0.000 P=0.000 P=0.000
Fixed effect -- 0.065 0.075 0.060 0.048
-- P=0.015 P=0.009 P=0.060 P=0.090
Observations 453016 453016 453016 453016 453016
Log Likelihood -51705 -51701 -51691 -51696 -51700