Embed Size (px)
Citation preview

1
FINAL REPORT
HOSPITAL EPISODE STATISTICS AND
REVALIDATION
Creating the evidence to support revalidation
09 January 2013
ROYAL COLLEGE OF SURGEONS OF ENGLAND
FUNDED BY THE ACADEMY OF MEDICAL ROYAL COLLEGES
CONTACT DETAILS
Amundeep Johal
Clinical Effectiveness Unit
Royal College of Surgeons of England
Tel 020 7869 6628
Email [email protected]

2
PROJECT BOARD
Dr Jane Adam – Royal College of Radiologists
Mr Ben Bridgewater – Society for Cardiothoracic Surgery in Great Britain and Ireland
Mr Mark Emberton – British Association of Urological Surgeons
Professor Peter Gaines – British Society for Interventional Radiology
Professor Michael Horrocks – Association of Surgeons of Great Britain and Ireland
Mr Tim Lees – Vascular Society of Great Britain and Ireland
Dr Peter Ludman – British Cardiovascular Intervention Society
Mr David Mitchell – Vascular Society of Great Britain and Ireland
Dr Heather Payne – Faculty of Clinical Oncology
Dr Simon Ray – British Cardiovascular Society
Professor John Williams – Royal College of Physicians
PROJECT STAFF – CLINICAL EFFECTIVENESS UNIT, ROYAL COLLEGE OF
SURGEONS OF ENGLAND – LONDON SCHOOL OF HYGIENE AND TROPICAL
MEDICINE
Dr Amundeep Johal – Quantitative Analyst/Statistician
Dr David Cromwell – Senior Lecturer in Health Services Research
Dr Jan van der Meulen – Professor of Clinical Epidemiology
3
Contents
Summary and recommendations ................................................................................................ 4
1. Background ............................................................................................................................ 7
2. Aims and Objectives .............................................................................................................. 9
3. Rapid literature review of Hospital Episode Statistics database to describe health care
processes and their outcomes ................................................................................................... 10
4. Case studies of outcome indicators defined by specialist societies ..................................... 23
5. Overview of clinical databases ............................................................................................ 34
6. Use of Hospital Episode Statistics to investigate abdominal aortic aneurysm surgery in
England .................................................................................................................................... 39
7. Comparison of HES with clinical databases of the Society for Cardiothoracic Surgery and
the British Cardiovascular Intervention Society ...................................................................... 47
8. Disease-specific indicators ................................................................................................... 61
Reference List .......................................................................................................................... 68

4
Summary and recommendations
Background This report outlines the results of a project which started in September 2009. The project‟s aim was to
assess the strengths and weaknesses of using administrative data for revalidation in the areas of
ischaemic heart disease, urological malignancies, and peripheral vascular disease. We distinguished
between procedure-specific indicators and disease-specific indicators as well as between hospital-
specific and consultant-specific outcomes.
Results A rapid literature review of studies that used administrative databases in the UK to describe
procedures and outcomes in the three defined disease areas was carried out. The results of this
literature review are presented in chapter 3. 35 studies reported in the peer-reviewed literature were
retrieved. These were all carried out in England and used the Hospital Episode Statistics database
(HES), an administrative database of all admission to the English NHS. Most identified studies
focused on procedures. None reported clinician-specific results. In-hospital mortality and length of
stay were the most frequently used outcomes. The majority of studies used some form of risk
adjustment that included at least age and sex.
A number of case studies based on HES data are presented in chapter 4. These studies used indicators
for the purpose of revalidation defined by surgical specialist societies (Society for Cardiothoracic
Surgery, British Association of Urological Surgeons, and Association of Surgeons of Great Britain
and Ireland). We found that only a few of the defined indicators were fit for purpose. Important
limitations were related to the indicators‟ validity (i.e. ability to distinguish between good and bad
quality), statistical power (i.e. number of procedures and number of relevant events), fairness (i.e.
ability to adjust for potential differences in case mix), and adequacy of coding specification (i.e.
coding of diagnoses and procedures).
In chapter 5 we present an overview of national clinical databases that were available in 2010
covering any of the three clinical areas. We demonstrated that only the databases from the Society for
Cardiothoracic Surgery (SCTS) and the British Cardiovascular Intervention Society (BCIS) had levels
of case ascertainment and data completeness deemed high enough to justify a comparison with HES.
Extracts of these databases were received from the SCTS in late 2010 and from BCIS in spring 2011.
The results of the analyses of these databases are described in chapter 7.
A case study of the accuracy of HES coding used for patients undergoing abdominal aortic aneurysm
repair(AAA), presented in chapter 6, demonstrated a high level of consistency between diagnostic and
procedure codes which supports the use of administrative data for the purpose of revalidation. Of the
patients undergoing AAA surgery for example, 94.9% had a consistent diagnosis of ruptured or an
unruptured aneurysm. This study highlighted the importance of a detailed scrutiny of the codes
before HES is to be used for revalidation.
In chapter 7, we describe the comparison of HES with SCTS data on coronary artery bypass graft
(CABG) procedures and with BCIS data on percutaneous coronary interventions (PCIs). There was
considerable agreement in the numbers of CABG procedures recorded in HES and in the SCTS
database as well as in the corresponding mortality results. This was true both at NHS trust and at
consultant level. There was no clear pattern that could explain the observed differences. In some
NHS trusts, more CABG procedures were recorded in HES than in the SCTS database whereas the
reverse was true in some other trusts. A similar pattern was observed for the mortality results. A
remarkable result in our view is that performance of the risk adjustment models for mortality after
CABG procedures developed in HES and in SCTS data was very similar.

5
We found larger differences between the numbers of PCI procedures recorded in HES and in the
BCIS database than when comparing HES with the SCTS database. It seemed that there was under-
recording of PCI procedures in HES by about 10%. Also, the differences in the mortality results
according to BCIS and HES in individual NHS trusts were larger. The mortality differences went in
both directions which indicated that there was no systematic under- or over-recording of mortality in
either BCIS or HES data.
These results give some support for the use of HES data to measures the outcome of CABG
procedures. However, HES-based indicators should not be used for PCIs as there were substantial
differences between the numbers of procedures and the mortality results according to HES and BCIS
data. In addition, the risk adjustment with HES data was less accurate than with BCIS data.
Disease-specific indicators can only be developed if patients can be identified from the time of
diagnosis or from another time-defining event in the course of the disease. In chapter 8, we
demonstrate how patients with prostate cancer could be followed up from the time of diagnosis
through linkage with Cancer Registry data. We found that the linkage rates between HES and Cancer
Registry data are high as 95% of Cancer Registry records could be linked to HES. However, the
completeness of staging data in the Cancer Registry data is very poor and consequently our ability to
adjust for case mix is limited. In the two other disease areas, ischaemic heart disease and peripheral
vascular disease, it was not possible to develop disease-specific indicators as we could not identify
patients at the time of diagnosis.
Discussion The aim of this project was to assess the value of HES data for the purpose of revalidation. The
results summarised above indicate that there is no single answer to this question as it will depend on
the clinical area, the condition and procedure that are involved, and the specific indicator that is used
to evaluate performance. For that reason, we propose a checklist that can be used for the evaluation
of newly proposed indicators.
For the purpose of revalidation, it is key that indicators can be linked to individual consultants. The
analyses described in this report compare results based on HES and those based on clinical databases.
We found for example that the number of CABG procedures carried out by individual consultants
according to HES agreed well with the corresponding number according to SCTS data and that
relatively large differences between consultant-specific numbers based on HES and SCTS were
confined to two hospitals. However, we could not investigate in other clinical areas to what extent the
consultants responsible for the procedure were accurately identified in HES.
A further limitation of the value of HES data for revalidation is that it is difficult to determine the
nature and severity of a patient‟s condition based on HES data alone. Using patients undergoing a
PCI as an example, HES cannot distinguish between patients with ST-elevated myocardial infarction
and those with non-ST elevated myocardial infarction. This may be one of the explanations for
discrepancies between results based on HES and clinical data.
Recommendations Performance indicators based on HES should only be used for the purpose of revalidation if they
are carefully developed and if their suitability for this purpose has been demonstrated.
An explicit and step-wise coding framework should be used to develop and evaluate diagnostic
and procedure codes when HES data are going to be used for revalidation. The following steps
are recommended:
o Specification of potentially relevant diagnostic and procedure codes
o Exploration of frequency with which these codes are used in practice
o Checks of the consistency of diagnostic, procedure and administrative codes
o Evaluation of coding practice at individual NHS trusts or hospitals
6
o Final adjustments of the specification of the diagnostic and procedure codes informed by
the preceding steps.
The suitability of indicators needs to be evaluated before they are recommended for the purpose
of revalidation. This requires feasibility studies that should look at:
o The validity of the indicators
o The statistical power to detect divergent performance
o The fairness of the proposed comparison and the risk adjustment approach
o The adequacy of the coding of the diagnoses and procedures.
We developed an explicit checklist that can be used to evaluate these criteria. The above-listed
criteria can only be met if data completeness and data quality are at an appropriate level.
Data linkage with external data is needed to allow HES data to be used for disease-specific
indicators. External data can provide the time of diagnosis or another time-defining event so that
all patients can be followed-up from the same time point in the course of their disease.
It is essential to choose the appropriate level of analysis, especially for disease-specific indicators.
The indicator should be linked to a unit that has control over aspects of care or outcomes that are
measured by the indicator.1
The development of consultant-specific indicators does not differ fundamentally from the
development of hospital-specific indicators. However, special considerations should be given to:
o The statistical power because number of patients treated by individual consultants can be
low
o The accuracy with which the responsible consultant can be identified in HES is
unresolved. Given that it is crucial that indicators can be linked to individual consultants,
this is an important area for further investigation.
o The shared responsibility of the care for patients among colleagues or among members of
a multidisciplinary team can make it difficult to link indicators to individual clinicians.
1 For example, NHS trusts and their consultants have only a limited influence on how many patients with
prostate cancer will have a radical prostatectomy as they can only see patients who are referred to them. The
most appropriate level of analysis for this indicator is therefore the Primary Cancer Trust (PCT) or the Cancer
Network area in which the patients live.

7
1. Background
It was highlighted in the Chief Medical Officer‟s report Good Doctors, Safer Patients (DH 2006)1 that
patients would like to see outcomes of their treatment as part of the evidence required for doctors to
demonstrate that they remain fit for practice. As a result, the General Medical Council (GMC)
introduced the revalidation process. The revalidation will commence in late 2012.
The process of revalidation was initially set up in two parts: “re-licensing” for practicing doctors
requiring them to demonstrate that they continue to practice in accordance with GMC standards, and
“recertification” for practising doctors on the GMC‟s specialist register requiring them to demonstrate
their fitness-to-practice as a specialist. These two parts are now combined into one process with
revalidation mainly based on standards set by the Royal Colleges.
In this final report, we present the results of a project that aimed to assess the value of the Hospital
Episode Statistics (HES) database to support the process of revalidation. The rationale to focus on the
value of administrative data is that its use would not place an additional burden on the NHS.
There have been reports in the media and in medical journals that questioned the quality of HES
data,2,3
whereas others have demonstrated the opposite.4 This in turn has led to concerns from
consultants about the appropriateness of HES for measuring their individual performance. Some of
the issues raised include problems with the accuracy and completeness of diagnosis and procedure
coding as well as the lack of clinical detail that is being recorded in the HES database.
However, the accuracy and completeness of HES data is thought to vary between clinical specialties.
For example, data quality will depend on whether care involved acute or long term conditions,
whether data items capture elements of the care process or outcomes, or whether outcomes being
measured become apparent in or out of hospitals. It is important for each specialty to assess the value
of HES data for revalidation in its own area. Therefore, we carried out a literature review and a
number of case studies in three clinical areas:
ischaemic heart disease
peripheral vascular disease
urological malignancy
These areas were chosen as it was envisaged that the findings from these areas would be applicable
across other surgical and medical specialties. Also, information on the treatment and outcomes of
patients in these areas is currently being collected in HES and in clinical databases. The latter is
especially important as it allows a direct comparison between results derived from HES and from
other data sources.
Another consideration to explore in these areas was that the Society for Cardiothoracic Surgery
(SCTS), Association of Surgeons of Great Britain and Ireland (ASGBI) and British Association of
Urological Surgeons (BAUS) had outlined lists of outcome indicators based for the purpose of
revalidation based on routinely collected data. These lists include outcomes such as length of stay,
postoperative mortality, readmission, and return to theatre (RTT).
Procedure-specific and disease-specific indicators In this project, we were required to distinguish between procedure-specific and disease-specific
indicators. Procedure-specific indicators compile and summarise data on outcomes of patients
undergoing a specific procedure. Disease-specific indicators do the same but for patients from the
time of a specific diagnosis (or another time-defining event in the course of the disease). Disease-
specific indicators reflect the impact that all clinical specialties involved in the treatment have on
patient outcomes along a disease pathway.

8
It was thought that the development of disease-specific indicators could provide an accessible
representation of the outcomes for individual clinicians as well as for “clinical teams”. At the same
time, it was noted that when disease-specific indicators are used it is more complicated to define the
patient population as well as the timing of their follow-up. It will also be more difficult to relate
disease-specific metrics to individual clinicians given that a number of clinicians may have been
responsible for different aspects of care during a patient‟s journey.
Hospital-specific and consultant-specific outcomes An issue that is relevant for the results presented in this report is that some have argued that HES data
should not be used to examine the performance of individual consultants as the assignment of a
patient to a single consultant in HES records may not fully reflect the involvement of a number of
consultants often from different specialties. Hospital-specific outcomes may therefore be more
appropriate. In addition, if the performance of an individual consultant is reviewed, this should also
take into account that patients are treated by trainees or career grade surgeons under the consultant‟s
supervision, given that the consultant leads the team and in that capacity has a strong influence on the
care given to patients.
9
2. Aims and Objectives The overall aim of the project was to assess the value of HES data for revalidation and to support the
measurement of outcomes across disease pathways. It was envisaged that this would enable the
measurement of the performance of hospitals as well as individual clinicians working within them.
Initially, we expected that the project would be carried out in two stages. In the first stage, we would
consider the feasibility and validation of procedure-specific indicators and we would do the same in
the second stage for disease-specific indicators. However, the work that was carried out to deal with
these two types of indicators strongly overlapped and therefore we report the results of both stages
together in this report.
The specific objectives were:
To undertake a rapid review of initiatives that used procedure-specific and disease-specific
metrics derived from administrative data to evaluate performance of individual hospitals and/or
consultants.
To carry out a number of case studies using administrative data to evaluate the feasibility and
validity of the outcome indicators proposed by professional specialty bodies in the areas of
o ischaemic heart disease
o peripheral vascular disease
o urological malignancies
To compare the results of these case studies based on administrative data with those based on
available clinical databases with satisfactory case ascertainment and data completeness.
To develop guidance for the use of an administrative database for the process of recertification.
In addition to the pre-specified objectives, we also carried out a project that defines an explicit and
transparent coding framework to support the use of HES data. The proposed coding framework is
based on the expected internal consistency of diagnostic and procedure codes.
The literature review helped us to identify projects that already had developed procedure- and
disease-specific indicators using administrative data and to evaluate how well these indicators match
the outcomes indicators that had been suggested by the professional specialty bodies.
The case studies were carried out to assess the feasibility and suitability of the outcome indicators
suggested by the professional specialty bodies in the three clinical areas. When evaluating their
suitability, we used a set of explicit criteria including validity (ability to distinguish between poor and
good quality of care), statistical power (adequate number of patients and events to detect truly
outlying performance), fairness (ability to adjust for important differences in case mix), and technical
fitness for purpose (ability of diagnosis and procedure codes to capture relevant clinical details).
We evaluated clinical databases available within the three clinical areas of interest and found that the
databases from the Society for Cardiothoracic Surgery (SCTS) and the British Cardiovascular
Intervention Society (BCIS) had levels of case ascertainment and data completeness deemed high
enough to justify a comparison with HES.
The results of all these components of the project were used to discuss the potential for the use of
HES data to support revalidation.
10
3. Rapid literature review of Hospital Episode Statistics database to describe health care processes and their outcomes
Introduction The Hospital Episode Statistics is a database that includes records of all admissions and day cases in
the English NHS. The HES database is increasingly being used as a data source for studies
addressing a wide range of issues. For this project, we were only interested in studies that used HES
to describe care procedures and their outcomes in the areas of ischaemic heart disease, urological
malignancy, and peripheral vascular disease.
The specific objectives of this systematic review were to describe the scope of the individual studies
where HES has been used as the sole or main source of data on process and outcome, what methods if
any were used for risk adjustment, the outcomes measured, statistical methods used, the clinical
acceptability, and the extent of implementation. We were also especially interested to find whether
the results had been reported for individual clinicians rather than just hospitals or NHS trusts. Also,
we wanted to compare the outcomes used in the studies found with those recommended by the
professional specialty bodies.
Methods We only considered studies that were published after 1 January 2002 as it was felt that the review
should be representative of the most current experience with HES given trends in data quality and
methodological approaches. Searches were carried out for publications with terms linked to
procedures relevant to the three defined disease areas. For ischaemic heart disease, we searched for
CABG procedures, angioplasty and stenting; for peripheral vascular disease, we searched for
abdominal aortic aneurysm (AAA) repair, carotid endarterectomy, femoral bypass surgery, lower limb
amputation and angioplasty and stenting; and for urology, we searched for procedures in radical
nephrectomy, radical prostatectomy, and radical cystectomy.
We searched Medline, Embase and Web of Knowledge databases. We also searched the internet
using Google Scholar. In a first step, we searched for peer-reviewed publications that have used HES
or that stated they had used administrative or routine data in England based on text words (“HES”,
“hospital episode statistics”, “administrative data” and “routine data”). In a second step, we selected
only those that had included patients undergoing one of the relevant procedures within the three
disease areas. In a third step, we included only those publications if they were used as a major source
of data and if the study had a national perspective. Studies which reported only on incidence,
prevalence, aetiology or used HES for background information were excluded.
The resulting papers were examined to determine what patient characteristics were included (disease
and procedure, age, sex, socio-economic status, comorbidity, type of admission); what outcomes were
used (e.g. mortality, length of stay); and what method of risk adjustment/statistical technique was
applied.
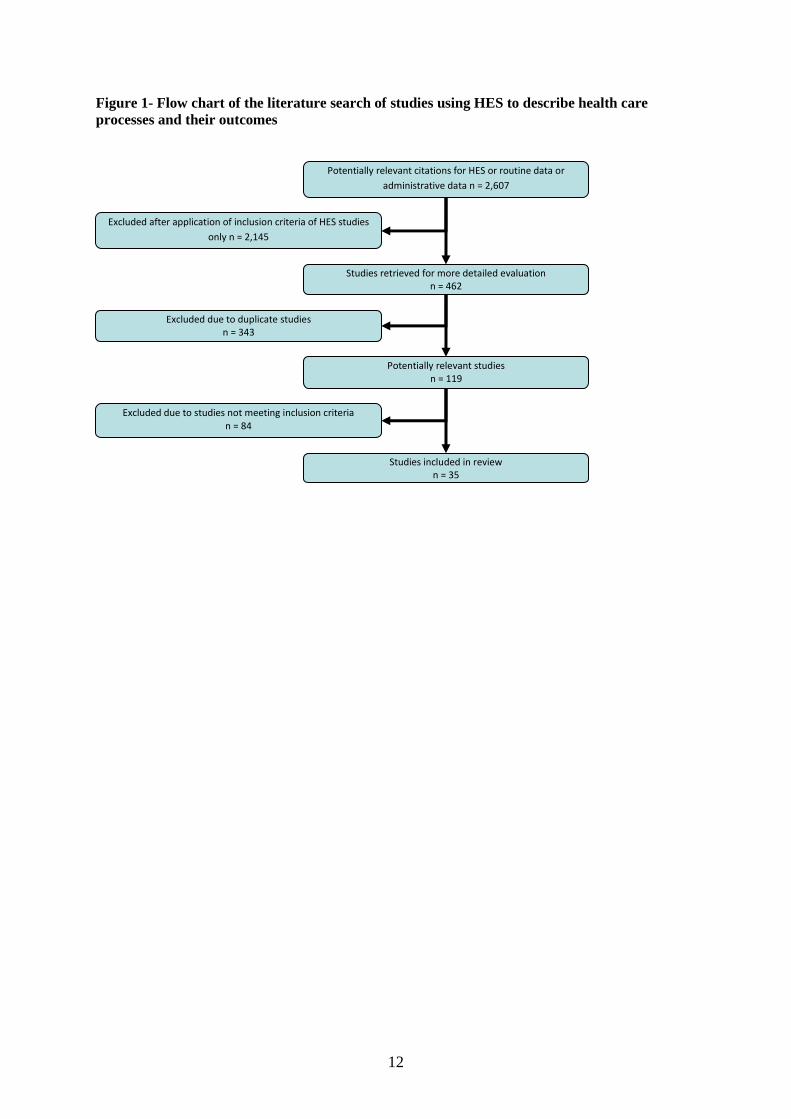
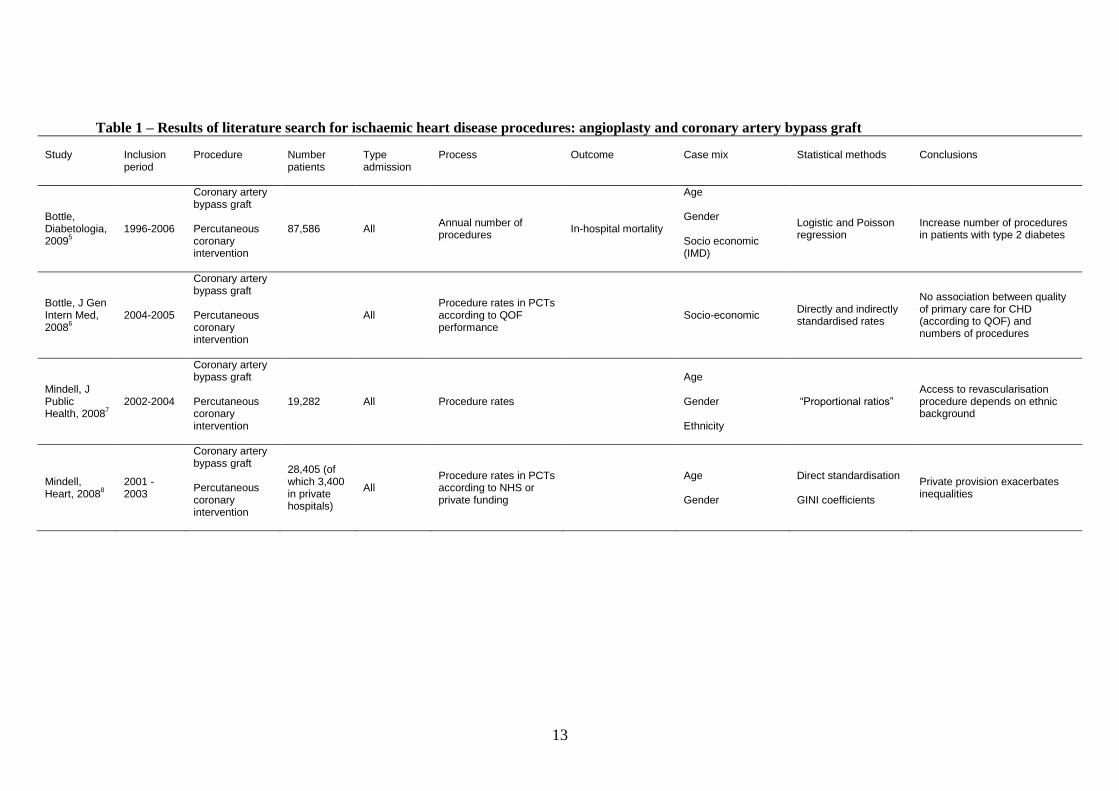
Description of the identified studies A total of 35 studies could be identified (Figure 1). Table 1 describes the seven publications that were
identified related to ischaemic heart disease. 5-11
All studies included patients undergoing coronary
artery bypass grafting and five also included those who had a percutaneous coronary intervention5-8, 10
.
Six studies looked at number of procedures according to patient characteristics in the context of
questions related to equality of access5-8, 10, 11
. Three studies considered mortality as an outcome5, 9, 11
.
11
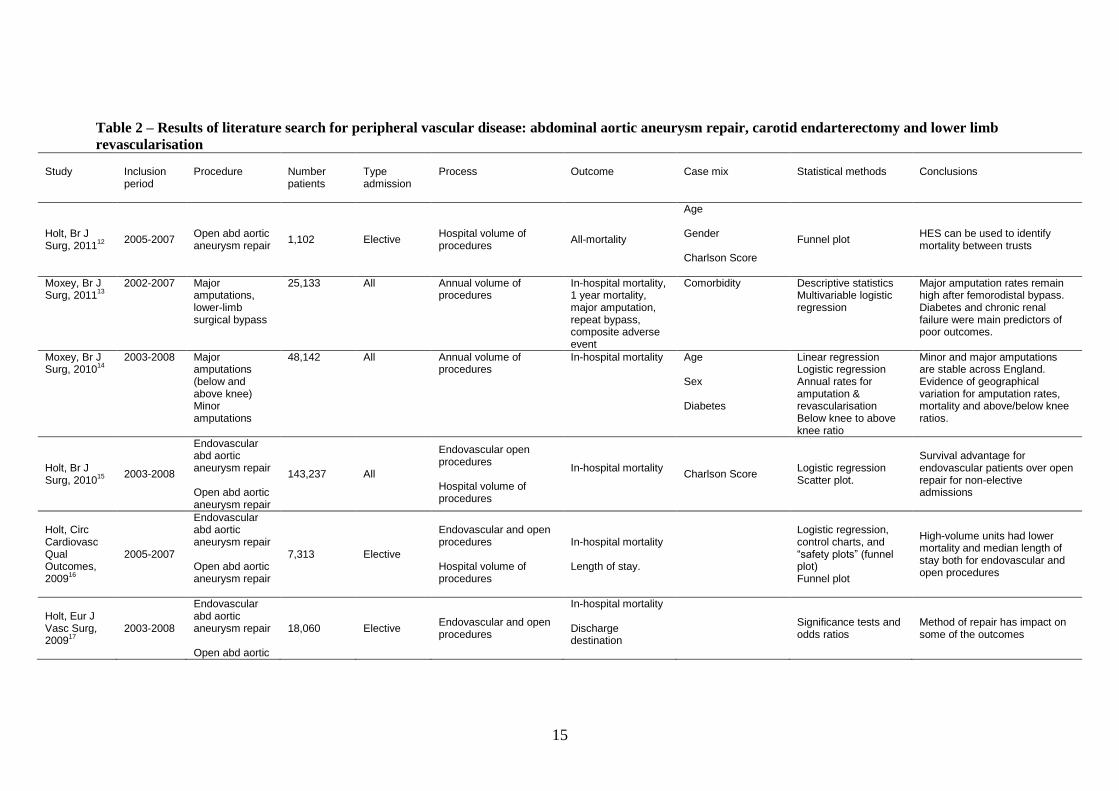
Table 2 describes the 18 publications that were found related to peripheral vascular disease9, 12-28
. Of
these, 14 included patients undergoing abdominal aortic aneurysm repair9, 12, 15-24, 27, 28
, three included
those undergoing carotid endarterectomy19, 20, 25
, and three included those who had femoral bypass
(and other revascularisation procedures of the lower limb) and above or below knee amputation13, 14,
26. Three studies investigated comparing outcomes of endovascular and open procedures
15-17. Five
investigated the impact of hospital volume on outcomes16, 23-25, 27
. One study demonstrated how well
case mix derived from HES predicts in-hospital mortality19
. Another compared the number of
abdominal aortic aneurysm repair cases and deaths in HES with hospital case notes12
.
Table 3 describes the publications related to 11 publications on urological malignancies.29-39
All
studies looked at the hospital volume of procedures and seven investigated the impact of hospital
volume on in-hospital mortality and length of stay29-31, 33-36
. One study looked at complications and
readmissions33
.
All but one study considered mortality as an outcome9, 12-25, 27, 28
. Other outcomes were
reinterventions17
, emergency readmissions17
within 30 days or 1 year, complications24, 25
, length of
hospital stay16, 24, 25
, repeat bypass13
and composite of death or amputation13
. Others addressed
equality of access22, 26
, access to revascularisation of lower limb by age26
and geographical variation in
amputation rates14
.
The majority of the studies have used age and gender for risk adjustment. Some used other factors,
including type of admission, waiting time, socio-economic status, comorbidity and previous
admissions5-7, 9, 10, 13-15, 18, 19, 22, 28, 29, 31, 33, 37, 38
. Most studies used simple descriptive statistical
techniques. Of the papers found, four used funnel plots to present performance specific results
according to volume16, 22, 24, 25
.
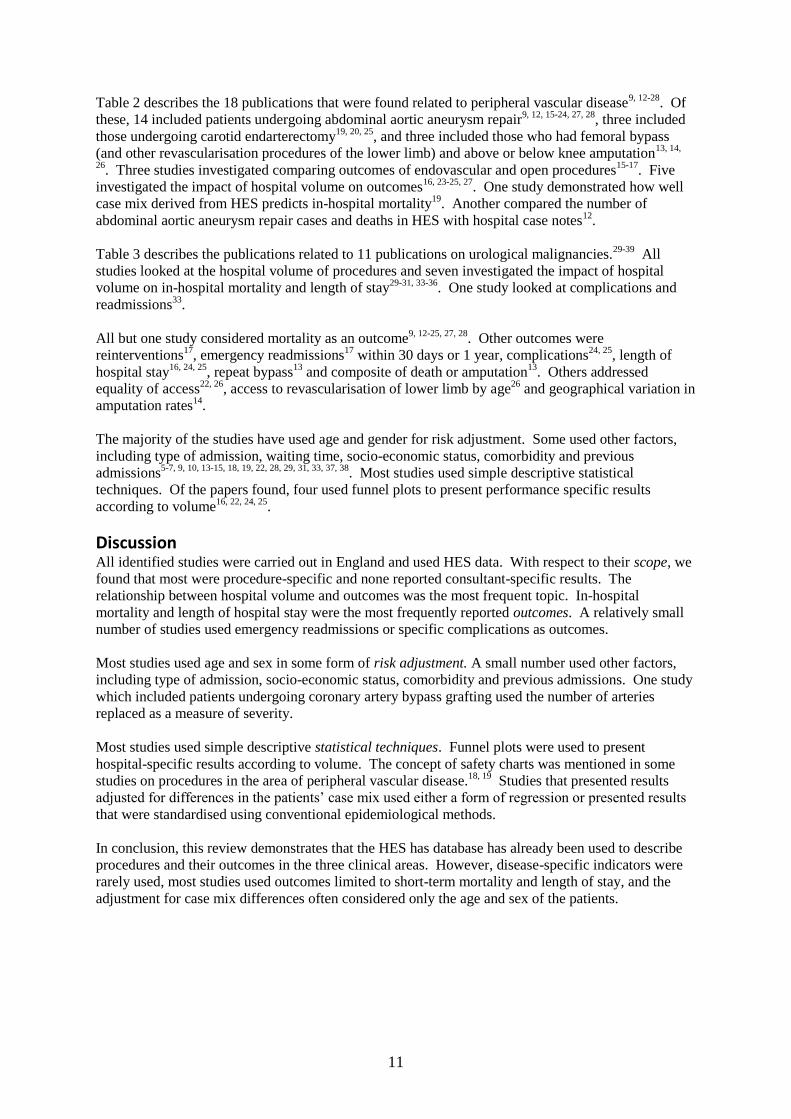
Discussion All identified studies were carried out in England and used HES data. With respect to their scope, we
found that most were procedure-specific and none reported consultant-specific results. The
relationship between hospital volume and outcomes was the most frequent topic. In-hospital
mortality and length of hospital stay were the most frequently reported outcomes. A relatively small
number of studies used emergency readmissions or specific complications as outcomes.
Most studies used age and sex in some form of risk adjustment. A small number used other factors,
including type of admission, socio-economic status, comorbidity and previous admissions. One study
which included patients undergoing coronary artery bypass grafting used the number of arteries
replaced as a measure of severity.
Most studies used simple descriptive statistical techniques. Funnel plots were used to present
hospital-specific results according to volume. The concept of safety charts was mentioned in some
studies on procedures in the area of peripheral vascular disease.18, 19
Studies that presented results
adjusted for differences in the patients‟ case mix used either a form of regression or presented results
that were standardised using conventional epidemiological methods.
In conclusion, this review demonstrates that the HES has database has already been used to describe
procedures and their outcomes in the three clinical areas. However, disease-specific indicators were
rarely used, most studies used outcomes limited to short-term mortality and length of stay, and the
adjustment for case mix differences often considered only the age and sex of the patients.
12
Figure 1- Flow chart of the literature search of studies using HES to describe health care
processes and their outcomes
Potentially relevant citations for HES or routine data or
administrative data n = 2,607
n = Studies retrieved for more detailed evaluation
n = 462
Excluded after application of inclusion criteria of HES studies
only n = 2,145
Excluded due to duplicate studies n = 343
Potentially relevant studies n = 119
Studies included in review n = 35
Excluded due to studies not meeting inclusion criteria n = 84
13
Table 1 – Results of literature search for ischaemic heart disease procedures: angioplasty and coronary artery bypass graft Study
Inclusion period
Procedure
Number patients
Type admission
Process
Outcome
Case mix
Statistical methods
Conclusions
Bottle, Diabetologia, 2009
5
1996-2006
Coronary artery bypass graft Percutaneous coronary intervention
87,586 All Annual number of procedures
In-hospital mortality
Age Gender Socio economic (IMD)
Logistic and Poisson regression
Increase number of procedures in patients with type 2 diabetes
Bottle, J Gen Intern Med, 2008
6
2004-2005
Coronary artery bypass graft Percutaneous coronary intervention
All Procedure rates in PCTs according to QOF performance
Socio-economic Directly and indirectly standardised rates
No association between quality of primary care for CHD (according to QOF) and numbers of procedures
Mindell, J Public Health, 2008
7
2002-2004
Coronary artery bypass graft Percutaneous coronary intervention
19,282 All Procedure rates
Age Gender Ethnicity
“Proportional ratios” Access to revascularisation procedure depends on ethnic background
Mindell, Heart, 2008
8
2001 - 2003
Coronary artery bypass graft Percutaneous coronary intervention
28,405 (of which 3,400 in private hospitals)
All Procedure rates in PCTs according to NHS or private funding
Age Gender
Direct standardisation GINI coefficients
Private provision exacerbates inequalities

14
Study
Inclusion period
Procedure
Number patients
Type admission
Process
Outcome
Case mix
Statistical methods
Conclusions
Aylin, BMJ, 2007
9
1996-2004
Coronary artery bypass graft (without preceding PCI)
152,523 All In-hospital mortality.
Age Gender Type of admission Socio economic (IMD) Comorbidity (Charlson) Previous admissions for IHD, myocardial infraction, heart surgery Number of arteries replaced
Logistic regression
Routinely collected data can be used to predict risk with similar discrimination to clinical databases
Shaw, Soc Sci Med, 2004
10
1991-1999
Coronary artery bypass graft Percutaneous coronary intervention
295,130 All Number of procedures Undergoing CABG and PCTA
Age Gender Myocardial infarction
Standardised rates Women and elderly people are receiving less revascularisation than their need would indicate
Martin, J Epidemiol Community Health, 2002
11
1998-1999 Coronary artery bypass graft
15,000 Elective Length of stay on waiting list (overall estimate)
Estimated mortality on waiting list and within 6 months after surgery Estimated morbidity within 6 months after surgery
Estimated mortality and morbidity based on published incidence figures
Number of patients who die on waiting list similar to that of those who die within 6 months after surgery Number of patients who have myocardial infarction on waiting list is half that of corresponding number within 6 months after surgery
15
Table 2 – Results of literature search for peripheral vascular disease: abdominal aortic aneurysm repair, carotid endarterectomy and lower limb
revascularisation Study
Inclusion period
Procedure
Number patients
Type admission
Process
Outcome
Case mix
Statistical methods
Conclusions
Holt, Br J Surg, 2011
12
2005-2007 Open abd aortic aneurysm repair
1,102 Elective Hospital volume of procedures
All-mortality
Age Gender Charlson Score
Funnel plot HES can be used to identify mortality between trusts
Moxey, Br J Surg, 2011
13
2002-2007 Major amputations, lower-limb surgical bypass
25,133 All Annual volume of procedures
In-hospital mortality, 1 year mortality, major amputation, repeat bypass, composite adverse event
Comorbidity Descriptive statistics Multivariable logistic regression
Major amputation rates remain high after femorodistal bypass. Diabetes and chronic renal failure were main predictors of poor outcomes.
Moxey, Br J Surg, 2010
14
2003-2008 Major amputations (below and above knee) Minor amputations
48,142 All Annual volume of procedures
In-hospital mortality Age Sex Diabetes
Linear regression Logistic regression Annual rates for amputation & revascularisation Below knee to above knee ratio
Minor and major amputations are stable across England. Evidence of geographical variation for amputation rates, mortality and above/below knee ratios.
Holt, Br J Surg, 2010
15
2003-2008
Endovascular abd aortic aneurysm repair Open abd aortic aneurysm repair
143,237 All
Endovascular open procedures Hospital volume of procedures
In-hospital mortality
Charlson Score Logistic regression Scatter plot.
Survival advantage for endovascular patients over open repair for non-elective admissions
Holt, Circ Cardiovasc Qual Outcomes, 2009
16
2005-2007
Endovascular abd aortic aneurysm repair Open abd aortic aneurysm repair
7,313 Elective
Endovascular and open procedures Hospital volume of procedures
In-hospital mortality Length of stay.
Logistic regression, control charts, and “safety plots” (funnel plot) Funnel plot
High-volume units had lower mortality and median length of stay both for endovascular and open procedures
Holt, Eur J Vasc Surg, 2009
17
2003-2008
Endovascular abd aortic aneurysm repair Open abd aortic
18,060 Elective Endovascular and open procedures
In-hospital mortality Discharge destination
Significance tests and odds ratios
Method of repair has impact on some of the outcomes

16
Study
Inclusion period
Procedure
Number patients
Type admission
Process
Outcome
Case mix
Statistical methods
Conclusions
aneurysm repair
Re-intervention emergency readmission with 30 days or 1 year
Holt, Br J Surg, 2008
18
2000-2005
Open infrarenal abd aortic aneurysm repair
26,822 Elective In-hospital mortality
Age Gender Type of admission
“Safety chart” In-hospital mortality varies across hospitals in England
Holt, Br J Surg, 2008
19
2000-2005
Abd aortic aneurysm repair Carotid endarterectomy
All
Annual hospital volume of procedures
In-hospital mortality
Age Gender Type of admission
“Risk adjusted safety plot”. Significance tests and odds ratios.
A strategic model may improve outcomes after AAA and carotid
Aylin, BMJ, 2007
9
1996-2004 Abd aortic aneurysm repair
44,486 All In-hospital mortality Age Gender Type of admission Socio economic (IMD) Comorbidity (Charlson) Previous admissions for IHD, myocardial infraction, heart surgery Number of arteries replaced
Logistic regression Routinely collected data can be used to predict risk with similar discrimination to clinical databases
17
Study
Inclusion period
Procedure
Number patients
Type admission
Process
Outcome
Case mix
Statistical methods
Conclusions
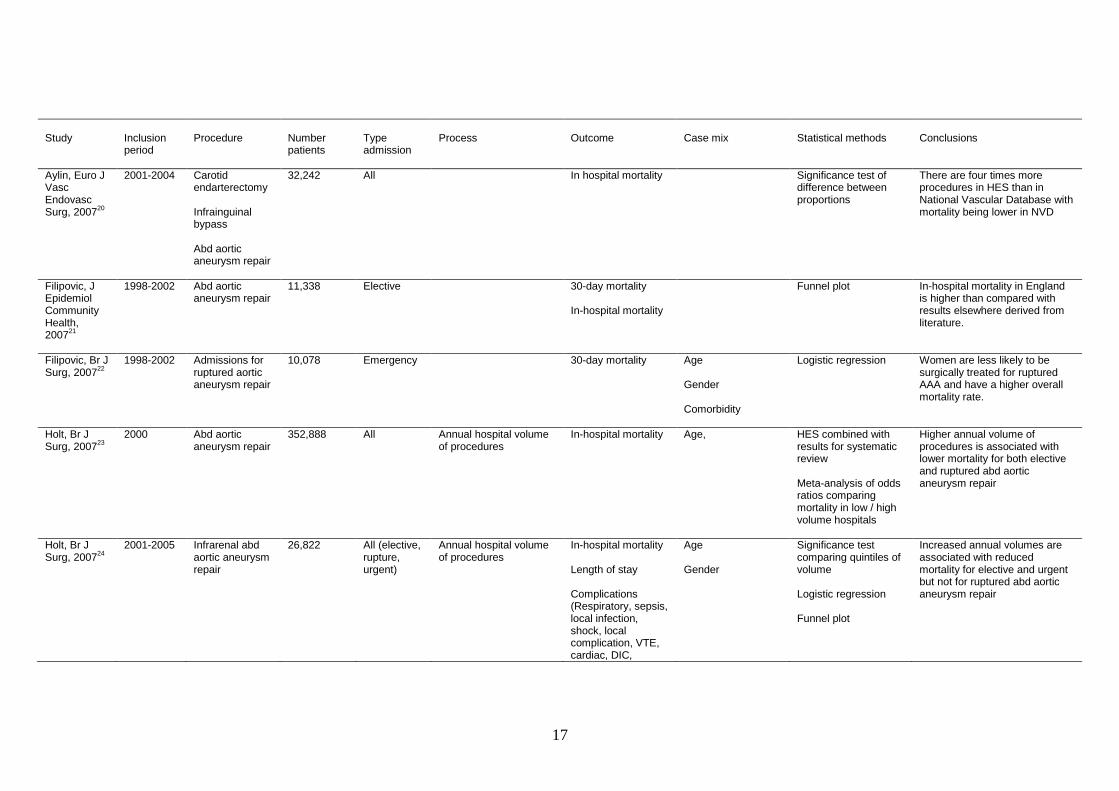
Aylin, Euro J Vasc Endovasc Surg, 2007
20
2001-2004 Carotid endarterectomy Infrainguinal bypass Abd aortic aneurysm repair
32,242 All In hospital mortality Significance test of difference between proportions
There are four times more procedures in HES than in National Vascular Database with mortality being lower in NVD
Filipovic, J Epidemiol Community Health, 2007
21
1998-2002 Abd aortic aneurysm repair
11,338 Elective 30-day mortality In-hospital mortality
Funnel plot In-hospital mortality in England is higher than compared with results elsewhere derived from literature.
Filipovic, Br J Surg, 2007
22
1998-2002 Admissions for ruptured aortic aneurysm repair
10,078 Emergency 30-day mortality Age Gender Comorbidity
Logistic regression Women are less likely to be surgically treated for ruptured AAA and have a higher overall mortality rate.
Holt, Br J Surg, 2007
23
2000 Abd aortic aneurysm repair
352,888 All Annual hospital volume of procedures
In-hospital mortality
Age, HES combined with results for systematic review Meta-analysis of odds ratios comparing mortality in low / high volume hospitals
Higher annual volume of procedures is associated with lower mortality for both elective and ruptured abd aortic aneurysm repair
Holt, Br J Surg, 2007
24
2001-2005 Infrarenal abd aortic aneurysm repair
26,822 All (elective, rupture, urgent)
Annual hospital volume of procedures
In-hospital mortality Length of stay Complications (Respiratory, sepsis, local infection, shock, local complication, VTE, cardiac, DIC,
Age Gender
Significance test comparing quintiles of volume Logistic regression Funnel plot
Increased annual volumes are associated with reduced mortality for elective and urgent but not for ruptured abd aortic aneurysm repair

18
Study
Inclusion period
Procedure
Number patients
Type admission
Process
Outcome
Case mix
Statistical methods
Conclusions
ischaemic stroke, transfusion)
Holt, Eur J vasc Endovasc Surg, 2007
25
2000-2005 Carotid endarterectomy.
18,248 All (elective and emergency)
Annual hospital volume of procedures.
In-hospital mortality Length of stay Complications ((Respiratory, sepsis, local infection, shock, local complication, VTE, cardiac, DIC, ischaemic stroke, transfusion)
Age Gender
Descriptive statistics of proportions and logistic regression Safety chart Funnel plot
Strong relationship between hospital volume and outcome. Age adjusted. Gender adjusted. Relative risk of mortality.
McCaslin, Br J Surg, 2007
26
1989-2004 Lower-limb revascularisation (infrainguinal endarterectomy, embolectomy, patch angioplasty and bypass graft) Major amputation (below and above knee)
Lower limb surgical revascularization aged 45-64,65-74,75+
Age (< 75 and ≥ 75) Diabetes Annual rates for amputation, finished consultant episodes in PVD and peripheral embolic disease.
Annual rates for amputation and revascularization. Below knee to above knee ratio.
Peak in vascularisation procedures in mid nineties followed by steady decline. Amputation rates showed marked decline in those ≥ 75
Jibawe, Eur J Vasc Endovasc Surg, 2006
27
1997-2002 Abd aortic aneurysm repair
32,078 All In hospital mortality
Scatter plot Comparisons of mortality in low and high volume hospitals with varying volume threshold
Increasing elective workload decreases in-hospital mortality for elective and emergency admissions.

19
Study
Inclusion period
Procedure
Number patients
Type admission
Process
Outcome
Case mix
Statistical methods
Conclusions
Michaels, Br J Surg, 2003
28
1996-2001 Abd aortic aneurysm repair
38,319 All (complex, elective, emergency, unoperated)
In-hospital mortality Super renal or visceral renal
Descriptive statistics comparing proportions
Mortality rate may be misleading due to differences in case mixing and selection.

20
Table 3 – Results of literature search for urological cancer procedures: cystectomy, nephrectomy and prostatectomy. Study
Inclusion period
Procedure
Number patients
Type admission
Process
Outcome
Case mix
Statistical methods
Conclusions
Hanchanale, Urol J, 2010
29
1998-2005 Prostatectomy 14,300 All
Hospital volume and surgeon volume of procedures Waiting time
In-hospital mortality Length of stay
Age Admission method Waiting time Surgeon volume Annual hospital volume
Significance tests assessing case mix variables, volume groups and outcomes Logistic regression
Evidence of exponential increase in number of RPs with increase in laparoscopic procedures. Inverse volume outcome relationship.
Hanchanale, Urol Int, 2010
30
1998-2005
Cystectomy Nephrectomy Prostatectomy
43,946 All
Hospital volume of procedures Waiting time
In-hospital mortality Length of stay
Age Gender
Significance tests across volume groups
Some evidence of effect of hospital volume on mortality and length of stay.
Mayer, BMJ, 2010
31
2000-2007 Cystectomy 8,596 Elective Hospital volume and surgeon volume of procedures
30 day in hospital mortality & 30 day total mortality
Age Gender Comorbidity (Charlson) Carstairs Index
Logistic regression, significance tests assessing case mix variables and volume groups.
Some evidence of effect of hospital and surgeon case volume on mortality after adjustment for process of care.
Mayer, BJU Int, 2009
32
2000-2007 Cystectomy Prostatectomy
27,007 All
Hospital volume of procedures Catchment population
Linear and logistic regression for trends over time without adjustment for case mix
Evidence of centralisation

21
Study
Inclusion period
Procedure
Number patients
Type admission
Process
Outcome
Case mix
Statistical methods
Conclusions
Judge, BJU Int, 2007
33
1997-2005 Prostatectomy 18,027 Elective Hospital volume of procedures
30-day in-hospital mortality Length of stay 30-day in-hospital complications (cardiac, respiratory, vascular, wound / bleeding, genitourinary, miscellaneous medical, miscellaneous surgical) 30-day in-hospital specific complications (VTE, wound infection, bladder neck stricture) Readmissions within year
Age Socio economic (IMD) Comorbidity (Charlson)
Linear, logistic and Cox regression
Evidence of effect of hospital volume on outcomes
Hanchanale, Eur Urol Suppl, 2007
34
Not available
Cystectomy Prostatectomy
23,274 All Hospital volume of procedures
In-hospital mortality Length of stay
Significance tests across volume groups
Evidence of effect of hospital volume on length of stay and mortality
Hanchanale, Eur Urol Suppl, 2006
35
1997-2004 Prostatectomy 11,303 All Surgeon volume of procedures
in-hospital mortality Length of stay
Significance test across volume groups
Evidence of effect of surgeon volume on length of stay
McCabe, BJU Int, 2005
36
1998-2003 Cystectomy 6,317 All Hospital volume of procedures
In-hospital mortality
Age Gender
Significance test comparing low and high volume hospitals based on different volume thresholds
Evidence of effect of hospital volume on mortality
22
Study
Inclusion period
Procedure
Number patients
Type admission
Process
Outcome
Case mix
Statistical methods
Conclusions
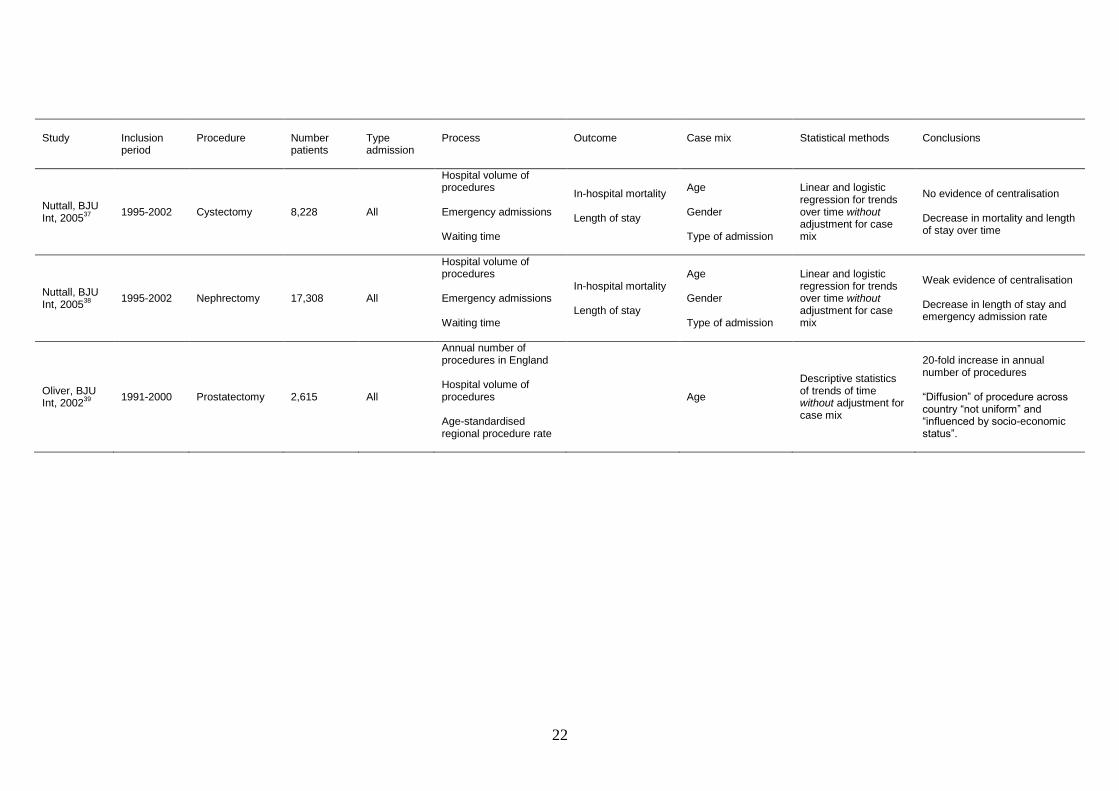
Nuttall, BJU Int, 2005
37
1995-2002 Cystectomy 8,228 All
Hospital volume of procedures Emergency admissions Waiting time
In-hospital mortality Length of stay
Age Gender Type of admission
Linear and logistic regression for trends over time without adjustment for case mix
No evidence of centralisation Decrease in mortality and length of stay over time
Nuttall, BJU Int, 2005
38
1995-2002 Nephrectomy 17,308 All
Hospital volume of procedures Emergency admissions Waiting time
In-hospital mortality Length of stay
Age Gender Type of admission
Linear and logistic regression for trends over time without adjustment for case mix
Weak evidence of centralisation Decrease in length of stay and emergency admission rate
Oliver, BJU Int, 2002
39
1991-2000 Prostatectomy 2,615 All
Annual number of procedures in England Hospital volume of procedures Age-standardised regional procedure rate
Age
Descriptive statistics of trends of time without adjustment for case mix
20-fold increase in annual number of procedures “Diffusion” of procedure across country “not uniform” and “influenced by socio-economic status”.
23
4. Case studies of outcome indicators defined by specialist societies
Introduction Before the start of this project in 2010, the Society for Cardiothoracic Surgery in Great
Britain and Ireland (SCTS), the Association of Surgeons of Great Britain and Ireland
(ASGBI), and the British Association of Urological Surgeons (BAUS) had proposed possible
outcome indicators relevant for ischaemic heart disease, urological malignancy and peripheral
vascular disease. The indicators were chosen as they were considered to capture outcomes
that are important and meaningful for the clinical area as well as available based on HES data.
All the proposed indicators were procedure-specific and include mortality, unplanned
readmission and return-to-theatre (RTT) within 30 days of the procedure, and length of
hospital stay (LOS).
We carried out a number of case studies to evaluate these proposed indicators. We used a set
of explicit criteria including validity (ability to distinguish between poor and good quality of
care), statistical power (adequate number of patients and events to detect truly outlying
performance), fairness (ability to adjust for important differences in case mix), and the
technical coding specification (ability of diagnosis and procedure codes to capture relevant
clinical details of diagnosis or procedure as well as the outcome).
For the case studies, we used funnel plots to present the results of comparisons at trust or
consultant level with the proposed outcome indicators. In this chapter, we describe some of
the case studies as an illustration of the proposed criteria. We also developed a framework for
the evaluation of outcome indicators. This framework highlights important issues that need to
be considered when outcome indicators are defined and proposed for revalidation.
Methods Data were extracted from HES for admissions between 1
st April 2003 and 31
st March 2008
except for endovascular aneurysm repairs (EVAR). For EVAR procedures, records of
admissions between 1st April 2006 and 28
st February 2009 were used to avoid as much as
possible changes in the definition of the OPCS codes for endovascular procedures influencing
the results. Most funnel plots therefore included data for a period of five years. The
denominator was always the total number of admissions for the specific procedure in that
period. The definition of the numerator varies according to the outcome.
For 30-day mortality, we looked at whether there was a date of death within 30 days of the
procedure date given in HES obtained through data linkage with the Office for National
Statistics (ONS).40
Unplanned readmissions were defined as emergency admissions (codes
21, 22, 23, 24 or 28 in the admimeth field in HES) within 30 days of the initial procedure.
Return to theatre (RTT) was defined as another procedure in patients who had been
readmitted within 30 days of the initial procedure. For length of stay (LOS), we took the
difference between the admission date and the discharge date (total LOS) as well as from the
date of procedure to the discharge date (post-operative LOS).
Statistical methods We used multivariable logistic regression to calculate results adjusted for case mix for
proportions and multivariable linear regression to do the same for means. Details of the risk
adjustment procedure are available on request. Comorbidity was captured with the Royal
College of Surgeons (RCS) Charlson Comorbidity Score 41
which identifies 14 comorbid
conditions. Other case mix factors included in the statistical models were age, gender, and
socio-economic deprivation captured with the Index of Multiple Deprivation.42

24
The funnel plots were constructed in the following way. The national average was used to set
a target. The control limits defined ranges of values for the outcome indicators that are within
two standard deviations (inner control limits) or three standard deviations (outer control
limits) from this target. This corresponds to statistically testing whether a unit‟s outcome
indicator is different from the target at a 2-sided significance level of 0.05 (if a unit‟s
indicator is outside the inner limits) or 0.002 (if indicator is outside the outer limit). In
practice, this would imply that 95% of all providers are expected to be within the inner and
99.8% within the outer limits, if all providers are performing according to the target. For
proportions (e.g. deaths), exact Binomial control limits were used. For continuous variables
(e.g. length of stay) control limits were derived from the Normal distribution and the standard
deviation that captures the distribution of observed values.
Examples of the case studies Validity
The validity of an outcome indicator corresponds to the extent to which the indicator is
clinically well-founded, reflects variations in the quality of care, and is able to distinguish
good from poor practice. This implies that for an indicator to be valid it should be clinically
plausible that differences in care quality are linked with differences in the metric derived from
the indicator. Also, there should be clarity about which end of the metric‟s spectrum indicates
better quality.
Figure 2 shows a funnel plot of the adjusted 30-day unplanned readmission rate after radical
prostatectomy for individual NHS trusts. The funnel plot demonstrates that about 11 NHS
trusts have high readmission rates. The obvious explanation for this pattern of results is that
in a large number of hospitals patients are briefly admitted after their prostatectomy to have
their urethral catheter removed. It is obvious that the readmission rate cannot be used as an
outcome indicator because the readmission rate depends on local policies and there is no
unambiguous link with good or poor quality.
In contrast, Figure 3 shows a funnel plot of adjusted 30-day mortality after emergency repair
of an abdominal aortic aneurysm (AAA) for individual consultants. There is an obvious need
to avoid early death after surgery and poorer care can lead to higher mortality, which provides
support for the validity of this indicator.
Statistical power
The statistical power refers to the chance that units that are true outliers will be detected.
Most outcome indicators suggested by the specialty organisations are events and the outcome
indicators are expressed as the proportion of patients who experience that event. This implies
that the power to detect outlying performance based on these indicators depends on the
number of patients and the number of events experienced by these patients. For outcomes
that are continuous variables, (e.g. length of stay, patient-reported measures of function or
disability or health-related quality of life), the statistical power depends on the number of
patients as well as the standard deviation of observed values.
Figure 4 shows a funnel plot of the adjusted 30-day mortality rate after elective coronary
artery bypass graft surgery (CABG) by consultant. The national average of mortality was
1.9% and the average number of procedures carried out by a consultant over a 5-year period is
about 350. Even with this relatively high number of procedures, the power to detect outliers
was relatively low. For example, there is only about a 36% chance that a consultant who has
carried out 350 procedures with a mortality that is twice the national average will have a
result that lies above the outer funnel limit.
25
However, the situation was different if adjusted 30-day mortality after emergency repair of an
AAA is considered. The average mortality at national level was much higher (34%) than
after elective CABG surgery but the average number of procedures carried out by an
individual consultant in the same 5-year period was much lower (17). A power calculation
for this procedure demonstrates that the chance to find a result above the upper outer funnel
for a consultant who has carried out 17 procedures with a mortality that is twice the national
average is 45%.
Fairness
Comparisons of outcome indicators between units should be fair. Units may seem to have a
worse performance simply because they treat higher risk patients. Statistical risk adjustment
models allow estimates for individual units to be adjusted for differences in case mix. The
adjusted results reflect results as if each unit treats patients of average risk. The extent to
which comparisons can be considered fair depends therefore on the extent and nature of the
case mix differences between units as well as on how well these differences are captured by
available data and the statistical performance of the risk adjustment model.
Figure 5 presents the adjusted 30-day mortality after above the knee amputations by NHS
trusts. The national average of mortality was 19% and there are no trusts with results above
the upper outer funnel limit. Nevertheless, the fairness of these comparisons can be criticised
as it is not unlikely that there were difference in case mix of patients treated in different trusts
and at the same time these differences in risk were not well captured by the available
diagnostic and procedure codes available in the HES records. An important limitation of the
clinical information available in HES is that it indicates the presence of critical conditions in
these patients (for example, diabetes, renal insufficiency, or heart failure) but not their
severity.
However, as we will show later in chapter 7, the differences in baseline risk in patients
undergoing CABG surgery are well captured by HES data. The performance of the risk
adjustment model based on HES data is comparable to the widely accepted risk adjustment
models based on clinical data (i.e. data derived from the patients‟ medical records for the
purpose of research or clinical audit).
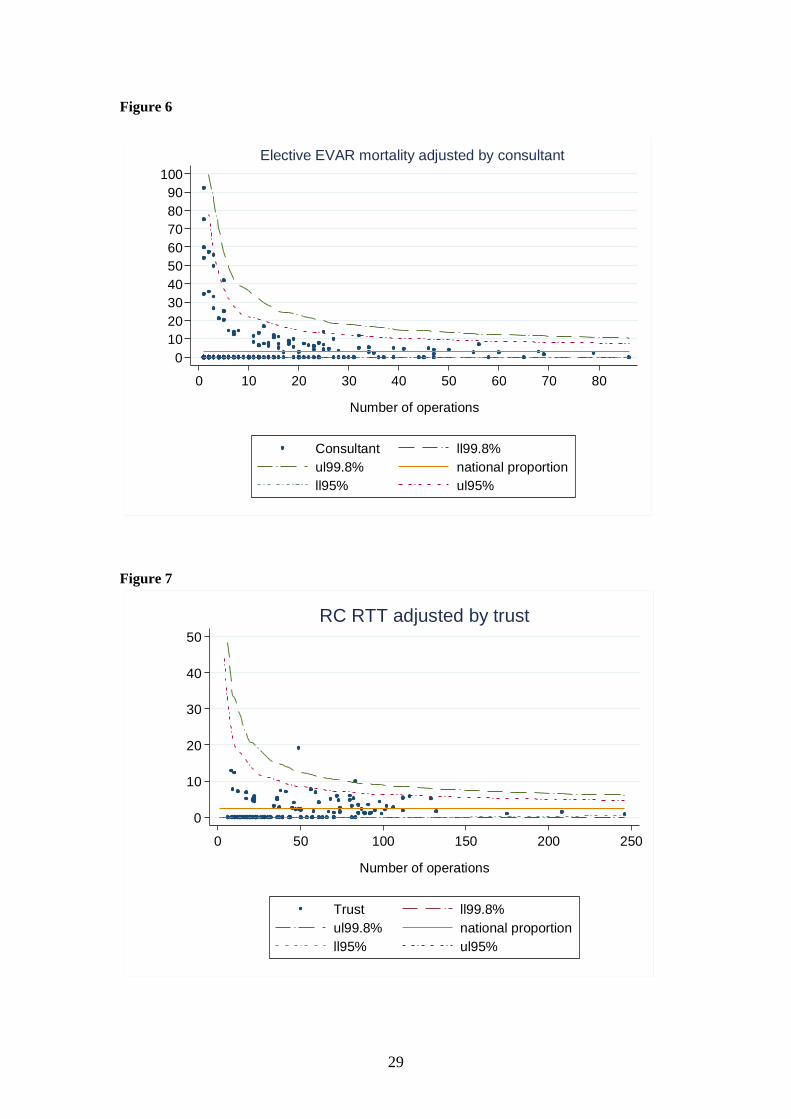
Adequacy of the coding specification
The ability to capture the relevant diagnostic and procedure codes is relevant as it determines
the ability to define the patient population to be included, to capture the relevant case
differences as well as the care processes and outcomes that define the indicators.
A first issue that is relevant in this context is the gradual emergence of new procedures which
makes it difficult to capture the relevant patient population. The updates of procedures codes
in HES will always lag a few years behind the introduction of new procedures. An example
was the increasing use of EVAR. In the years immediate after the introduction of EVAR as
routine treatment for patients with AAA, the same procedure codes were used for EVAR as
for open repair in combination with a mix of additional codes to identify the endovascular
approach. In Figure 6 we present the 30-day adjusted mortality after elective EVAR by
consultant. As explained earlier, we tried to avoid including patients who had an open repair
by only including patients operated after 1st April 2006. All results were within the outer
funnel limits.
Capturing RTT is a further example where coding inadequacies may have an impact on the
outcome indicators. RTT is captured by searching for specific procedure codes. However, if
certain codes are found with a similar date as that of the initial procedure it is not possible to
distinguish between procedures carried out during the initial theatre session or after a return to
theatre for a second session. In the approach that we propose, only procedures carried out in
theatre on subsequent days – and therefore excluding those that were carried out on the same

26
day as the initial procedure – were identified as evidence of a RTT. As a consequence, this
approach does not detect early RTT and in that way underestimates the RTT rate. Figure 7
presents the adjusted 30-day RTT rate after radical cystectomy by trust. The national average
RRT rate is 2.4% and all except two trusts are within the outer funnel limits.
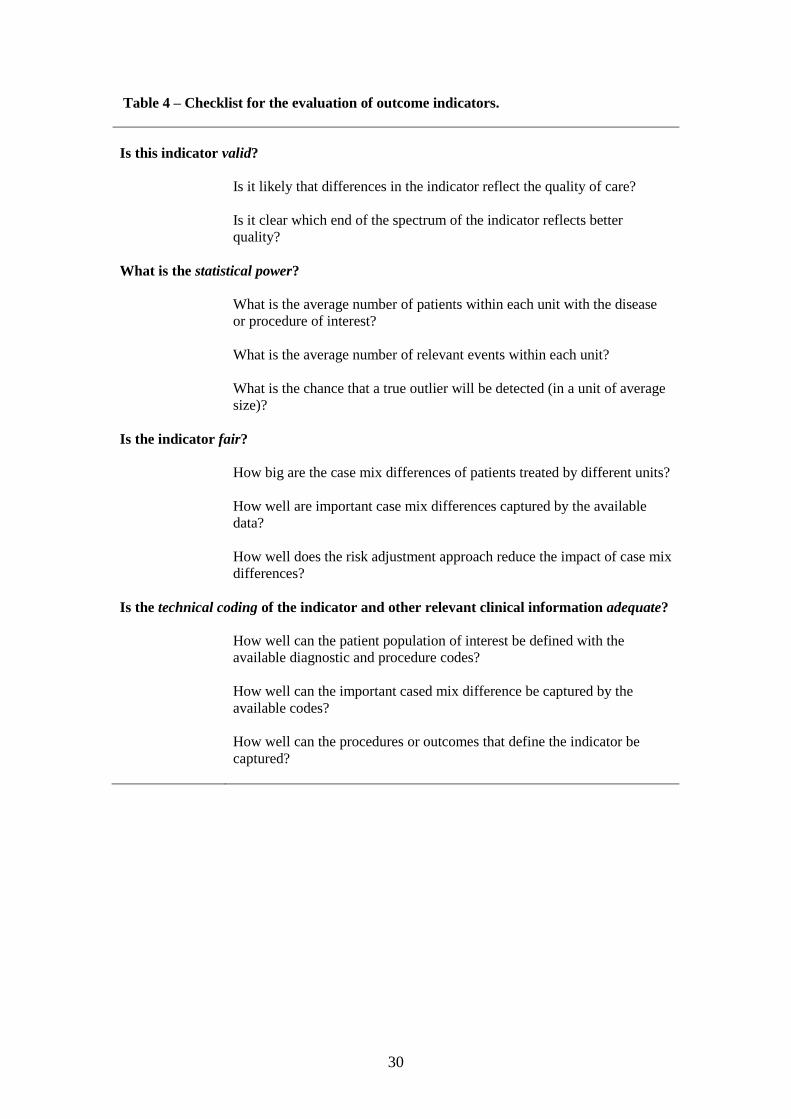
Evaluation of proposed indicators The case studies demonstrate that the suitability of the indicators depends on a number of
explicit criteria. In this section we present a checklist that can be used to evaluate the
indicators before their actual introduction. This checklist provides the professional specialty
bodies with four explicit criteria that the indicators should meet (Table 4). For each criterion,
there are a number of questions that need to be answered.
As a further illustration, we have evaluated the indicators proposed by the specialty bodies
using the checklist presented in Table 4. We used a star rating with zero stars indicating that
the criterion is not met, one star indicating that it is partially met and two stars indicating that
it is fully met. A question mark indicates that the results cannot be determined without
additional information. The results are presented in Tables 5, 6 and 7.
The evaluation of validity is straightforward for mortality but less so for length of stay,
unplanned readmissions and RTT. For the latter three, differences may also reflect local
circumstances and established clinical decision making. It is for that reason that the validity
criterion is thought to be only partly met.
The statistical power criterion strongly depends on the number of patients with the disease of
procedure of interest. It is therefore difficult to evaluate this criterion without having defined
the time period over which patients are included as well as the level of the comparison. In our
examples so far we used a period of five years, but it is obvious that shorter time periods may
be more relevant which has an impact on the number of patients. More importantly, if
indicators are considered for individual consultants then this will have a substantial impact on
the statistical power.
In chapter 7, we demonstrate that the performance of a risk adjustment model for CABG
surgery based on HES data is very similar to that based on clinical data. It is for that reason
that we feel that the fairness criteria is fully met for this procedure. The performance of risk
adjustment models based on HES for the two other clinical areas is less well established.
However, the HES database includes age and gender as well as comorbidity based on the
well-establish RCS Charlson Comorbidty score.41
However, information contained in HES
on the nature and severity of the primary condition is limited both for patients with vascular
disease or with urological malignancies. For that reason, it seems most appropriate to
consider the fairness criterion for indicators in these clinical areas only to be partially met.
The adequacy of the technical coding available in HES is not fully met for a number of
indicators in the three clinical areas. As explained earlier, the definition of the patient
population is not straightforward for EVAR procedures. Also, the detection of RTT is
problematic if it takes place on the same day. In general however, the most important
limitation of using HES data is that HES records contain limited information about the nature
and severity of the condition. Also, it would be useful if there was more information about
the patients‟ physical condition such as the ASA score defined by the American Society of
Anesthesiologists.

27
0
5
10
15
20
25
30
% 3
0 d
ay r
ea
dm
issio
ns
0 50 100 150 200 250 300 350 400 450
Number of operations
Trust ll99.8%
ul99.8% national proportion
ll95% ul95%
RP unplanned readmissions adjusted by trust
0
10
20
30
40
50
60
70
80
90
100
% 3
0 d
ay m
ort
alit
y
0 10 20 30 40
Number of operations
Consultant ll99.8%
ul99.8% national proportion
ll95% ul95%
Emergency AAA mortality adjusted by consultant
Figure 3
Figure 2

28
0
5
10
15
20
25
30
% 3
0 d
ay m
ort
alit
y
0 100 200 300 400 500 600 700 800 900
Number of operations
Consultant ll99.8%
ul99.8% national proportion
ll95% ul95%
Elective CABG mortality unadjusted by consultant
0
10
20
30
40
50
60
70
80
90
100
% 3
0 d
ay m
ort
alit
y
0 50 100 150 200 250 300
Number of operations
Trust ll99.8%
ul99.8% national proportion
ll95% ul95%
Above knee amputation mortality adjusted by trust
Figure 4
Figure 5
29
0
10
20
30
40
50
60
70
80
90
100
% 3
0 d
ay m
ort
alit
y
0 10 20 30 40 50 60 70 80
Number of operations
Consultant ll99.8%
ul99.8% national proportion
ll95% ul95%
Elective EVAR mortality adjusted by consultant
Figure 7
0
10
20
30
40
50
% 3
0 d
ay R
TT
0 50 100 150 200 250
Number of operations
Trust ll99.8%
ul99.8% national proportion
ll95% ul95%
RC RTT adjusted by trust
Figure 6
30
Table 4 – Checklist for the evaluation of outcome indicators.
Is this indicator valid?
Is it likely that differences in the indicator reflect the quality of care?
Is it clear which end of the spectrum of the indicator reflects better
quality?
What is the statistical power?
What is the average number of patients within each unit with the disease
or procedure of interest?
What is the average number of relevant events within each unit?
What is the chance that a true outlier will be detected (in a unit of average
size)?
Is the indicator fair?
How big are the case mix differences of patients treated by different units?
How well are important case mix differences captured by the available
data?
How well does the risk adjustment approach reduce the impact of case mix
differences?
Is the technical coding of the indicator and other relevant clinical information adequate?
How well can the patient population of interest be defined with the
available diagnostic and procedure codes?
How well can the important cased mix difference be captured by the
available codes?
How well can the procedures or outcomes that define the indicator be
captured?

31
Table 5 - Indicators for ischaemic and valvular heart disease proposed by the Society for
Cardiothoracic Surgery in Great Britain and Ireland based on Hospital Episode Statistics data
Validity Power Fairness Technical
coding
adequate
CABG 30-day mortality ** Elective ∙ Elective ** **
Emergency ∙
Emergency **
Length of stay
* Elective ? Elective ** **
Emergency ?
Emergency **
30-day unplanned
readmissions
* Elective ∙ Elective ** **
Emergency ∙
Emergency **
30-day return to
theatre
* Elective ∙ Elective ** *
Emergency ∙
Emergency **
Aortic valve
replacement
30-day mortality ** Elective ∙ Elective ** **
Emergency ∙
Emergency **
Length of stay
* Elective ? Elective ** **
Emergency ?
Emergency **
30-day unplanned
readmissions
* Elective ∙ Elective ** **
Emergency ∙
Emergency **
30-day return to
theatre
* Elective ∙ Elective ** *
Emergency ∙
Emergency **
Mitral valve
replacement
30-day mortality ** Elective ∙ Elective ** **
Emergency ∙
Emergency **
Length of stay
* Elective ? Elective ** **
Emergency ?
Emergency **
30-day unplanned
readmissions
* Elective ∙ Elective ** **
Emergency ∙
Emergency **
30-day return to
theatre
* Elective ∙ Elective ** *
Emergency ∙ Emergency **
32
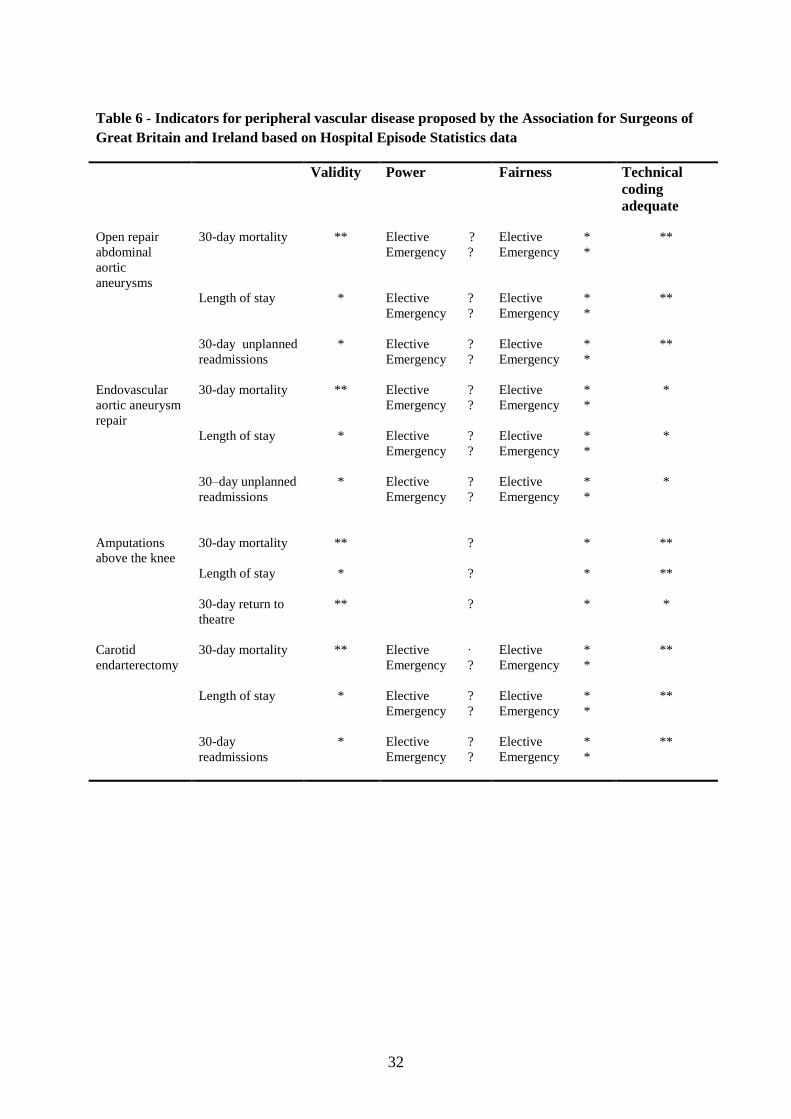
Table 6 - Indicators for peripheral vascular disease proposed by the Association for Surgeons of
Great Britain and Ireland based on Hospital Episode Statistics data
Validity Power Fairness Technical
coding
adequate
Open repair
abdominal
aortic
aneurysms
30-day mortality ** Elective ? Elective * **
Emergency ?
Emergency *
Length of stay
* Elective ? Elective * **
Emergency ?
Emergency *
30-day unplanned
readmissions
* Elective ? Elective * **
Emergency ? Emergency *
Endovascular
aortic aneurysm
repair
30-day mortality ** Elective ? Elective * *
Emergency ?
Emergency *
Length of stay
* Elective ? Elective * *
Emergency ?
Emergency *
30–day unplanned
readmissions
* Elective ? Elective * *
Emergency ? Emergency *
Amputations
above the knee
30-day mortality
** ? * **
Length of stay
* ? * **
30-day return to
theatre
** ? * *
Carotid
endarterectomy
30-day mortality ** Elective ∙ Elective * **
Emergency ?
Emergency *
Length of stay
* Elective ? Elective * **
Emergency ?
Emergency *
30-day
readmissions
* Elective ? Elective * **
Emergency ? Emergency *
33
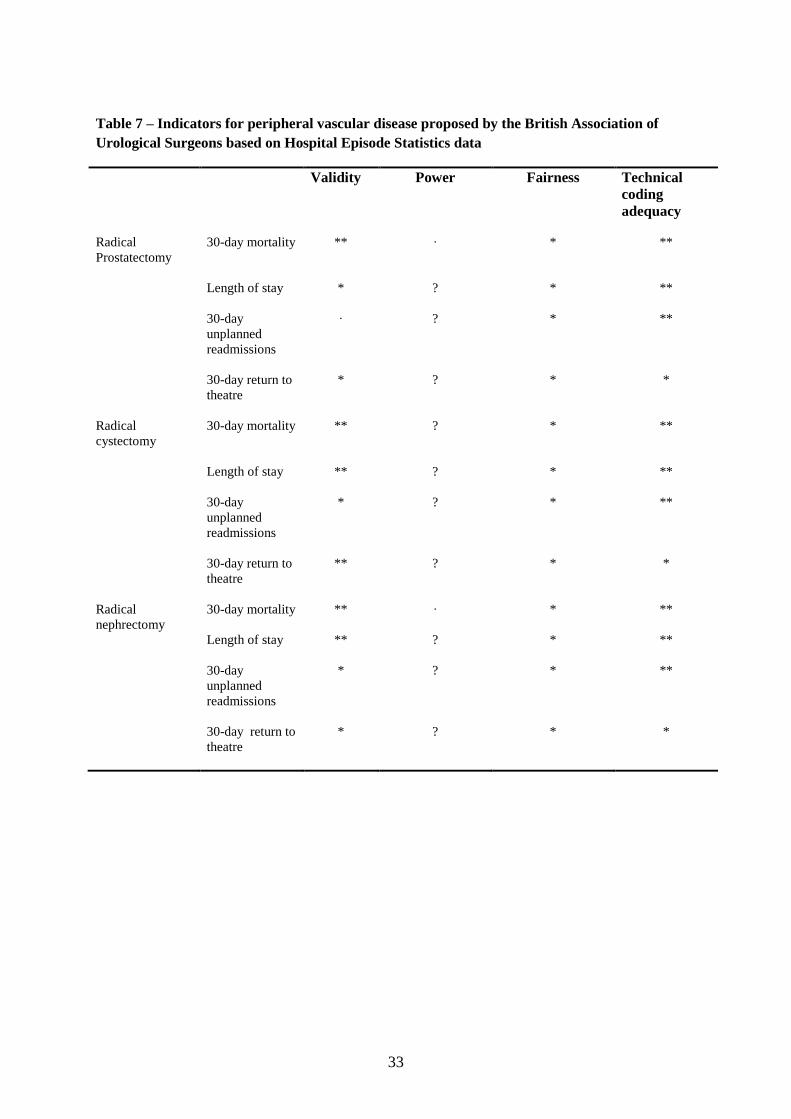
Table 7 – Indicators for peripheral vascular disease proposed by the British Association of
Urological Surgeons based on Hospital Episode Statistics data
Validity Power Fairness Technical
coding
adequacy
Radical
Prostatectomy
30-day mortality ** ∙ * **
Length of stay
* ? * **
30-day
unplanned
readmissions
∙ ? * **
30-day return to
theatre
* ? * *
Radical
cystectomy
30-day mortality ** ? * **
Length of stay
** ? * **
30-day
unplanned
readmissions
* ? * **
30-day return to
theatre
** ? * *
Radical
nephrectomy
30-day mortality ** ∙ * **
Length of stay
** ? * **
30-day
unplanned
readmissions
* ? * **
30-day return to
theatre
* ? * *

34
5. Overview of clinical databases
Introduction One of the aims of the Revalidation and HES Project was to compare results based on HES data with
those based on existing clinical databases. In preparation of that work, we contacted the Project
Board members to seek detailed information about the clinical databases that are available in their
clinical area. Databases were eligible for inclusion if they hold data at national level about individual
patients with a relatively common diagnosis or intervention within the three clinical areas of interest.
In this section, we summarise the characteristics of the following databases:
ischaemic heart disease:
o Society for Cardiothoracic Surgery (SCTS) database
o British Cardiovascular Intervention Society (BCIS) percutaneous coronary
intervention database
urological malignancy:
o British Association of Urological Society (BAUS) Cancer Registry
peripheral vascular disease:
o National Vascular Database (NVD)
o British Society of Intervention Radiology (BSIR) databases
Registry for Endovascular Treatment of Aneurysms (RETA)
British Iliac and Angioplasty Stenting register (BIAS)
Methods To assess these databases, a questionnaire was created to describe key characteristics of the database,
data quality, and data items. The questionnaire was sent out to Project Board members as well as to
others who have a direct responsibility for these databases. Answers were obtained by contacting the
recipients of the questionnaires via telephone or email and by consulting recent reports about the
databases, data dictionaries, and relevant websites.
Results Data collection was mandatory for the full SCTS database, part of the BCIS database and voluntary
for the others (Table 8). The RETA database has stopped collecting data in 2009 and was merged
with the NVD. All but one of the databases collected the data electronically, either via a web-based
data entry system or via uploads of data files. The BAUS database has a web based entry system and
stopped accepting paper forms in early 2010. The RETA database was solely paper-based.
All databases collected information on diagnosis, treatment, and disease severity (Table 9). All but
the RETA database collect information on comorbidity. All databases collect in-hospital outcomes.
There is considerable variety in the long term outcomes that are being collected. The SCTS and BCIS
databases obtain long term mortality data from the Office for National Statistics (ONS). Long term
outcomes other than mortality are collected by SCTS, BAUS and the NVD at follow up appointments.
The RETA database mailed out a questionnaire at one year.
All databases contain fields to measure outcomes such as length of stay and mortality. The SCTS
tracks outcomes at 30 days and 1 year; mortality is derived from ONS. BCIS also uses ONS
mortality. Two other databases (NVD and BAUS) record long term outcomes at follow up
appointments. How robust the follow up data is compared to the initial admission data is unclear.
The SCTS and BCIS stand out in terms of high case ascertainment and data completeness (Table 10).
BAUS reported a case ascertainment between 60% and 70%, but there is no information on data
completeness. Case ascertainment and data completeness for the other databases is less certain.

35
Discussion Based on the information that was available in 2010, the SCTS and the BCIS databases were the best
candidates to be compared against HES for the purpose of revalidation. The quality of these
databases, especially their high case ascertainment, compared well against the others. The BAUS
database could have been a further candidate but its case ascertainment is lower and data quality is
unknown. The other databases are in a state of development or transition. We felt that it was better to
wait until they have reached a consistent level of data quality.
Immediately following the conclusions from the overview of the clinical databases, we approached
both the SCTS and the BCIS in May 2010 with a request to share their data with us. The SCTS
provided an extract in late 2010. We received an extract of the BCIS data in April 2011.

36
Table 8 - Characteristics of the clinical databases SCTS BCIS BAUS NVD RETA BIAS
Data collection mandatory or voluntary?
Mandatory
Part of dataset mandatory
Voluntary
Voluntary
Voluntary
Voluntary
Web based or paper based?
Electronic data file uploaded to central system
Variety of local database entry systems; electronic data file uploaded to central system
Web based data entry into central database
Web based data entry into central database; also electronic data file uploaded to central system
Paper form sent to central data entry facility
Web base data entry into central database; also paper form sent to central data entry facility
Geographical coverage
UK & Ireland
UK
UK UK UK UK
Database lifespan 1994 – present
2003 – present
1998 – present
1997 –present
1996 – 2009 2000 –present
Linkable to HES? Yes Yes Yes
Yes Yes Yes
Are audit reports produced?
Most recent report 2009
Annually; most recent report 2008
Annually; date of most recent report unknown
Annually; most recent report 2009
No reports available; a report is being produced
Most recent report 2008

37
Table 9 - Data quality of the clinical databases SCTS BCIS BAUS NVD RETA BIAS
Case Ascertainment No formal data available; believed to be close to 100%
Close to 100% compared with self-reported total numbers of procedures
60-70% compared to Cancer Registry
2009 figures: 50% compared to HES for AAA and LLB, 70 % for CEA and 33% for amputations
Unknown Unknown
Data completeness High; “basic data” > 99% complete; “other data” (e.g. previous MI) > 90%
Most data item > 95% complete
Unknown Unknown
Unknown Unknown
Is data validated? Range and consistency checks within the database
Range and consistency checks within the database
Range and consistency checks within the database
Range and consistency checks at data entry
No No
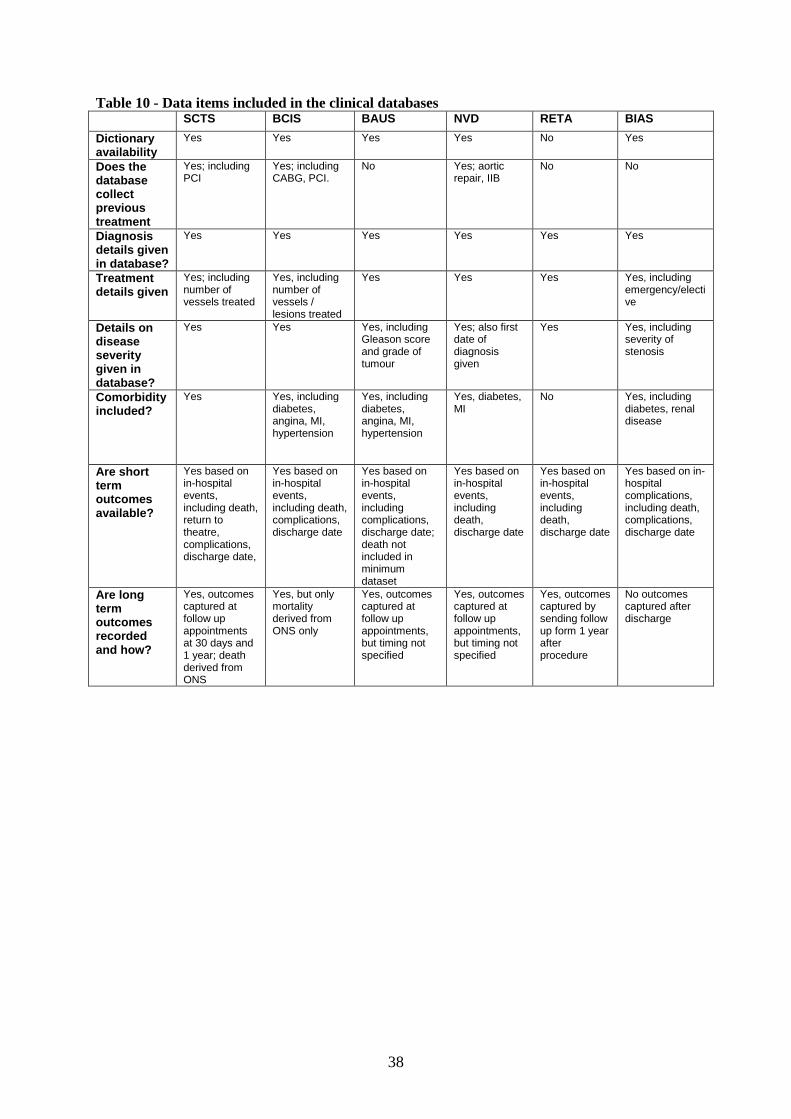
38
Table 10 - Data items included in the clinical databases SCTS BCIS BAUS NVD RETA BIAS
Dictionary availability
Yes Yes Yes Yes No Yes
Does the database collect previous treatment
Yes; including PCI
Yes; including CABG, PCI.
No Yes; aortic repair, IIB
No No
Diagnosis details given in database?
Yes Yes Yes Yes Yes Yes
Treatment details given
Yes; including number of vessels treated
Yes, including number of vessels / lesions treated
Yes Yes Yes Yes, including emergency/elective
Details on disease severity given in database?
Yes Yes Yes, including Gleason score and grade of tumour
Yes; also first date of diagnosis given
Yes Yes, including severity of stenosis
Comorbidity included?
Yes Yes, including diabetes, angina, MI, hypertension
Yes, including diabetes, angina, MI, hypertension
Yes, diabetes, MI
No Yes, including diabetes, renal disease
Are short term outcomes available?
Yes based on in-hospital events, including death, return to theatre, complications, discharge date,
Yes based on in-hospital events, including death, complications, discharge date
Yes based on in-hospital events, including complications, discharge date; death not included in minimum dataset
Yes based on in-hospital events, including death, discharge date
Yes based on in-hospital events, including death, discharge date
Yes based on in-hospital complications, including death, complications, discharge date
Are long term outcomes recorded and how?
Yes, outcomes captured at follow up appointments at 30 days and 1 year; death derived from ONS
Yes, but only mortality derived from ONS only
Yes, outcomes captured at follow up appointments, but timing not specified
Yes, outcomes captured at follow up appointments, but timing not specified
Yes, outcomes captured by sending follow up form 1 year after procedure
No outcomes captured after discharge

39
6. Use of Hospital Episode Statistics to investigate abdominal aortic aneurysm surgery in England
Introduction One of the issues concerning HES is the accuracy in coding. This has gone as far as the columns of a
national newspaper2 where differences were reported between self-reported trust figures and HES
numbers for procedures in AAA. Since AAA is a major procedure in England with a high mortality
rate, this was taken as a case study to assess the level of data accuracy in HES.
In this analysis, an explicit and transparent coding framework is proposed and evaluated to study the
HES data on patients undergoing open AAA surgery. The guiding principle underlying this coding
framework is that it aims to define groups of patients who are homogeneous with respect to their
diagnosis and prognosis as well as the treatment they have received. Firstly, definitions of diagnoses
and procedures were considered to identify codes that are potentially relevant. Secondly, the
frequency with which these potentially relevant codes had been used and the consistency of diagnostic
and procedure codes within the records of individual patients was assessed. Furthermore,
administrative codes were compared with diagnostic and procedure codes to check that patients who
had undergone emergency surgery for a ruptured AAA were admitted as an emergency. Thirdly, the
variation in the consistency of diagnostic and procedure codes among hospitals to identify hospitals
that had unusual coding practices was explored.
Methods In HES, the main diagnoses and procedures are represented within 3-character ICD-10 and OPCS-4
codes. A fourth character is used to provide a more detailed description. At 3-character level, the
ICD-10 code I71 represents patients with “aortic aneurysm and dissection”. No other 3-character
level codes were deemed relevant for the diagnosis of AAA. Within I71, only the 4-character level
codes I71.3 (“abdominal aortic aneurysm, ruptured”) and I71.4 (“abdominal aortic aneurysm, without
mention of rupture”) were considered potentially relevant. The other 4-character codes within I71
represented another diagnosis (“dissection of aorta”), aortic aneurysms at other anatomical locations (
“thoracic aortic aneurysm, ruptured”, “thoracic aortic aneurysm, without mention of rupture”,
“thoracoabdominal aortic aneurysm, ruptured”, or “thoracoabdominal aortic aneurysm, without
mention of rupture”), or aortic aneurysms at unspecified locations (“aortic aneurysm of unspecified
site, ruptured” or “aortic aneurysm of unspecified site, without mention of rupture”).
With respect to the procedure codes, L18 (“emergency replacement of aneurysmal segment of aorta”)
and L19 (“other replacement of aneurysmal segment of aorta”) were considered potentially the most
relevant, but other related 3-character level codes had to be considered as well: L20 (“other
emergency bypass of segment of aorta”), L21 (“other bypass of segment of aorta”), L22 (“attention to
prosthesis of aorta”), L23 (“plastic repair of aorta”), and L25 (“other open operations on aorta” which
includes endarterectomies and embolectomies). Codes for transluminal procedures were not included
as the objective was to include only open surgical procedures.
Funnel plots were used to explore the variation among NHS hospitals in the consistency of diagnostic
and procedure codes within records of individual patients. The plots show the percentage of patients
undergoing an AAA replacement who had a consistent diagnosis code as a function of the number of
patients who were operated. Only NHS hospitals were included that had carried out more than 40
procedures between 2003 and 2008. The inner funnel limits define the range of percentages that are
within two standard deviations of the national average and the outer limits define the range of
percentages which are within three standard deviations of the national average.
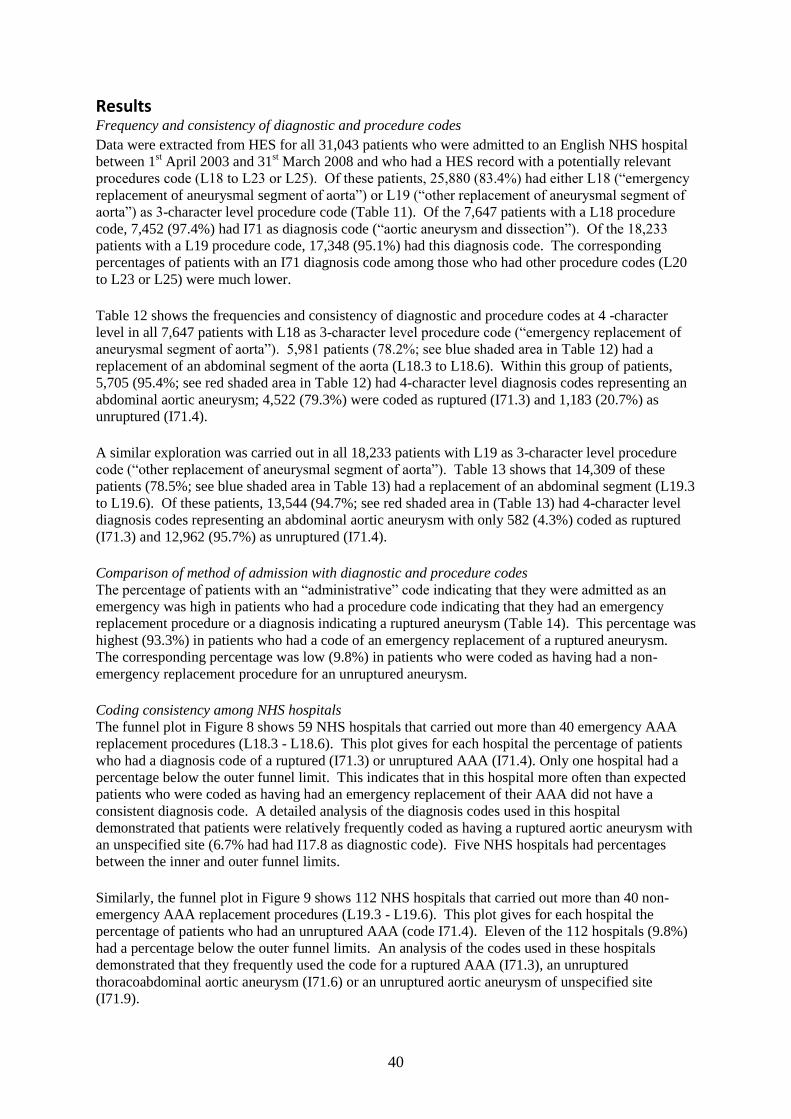
40
Results Frequency and consistency of diagnostic and procedure codes
Data were extracted from HES for all 31,043 patients who were admitted to an English NHS hospital
between 1st April 2003 and 31
st March 2008 and who had a HES record with a potentially relevant
procedures code (L18 to L23 or L25). Of these patients, 25,880 (83.4%) had either L18 (“emergency
replacement of aneurysmal segment of aorta”) or L19 (“other replacement of aneurysmal segment of
aorta”) as 3-character level procedure code (Table 11). Of the 7,647 patients with a L18 procedure
code, 7,452 (97.4%) had I71 as diagnosis code (“aortic aneurysm and dissection”). Of the 18,233
patients with a L19 procedure code, 17,348 (95.1%) had this diagnosis code. The corresponding
percentages of patients with an I71 diagnosis code among those who had other procedure codes (L20
to L23 or L25) were much lower.
Table 12 shows the frequencies and consistency of diagnostic and procedure codes at 4 -character
level in all 7,647 patients with L18 as 3-character level procedure code (“emergency replacement of
aneurysmal segment of aorta”). 5,981 patients (78.2%; see blue shaded area in Table 12) had a
replacement of an abdominal segment of the aorta (L18.3 to L18.6). Within this group of patients,
5,705 (95.4%; see red shaded area in Table 12) had 4-character level diagnosis codes representing an
abdominal aortic aneurysm; 4,522 (79.3%) were coded as ruptured (I71.3) and 1,183 (20.7%) as
unruptured (I71.4).
A similar exploration was carried out in all 18,233 patients with L19 as 3-character level procedure
code (“other replacement of aneurysmal segment of aorta”). Table 13 shows that 14,309 of these
patients (78.5%; see blue shaded area in Table 13) had a replacement of an abdominal segment (L19.3
to L19.6). Of these patients, 13,544 (94.7%; see red shaded area in (Table 13) had 4-character level
diagnosis codes representing an abdominal aortic aneurysm with only 582 (4.3%) coded as ruptured
(I71.3) and 12,962 (95.7%) as unruptured (I71.4).
Comparison of method of admission with diagnostic and procedure codes
The percentage of patients with an “administrative” code indicating that they were admitted as an
emergency was high in patients who had a procedure code indicating that they had an emergency
replacement procedure or a diagnosis indicating a ruptured aneurysm (Table 14). This percentage was
highest (93.3%) in patients who had a code of an emergency replacement of a ruptured aneurysm.
The corresponding percentage was low (9.8%) in patients who were coded as having had a non-
emergency replacement procedure for an unruptured aneurysm.
Coding consistency among NHS hospitals
The funnel plot in Figure 8 shows 59 NHS hospitals that carried out more than 40 emergency AAA
replacement procedures (L18.3 - L18.6). This plot gives for each hospital the percentage of patients
who had a diagnosis code of a ruptured (I71.3) or unruptured AAA (I71.4). Only one hospital had a
percentage below the outer funnel limit. This indicates that in this hospital more often than expected
patients who were coded as having had an emergency replacement of their AAA did not have a
consistent diagnosis code. A detailed analysis of the diagnosis codes used in this hospital
demonstrated that patients were relatively frequently coded as having a ruptured aortic aneurysm with
an unspecified site (6.7% had had I17.8 as diagnostic code). Five NHS hospitals had percentages
between the inner and outer funnel limits.
Similarly, the funnel plot in Figure 9 shows 112 NHS hospitals that carried out more than 40 non-
emergency AAA replacement procedures (L19.3 - L19.6). This plot gives for each hospital the
percentage of patients who had an unruptured AAA (code I71.4). Eleven of the 112 hospitals (9.8%)
had a percentage below the outer funnel limits. An analysis of the codes used in these hospitals
demonstrated that they frequently used the code for a ruptured AAA (I71.3), an unruptured
thoracoabdominal aortic aneurysm (I71.6) or an unruptured aortic aneurysm of unspecified site
(I71.9).

41
Discussion The results show that the coding consistency is high. For example, 95% of patients undergoing AAA
replacement had a consistent diagnosis. The direction of the association between the urgency of the
operation and whether or not the AAA was ruptured was as expected: only 4% undergoing a non-
emergency replacement were coded as having a ruptured AAA. There was also a clear association
between administrative and clinical codes: 93% of the patients who had undergone an emergency
replacement of a ruptured AAA were coded as having been admitted as an emergency whereas the
corresponding figure was 10% in those who had undergone a non-emergency replacement of an
unruptured AAA.
The proposed stepwise coding approach provides a number of advantages. First, the coding
framework can be used to improve the selection of patients depending on the purpose of the study.
The price to pay for only including patients who have consistent diagnostic and procedure codes is the
loss of about 5% of the patients. This is equivalent to a case ascertainment of 95% which compares
favourably with the case ascertainment achieved by almost all of the national clinical audits (i.e.
prospective studies of the process and outcome of care) carried out in England43
.
Second, the coding framework allows an assessment of the extent of the potential miscoding. The
urgency of the procedure can be matched against whether the aneurysm was ruptured or not and
against whether the patient was admitted as an emergency. In this study, it is reassuring to observe
that only about 4% of the patients undergoing a non-emergency replacement had a diagnostic code of
a ruptured AAA whereas about 20% of patients undergoing an emergency replacement had a
diagnostic code of AAA without mention of rupture. One expects the latter percentage to be higher as
the urgency of the replacement of an unruptured AAA may also depend on the presence of symptoms
as well as its size or the extent of its growth.
A third advantage is that an investigation of consistency of diagnostic and procedure codes among
NHS hospitals can help to identify individual hospitals that seem to have divergent coding practices
and may benefit from a comparison of their HES data with case notes. These hospitals could then be
specifically targeted to bring their coding practice into line with national recommendations.
Alternatively, it may help to recognise hospitals that are more likely to have diverse patients including
those with suprarenal and thoracoabdominal aortic aneurysms.
Applying the proposed coding framework and the reporting of the frequency and consistency of the
diagnostic and procedure codes at national level could have a similar positive impact on clinicians‟
confidence in the accuracy of HES data. It is therefore recommended that each study that uses HES
for audit or research should use an explicit and transparent coding framework and report coding
frequency and consistency.
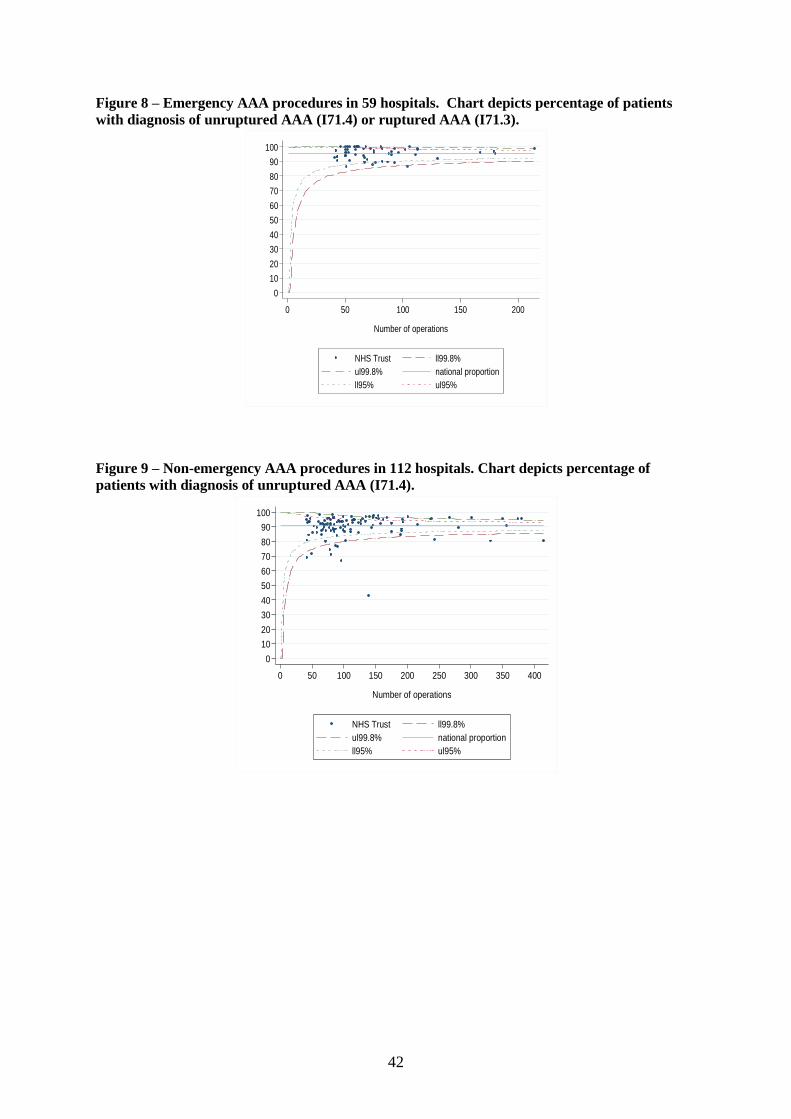
42
Figure 8 – Emergency AAA procedures in 59 hospitals. Chart depicts percentage of patients
with diagnosis of unruptured AAA (I71.4) or ruptured AAA (I71.3).
0
10
20
30
40
50
60
70
80
90
100%
dia
gn
ose
d I71
.3-I
71.4
0 50 100 150 200
Number of operations
NHS Trust ll99.8%
ul99.8% national proportion
ll95% ul95%
Figure 9 – Non-emergency AAA procedures in 112 hospitals. Chart depicts percentage of
patients with diagnosis of unruptured AAA (I71.4).
0
10
20
30
40
50
60
70
80
90
100
% d
iagn
ose
d I71
.4
0 50 100 150 200 250 300 350 400
Number of operations
NHS Trust ll99.8%
ul99.8% national proportion
ll95% ul95%
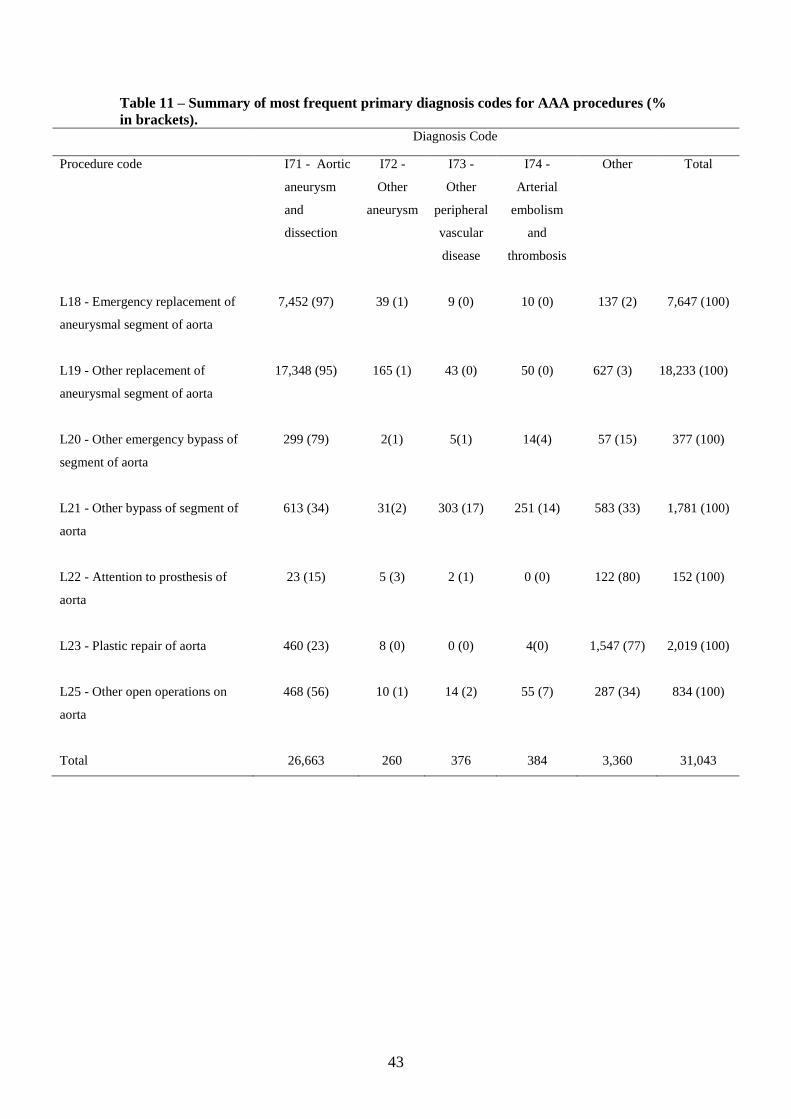
43
Table 11 – Summary of most frequent primary diagnosis codes for AAA procedures (%
in brackets). Diagnosis Code
Procedure code I71 - Aortic
aneurysm
and
dissection
I72 -
Other
aneurysm
I73 -
Other
peripheral
vascular
disease
I74 -
Arterial
embolism
and
thrombosis
Other Total
L18 - Emergency replacement of
aneurysmal segment of aorta
7,452 (97) 39 (1) 9 (0) 10 (0) 137 (2) 7,647 (100)
L19 - Other replacement of
aneurysmal segment of aorta
17,348 (95) 165 (1) 43 (0) 50 (0) 627 (3) 18,233 (100)
L20 - Other emergency bypass of
segment of aorta
299 (79) 2(1) 5(1) 14(4) 57 (15) 377 (100)
L21 - Other bypass of segment of
aorta
613 (34) 31(2) 303 (17) 251 (14) 583 (33) 1,781 (100)
L22 - Attention to prosthesis of
aorta
23 (15) 5 (3) 2 (1) 0 (0) 122 (80) 152 (100)
L23 - Plastic repair of aorta 460 (23) 8 (0) 0 (0) 4(0) 1,547 (77) 2,019 (100)
L25 - Other open operations on
aorta
468 (56) 10 (1) 14 (2) 55 (7) 287 (34) 834 (100)
Total 26,663 260 376 384 3,360 31,043

44
Table 12 – Cross tabulation of four character procedure code L18 against diagnosis code I71 (% in brackets). Shaded regions represent patient
groups discussed in the text.
Diagnosis
Dissection of
aorta
Thoracic
aortic
aneurysm,
ruptured
Thoracic
aortic
aneurysm,
without
mention of
rupture
AAA ruptured AAA without
mention of
rupture
Thoraco
AAA
ruptured
Thoraco
AAA
without
mention of
rupture
Aortic
aneurysm of
unspecified
site, ruptured
Aortic
aneurysm of
unspecified
site, without
mention of
rupture
Other codes
Procedure
code
Emergency
replacement of
aneurismal
I71.0 I71.1 I71.2 I71.3 I71.4 I71.5 I71.6 I71.8 I71.9 Total
L18.1 segment of ascending
aorta 300 (60) 28 (6) 27 (5) 73 (15) 30 (6) 1 (0) 0 (0) 2 (0) 8 (2) 27 (5) 496
L18.2 segment of thoracic
aorta 38 (31) 19 (16) 21 (17) 11 (9) 3 (2) 10 (8) 5 (4) 0 (0) 1 (1) 13 (11) 121
L18.3 segment
of suprarenal
abdominal aorta
0 (0) 0 (0) 0 (0) 123 (80) 22 (14) 4 (3) 1 (1) 0 (0) 1 (1) 2 (1) 153
L18.4 infrarenal abdominal
aorta 23 (1) 3 (0) 2 (0) 1,997 (75) 588 (22) 6 (0) 2 (0) 14 (1) 7 (0) 35 (1) 2,677
L18.5 segment of
abdominal aorta 31 (1) 3 (0) 4 (0) 1,740 (78) 373 (17) 4 (0) 0 (0) 21 (1) 6 (0) 39 (2) 2,221
L18.6 bifurcation of aorta
by anastomosis of
aorta to iliac artery
12 (1) 0 (0) 1 (0) 662 (71) 200 (22) 2 (0) 0 (0) 9 (1) 2 (0) 42 (5) 930
L18.8 Other specified 38 (9) 5 (1) 3 (1) 273 (63) 77 (18) 5 (1) 0 (0) 6 (1) 3 (1) 22 (5) 432
L18.9 Unspecified 27 (4) 2 (0) 1 (0) 418 (68) 131 (21) 1 (0) 1 (0) 17 (3) 4 (1) 15 (2) 617
Total 469 (6) 60 (1) 59 (1) 5,297 (69) 1,424 (19) 33 (0) 9 (0) 69 (1) 32 (0) 195 (3) 7,647

45
Table 13 – Cross tabulation of four character procedure code L19 against diagnosis code I71 (% in brackets). Shaded regions represent patient
groups discussed in the texts.
Diagnosis
Dissection of
aorta
Thoracic
aortic
aneurysm,
ruptured
Thoracic
aortic
aneurysm,
without
mention of
rupture
AAA
ruptured
AAA without
mention of
rupture
Thoraco
AAA
ruptured
Thoraco AAA
without
mention of
rupture
Aortic
aneurysm of
unspecified
site, ruptured
Aortic
aneurysm of
unspecified
site, without
mention of
rupture
Other codes
Procedure
code
Other replacement
of aneurismal
I71.0 I71.1 I71.2 I71.3 I71.4 I71.5 I71.6 I71.8 I71.9 Total
L19.1 segment of
ascending aorta 150 (14) 29 (3) 315 (30) 12 (1) 199 (19) 0 (0) 3 (0) 4 (0) 74 (7) 270 (26) 1,056
L19.2 segment of thoracic
aorta 52 (12) 20 (4) 143 (32) 8 (2) 56 (12) 10 (2) 85 (19) 0 (0) 6 (1) 71 (16) 451
L19.3 segment
of suprarenal
abdominal aorta
1 (0) 1 (0) 9 (2) 19 (5) 300 (76) 3 (1) 37 (9) 0 (0) 5 (1) 22 (6) 397
L19.4 infrarenal
abdominal aorta 16 (0) 3 (0) 10 (0) 217 (3) 5,821 (92) 3 (0) 18 (0) 3 (0) 83 (1) 133 (2) 6,307
L19.5 segment of
abdominal aorta 15 (0) 1 (0) 12 (0) 271 (6) 4,383 (91) 6 (0) 14 (0) 9 (0) 43 (1) 81 (2) 4,836
L19.6 bifurcation of aorta
by anastomosis of
aorta to iliac artery
8 (0) 1 (0) 21 (1) 75 (3) 2,458 (89) 0 (0) 8 (0) 5 (0) 52 (2) 141 (5) 2,769
L19.8 Other specified 38 (3) 17 (1) 69 (5) 57 (4) 1,062 (74) 3 (0) 25 (2) 2 (0) 41 (3) 127 (9) 1,441
L19.9 Unspecified 4 (0) 0 (0) 8 (1) 77 (8) 820 (84) 0 (0) 3 (0) 2 (0) 22 (2) 40 (4) 976
Total 284 (2) 72 (0) 587 (3) 736 (4) 15,099 (83) 25 (0) 193 (1) 25 (0) 326 (2) 885 (5) 18,233

46
Table 14 – Percentage of patients admitted as an emergency* by 4-character level diagnostic
and procedure code
Percentage of patients admitted as an emergency*
Diagnostic code
I71.3
Abdominal aortic
aneurysm,
ruptured
I71.4
Abdominal
aortic aneurysm
without mention
of rupture
Procedure code
L18.3 to L18.6
Emergency replacement of aneurysmal segment of
abdominal aorta
93.3%
(=4,219 / 4,522)
80.4%
(=951 / 1,183)
L19.3 to L19.6
Other replacement of aneurysmal segment of abdominal
aorta
79.7%
(=464 / 582)
9.8%
(=1,270 / 12,962)
* Identified in HES as patients with an admission method code of 21, 22, 23, 24 and 28.

47
7. Comparison of HES with clinical databases of the Society for Cardiothoracic Surgery and the British Cardiovascular Intervention Society
Introduction An important objective of this project was to compare results of the case studies based on
Hospital Episode Statistics database (HES) with those based on available clinical databases.
For this comparison to be informative, the case ascertainment and data completeness of the
clinical databases need to have reached a satisfactory level. As explained in Chapter 5, only
the databases from the Society for Cardiothoracic Surgery (SCTS) and the British
Cardiovascular Intervention Society (BCIS) had levels of case ascertainment and data
completeness deemed high enough to justify a comparison with HES.
In this chapter, we describe the comparison of the SCTS and the BCIS databases with the
HES database. Our original plan for this work was to explore the level of agreement in the
number of procedures and number of patients who die in the period after coronary artery
bypass graft surgery (CABG) and after a percutaneous coronary intervention (PCI). This
includes the level of agreement at trust level and at consultant level.
Comparison of HES with SCTS data for CABG surgery In HES, we defined patients who had a CABG procedure if a relevant OPCS code (Table 15)
was found in any of the first twelve procedure fields in a record of a hospital admission
between 1st April 2007 to 31st March 2009. The dataset was then filtered further to only
include patients with a diagnosis of angina (International classification of diseases ICD-1044
code I20), myocardial infarction (I21-I23), or ischaemic heart disease (I24-I25) in any of the
first nine diagnosis fields. Records which had a valve procedure concurrent with CABG were
excluded (mitral, aortic, pulmonary or tricuspid).
The data provided to us by the SCTS was filtered for the same time period as HES for
procedures recorded as „CABG only‟ or „CABG + other‟. The latter indicates that only minor
procedures have taken place in addition to CABG. As with HES, we excluded records with
evidence of a valve procedure.
To compare mortality data in HES and SCTS, we measured 30-day in hospital mortality.
Again, HES was linked to ONS for mortality data. For SCTS, mortality was identified as
records which had „dead‟ under status at discharge or dead under „discharge destination‟. For
those flagged as deceased, the discharge date and procedure date was used to measure the 30-
day period.
The SCTS dataset holds fields for various risk factors, 17 of which have been included in the
mortality risk scoring system EuroSCORE 45
. If a categorical risk factor for a patient which
contributes to EuroSCORE was missing, this field was recorded as zero. The EuroSCORE
model that we used was created by re-estimating the coefficients of the 17 risk factors in a
logistic regression model. We also developed a model in HES that included age, sex,
ethnicity, socio-economic status, type of admission, number of prior emergency admissions
and comorbidity using the RCS Charlson comorbidity score 41
as well as previous myocardial
information and prior CABG procedures.
To compare risk the adjustment models for both comparisons, we used the C statistics as a
measure of discriminatory power which corresponds to the area under the receiver operative
characteristic (ROC) curve scores. To compare how well the models were calibrated, we
applied the Hosmer Lemeshow test 46
. This test splits patients into ten risk groups according

48
to the predicted mortality and compares the observed and predicted mortality in each of these
risk groups. Funnel plots were created as described in Chapter 4 to compare mortality among
the NHS trusts.
Table 16 demonstrates that 37,712 patients were identified in the SCTS database for CABG
procedures with a 30-day mortality rate of 1.5% (= 556 / 37,712). These patients were treated
in 29 NHS trusts in England. In HES, we identified 37,542 patients treated in the same NHS
trusts and we observed a mortality rate of 1.4% (= 535 / 37,542).
We compared the number of procedures at NHS trust level and found very good agreement
for 18 trusts (ratio of number of procedure in HES and number of procedures in SCTS
between 97% and 103%). Two NHS trusts showed very poor agreement (ratios of 63% and
122%). We also compared the mortality according to HES and the SCTS database and found
that mortality according to HES was at least 10% higher in five NHS trusts and at least 10%
lower in ten NHS trusts than according to SCTS data.
We found that applying the logistic EuroSCORE with coefficients re-estimated in SCTS data
had good discriminatory power with a C statistic of 0.83 (Table 17). A similar model derived
in HES data had a C statistic of 0.81. The calibration plots comparing observed and expected
mortality by risk groups in HES and SCTS data show good calibration (Figure 10 and Figure
11).
When comparing risk-adjusted mortality at trust level, we found two trusts to be above the
upper outer control limit according to SCTS data. These trusts are marked with a circle and a
triangle in Figure 12. The mortality results of these trusts were only above the upper inner
control limit of the funnel according to HES data (see Figure 13). We have also indicated in
Figure 12 and 13 the NHS trusts with the largest differences in number of procedures
recorded according to HES and SCTS (denoted by x and +).
We found two consultants to have mortality results, indicated with a circle and square in
Figure 14 above the upper outer funnel according to SCTS data. The results for one of these
consultants were found to be within the outer funnel limits according to HES data (Figure 15).
When comparing the numbers of procedures at consultant level we found four with higher
numbers according to SCTS data than according to HES (Figure 16). These consultants were
all from the same NHS trust. Three consultants were found to have lower numbers of
procedures according to SCTS data and these were all from the same trust as well.
Comparison of HES with BCIS data for percutaneous coronary interventions In HES we identified percutaneous coronary interventions (PCIs) according to the OPCS
codes presented in Table 15. Patients were selected if they had a PCI code between 1st April
2007 and 31st March 2009 according to any of the first twelve procedure fields in a HES
record. Furthermore, the data was validated and cleaned. The same validation cleaning
procedures were applied to the BCIS dataset. The BCIS dataset was then filtered further to
only include admissions in English NHS trusts.
We compared 30-day mortality according to HES and BCIS data. We used a similar risk
adjustment approach as described earlier for the CABG procedures.
The BCIS database contained records from 71 NHS trusts (Table 18). In HES 110 trusts were
found which had recorded a PCI. When comparing only the 71 trusts in HES which were also
in the BCIS database, HES had 106,202 PCIs. The exclusion of data for 39 NHS trusts (=
110 – 71) resulted in the removal of only 278 cases. A total of 115,828 PCIs were found in
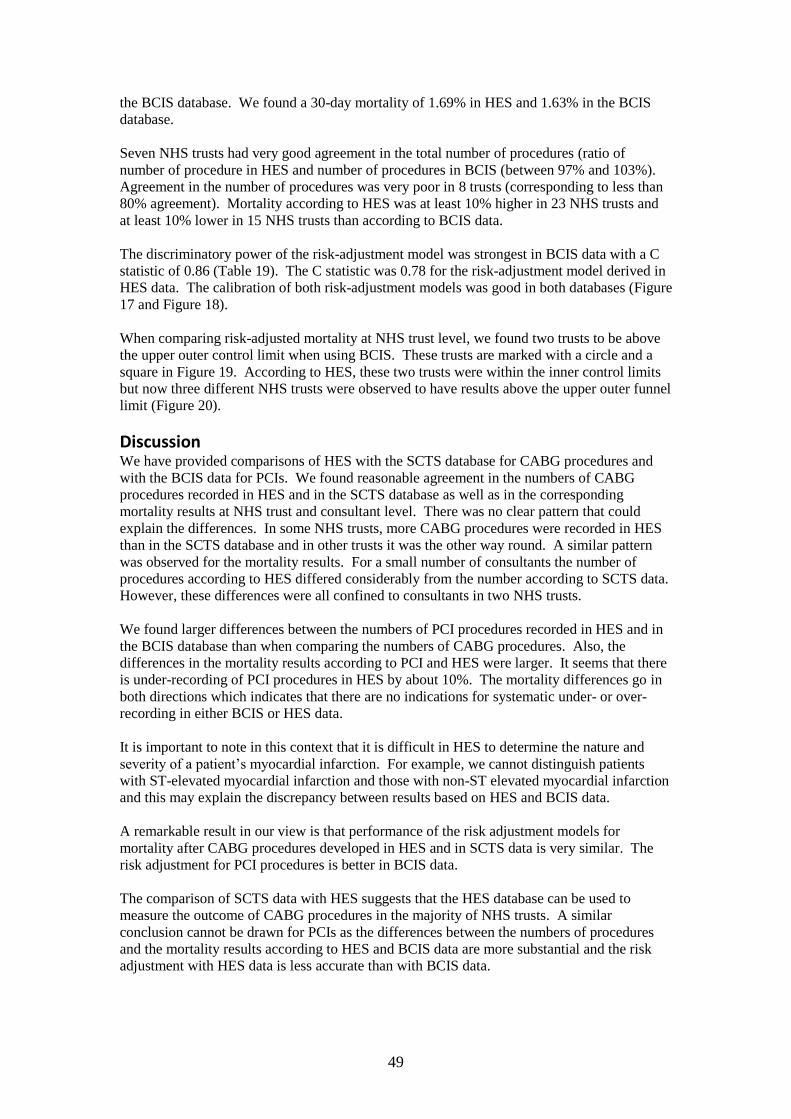
49
the BCIS database. We found a 30-day mortality of 1.69% in HES and 1.63% in the BCIS
database.
Seven NHS trusts had very good agreement in the total number of procedures (ratio of
number of procedure in HES and number of procedures in BCIS (between 97% and 103%).
Agreement in the number of procedures was very poor in 8 trusts (corresponding to less than
80% agreement). Mortality according to HES was at least 10% higher in 23 NHS trusts and
at least 10% lower in 15 NHS trusts than according to BCIS data.
The discriminatory power of the risk-adjustment model was strongest in BCIS data with a C
statistic of 0.86 (Table 19). The C statistic was 0.78 for the risk-adjustment model derived in
HES data. The calibration of both risk-adjustment models was good in both databases (Figure
17 and Figure 18).
When comparing risk-adjusted mortality at NHS trust level, we found two trusts to be above
the upper outer control limit when using BCIS. These trusts are marked with a circle and a
square in Figure 19. According to HES, these two trusts were within the inner control limits
but now three different NHS trusts were observed to have results above the upper outer funnel
limit (Figure 20).
Discussion We have provided comparisons of HES with the SCTS database for CABG procedures and
with the BCIS data for PCIs. We found reasonable agreement in the numbers of CABG
procedures recorded in HES and in the SCTS database as well as in the corresponding
mortality results at NHS trust and consultant level. There was no clear pattern that could
explain the differences. In some NHS trusts, more CABG procedures were recorded in HES
than in the SCTS database and in other trusts it was the other way round. A similar pattern
was observed for the mortality results. For a small number of consultants the number of
procedures according to HES differed considerably from the number according to SCTS data.
However, these differences were all confined to consultants in two NHS trusts.
We found larger differences between the numbers of PCI procedures recorded in HES and in
the BCIS database than when comparing the numbers of CABG procedures. Also, the
differences in the mortality results according to PCI and HES were larger. It seems that there
is under-recording of PCI procedures in HES by about 10%. The mortality differences go in
both directions which indicates that there are no indications for systematic under- or over-
recording in either BCIS or HES data.
It is important to note in this context that it is difficult in HES to determine the nature and
severity of a patient‟s myocardial infarction. For example, we cannot distinguish patients
with ST-elevated myocardial infarction and those with non-ST elevated myocardial infarction
and this may explain the discrepancy between results based on HES and BCIS data.
A remarkable result in our view is that performance of the risk adjustment models for
mortality after CABG procedures developed in HES and in SCTS data is very similar. The
risk adjustment for PCI procedures is better in BCIS data.
The comparison of SCTS data with HES suggests that the HES database can be used to
measure the outcome of CABG procedures in the majority of NHS trusts. A similar
conclusion cannot be drawn for PCIs as the differences between the numbers of procedures
and the mortality results according to HES and BCIS data are more substantial and the risk
adjustment with HES data is less accurate than with BCIS data.
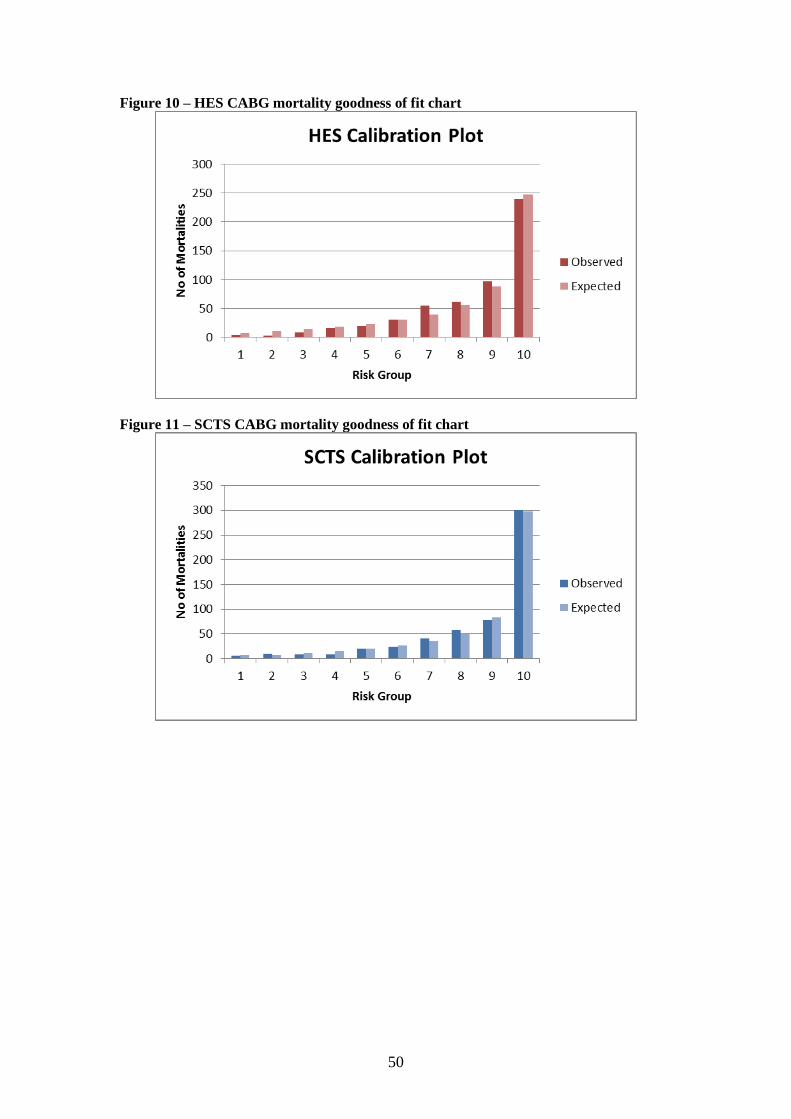
50
Figure 10 – HES CABG mortality goodness of fit chart
Figure 11 – SCTS CABG mortality goodness of fit chart

51
Figure 12 – SCTS CABG mortality funnel chart by trust. Symbols denote outlying
trusts.
0
1
2
3
4
5
6
7
8
9
10
% 3
0 d
ay m
ort
alit
y
0 200 400 600 800 1000 1200 1400 1600 1800 2000
Number of operations
Trust ll99.8%
ul99.8% national proportion
ll95% ul95%
SCTS CABG 30 day Euroscore adjusted mortality by trust
Figure 13 – HES CABG mortality funnel chart by trust. Symbols denote outlying trusts.
0
1
2
3
4
5
6
7
8
9
10
% 3
0 d
ay m
ort
alit
y
0 200 400 600 800 1000 1200 1400 1600 1800 2000
Number of operations
Trust ll99.8%
ul99.8% national proportion
ll95% ul95%
HES CABG 30 day adjusted mortality by trust
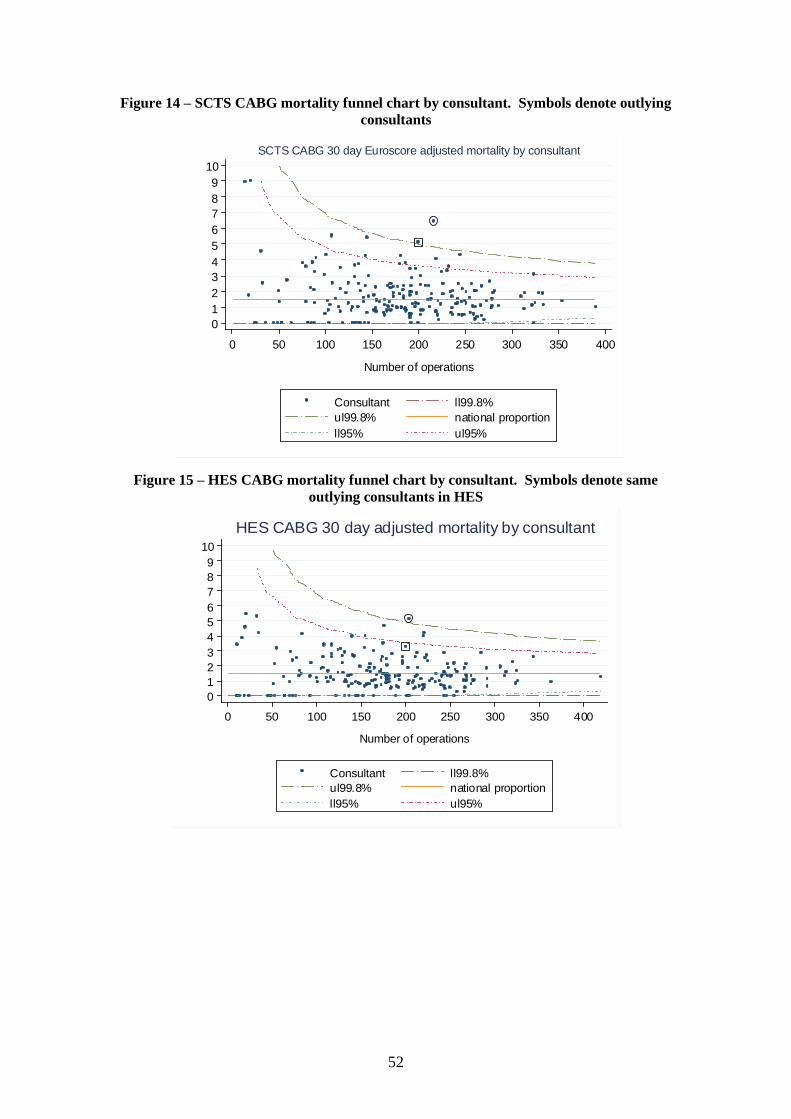
52
Figure 14 – SCTS CABG mortality funnel chart by consultant. Symbols denote outlying
consultants
Figure 15 – HES CABG mortality funnel chart by consultant. Symbols denote same
outlying consultants in HES
0
1
2
3
4
5
6
7
8
9
10
% 3
0 d
ay
mort
alit
y
0 50 100 150 200 250 300 350 400
Number of operations
Consultant ll99.8%
ul99.8% national proportion
ll95% ul95%
HES CABG 30 day adjusted mortality by consultant
0
1
2
3
4
5
6
7
8
9
10
% 3
0 d
ay m
ort
alit
y
0 50 100 150 200 250 300 350 400
Number of operations
Consultant ll99.8%
ul99.8% national proportion
ll95% ul95%
SCTS CABG 30 day Euroscore adjusted mortality by consultant

53
Figure 16 – Comparison of number of CABG procedures by consultants in SCTS
against HES. Squares and circles denote consultants from same hospitals, 12 & 21
respectively.
0
10
02
00
30
04
00
Nu
mb
er o
f p
roc
ed
ure
s i
n S
CT
S
0 1 00 2 0 0 3 0 0 4 0 0
N u m b e r o f p ro c e d u r e s in H E S
C o n s u lta n t L in e of n e u tr a li ty
C o m p a r is o n o f C A B G P ro c ed u re s in S C T S & H E S b y C o n s u ltan t
Figure 17 – BCIS PCI mortality goodness of fit chart
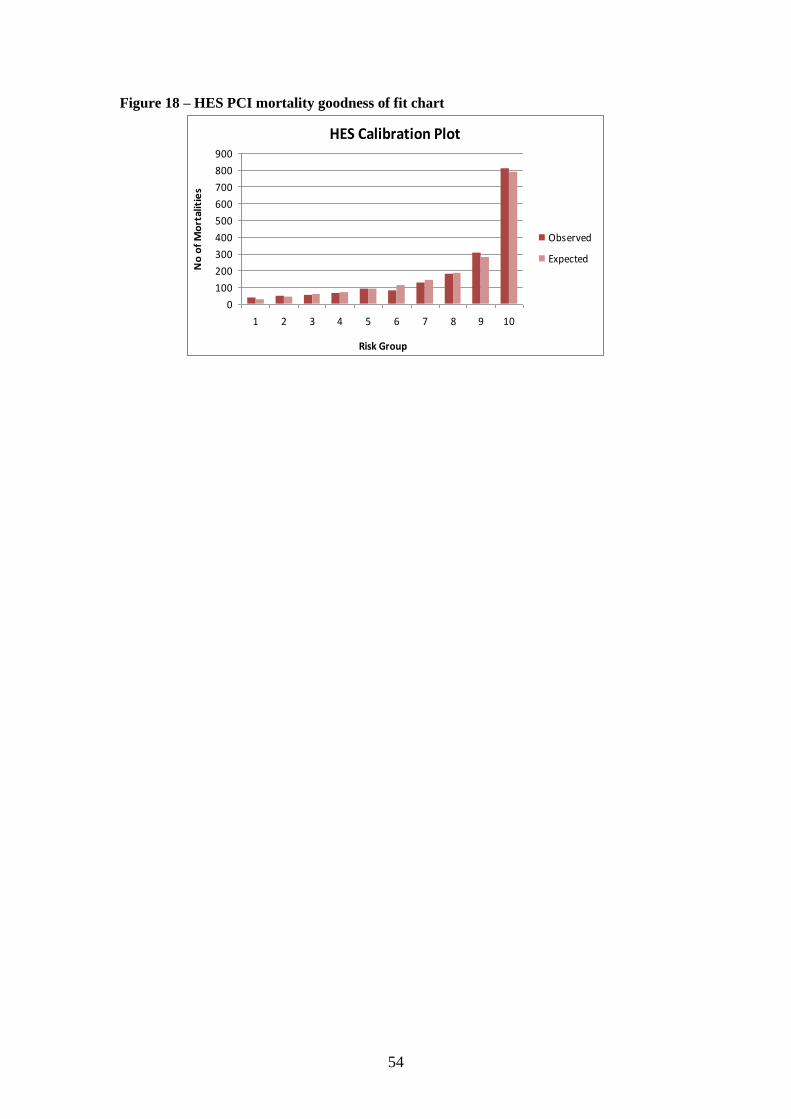
54
Figure 18 – HES PCI mortality goodness of fit chart
HES Calibration Plot
0
100
200
300
400
500
600
700
800
900
1 2 3 4 5 6 7 8 9 10
Risk Group
No
of
Mo
rtal
itie
s
Observed
Expected
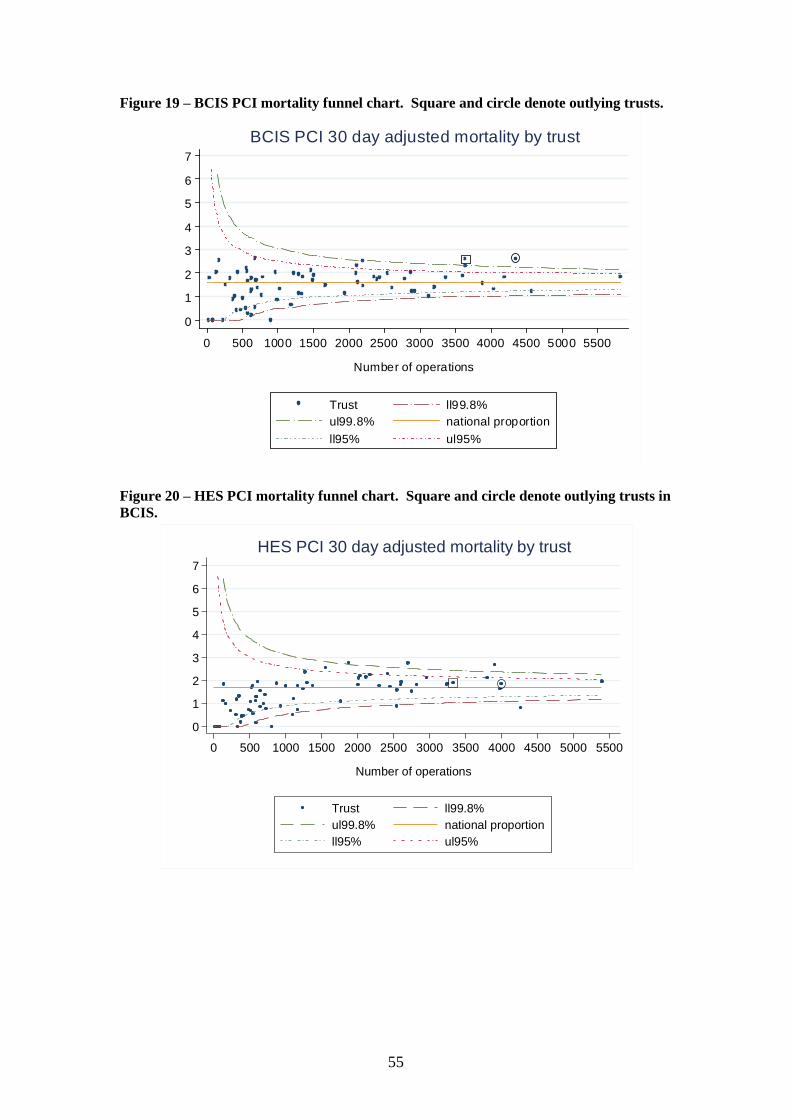
55
Figure 19 – BCIS PCI mortality funnel chart. Square and circle denote outlying trusts.
0
1
2
3
4
5
6
7
% 3
0 d
ay m
ort
ality
0 500 1000 1500 2000 2500 3000 3500 4000 4500 5000 5500
Number of operations
Trust ll99.8%
ul99.8% national proportion
ll95% ul95%
BCIS PCI 30 day adjusted mortality by trust
Figure 20 – HES PCI mortality funnel chart. Square and circle denote outlying trusts in
BCIS.
0
1
2
3
4
5
6
7
% 3
0 d
ay m
ort
alit
y
0 500 1000 1500 2000 2500 3000 3500 4000 4500 5000 5500
Number of operations
Trust ll99.8%
ul99.8% national proportion
ll95% ul95%
HES PCI 30 day adjusted mortality by trust

56
Table 15 – OPCS codes used to identify PCI and CABG procedures in HES SCTS – CABG BCIS – PCI
K40 – Saphenous vein graft replacement
of coronary artery
K41 – Other autograft replacement of
coronary artery
K42 – Allograft replacement of coronary
artery
K43 – Prosthetic replacement of coronary
artery
K44 – Other replacement of coronary
artery
K45 – Connection of thoracic artery to
coronary artery
K46 – Other bypass of coronary artery
K49 – Transluminal balloon angioplasty
of coronary artery
K50.1 – Percutaneous transluminal laser
coronary angioplasty
K50.4 – Percutaneous transluminal
atherectomy of coronary artery
K50.8 – Other specified
K50.9 – Unspecified
K75 – Percutaneous transluminal balloon
angioplasty and stenting of coronary
artery
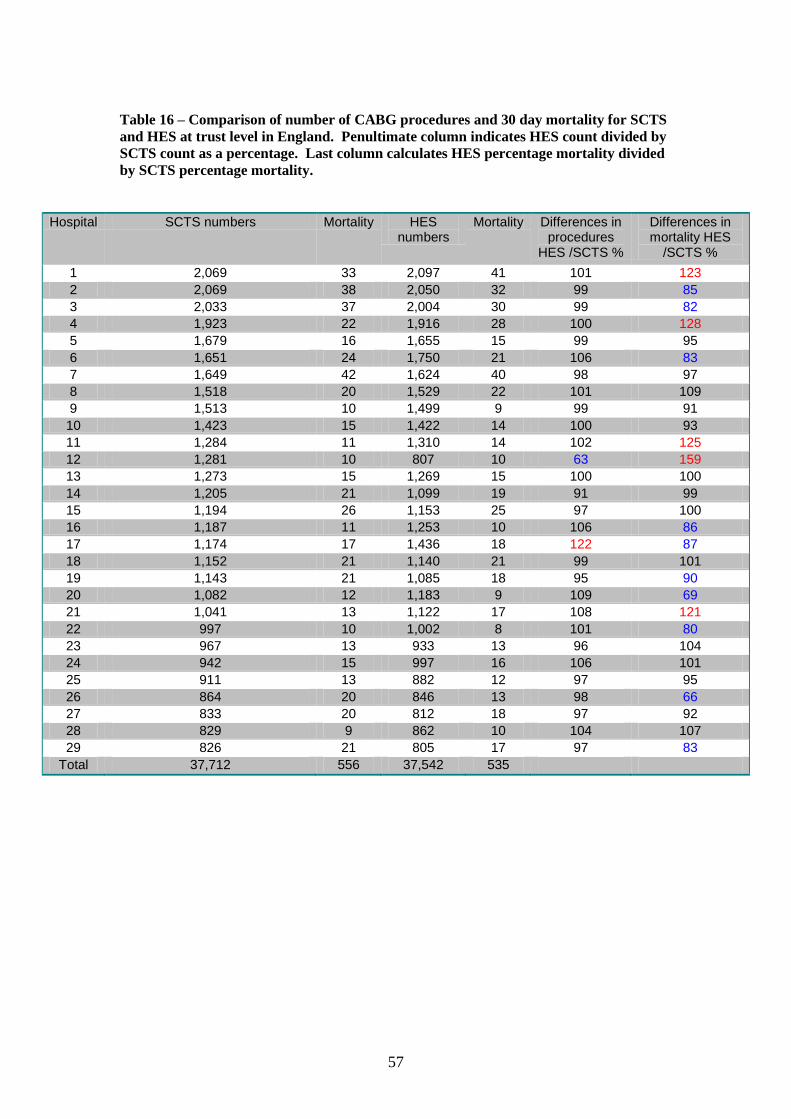
57
Table 16 – Comparison of number of CABG procedures and 30 day mortality for SCTS
and HES at trust level in England. Penultimate column indicates HES count divided by
SCTS count as a percentage. Last column calculates HES percentage mortality divided
by SCTS percentage mortality.
Hospital SCTS numbers Mortality HES numbers
Mortality Differences in procedures
HES /SCTS %
Differences in mortality HES
/SCTS %
1 2,069 33 2,097 41 101 123
2 2,069 38 2,050 32 99 85
3 2,033 37 2,004 30 99 82
4 1,923 22 1,916 28 100 128
5 1,679 16 1,655 15 99 95
6 1,651 24 1,750 21 106 83
7 1,649 42 1,624 40 98 97
8 1,518 20 1,529 22 101 109
9 1,513 10 1,499 9 99 91
10 1,423 15 1,422 14 100 93
11 1,284 11 1,310 14 102 125
12 1,281 10 807 10 63 159
13 1,273 15 1,269 15 100 100
14 1,205 21 1,099 19 91 99
15 1,194 26 1,153 25 97 100
16 1,187 11 1,253 10 106 86
17 1,174 17 1,436 18 122 87
18 1,152 21 1,140 21 99 101
19 1,143 21 1,085 18 95 90
20 1,082 12 1,183 9 109 69
21 1,041 13 1,122 17 108 121
22 997 10 1,002 8 101 80
23 967 13 933 13 96 104
24 942 15 997 16 106 101
25 911 13 882 12 97 95
26 864 20 846 13 98 66
27 833 20 812 18 97 92
28 829 9 862 10 104 107
29 826 21 805 17 97 83
Total 37,712 556 37,542 535

58
Table 17 – Mortality and ROC score comparison for HES and SCTS
Model Observations 30 day
mortality
ROC Score 95% confidence interval
SCTS logistic EuroSCORE
- CABG
37,712 1.47% 0.81 0.79 0.83
SCTS recalibrated
logistic EuroSCORE -
CABG
37,712 1.47% 0.83 0.81 0.85
HES – CABG (model 2) 37,542 1.43% 0.81 0.79 0.83
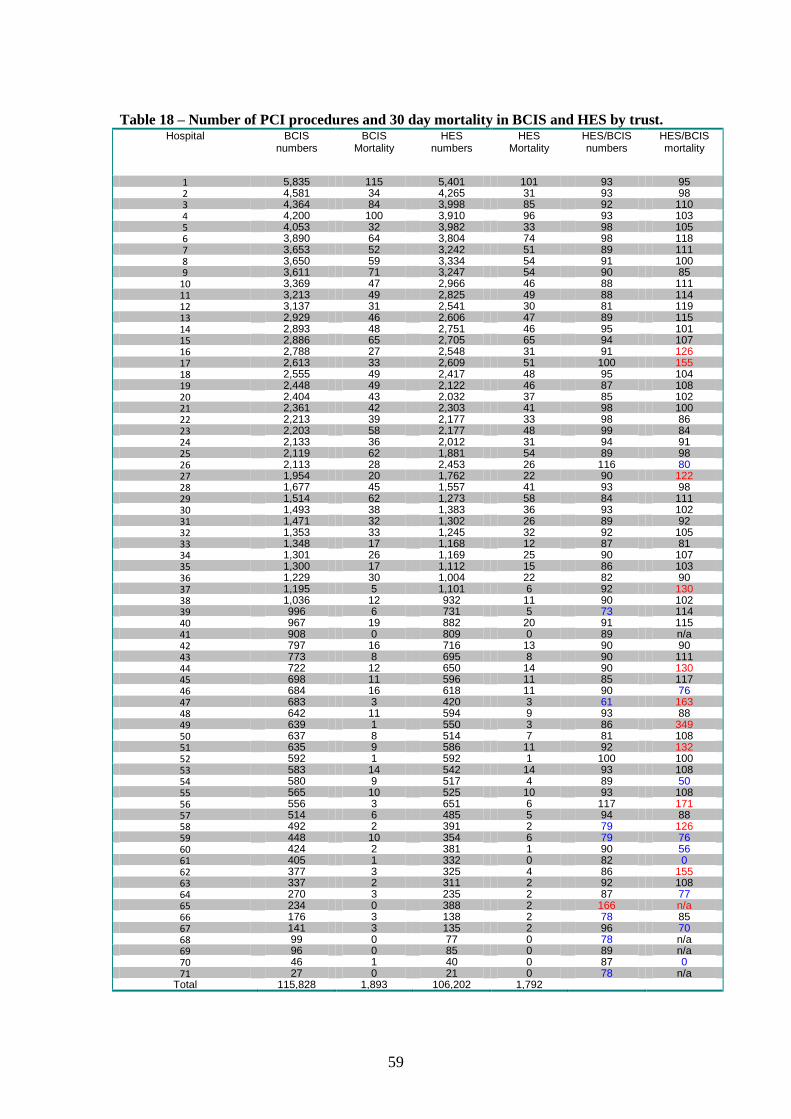
59
Table 18 – Number of PCI procedures and 30 day mortality in BCIS and HES by trust. Hospital BCIS
numbers BCIS
Mortality HES
numbers HES
Mortality HES/BCIS numbers
HES/BCIS mortality
1 5,835 115 5,401 101 93 95 2 4,581 34 4,265 31 93 98 3 4,364 84 3,998 85 92 110 4 4,200 100 3,910 96 93 103 5 4,053 32 3,982 33 98 105 6 3,890 64 3,804 74 98 118 7 3,653 52 3,242 51 89 111 8 3,650 59 3,334 54 91 100 9 3,611 71 3,247 54 90 85
10 3,369 47 2,966 46 88 111 11 3,213 49 2,825 49 88 114 12 3,137 31 2,541 30 81 119 13 2,929 46 2,606 47 89 115 14 2,893 48 2,751 46 95 101 15 2,886 65 2,705 65 94 107 16 2,788 27 2,548 31 91 126 17 2,613 33 2,609 51 100 155 18 2,555 49 2,417 48 95 104 19 2,448 49 2,122 46 87 108 20 2,404 43 2,032 37 85 102 21 2,361 42 2,303 41 98 100 22 2,213 39 2,177 33 98 86 23 2,203 58 2,177 48 99 84 24 2,133 36 2,012 31 94 91 25 2,119 62 1,881 54 89 98 26 2,113 28 2,453 26 116 80 27 1,954 20 1,762 22 90 122 28 1,677 45 1,557 41 93 98 29 1,514 62 1,273 58 84 111 30 1,493 38 1,383 36 93 102 31 1,471 32 1,302 26 89 92 32 1,353 33 1,245 32 92 105 33 1,348 17 1,168 12 87 81 34 1,301 26 1,169 25 90 107 35 1,300 17 1,112 15 86 103 36 1,229 30 1,004 22 82 90 37 1,195 5 1,101 6 92 130 38 1,036 12 932 11 90 102 39 996 6 731 5 73 114 40 967 19 882 20 91 115 41 908 0 809 0 89 n/a 42 797 16 716 13 90 90 43 773 8 695 8 90 111 44 722 12 650 14 90 130 45 698 11 596 11 85 117 46 684 16 618 11 90 76 47 683 3 420 3 61 163 48 642 11 594 9 93 88 49 639 1 550 3 86 349 50 637 8 514 7 81 108 51 635 9 586 11 92 132 52 592 1 592 1 100 100 53 583 14 542 14 93 108 54 580 9 517 4 89 50 55 565 10 525 10 93 108 56 556 3 651 6 117 171 57 514 6 485 5 94 88 58 492 2 391 2 79 126 59 448 10 354 6 79 76 60 424 2 381 1 90 56 61 405 1 332 0 82 0 62 377 3 325 4 86 155 63 337 2 311 2 92 108 64 270 3 235 2 87 77 65 234 0 388 2 166 n/a 66 176 3 138 2 78 85 67 141 3 135 2 96 70 68 99 0 77 0 78 n/a 69 96 0 85 0 89 n/a 70 46 1 40 0 87 0 71 27 0 21 0 78 n/a
Total 115,828 1,893 106,202 1,792

60
Table 19 – Mortality and ROC score comparison between BCIS and HES
Model Observations 30 day
mortality
ROC Score 95% confidence interval
BCIS model 115,828 1.63% 0.86 0.85 0.86
HES model 1 106,202 1.69% 0.75 0.74 0.76
HES model 2 106,202 1.69% 0.78 0.77 0.79
61
8. Disease-specific indicators
Introduction One of the objectives of this project was to distinguish between procedure-specific and
disease-specific indicators. Procedure-specific indicators give information on outcomes of
patients undergoing a specific procedure whereas disease-specific indicators do the same but
then for patients from the time of diagnosis (or another time-defining event in the course of
the disease). Consequently, disease-specific indicators reflect the impact of all clinical
specialties who are involved in the treatment of patients along the entire disease pathway. As
a result, it is immediately obvious that it will be difficult in many situations to link disease-
specific indicators to individual NHS trusts and clinicians.
When disease-specific indicators are being used it is more difficult to define the patient
population as well as the timing of their follow-up than when procedure-based indicators are
used. It is also likely that the impact of case mix differences is greater for disease-specific
than for procedure-specific indicators.
To explore the issues related to the development and use of disease-specific indicators, we
looked at the treatments given to patients who were diagnosed with prostate cancer as an
example of a urological malignancy. This is the only one of the three disease areas in which
disease-specific indicators can be developed. Linkage with Cancer Registry data would allow
patients to be followed up from the time of diagnosis. In the two other disease areas,
ischaemic heart disease and peripheral vascular disease, it is not possible to identify patients
at the time of diagnosis or at any other relevant point in time that is not directly or indirectly
related to the timing of a procedure based on data that is routinely available.
We analysed HES data linked to cancer data that was collected by the eight English Cancer
Registries. The cancer data contained details of patients‟ demographics, the cancer diagnoses,
and treatments that these patients had received. The HES data provides additional treatment
details as well as clinical outcomes.
Cancer Registry data The Cancer Registry database contains fields that record the stage of cancer patients including
the Gleason Score, tumour grade, tumour size, tumour (T) stage, nodal (N) stage, and
metastatic (M) stage. Also available is information about age, socio-economic deprivation
and ethnicity. On initial examination of the data completeness, we found that the T, N and M
stage were poorly recorded with nearly 99% missing data. For this reason, we opted not to
use these fields but used the Gleason Score (51% complete) and tumour grade (64%
complete) instead.
The Gleason Score is used to evaluate the stage of the disease at diagnosis and is based on a
5-point pathological grading system that describes tumour glandular differentiation and
growth pattern with 1 being well differentiated and 5 being poorly differentiated disease.15
The two most prevalent patterns are combined to give a Gleason Score (e.g. 3 + 4) with
consequently 2 being the lowest and 10 the highest. The Cancer Registry also provides the
date of the prostate cancer diagnosis.
Prior to the linkage of the Cancer Registry data to HES, we assessed the coding consistency
between diagnosis and procedure codes for the two datasets for patients diagnosed between
1997-2008. 19,980 patients were found in the Cancer Registry data with a record of a radical
prostatectomy (OPCS code M61). 19,818 of these patients (99%) were recorded to have a

62
prostate cancer diagnosis (ICD - 10 code C61). In HES, 32,471 patients were found with
records that contained a code for a radical prostatectomy. 27,258 of these patients (84%) also
had a prostate cancer diagnosis. As there were fewer procedures found in the Cancer Registry
data, we used the treatment data from HES for further analysis of radical prostatectomies and
the Cancer Registry as the data source for diagnosis and other cancer details.
We identified all patients from the Cancer Registry data with a diagnosis of prostate cancer
and with a diagnosis date between 1st April 1997 and 31
st December 2008. This was the latest
date available in the Cancer Registry dataset. The Cancer Registry data was then linked to
HES based on a pseudonymised identifier provided by the NHS Information Centre.
Disease-specific indicators We included patients who had a prostate cancer diagnosis according to the Cancer Registry
data. We determined two disease-specific indicators. First, we established how many
patients diagnosed with cancer had a radical prostatectomy. The denominator was the
number of patients with a prostate cancer diagnosis observed in the Cancer Registry data and
the numerator was the number of radical prostatectomies in these patients observed in HES
data. Second, we determined the time from the date of the prostate cancer diagnosis to the
date of surgery in the patients who had a radical prostatectomy. For these patients, the date of
diagnosis was derived from the Cancer Registry data and the date of the procedure from HES.
An important issue that needs to be considered is the appropriate level of analysis for disease-
specific indicators. The NHS trusts and their consultants have only a limited influence on
how many patients with prostate cancer will have a radical prostatectomy as they can only see
patients who are referred to them. The most appropriate level of analysis for the proportion of
patients with prostate cancer who have radical surgery is therefore the Primary Cancer Trust
(PCT) or the Cancer Network area in which the patients live. One could argue that the time
from diagnosis to treatment could be a relevant indicator for NHS trusts and even consultants
as they can influence the time that patients will need to wait for radical treatment after a
prostate cancer diagnosis has been made.
Statistical Method For both indicators, we adjusted for differences in case mix using statistical regression
models. The models included patient age, socio economic deprivation score based on
quintiles of the Index of Multiple Deprivation42
, Gleason Score, tumour grade and the RCS
Charlson Comorbidity Score.41
To account for the missing data found in the Gleason and
tumour grade scores, multiple imputation was used 47
. Following imputation, a logistic
regression model was applied for the prostatectomy indicator and a linear regression model
for the time to surgery.
Results We obtained 322,584 patients with a prostate cancer diagnosis between 1997 and 2008 from
the Cancer Registry database. For 307,144 of these patients (95%), we could find a matching
HES record (Figure 21). 26,856 of these 307,144 patients (9%) were identified as having had
a radical prostatectomy.
Three PCTs were found to have a high proportion of prostate cancer patients who had a
radical prostatectomy above the upper inner limit of the funnel plot demonstrating a higher
level of radical treatment compared to the national average of 9% and three PCTs had results
below the lower inner limit demonstrating a lower level of activity (Figure 22). The lowest
prostatectomy rate observed in a PCT was 3% and the highest 19%. When looking at the
Cancer Network level (Figure 23), one Cancer Network had a prostatectomy rate above the
upper inner funnel limit and two below the lower inner funnel limit. The highest
prostatectomy rate in a Cancer Network was 13% and the lowest 6%.

63
The average time from diagnosis to radical prostatectomy was 172 days. When comparing
mean times at NHS trust level (Figure 24), three trusts were found above the upper outer
control limit demonstrating a longer intervention time than the national average. When
comparing consultant data (Figure 25), four consultants were found to have results above the
upper outer control limit. None of these consultants was attached to the three trusts with
results above the upper outer control limit. At Cancer Network level (Figure 26), only one
network was found above the upper outer control limit. This Cancer Network had a time
from diagnosis to treatment of 246 days.
Discussion We highlighted in the Introduction of this report that there are a number of challenges for the
development of disease-specific indicators based on HES. First, it is necessary to have
external data that identifies patients at the time of diagnosis and that can be linked to HES at
patient level. Second, it requires follow-up of patients over time in order to assess their
management and outcomes. Third, the ability to adjust for case mix is even more important
for the analysis of disease-specific indicators than for the analysis of procedure-specific
indicators because at the time of diagnosis patients are likely to be more heterogeneous than
at the time of treatment.
In this chapter we demonstrate that all these challenges can be overcome in principle when
looking at the management of prostate cancer patients. However, the results of our feasibility
work also highlight that data quality and completeness are major barriers. Although we can
identify most patients with a cancer diagnosis using Cancer Registry data, our ability to adjust
for case mix is limited due to poor levels of completeness on staging.
Our feasibility study also highlighted the advantage of using HES instead of Cancer Registry
data for some data items on the procedures. We found more radical prostatectomies recorded
in HES. Also, HES included patients who were more recently treated. A drawback of using
HES is that it only includes patients who have had a treatment in secondary care whereas the
Cancer Registry data includes all patients who had a cancer diagnosis.
Lastly, it is also important to note that it is difficult to develop disease-specific indicators for
other diseases than cancer (e.g. ischaemic heart disease as well as peripheral vascular disease)
based on routinely available clinical or administrative data. The date of diagnosis is often not
available. Therefore, it will not be possible to follow patients up from diagnosis if there is no
additional data source. In addition, HES does not contain information about the severity of
cardiac or vascular conditions which impacts on the ability to adjust for case mix.
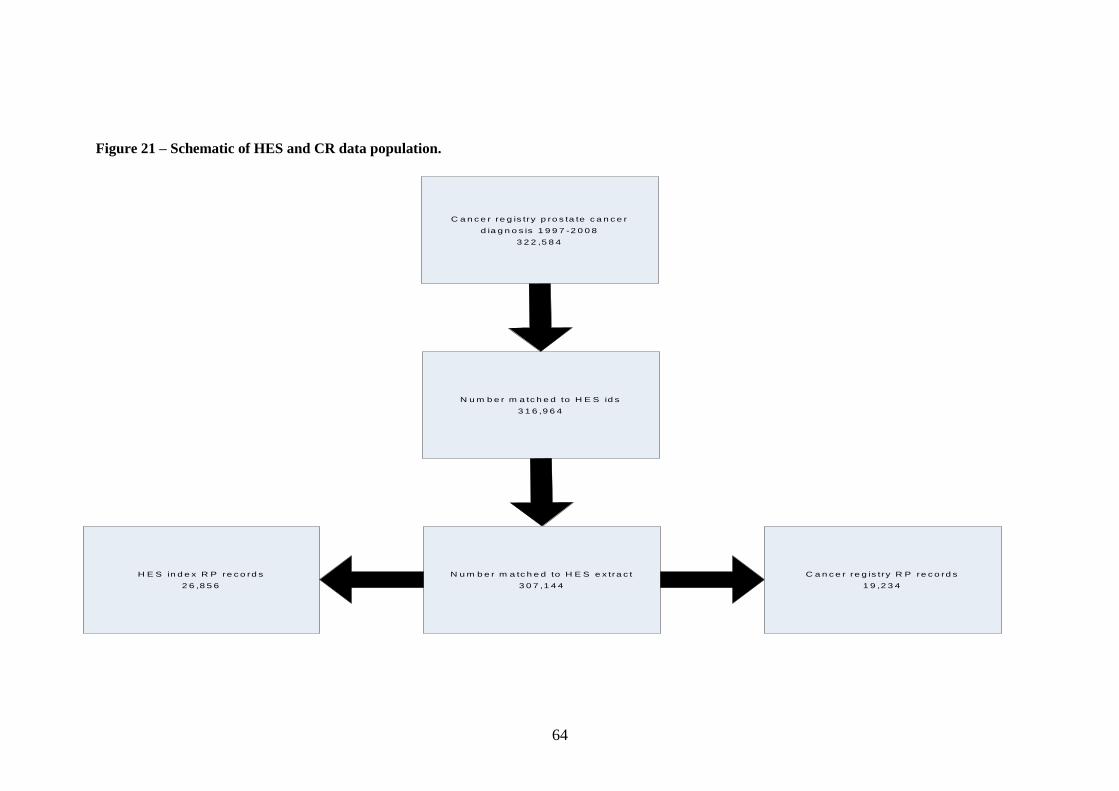
64
Figure 21 – Schematic of HES and CR data population.
C a n c e r re g is try p ro s ta te c a n c e r
d ia g n o s is 1 9 9 7 -2 0 0 8
3 2 2 ,5 8 4
N u m b e r m a tc h e d to H E S id s
3 1 6 ,9 6 4
H E S in d e x R P re c o rd s
2 6 ,8 5 6
N u m b e r m a tc h e d to H E S e x tra c t
3 0 7 ,1 4 4
C a n c e r re g is try R P re c o rd s
1 9 ,2 3 4
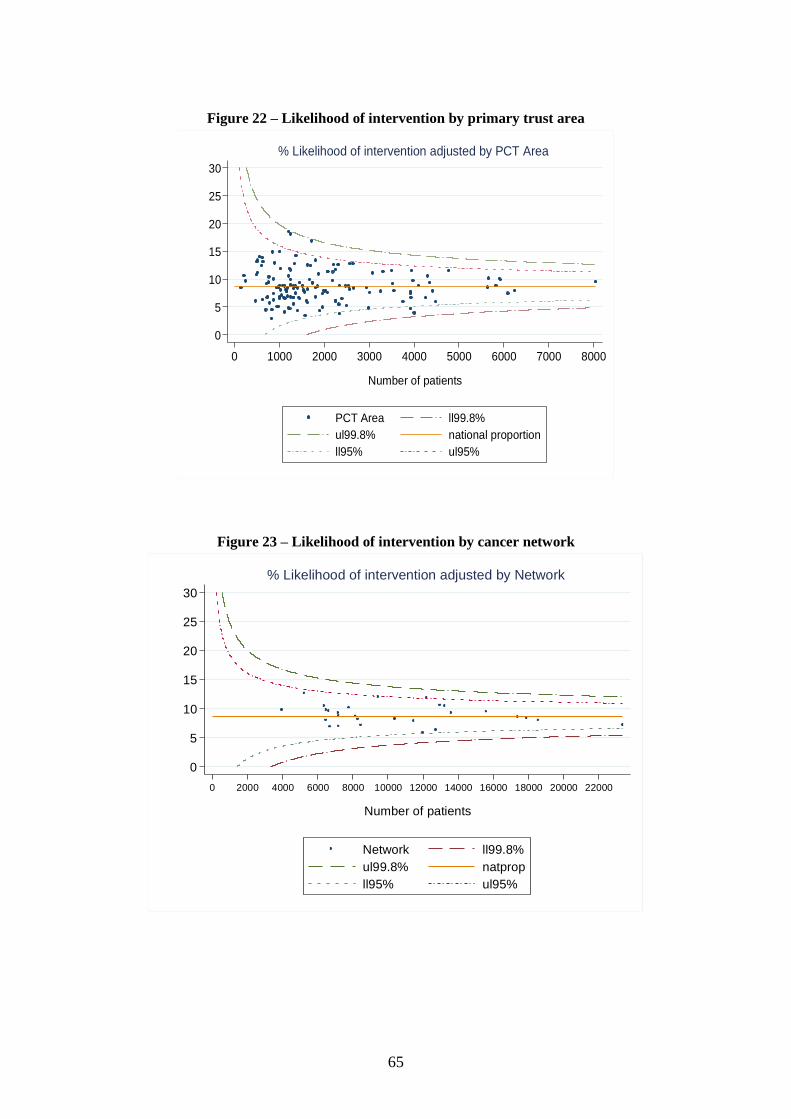
65
Figure 22 – Likelihood of intervention by primary trust area
0
5
10
15
20
25
30
% in
terv
en
tio
n
0 1000 2000 3000 4000 5000 6000 7000 8000
Number of patients
PCT Area ll99.8%
ul99.8% national proportion
ll95% ul95%
% Likelihood of intervention adjusted by PCT Area
Figure 23 – Likelihood of intervention by cancer network
0
5
10
15
20
25
30
% in
terv
en
tio
n
0 2000 4000 6000 8000 10000 12000 14000 16000 18000 20000 22000
Number of patients
Network ll99.8%
ul99.8% natprop
ll95% ul95%
% Likelihood of intervention adjusted by Network
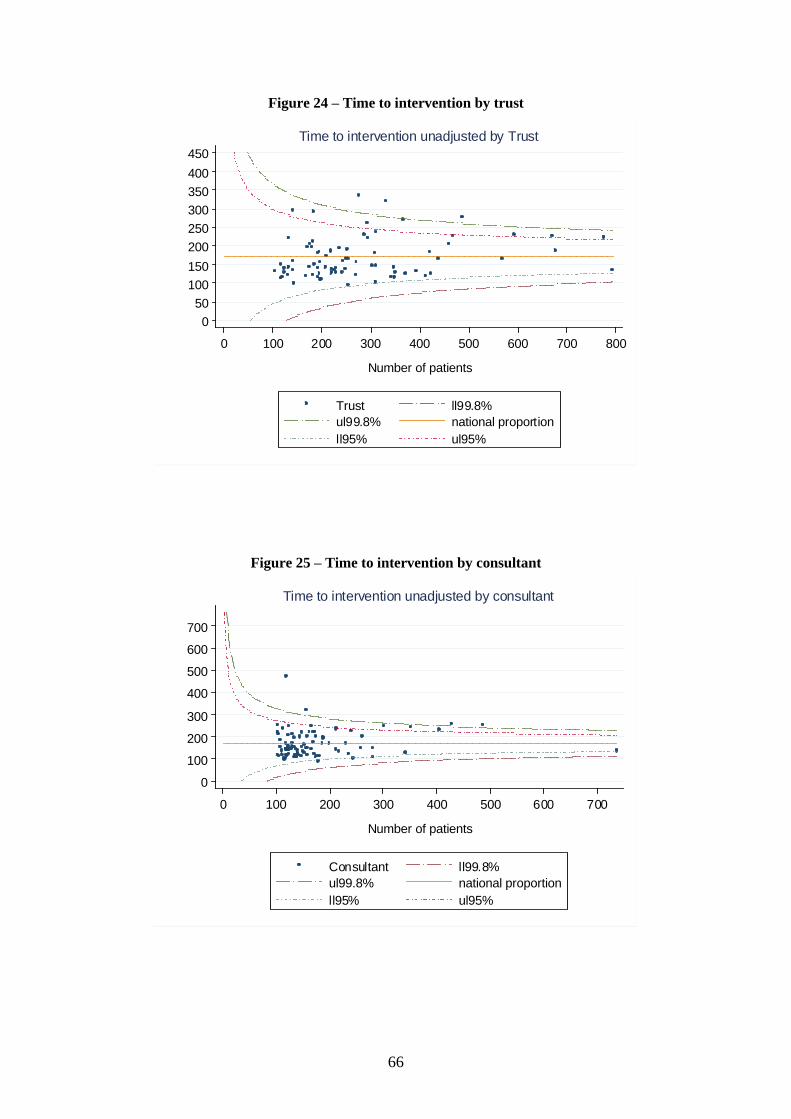
66
Figure 24 – Time to intervention by trust
Figure 25 – Time to intervention by consultant
0
50
100
150
200
250
300
350
400
450
Mea
n T
ime (
days)
0 100 200 300 400 500 600 700 800
Number of patients
Trust ll99.8%
ul99.8% national proportion
ll95% ul95%
Time to intervention unadjusted by Trust
0
100
200
300
400
500
600
700
Mea
n T
ime (
days)
0 100 200 300 400 500 600 700
Number of patients
Consultant ll99.8%
ul99.8% national proportion
ll95% ul95%
Time to intervention unadjusted by consultant

67
Figure 26 – Time to intervention by cancer network
0
100
200
300
400
500
600
700
Mea
n T
ime (
days)
0 200 400 600 800 1000 1200 1400 1600
Number of patients
Network ll99.8%
ul99.8% national proportion
ll95% ul95%
Time to intervention unadjusted by Network

68
Reference List
(1) DoH. Good doctors: safer patients: proposal to strengthen the system to assure and
improve the performance of doctors and to protect the safety of patients. 14-7-2006.
http://www.dh.gov.uk/prod_consum_dh/groups/dh_digitalassets/@dh/@en/document
s/digitalasset/dh_4137276.pdf [accessed 9 July 2012].
(2) Evans R, Zorlu G, Boseley S. Flaws in Hospital Episode Statistics revealed by FoI
requests. The Guardian 2010, 13 June 2010;
http://www.guardian.co.uk/society/2010/jun/13/nhs-statistics-flawed [accessed 9 July
2012].
(3) Croft GP, Williams JG, Mann RY, Cohen D, Phillips CJ. Can hospital episode
statistics support appraisal and revalidation? Randomised study of physician attitudes.
Clin Med 2007; 7(4): 332-338.
(4) Harley M, Mohammed MA, Hussain S, Yates J, Almasri A. Was Rodney Ledward a
statistical outlier? Retrospective analysis using routine hospital data to identify
gynaecologists' performance. BMJ 2005; 330(7497): 929.
(5) Bottle A, Millett C, Khunti K, Majeed A. Trends in cardiovascular admissions and
procedures for people with and without diabetes in England, 1996-2005. Diabetologia
2009; 52(1): 74-80.
(6) Bottle A, Gnani S, Saxena S, Aylin P, Mainous AG 3rd, Majeed A. Association
between quality of primary care and hospitalization for coronary heart disease in
England: national cross-sectional study. J Gen Intern Med 2008; 23(2): 135-141.
(7) Mindell J, Klodawski E, Fitzpatrick J. Using routine data to measure ethnic
differentials in access to coronary revascularization. J Public Health (Oxf) 2008;
30(1): 45-53.
(8) Mindell J, Klodawski E, Fitzpatrick J, Malhotra N, McKee M, Sanderson C. The
impact of private-sector provision on equitable utilisation of coronary
revascularisation in London. Heart 2008; 94(8): 1008-1011.
(9) Aylin P, Bottle A, Majeed A. Use of administrative data or clinical databases as
predictors of risk of death in hospital: comparison of models. BMJ 2007; 334(7602):
1044.
(10) Shaw M, Maxwell R, Rees K, Ho D, Oliver S, Ben Shlomo Y et al. Gender and age
inequity in the provision of coronary revascularisation in England in the 1990s: is it
getting better? Soc Sci Med 2004; 59(12): 2499-2507.
(11) Martin RM, Gunnell D, Karsch K R, Frankel S. Mortality and morbidity surrounding
coronary artery bypass surgery and the public presentation of risk. J Epidemiol
Community Health 2002; 56:430-431.
(12) Holt PJ, Poloniecki JD, Thompson MM. Multicentre study of the quality of a large
administrative data set and implications for comparing death rates. Br J Surg 2012;
99(1): 58-65.
(13) Moxey PW, Hofman D, Hinchliffe RJ, Jones K, Thompson MM, Holt PJ. Trends and
outcomes after surgical lower limb revascularization in England. Br J Surg 2011;
98(10): 1373-1382.
(14) Moxey PW, Hofman D, Hinchliffe RJ, Jones K, Thompson MM, Holt PJ.
Epidemiological study of lower limb amputation in England between 2003 and 2008.
Br J Surg 2010; 97(9): 1348-1353.
(15) Holt PJ, Karthikesalingam A, Poloniecki JD, Hinchliffe RJ, Loftus IM, Thompson
MM. Propensity scored analysis of outcomes after ruptured abdominal aortic
aneurysm. Br J Surg 2010; 97(4): 496-503.
(16) Holt PJ, Poloniecki JD, Khalid U, Hinchliffe R.J., Loftus IM, Thompson MM. Effect
Of Endovascular Aneurysm Repair on the Volume-Outcome Relationship in
Aneurysm Repair. Circulation: Cardiovascular Quality and Outcomes 2009; 2(6),
624-632.
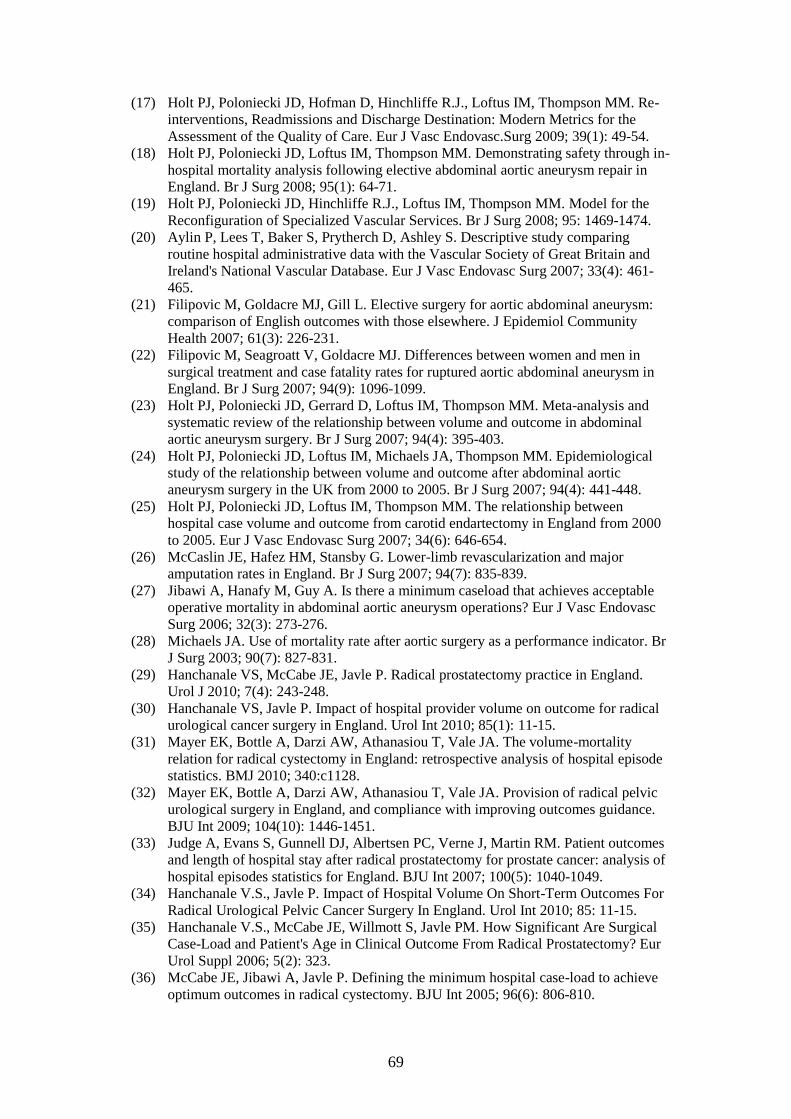
69
(17) Holt PJ, Poloniecki JD, Hofman D, Hinchliffe R.J., Loftus IM, Thompson MM. Re-
interventions, Readmissions and Discharge Destination: Modern Metrics for the
Assessment of the Quality of Care. Eur J Vasc Endovasc.Surg 2009; 39(1): 49-54.
(18) Holt PJ, Poloniecki JD, Loftus IM, Thompson MM. Demonstrating safety through in-
hospital mortality analysis following elective abdominal aortic aneurysm repair in
England. Br J Surg 2008; 95(1): 64-71.
(19) Holt PJ, Poloniecki JD, Hinchliffe R.J., Loftus IM, Thompson MM. Model for the
Reconfiguration of Specialized Vascular Services. Br J Surg 2008; 95: 1469-1474.
(20) Aylin P, Lees T, Baker S, Prytherch D, Ashley S. Descriptive study comparing
routine hospital administrative data with the Vascular Society of Great Britain and
Ireland's National Vascular Database. Eur J Vasc Endovasc Surg 2007; 33(4): 461-
465.
(21) Filipovic M, Goldacre MJ, Gill L. Elective surgery for aortic abdominal aneurysm:
comparison of English outcomes with those elsewhere. J Epidemiol Community
Health 2007; 61(3): 226-231.
(22) Filipovic M, Seagroatt V, Goldacre MJ. Differences between women and men in
surgical treatment and case fatality rates for ruptured aortic abdominal aneurysm in
England. Br J Surg 2007; 94(9): 1096-1099.
(23) Holt PJ, Poloniecki JD, Gerrard D, Loftus IM, Thompson MM. Meta-analysis and
systematic review of the relationship between volume and outcome in abdominal
aortic aneurysm surgery. Br J Surg 2007; 94(4): 395-403.
(24) Holt PJ, Poloniecki JD, Loftus IM, Michaels JA, Thompson MM. Epidemiological
study of the relationship between volume and outcome after abdominal aortic
aneurysm surgery in the UK from 2000 to 2005. Br J Surg 2007; 94(4): 441-448.
(25) Holt PJ, Poloniecki JD, Loftus IM, Thompson MM. The relationship between
hospital case volume and outcome from carotid endartectomy in England from 2000
to 2005. Eur J Vasc Endovasc Surg 2007; 34(6): 646-654.
(26) McCaslin JE, Hafez HM, Stansby G. Lower-limb revascularization and major
amputation rates in England. Br J Surg 2007; 94(7): 835-839.
(27) Jibawi A, Hanafy M, Guy A. Is there a minimum caseload that achieves acceptable
operative mortality in abdominal aortic aneurysm operations? Eur J Vasc Endovasc
Surg 2006; 32(3): 273-276.
(28) Michaels JA. Use of mortality rate after aortic surgery as a performance indicator. Br
J Surg 2003; 90(7): 827-831.
(29) Hanchanale VS, McCabe JE, Javle P. Radical prostatectomy practice in England.
Urol J 2010; 7(4): 243-248.
(30) Hanchanale VS, Javle P. Impact of hospital provider volume on outcome for radical
urological cancer surgery in England. Urol Int 2010; 85(1): 11-15.
(31) Mayer EK, Bottle A, Darzi AW, Athanasiou T, Vale JA. The volume-mortality
relation for radical cystectomy in England: retrospective analysis of hospital episode
statistics. BMJ 2010; 340:c1128.
(32) Mayer EK, Bottle A, Darzi AW, Athanasiou T, Vale JA. Provision of radical pelvic
urological surgery in England, and compliance with improving outcomes guidance.
BJU Int 2009; 104(10): 1446-1451.
(33) Judge A, Evans S, Gunnell DJ, Albertsen PC, Verne J, Martin RM. Patient outcomes
and length of hospital stay after radical prostatectomy for prostate cancer: analysis of
hospital episodes statistics for England. BJU Int 2007; 100(5): 1040-1049.
(34) Hanchanale V.S., Javle P. Impact of Hospital Volume On Short-Term Outcomes For
Radical Urological Pelvic Cancer Surgery In England. Urol Int 2010; 85: 11-15.
(35) Hanchanale V.S., McCabe JE, Willmott S, Javle PM. How Significant Are Surgical
Case-Load and Patient's Age in Clinical Outcome From Radical Prostatectomy? Eur
Urol Suppl 2006; 5(2): 323.
(36) McCabe JE, Jibawi A, Javle P. Defining the minimum hospital case-load to achieve
optimum outcomes in radical cystectomy. BJU Int 2005; 96(6): 806-810.

70
(37) Nuttall MC, van der MJ, McIntosh G, Gillatt D, Emberton M. Changes in patient
characteristics and outcomes for radical cystectomy in England. BJU Int 2005; 95(4):
513-516.
(38) Nuttall M, Cathcart P, van der Meulen JH, Gillatt D, McIntosh G, Emberton M. A
description of radical nephrectomy practice and outcomes in England: 1995-2002.
BJU Int 2005; 96(1): 58-61.
(39) Oliver S, Donovan J, Peters T.J., Frankel S, Hamdy F, Neal D. Recent trends in the
use of radical prostatectomy in England: the epidemiology of diffusion. BJU Int
2003; 91(4): 331-336.
(40) Office for National Statistics 2012. http://www.statistics.gov.uk/ (accessed 9 July
2012).
(41) Armitage JN, van der Meulen JH, RCS Comorbidity Consensus Group. Identifying
co-morbidity in surgical patients using administrative data with the Royal College of
Surgeons Charlson Score. Br J Surg 2010; 97(5): 772-781.
(42) Noble M, McLennan D, Wilkinson K et al. The English Indices of Deprivation 2007.
London: HMSO, 2008.
http://www.communities.gov.uk/documents/communities/pdf/733520.pdf (accessed 9
July 2012).
(43) Health Quality Improvement Partnership. National Clinical Audit and Registries.
http://www.hqip.org.uk/national-clinical-audit-registries (accessed 9 July 2012).
(44) World Health Organization (WHO). International Classification of Diseases (10th
revised edn). WHO: Geneva, 1994.
(45) Michel P, Roques F, Nashef SA. Logistic or additive EuroSCORE for high-risk
patients? Eur J Cardiothorac Surg 2003; 23(5): 684-687.
(46) Hosmer DW, Lemeshow S. Applied logistic regression. 2nd ed. New York, John
Wiley; 2000.
(47) Sterne JA, White IR, Carlin JB, Spratt M, Royston P, Kenward MG et al. Multiple
imputation for missing data in epidemiological and clinical research: potential and
pitfalls. BMJ 2009; 338:b2393.