Embed Size (px)
Citation preview

Hospital‐AcquiredInfections
inNewYorkState,2015
Part 1: Summary for Consumers
March 29, 2017

2
Contents
Introduction ................................................................................................................................................................. 3
SurgicalSiteInfections(SSIs) .................................................................................................................................. 4
Catheter‐AssociatedInfections ............................................................................................................................... 5
Laboratory-identified (LabID) infections .................................................................................................................. 6
Clostridium difficile Infections (CDI) ....................................................................................................................... 7
Carbapenem-resistant Enterobacteriaceae (CRE) Infections ................................................................................... 8
Methicillin-resistant Staphylococcus aureus (MRSA) Infections .............................................................................. 9
Hospital Performance ................................................................................................................................................ 10
Role of the State Health Department ....................................................................................................................... 28
What Patients Can do to Prevent Infections ........................................................................................................... 29
Acknowledgements:
Cover Images (from left to right): Acinetobacter, Methicillin-resistant Staphylococcus aureus, Carbapenem-resistant Enterobacteriaceae, Candida. From the Centers for Disease Control and Prevention Newsroom Image Library, http://www.cdc.gov/media/subtopic/images.htm.

3
Introduction
What is the purpose of this report?
Hospital-acquired infections (HAIs) are infections that patients can get as a result of receiving treatment in a hospital. New York State (NYS) monitors HAI rates to ensure patient safety and provide the public with data to compare hospital infection rates. This report describes the HAIs that occurred in NYS hospitals in 2015.
This report provides information on six types of HAIs:
1. Surgical site infections (SSIs) following colon, coronary artery bypass graft, hip replacement, and hysterectomy procedures
2. Central line-associated bloodstream infections (CLABSIs)
3. Catheter-associated urinary tract infections (CAUTIs)
4. Clostridium difficile infections (CDIs)
5. Carbapenem-resistant Enterobacteriaceae infections (CREs)
6. Methicillin-resistant Staphylococcus aureus (MRSA) bloodstream infections (BSIs)
These HAIs do not represent all possible HAIs, but they were selected because they are common, may have severe complications, can be compared between facilities, and are largely preventable when healthcare providers use infection prevention steps recommended by the Centers for Disease Control and Prevention (CDC).
Where do the numbers come from? Hospitals report to the NYS Department of Health (DOH) using the CDC’s National Healthcare Safety Network (NHSN). This online system allows hospitals in NYS and CDC to concurrently monitor the same data. All hospitals follow the same surveillance methods. Additional information about the NHSN can be found at http://www.cdc.gov/nhsn/.
In accordance with NYS Public Health Law 2819, NYS hospitals have been reporting HAIs since 2007. In 2015, NYS required hospitals to report SSIs, CLABSIs, CDIs, and CRE infections. In addition, hospitals report data to NHSN to participate in programs offered by the Centers for Medicare and Medicaid Services (CMS). Data on CAUTIs and MRSA-BSIs are available as a result of a data use agreement (DUA) that allows NYS HAI staff to see NHSN data and use it for surveillance or prevention purposes. NYS measures are reported by specific hospital, while DUA measures are only summarized at the state level because the DUA prohibits the use of the data for public reporting of facility-specific data.

4
SurgicalSiteInfections(SSIs)
SSIs are infections that occur after surgery in the part of the body where the surgery took place. They may only involve the skin, or they may be more serious and involve tissue and organs. NYS requires hospitals to report SSIs associated with four types of surgery:
Colon: Colon surgery is a procedure performed on the lower part of the digestive tract, called the large intestine or colon.
Hip: Hip replacement or revision surgery involves removing damaged cartilage and bone from the hip joint and replacing or resurfacing them with new parts.
Abdominal hysterectomy: Abdominal hysterectomy is the surgical removal of a woman’s uterus through an incision in the abdominal wall.
Coronary artery bypass graft (CABG): CABG surgery is a procedure performed for heart disease in which a vein or artery from the chest or another part of the body (termed the “donor site”) is used to create an alternate path for blood to flow to the heart, bypassing a blocked artery.
SSIs can occur if bacteria enter the body at the incision site. Symptoms may include fever, pain, redness, and drainage.
The infection rate is the number of SSIs divided by the number of procedures. Results from 2015 for all NYS hospitals are summarized below. SSIs were most frequent after colon surgery. Colon SSIs may be more difficult to prevent because the colon naturally contains a lot of bacteria.
Type of Surgery Number of
Infections Number ofProcedures
Infection Rate
Colon 1,381 18,845 7.3/100 proceduresHip 359 33,288 1.1/100 proceduresAbdominal hysterectomy 324 19,222 1.7/100 procedures
Coronary artery bypass graft Chest site SSIs Donor site SSIs
205 55
10,6949,548
1.9/100 procedures0.6/100 procedures
2015 New York State data downloaded August 5, 2016.
surgical site infection

5
Catheter‐AssociatedInfections A central venous catheter (CVC) is a tube that is placed into a large vein, usually in the neck, chest, arm, or groin, that is used to give fluids and medications, withdraw blood, and monitor the patient’s condition. A CVC is different from a standard intravenous (IV) line because it goes farther into the body, ending near the heart, and because it may be used for weeks or even months. A urinary catheter is a thin tube that is inserted into the bladder through the urethra to drain urine when a patient cannot urinate on his/her own.
Infections can sometimes occur when bacteria travel around or through the tube and enter the urinary tract or blood stream. NYS monitors blood stream infections associated with CVC use. In addition, CMS monitors urinary tract infections associated with urinary catheter use. These infections are monitored in intensive care units and a few other medical/surgical units with less critical patients. The risk of infection increases with the number of days a catheter is used. For this reason, infection rates are based on the total number of days catheters are used, rather than simply the number of patients. To calculate “catheter days” a daily count of patients with each type of catheter is performed at the same time each day. The daily counts are added up for the entire year to give the catheter days for that year.
Type of Catheter Number of Infections
Number ofCatheter Days
Infection Rate
Central venous 1,644 1,402,218 1.2/1,000 CVC daysUrinary 1,890 1,443,735 1.3/1,000 UC days
2015 NYS data downloaded from NHSN on August 1, 2016.
Urinary
Catheter
Central
venous
catheter
6
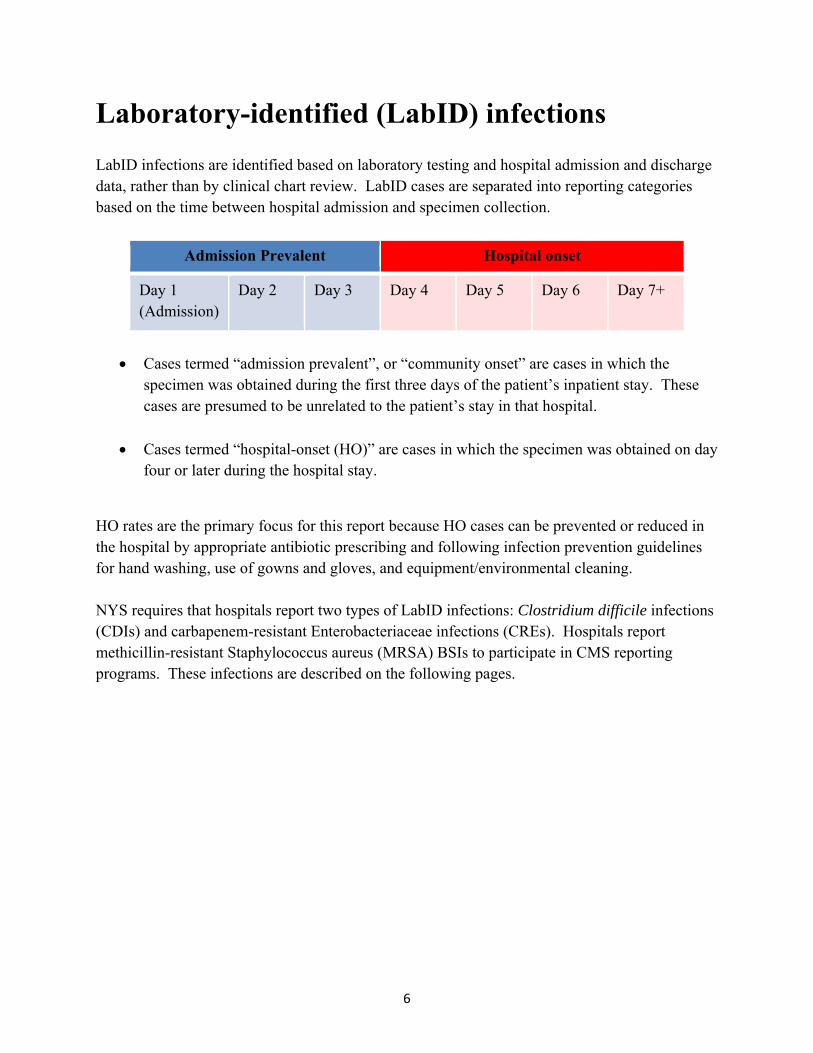
Laboratory-identified (LabID) infections LabID infections are identified based on laboratory testing and hospital admission and discharge data, rather than by clinical chart review. LabID cases are separated into reporting categories based on the time between hospital admission and specimen collection.
Admission Prevalent Hospital onset
Day 1 (Admission)
Day 2 Day 3 Day 4 Day 5 Day 6 Day 7+
Cases termed “admission prevalent”, or “community onset” are cases in which the specimen was obtained during the first three days of the patient’s inpatient stay. These cases are presumed to be unrelated to the patient’s stay in that hospital.
Cases termed “hospital-onset (HO)” are cases in which the specimen was obtained on day four or later during the hospital stay.
HO rates are the primary focus for this report because HO cases can be prevented or reduced in the hospital by appropriate antibiotic prescribing and following infection prevention guidelines for hand washing, use of gowns and gloves, and equipment/environmental cleaning.
NYS requires that hospitals report two types of LabID infections: Clostridium difficile infections (CDIs) and carbapenem-resistant Enterobacteriaceae infections (CREs). Hospitals report methicillin-resistant Staphylococcus aureus (MRSA) BSIs to participate in CMS reporting programs. These infections are described on the following pages.
7
Clostridium difficile Infections (CDI)
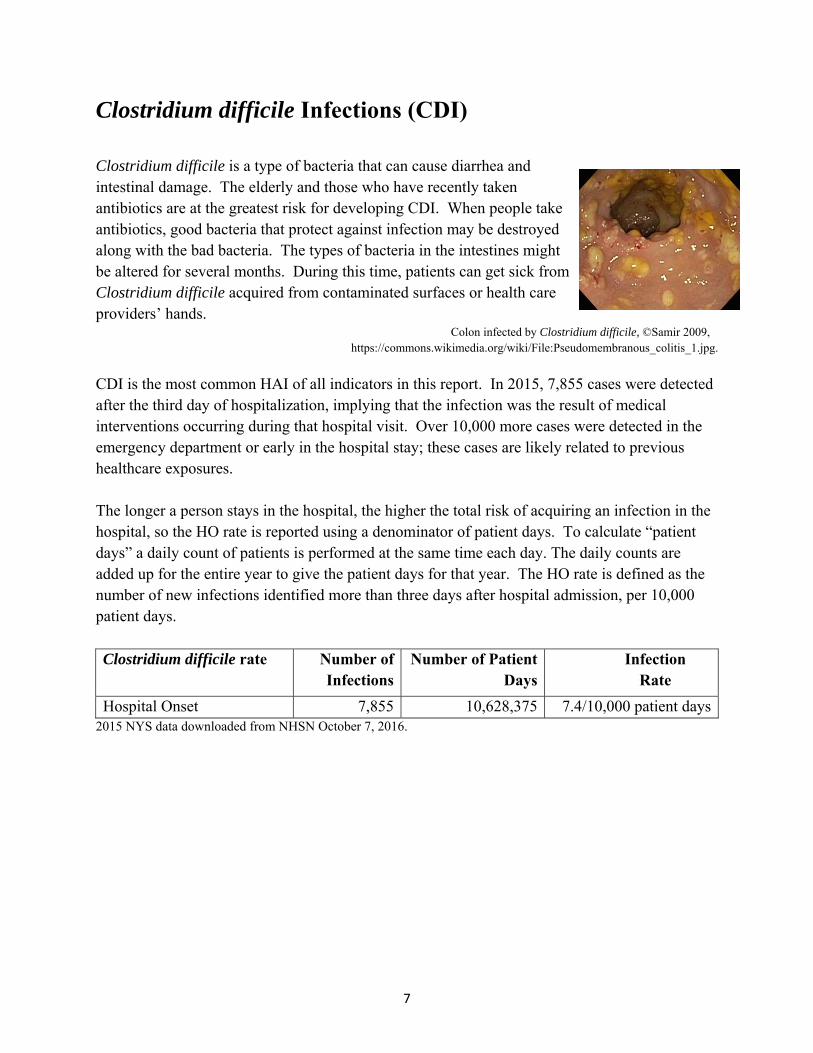
Clostridium difficile is a type of bacteria that can cause diarrhea and intestinal damage. The elderly and those who have recently taken antibiotics are at the greatest risk for developing CDI. When people take antibiotics, good bacteria that protect against infection may be destroyed along with the bad bacteria. The types of bacteria in the intestines might be altered for several months. During this time, patients can get sick from Clostridium difficile acquired from contaminated surfaces or health care providers’ hands.
Colon infected by Clostridium difficile, ©Samir 2009, https://commons.wikimedia.org/wiki/File:Pseudomembranous_colitis_1.jpg.
CDI is the most common HAI of all indicators in this report. In 2015, 7,855 cases were detected after the third day of hospitalization, implying that the infection was the result of medical interventions occurring during that hospital visit. Over 10,000 more cases were detected in the emergency department or early in the hospital stay; these cases are likely related to previous healthcare exposures.
The longer a person stays in the hospital, the higher the total risk of acquiring an infection in the hospital, so the HO rate is reported using a denominator of patient days. To calculate “patient days” a daily count of patients is performed at the same time each day. The daily counts are added up for the entire year to give the patient days for that year. The HO rate is defined as the number of new infections identified more than three days after hospital admission, per 10,000 patient days. Clostridium difficile rate Number of
Infections Number of Patient
DaysInfection
Rate
Hospital Onset 7,855 10,628,375 7.4/10,000 patient days2015 NYS data downloaded from NHSN October 7, 2016.
8
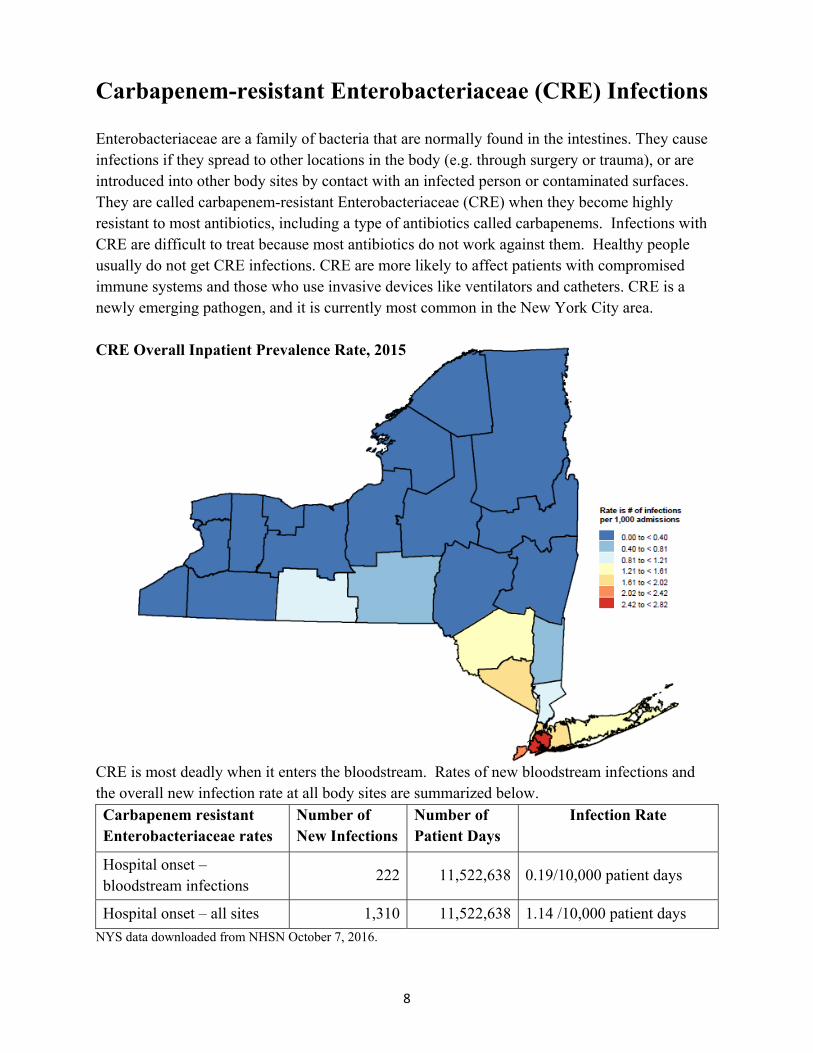
Carbapenem-resistant Enterobacteriaceae (CRE) Infections Enterobacteriaceae are a family of bacteria that are normally found in the intestines. They cause infections if they spread to other locations in the body (e.g. through surgery or trauma), or are introduced into other body sites by contact with an infected person or contaminated surfaces. They are called carbapenem-resistant Enterobacteriaceae (CRE) when they become highly resistant to most antibiotics, including a type of antibiotics called carbapenems. Infections with CRE are difficult to treat because most antibiotics do not work against them. Healthy people usually do not get CRE infections. CRE are more likely to affect patients with compromised immune systems and those who use invasive devices like ventilators and catheters. CRE is a newly emerging pathogen, and it is currently most common in the New York City area. CRE Overall Inpatient Prevalence Rate, 2015
CRE is most deadly when it enters the bloodstream. Rates of new bloodstream infections and the overall new infection rate at all body sites are summarized below. Carbapenem resistant Enterobacteriaceae rates
Number of New Infections
Number of Patient Days
Infection Rate
Hospital onset – bloodstream infections
222 11,522,638 0.19/10,000 patient days
Hospital onset – all sites 1,310 11,522,638 1.14 /10,000 patient days
NYS data downloaded from NHSN October 7, 2016.
9
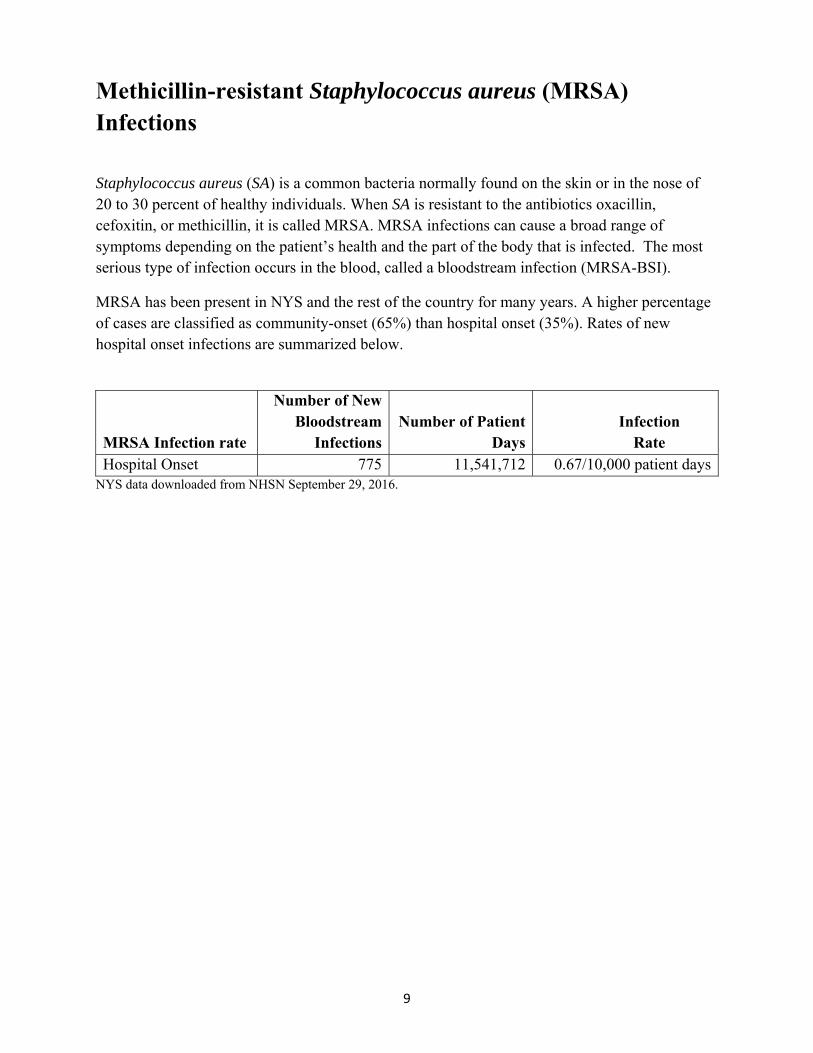
Methicillin-resistant Staphylococcus aureus (MRSA) Infections
Staphylococcus aureus (SA) is a common bacteria normally found on the skin or in the nose of 20 to 30 percent of healthy individuals. When SA is resistant to the antibiotics oxacillin, cefoxitin, or methicillin, it is called MRSA. MRSA infections can cause a broad range of symptoms depending on the patient’s health and the part of the body that is infected. The most serious type of infection occurs in the blood, called a bloodstream infection (MRSA-BSI).
MRSA has been present in NYS and the rest of the country for many years. A higher percentage of cases are classified as community-onset (65%) than hospital onset (35%). Rates of new hospital onset infections are summarized below.
MRSA Infection rate
Number of New Bloodstream
Infections Number of Patient
DaysInfection
Rate Hospital Onset 775 11,541,712 0.67/10,000 patient days
NYS data downloaded from NHSN September 29, 2016.
10
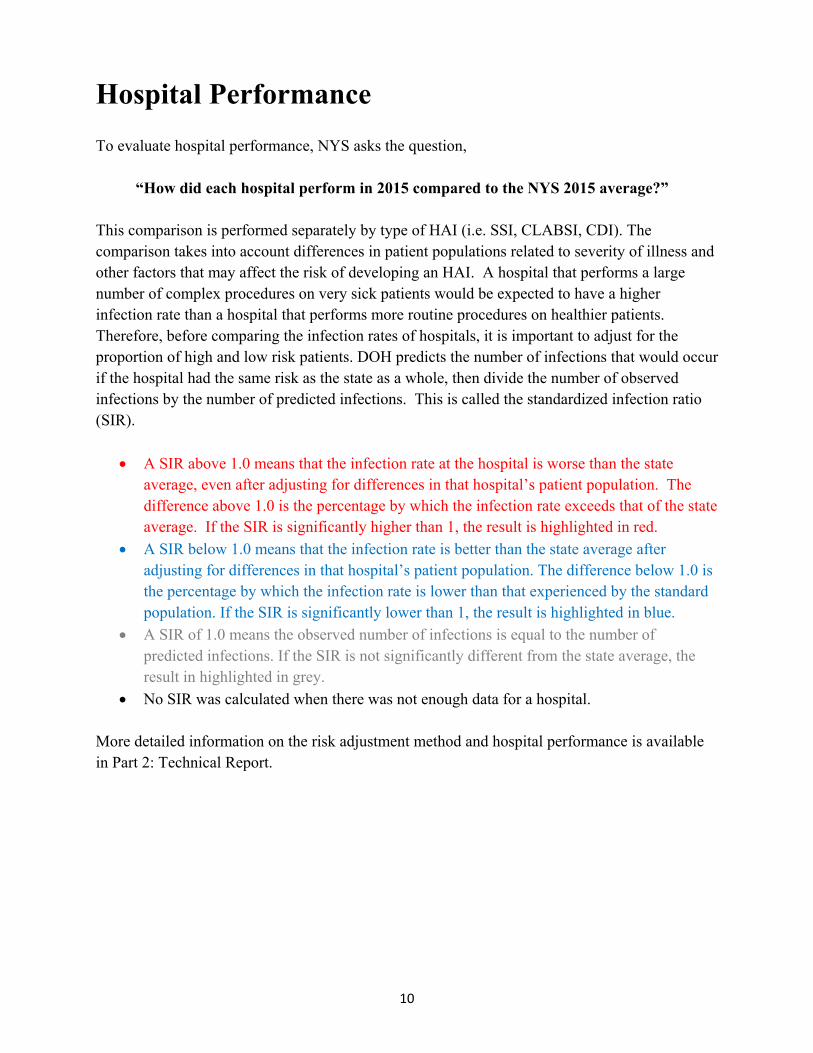
Hospital Performance To evaluate hospital performance, NYS asks the question, “How did each hospital perform in 2015 compared to the NYS 2015 average?” This comparison is performed separately by type of HAI (i.e. SSI, CLABSI, CDI). The comparison takes into account differences in patient populations related to severity of illness and other factors that may affect the risk of developing an HAI. A hospital that performs a large number of complex procedures on very sick patients would be expected to have a higher infection rate than a hospital that performs more routine procedures on healthier patients. Therefore, before comparing the infection rates of hospitals, it is important to adjust for the proportion of high and low risk patients. DOH predicts the number of infections that would occur if the hospital had the same risk as the state as a whole, then divide the number of observed infections by the number of predicted infections. This is called the standardized infection ratio (SIR).
A SIR above 1.0 means that the infection rate at the hospital is worse than the state average, even after adjusting for differences in that hospital’s patient population. The difference above 1.0 is the percentage by which the infection rate exceeds that of the state average. If the SIR is significantly higher than 1, the result is highlighted in red.
A SIR below 1.0 means that the infection rate is better than the state average after adjusting for differences in that hospital’s patient population. The difference below 1.0 is the percentage by which the infection rate is lower than that experienced by the standard population. If the SIR is significantly lower than 1, the result is highlighted in blue.
A SIR of 1.0 means the observed number of infections is equal to the number of predicted infections. If the SIR is not significantly different from the state average, the result in highlighted in grey.
No SIR was calculated when there was not enough data for a hospital. More detailed information on the risk adjustment method and hospital performance is available in Part 2: Technical Report.
11
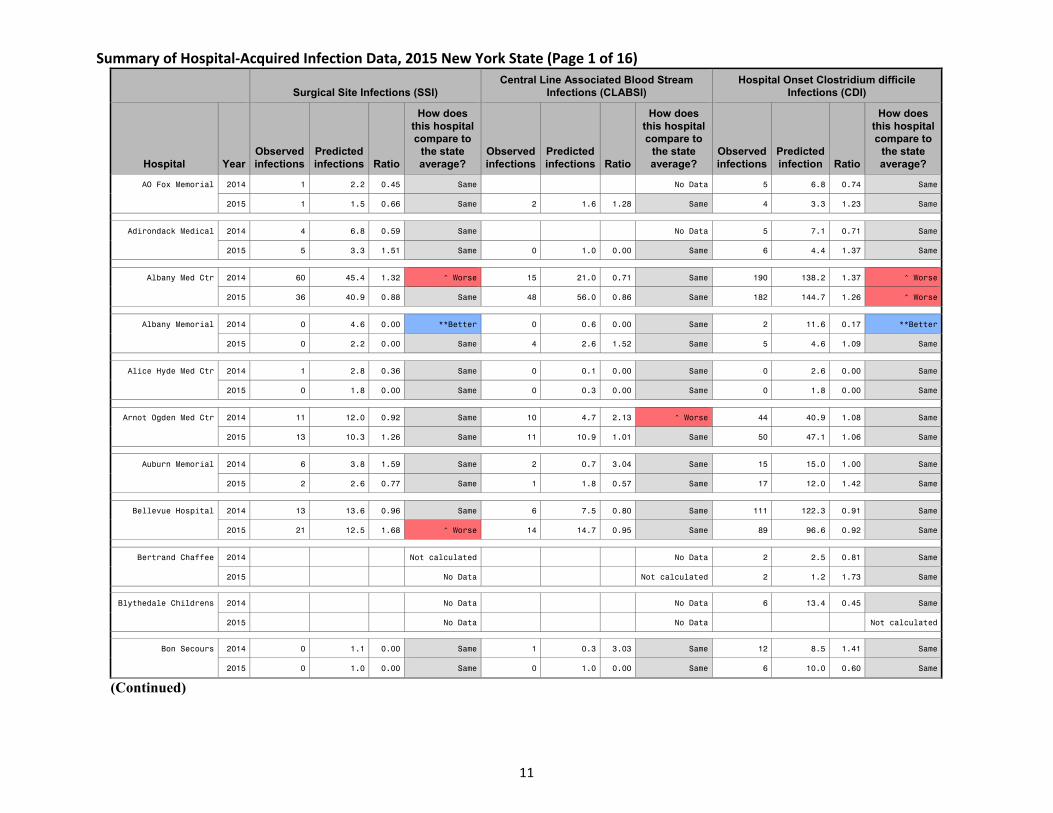
Summary of Hospital‐Acquired Infection Data, 2015 New York State (Page 1 of 16)
Surgical Site Infections (SSI) Central Line Associated Blood Stream
Infections (CLABSI) Hospital Onset Clostridium difficile
Infections (CDI)
Hospital Year Observed infections
Predicted infections Ratio
How does this hospital compare to
the state average?
Observed infections
Predicted infections Ratio
How does this hospital compare to
the state average?
Observed infections
Predicted infection Ratio
How does this hospital compare to
the state average?
AO Fox Memorial 2014 1 2.2 0.45 Same No Data 5 6.8 0.74 Same
2015 1 1.5 0.66 Same 2 1.6 1.28 Same 4 3.3 1.23 Same
Adirondack Medical 2014 4 6.8 0.59 Same No Data 5 7.1 0.71 Same
2015 5 3.3 1.51 Same 0 1.0 0.00 Same 6 4.4 1.37 Same
Albany Med Ctr 2014 60 45.4 1.32 ^ Worse 15 21.0 0.71 Same 190 138.2 1.37 ^ Worse
2015 36 40.9 0.88 Same 48 56.0 0.86 Same 182 144.7 1.26 ^ Worse
Albany Memorial 2014 0 4.6 0.00 **Better 0 0.6 0.00 Same 2 11.6 0.17 **Better
2015 0 2.2 0.00 Same 4 2.6 1.52 Same 5 4.6 1.09 Same
Alice Hyde Med Ctr 2014 1 2.8 0.36 Same 0 0.1 0.00 Same 0 2.6 0.00 Same
2015 0 1.8 0.00 Same 0 0.3 0.00 Same 0 1.8 0.00 Same
Arnot Ogden Med Ctr 2014 11 12.0 0.92 Same 10 4.7 2.13 ^ Worse 44 40.9 1.08 Same
2015 13 10.3 1.26 Same 11 10.9 1.01 Same 50 47.1 1.06 Same
Auburn Memorial 2014 6 3.8 1.59 Same 2 0.7 3.04 Same 15 15.0 1.00 Same
2015 2 2.6 0.77 Same 1 1.8 0.57 Same 17 12.0 1.42 Same
Bellevue Hospital 2014 13 13.6 0.96 Same 6 7.5 0.80 Same 111 122.3 0.91 Same
2015 21 12.5 1.68 ^ Worse 14 14.7 0.95 Same 89 96.6 0.92 Same
Bertrand Chaffee 2014 Not calculated No Data 2 2.5 0.81 Same
2015 No Data Not calculated 2 1.2 1.73 Same
Blythedale Childrens 2014 No Data No Data 6 13.4 0.45 Same
2015 No Data No Data Not calculated
Bon Secours 2014 0 1.1 0.00 Same 1 0.3 3.03 Same 12 8.5 1.41 Same
2015 0 1.0 0.00 Same 0 1.0 0.00 Same 6 10.0 0.60 Same
(Continued)

12
Summary of Hospital-Acquired Infection Data, 2015 New York State (Page 2 of 16)
Surgical Site Infections (SSI) Central Line Associated Blood Stream
Infections (CLABSI) Hospital Onset Clostridium difficile
Infections (CDI)
Hospital Year Observed infections
Predicted infections Ratio
How does this hospital compare to
the state average?
Observed infections
Predicted infections Ratio
How does this hospital compare to
the state average?
Observed infections
Predicted infection Ratio
How does this hospital compare to
the state average?
Bronx-Lebanon 2014 9 7.9 1.14 Same 7 5.4 1.29 Same 79 129.6 0.61 **Better
2015 16 7.3 2.19 ^ Worse 24 14.8 1.62 ^ Worse 79 75.2 1.05 Same
Brookdale Hospital 2014 12 7.6 1.57 Same 4 4.5 0.89 Same 21 50.6 0.41 **Better
2015 17 6.1 2.78 ^ Worse 25 9.6 2.60 ^ Worse 24 22.8 1.05 Same
Brookhaven Memorial 2014 9 7.0 1.29 Same 4 4.7 0.86 Same 122 83.9 1.45 ^ Worse
2015 2 5.0 0.40 Same 28 12.5 2.24 ^ Worse 83 55.9 1.49 ^ Worse
Brooklyn Hosp Ctr 2014 9 11.2 0.80 Same 16 4.3 3.69 ^ Worse 61 64.5 0.95 Same
2015 8 8.7 0.92 Same 31 12.5 2.47 ^ Worse 42 52.0 0.81 Same
Brooks Memorial 2014 1 1.8 0.57 Same 0 0.3 0.00 Same 3 7.6 0.39 Same
2015 4 2.3 1.70 Same 3 0.6 5.30 ^ Worse 5 3.7 1.37 Same
Buffalo General 2014 31 32.8 0.95 Same 19 12.3 1.55 Same 133 113.0 1.18 Same
2015 32 30.7 1.04 Same 39 32.0 1.22 Same 111 91.6 1.21 Same
Burdett Care Center 2014 No Data No Data 0 0.2 0.00 Same
2015 No Data No Data Not calculated
Burke Rehab Hosp 2014 No Data No Data 20 13.4 1.49 Same
2015 No Data No Data Not calculated
Calvary Hospital 2014 No Data No Data 18 73.6 0.24 **Better
2015 No Data No Data Not calculated
Canton-Potsdam 2014 5 5.2 0.96 Same 0 0.1 0.00 Same 6 6.3 0.95 Same
2015 5 4.7 1.07 Same 2 1.7 1.19 Same 10 12.3 0.81 Same
Catskill Regional 2014 0 4.2 0.00 **Better 2 0.8 2.45 Same 7 10.6 0.66 Same
2015 7 1.8 3.90 ^ Worse 2 1.5 1.37 Same 14 8.2 1.71 Same
(Continued)

13
Summary of Hospital-Acquired Infection Data, 2015 New York State (Page 3 of 16)
Surgical Site Infections (SSI) Central Line Associated Blood Stream
Infections (CLABSI) Hospital Onset Clostridium difficile
Infections (CDI)
Hospital Year Observed infections
Predicted infections Ratio
How does this hospital compare to
the state average?
Observed infections
Predicted infections Ratio
How does this hospital compare to
the state average?
Observed infections
Predicted infection Ratio
How does this hospital compare to
the state average?
Cayuga Medical Ctr 2014 6 5.1 1.17 Same 0 1.1 0.00 Same 19 16.9 1.13 Same
2015 2 4.8 0.41 Same 1 4.2 0.24 Same 15 17.2 0.87 Same
Champlain Valley 2014 9 10.3 0.87 Same 2 1.5 1.33 Same 22 43.1 0.51 **Better
2015 4 6.6 0.61 Same 4 12.2 0.33 **Better 12 44.4 0.27 **Better
Claxton-Hepburn 2014 4 1.4 2.89 Same 0 0.2 0.00 Same 7 10.3 0.68 Same
2015 1 1.2 0.80 Same 2 1.9 1.06 Same 5 7.0 0.71 Same
Clifton Springs 2014 2 1.3 1.51 Same 0 0.3 0.00 Same 5 1.9 2.70 Same
2015 3 1.4 2.15 Same 1 1.6 0.62 Same 2 8.5 0.23 Same
Cobleskill Regional 2014 No Data No Data 0 4.5 0.00 Same
2015 No Data 0 0.1 0.00 Same 2 2.5 0.79 Same
Columbia Memorial 2014 5 4.9 1.02 Same 1 0.7 1.53 Same 17 12.5 1.35 Same
2015 4 4.0 1.01 Same 3 2.1 1.44 Same 15 28.8 0.52 **Better
Coney Island Hosp 2014 2 4.1 0.49 Same 6 3.9 1.54 Same 64 86.1 0.74 Same
2015 2 4.2 0.47 Same 21 15.4 1.36 Same 92 76.5 1.20 Same
Corning Hospital 2014 2 3.8 0.53 Same 1 0.3 3.74 Same 12 11.7 1.03 Same
2015 2 3.2 0.63 Same 0 1.5 0.00 Same 9 15.6 0.58 Same
Cortland Reg Med 2014 4 2.4 1.65 Same 1 0.5 1.84 Same 4 15.1 0.26 **Better
2015 3 2.2 1.38 Same 0 1.6 0.00 Same 10 6.0 1.68 Same
Crouse Hospital 2014 46 31.5 1.46 ^ Worse 11 6.2 1.78 Same 49 60.0 0.82 Same
2015 32 24.3 1.32 Same 18 20.9 0.86 Same 37 72.9 0.51 **Better
DeGraff Memorial 2014 0 1.5 0.00 Same No Data 9 7.0 1.28 Same
2015 0 1.0 0.00 Same 0 0.8 0.00 Same 5 5.7 0.88 Same
(Continued)

14
Summary of Hospital-Acquired Infection Data, 2015 New York State (Page 4 of 16)
Surgical Site Infections (SSI) Central Line Associated Blood Stream
Infections (CLABSI) Hospital Onset Clostridium difficile
Infections (CDI)
Hospital Year Observed infections
Predicted infections Ratio
How does this hospital compare to
the state average?
Observed infections
Predicted infections Ratio
How does this hospital compare to
the state average?
Observed infections
Predicted infection Ratio
How does this hospital compare to
the state average?
East. Niag. Lockport 2014 2 3.2 0.63 Same 0 0.4 0.00 Same 8 8.6 0.93 Same
2015 0 2.1 0.00 Same 3 0.9 3.40 Same 3 9.8 0.31 Same
Eastern Long Island 2014 0 0.7 0.00 Same 0 0.1 0.00 Same 1 7.1 0.14 Same
2015 0 0.6 0.00 Same 0 0.3 0.00 Same 4 5.8 0.69 Same
Ellis Hospital
2014 7 18.8 0.37 **Better 1 4.5 0.22 Same 83 60.8 1.37 ^ Worse
2015 12 17.0 0.70 Same 2 11.2 0.18 **Better 52 53.1 0.98 Same
Elmhurst Hospital 2014 18 8.0 2.24 ^ Worse 1 3.0 0.33 Same 53 41.7 1.27 Same
2015 15 5.8 2.60 ^ Worse 16 10.3 1.55 Same 28 59.4 0.47 **Better
Erie County Med Ctr 2014 11 9.5 1.16 Same 3 2.8 1.06 Same 72 62.0 1.16 Same
2015 16 8.9 1.80 ^ Worse 17 16.0 1.07 Same 67 67.6 0.99 Same
FF Thompson 2014 5 4.9 1.01 Same 0 0.5 0.00 Same 11 16.2 0.68 Same
2015 3 5.3 0.57 Same 2 2.8 0.72 Same 13 14.4 0.91 Same
Faxton St. Lukes 2014 12 8.5 1.41 Same 1 2.0 0.51 Same 73 59.5 1.23 Same
2015 11 6.4 1.71 Same 8 10.3 0.78 Same 62 58.6 1.06 Same
Flushing Hospital 2014 9 6.3 1.42 Same 11 4.3 2.56 ^ Worse 49 62.7 0.78 Same
2015 8 5.5 1.46 Same 18 7.7 2.33 ^ Worse 39 40.9 0.95 Same
Geneva General 2014 8 4.3 1.87 Same 1 1.0 0.96 Same 6 10.3 0.58 Same
2015 4 4.4 0.90 Same 2 2.7 0.75 Same 4 9.3 0.43 Same
Glen Cove Hospital 2014 0 3.5 0.00 **Better 3 0.5 5.65 ^ Worse 19 18.8 1.01 Same
2015 1 1.8 0.57 Same 0 0.8 0.00 Same 11 10.0 1.10 Same
Glens Falls Hospital 2014 10 10.0 1.00 Same 0 1.6 0.00 Same 39 62.5 0.62 **Better
2015 5 9.0 0.55 Same 0 7.1 0.00 **Better 35 43.7 0.80 Same
(Continued)
15
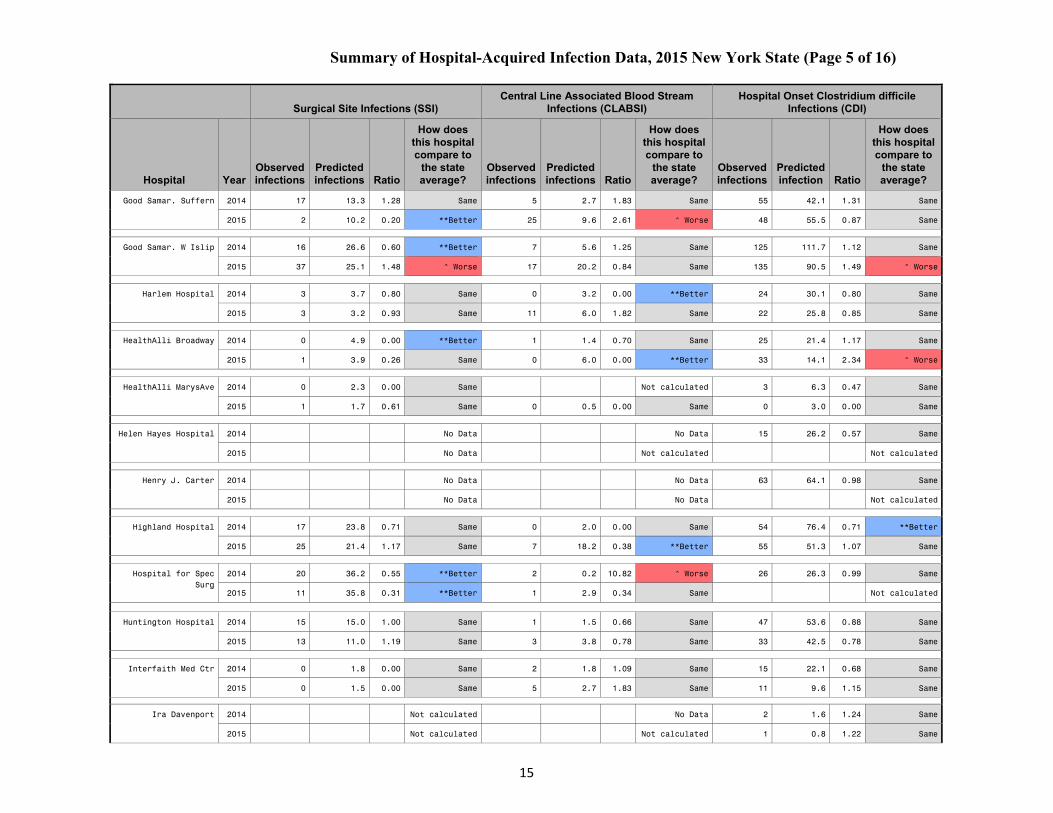
Summary of Hospital-Acquired Infection Data, 2015 New York State (Page 5 of 16)
Surgical Site Infections (SSI) Central Line Associated Blood Stream
Infections (CLABSI) Hospital Onset Clostridium difficile
Infections (CDI)
Hospital Year Observed infections
Predicted infections Ratio
How does this hospital compare to
the state average?
Observed infections
Predicted infections Ratio
How does this hospital compare to
the state average?
Observed infections
Predicted infection Ratio
How does this hospital compare to
the state average?
Good Samar. Suffern 2014 17 13.3 1.28 Same 5 2.7 1.83 Same 55 42.1 1.31 Same
2015 2 10.2 0.20 **Better 25 9.6 2.61 ^ Worse 48 55.5 0.87 Same
Good Samar. W Islip 2014 16 26.6 0.60 **Better 7 5.6 1.25 Same 125 111.7 1.12 Same
2015 37 25.1 1.48 ^ Worse 17 20.2 0.84 Same 135 90.5 1.49 ^ Worse
Harlem Hospital 2014 3 3.7 0.80 Same 0 3.2 0.00 **Better 24 30.1 0.80 Same
2015 3 3.2 0.93 Same 11 6.0 1.82 Same 22 25.8 0.85 Same
HealthAlli Broadway 2014 0 4.9 0.00 **Better 1 1.4 0.70 Same 25 21.4 1.17 Same
2015 1 3.9 0.26 Same 0 6.0 0.00 **Better 33 14.1 2.34 ^ Worse
HealthAlli MarysAve 2014 0 2.3 0.00 Same Not calculated 3 6.3 0.47 Same
2015 1 1.7 0.61 Same 0 0.5 0.00 Same 0 3.0 0.00 Same
Helen Hayes Hospital 2014 No Data No Data 15 26.2 0.57 Same
2015 No Data Not calculated Not calculated
Henry J. Carter 2014 No Data No Data 63 64.1 0.98 Same
2015 No Data No Data Not calculated
Highland Hospital 2014 17 23.8 0.71 Same 0 2.0 0.00 Same 54 76.4 0.71 **Better
2015 25 21.4 1.17 Same 7 18.2 0.38 **Better 55 51.3 1.07 Same
Hospital for Spec Surg
2014 20 36.2 0.55 **Better 2 0.2 10.82 ^ Worse 26 26.3 0.99 Same
2015 11 35.8 0.31 **Better 1 2.9 0.34 Same Not calculated
Huntington Hospital
2014 15 15.0 1.00 Same 1 1.5 0.66 Same 47 53.6 0.88 Same
2015 13 11.0 1.19 Same 3 3.8 0.78 Same 33 42.5 0.78 Same
Interfaith Med Ctr 2014 0 1.8 0.00 Same 2 1.8 1.09 Same 15 22.1 0.68 Same
2015 0 1.5 0.00 Same 5 2.7 1.83 Same 11 9.6 1.15 Same
Ira Davenport 2014 Not calculated No Data 2 1.6 1.24 Same
2015 Not calculated Not calculated 1 0.8 1.22 Same

16
Summary of Hospital-Acquired Infection Data, 2015 New York State (Page 6 of 16)
Surgical Site Infections (SSI) Central Line Associated Blood Stream
Infections (CLABSI) Hospital Onset Clostridium difficile
Infections (CDI)
Hospital Year Observed infections
Predicted infections Ratio
How does this hospital compare to
the state average?
Observed infections
Predicted infections Ratio
How does this hospital compare to
the state average?
Observed infections
Predicted infection Ratio
How does this hospital compare to
the state average?
JT Mather Hospital 2014 16 8.5 1.88 ^ Worse 0 1.9 0.00 Same 65 39.0 1.67 ^ Worse
2015 12 7.4 1.61 Same 4 7.5 0.53 Same 44 29.2 1.50 Same
Jacobi Med Ctr 2014 16 11.8 1.36 Same 3 3.6 0.84 Same 61 68.3 0.89 Same
2015 11 10.3 1.07 Same 7 7.3 0.96 Same 59 62.9 0.94 Same
Jamaica Hospital 2014 9 9.7 0.93 Same 2 3.5 0.57 Same 52 43.3 1.20 Same
2015 12 8.3 1.44 Same 10 10.5 0.95 Same 55 53.8 1.02 Same
Jones Memorial 2014 0 1.2 0.00 Same 0 0.3 0.00 Same 5 4.4 1.15 Same
2015 1 1.0 1.04 Same 0 1.2 0.00 Same 3 1.9 1.58 Same
Kenmore Mercy 2014 14 13.7 1.03 Same 0 1.3 0.00 Same 23 32.8 0.70 Same
2015 16 11.6 1.38 Same 2 3.6 0.55 Same 19 24.2 0.79 Same
Kings County Hosp 2014 18 12.6 1.43 Same 13 6.6 1.96 ^ Worse 15 36.6 0.41 **Better
2015 5 11.2 0.45 Same 18 13.6 1.33 Same 48 44.9 1.07 Same
Kingsbrook Jewish MC 2014 5 5.1 0.98 Same 5 2.3 2.14 Same 30 36.0 0.83 Same
2015 1 3.5 0.29 Same 11 5.9 1.88 Same 37 25.3 1.46 Same
LIJ at Forest Hills 2014 12 11.2 1.07 Same 0 2.3 0.00 Same 85 72.5 1.17 Same
2015 3 6.9 0.44 Same 6 6.4 0.94 Same 62 44.7 1.39 Same
LIJ at Valley Stream 2014 5 5.4 0.92 Same 1 1.1 0.87 Same 21 36.3 0.58 **Better
2015 1 3.8 0.26 Same 2 3.5 0.57 Same 11 24.5 0.45 **Better
Lenox Hill Hospital 2014 29 29.7 0.98 Same 3 6.6 0.46 Same 114 76.1 1.50 ^ Worse
2015 25 30.3 0.83 Same 13 15.3 0.85 Same 67 69.9 0.96 Same
Lincoln Med Ctr 2014 1 6.6 0.15 **Better 9 4.3 2.08 Same 24 32.8 0.73 Same
2015 6 5.8 1.03 Same 23 11.9 1.94 ^ Worse 21 25.7 0.82 Same
(Continued)

17
Summary of Hospital-Acquired Infection Data, 2015 New York State (Page 7 of 16)
Surgical Site Infections (SSI) Central Line Associated Blood Stream
Infections (CLABSI) Hospital Onset Clostridium difficile
Infections (CDI)
Hospital Year Observed infections
Predicted infections Ratio
How does this hospital compare to
the state average?
Observed infections
Predicted infections Ratio
How does this hospital compare to
the state average?
Observed infections
Predicted infection Ratio
How does this hospital compare to
the state average?
Long Isl Jewish(LIJ) 2014 50 39.0 1.28 Same 6 9.4 0.64 Same 196 100.8 1.95 ^ Worse
2015 24 32.6 0.74 Same 18 26.4 0.68 Same 131 145.1 0.90 Same
Maimonides Med Ctr 2014 33 31.1 1.06 Same 1 8.3 0.12 **Better 52 109.2 0.48 **Better
2015 35 27.3 1.28 Same 25 22.4 1.11 Same 56 67.7 0.83 Same
Mary Imogene Bassett 2014 17 18.9 0.90 Same 4 1.9 2.12 Same 25 34.2 0.73 Same
2015 16 14.2 1.13 Same 2 6.2 0.32 Same 22 30.8 0.71 Same
Massena Memorial 2014 2 1.7 1.21 Same Not calculated 3 3.2 0.95 Same
2015 0 0.7 0.00 Same 0 0.2 0.00 Same 3 3.2 0.95 Same
Memor SloanKettering 2014 71 70.9 1.00 Same No Data 257 162.8 1.58 ^ Worse
2015 64 72.8 0.88 Same No Data Not calculated
Mercy Hosp Buffalo 2014 46 29.9 1.54 ^ Worse 3 6.7 0.45 Same 79 86.1 0.92 Same
2015 33 25.4 1.30 Same 13 13.8 0.94 Same 57 54.1 1.05 Same
Mercy Med Ctr 2014 8 7.2 1.12 Same 1 1.5 0.66 Same 51 25.9 1.97 ^ Worse
2015 4 6.1 0.65 Same 7 5.1 1.38 Same 43 33.3 1.29 Same
Metropolitan Hosp 2014 7 3.1 2.29 Same 3 2.3 1.31 Same 10 28.1 0.36 **Better
2015 10 2.8 3.55 ^ Worse 3 2.2 1.34 Same 11 20.0 0.55 Same
MidHudson Reg of WMC 2014 3 6.6 0.45 Same 0 1.5 0.00 Same 19 14.0 1.35 Same
2015 4 4.5 0.89 Same 4 5.5 0.72 Same 11 9.7 1.13 Same
Millard Fill. Suburb 2014 29 30.0 0.97 Same 6 3.6 1.65 Same 67 62.7 1.07 Same
2015 22 23.1 0.95 Same 19 12.6 1.51 Same 63 58.0 1.09 Same
Monroe Community 2014 No Data No Data 1 0.1 8.04 Same
2015 No Data No Data Not calculated
(Continued)

18
Summary of Hospital-Acquired Infection Data, 2015 New York State (Page 8 of 16)
Surgical Site Infections (SSI) Central Line Associated Blood Stream
Infections (CLABSI) Hospital Onset Clostridium difficile
Infections (CDI)
Hospital Year Observed infections
Predicted infections Ratio
How does this hospital compare to
the state average?
Observed infections
Predicted infections Ratio
How does this hospital compare to
the state average?
Observed infections
Predicted infection Ratio
How does this hospital compare to
the state average?
Montefiore-Einstein 2014 29 25.1 1.15 Same 10 7.4 1.35 Same 130 124.4 1.04 Same
2015 33 22.2 1.48 ^ Worse 22 18.2 1.21 Same 123 88.4 1.39 ^ Worse
Montefiore-Moses 2014 32 25.9 1.23 Same 3 11.2 0.27 **Better 254 265.4 0.96 Same
2015 16 22.3 0.72 Same 40 45.3 0.88 Same 199 188.8 1.05 Same
Montefiore-Mt Vernon 2014 1 1.3 0.80 Same 1 0.4 2.54 Same 9 14.1 0.64 Same
2015 1 1.7 0.59 Same 1 1.6 0.63 Same 6 8.1 0.74 Same
Montefiore-NewRochl 2014 7 6.5 1.08 Same 1 1.0 1.02 Same 21 30.2 0.69 Same
2015 6 5.2 1.16 Same 3 3.3 0.90 Same 27 22.6 1.19 Same
Montefiore-Wakefield 2014 14 7.9 1.76 Same 4 3.7 1.08 Same 70 74.8 0.94 Same
2015 15 9.2 1.62 Same 5 7.9 0.64 Same 49 48.7 1.01 Same
Mount St. Marys 2014 4 4.6 0.86 Same 0 0.4 0.00 Same 10 11.4 0.88 Same
2015 3 3.4 0.88 Same 0 2.6 0.00 Same 5 10.1 0.49 Same
Mt Sinai 2014 108 78.5 1.38 ^ Worse 10 18.4 0.54 **Better 296 229.5 1.29 ^ Worse
2015 95 72.0 1.32 ^ Worse 54 55.2 0.98 Same 286 192.9 1.48 ^ Worse
Mt Sinai Beth Israel 2014 16 26.4 0.61 **Better 2 6.0 0.33 Same 104 109.5 0.95 Same
2015 18 23.2 0.78 Same 12 18.3 0.66 Same 66 78.1 0.85 Same
Mt Sinai Brooklyn 2014 3 4.8 0.63 Same 1 0.9 1.10 Same 37 70.1 0.53 **Better
2015 3 5.2 0.58 Same 3 5.2 0.57 Same 30 48.2 0.62 **Better
Mt Sinai Queens 2014 2 7.1 0.28 Same 0 0.9 0.00 Same 32 51.2 0.63 **Better
2015 2 5.8 0.35 Same 2 3.1 0.64 Same 18 27.3 0.66 Same
Mt Sinai St Lukes 2014 9 10.1 0.89 Same 3 4.3 0.69 Same 32 76.3 0.42 **Better
2015 7 10.5 0.67 Same 4 8.3 0.48 Same 45 52.7 0.85 Same
(Continued)

19
Summary of Hospital-Acquired Infection Data, 2015 New York State (Page 9 of 16)
Surgical Site Infections (SSI) Central Line Associated Blood Stream
Infections (CLABSI) Hospital Onset Clostridium difficile
Infections (CDI)
Hospital Year Observed infections
Predicted infections Ratio
How does this hospital compare to
the state average?
Observed infections
Predicted infections Ratio
How does this hospital compare to
the state average?
Observed infections
Predicted infection Ratio
How does this hospital compare to
the state average?
Mt Sinai West 2014 11 17.9 0.61 Same 2 2.2 0.89 Same 36 50.9 0.71 Same
2015 12 16.1 0.75 Same 4 5.2 0.77 Same 44 60.1 0.73 Same
NY Community Hosp 2014 4 2.7 1.50 Same 0 0.7 0.00 Same 33 34.8 0.95 Same
2015 0 1.8 0.00 Same 4 1.5 2.66 Same 41 29.9 1.37 Same
NY Eye-Ear Mt Sinai 2014 No Data No Data 0 0.2 0.00 Same
2015 No Data Not calculated Not calculated
NY Methodist 2014 15 24.9 0.60 **Better 6 7.6 0.79 Same 139 159.5 0.87 Same
2015 15 24.9 0.60 **Better 26 19.3 1.35 Same 140 116.0 1.21 Same
NYP-Allen 2014 2 2.0 1.00 Same 2 0.6 3.19 Same 28 34.2 0.82 Same
2015 3 2.3 1.31 Same 2 2.3 0.87 Same 23 40.9 0.56 **Better
NYP-Columbia-Morgan
NYP-Columbia
2014 33 44.0 0.75 Same 34 30.4 1.12 Same 259 247.6 1.05 Same
2015 31 45.4 0.68 **Better 72 51.8 1.39 ^ Worse 235 234.9 1.00 Same
NYP-Hudson Valley 2014 5 8.5 0.59 Same 0 0.6 0.00 Same 16 20.3 0.79 Same
2015 4 5.7 0.70 Same 0 2.0 0.00 Same 17 12.9 1.32 Same
NYP-Lawrence 2014 5 6.5 0.76 Same 1 1.6 0.63 Same 31 40.0 0.78 Same
2015 5 5.1 0.98 Same 7 6.0 1.17 Same 40 31.9 1.25 Same
NYP-Lower Manhattan 2014 4 6.4 0.62 Same 2 2.0 0.99 Same 17 20.7 0.82 Same
2015 4 5.9 0.68 Same 1 4.1 0.24 Same 22 20.6 1.07 Same
NYP-Morgan Stanley 2015 0 2.9 0.00 Same 28 20.9 1.34 Same Not calculated
NYP-Queens 2014 27 25.6 1.05 Same 6 5.4 1.11 Same 226 167.3 1.35 ^ Worse
2015 17 19.2 0.89 Same 23 15.0 1.53 Same 153 135.3 1.13 Same
NYP-Weill Cornell 2014 39 50.4 0.77 Same 20 17.7 1.13 Same 244 243.5 1.00 Same
2015 39 42.8 0.91 Same 62 50.9 1.22 Same 217 191.3 1.13 Same
(Continued)

20
Summary of Hospital-Acquired Infection Data, 2015 New York State (Page 10 of 16)
Surgical Site Infections (SSI) Central Line Associated Blood Stream
Infections (CLABSI) Hospital Onset Clostridium difficile
Infections (CDI)
Hospital Year Observed infections
Predicted infections Ratio
How does this hospital compare to
the state average?
Observed infections
Predicted infections Ratio
How does this hospital compare to
the state average?
Observed infections
Predicted infection Ratio
How does this hospital compare to
the state average?
NYU Joint Diseases 2014 23 12.3 1.87 ^ Worse No Data 12 17.1 0.70 Same
2015 19 15.0 1.27 Same 0 0.4 0.00 Same Not calculated
NYU Langone Med Ctr 2014 33 32.7 1.01 Same 8 10.0 0.80 Same 140 131.8 1.06 Same
2015 27 34.4 0.78 Same 28 31.8 0.88 Same 119 107.3 1.11 Same
NYU Lutheran 2014 14 14.4 0.97 Same 3 3.8 0.79 Same 93 87.8 1.06 Same
2015 5 12.7 0.39 **Better 15 12.4 1.21 Same 111 75.6 1.47 ^ Worse
Nassau University 2014 8 6.2 1.29 Same 0 3.3 0.00 **Better 15 36.1 0.42 **Better
2015 6 5.2 1.16 Same 0 5.9 0.00 **Better 12 26.2 0.46 **Better
Nathan Littauer 2014 2 1.3 1.57 Same 0 0.2 0.00 Same 4 5.3 0.75 Same
2015 1 1.8 0.54 Same 0 0.7 0.00 Same 3 2.8 1.07 Same
Newark Wayne 2014 4 3.2 1.27 Same 0 1.0 0.00 Same 18 17.4 1.03 Same
2015 3 2.8 1.07 Same 1 1.6 0.62 Same 13 26.4 0.49 **Better
Niagara Falls 2014 6 2.8 2.11 Same 0 0.7 0.00 Same 3 9.6 0.31 Same
2015 2 1.9 1.06 Same 3 3.3 0.90 Same 19 14.5 1.31 Same
North Central Bronx 2014 Not calculated 0 0.3 0.00 Same 7 17.5 0.40 **Better
2015 0 1.1 0.00 Same 2 1.3 1.51 Same 5 14.8 0.34 **Better
North Shore 2014 64 62.4 1.03 Same 4 10.1 0.40 Same 235 209.0 1.12 Same
2015 57 58.2 0.98 Same 11 26.1 0.42 **Better 150 178.4 0.84 Same
Northern Dutchess 2014 2 3.5 0.58 Same 3 0.4 8.39 ^ Worse 9 9.7 0.93 Same
2015 5 3.0 1.65 Same 2 1.2 1.69 Same 19 9.5 2.00 ^ Worse
Northern Westchester 2014 10 9.1 1.10 Same 0 0.9 0.00 Same 42 25.4 1.66 ^ Worse
2015 11 8.7 1.26 Same 2 4.0 0.51 Same 35 27.6 1.27 Same
(Continued)

21
Summary of Hospital-Acquired Infection Data, 2015 New York State (Page 11 of 16)
Surgical Site Infections (SSI) Central Line Associated Blood Stream
Infections (CLABSI) Hospital Onset Clostridium difficile
Infections (CDI)
Hospital Year Observed infections
Predicted infections Ratio
How does this hospital compare to
the state average?
Observed infections
Predicted infections Ratio
How does this hospital compare to
the state average?
Observed infections
Predicted infection Ratio
How does this hospital compare to
the state average?
Noyes Memorial 2014 2 2.7 0.74 Same 0 0.2 0.00 Same 2 3.4 0.59 Same
2015 2 1.8 1.12 Same 0 0.5 0.00 Same 3 3.8 0.78 Same
Nyack Hospital 2014 7 6.3 1.12 Same 0 1.4 0.00 Same 48 49.7 0.97 Same
2015 6 5.7 1.06 Same 5 5.3 0.93 Same 30 52.3 0.57 **Better
Olean General 2014 7 7.3 0.96 Same 0 1.0 0.00 Same 23 36.5 0.63 Same
2015 1 4.4 0.23 Same 5 4.0 1.26 Same 18 20.0 0.90 Same
Oneida Healthcare 2014 8 5.3 1.51 Same 0 0.3 0.00 Same 6 8.2 0.73 Same
2015 5 4.0 1.26 Same 0 0.9 0.00 Same 5 5.4 0.92 Same
OrangeReg Goshen-Mid 2014 9 13.2 0.68 Same 4 1.9 2.12 Same 90 73.5 1.22 Same
2015 8 12.4 0.64 Same 12 12.2 0.98 Same 114 69.0 1.65 ^ Worse
Oswego Hospital 2014 5 3.5 1.41 Same 0 0.5 0.00 Same 12 18.8 0.64 Same
2015 2 3.6 0.56 Same 0 1.8 0.00 Same 2 12.7 0.16 **Better
Our Lady of Lourdes 2014 9 10.3 0.87 Same 2 1.0 2.06 Same 51 48.9 1.04 Same
2015 12 9.6 1.25 Same 5 6.9 0.72 Same 43 43.6 0.99 Same
Peconic Bay Medical 2014 7 10.9 0.64 Same 1 0.5 2.08 Same 26 22.3 1.16 Same
2015 7 10.2 0.69 Same 3 1.6 1.85 Same 34 21.0 1.62 Same
Phelps Memorial 2014 2 4.3 0.47 Same 0 0.6 0.00 Same 32 17.7 1.81 ^ Worse
2015 0 3.8 0.00 **Better 2 2.9 0.69 Same 22 33.9 0.65 Same
Plainview Hospital 2014 15 11.5 1.30 Same 0 1.8 0.00 Same 33 43.5 0.76 Same
2015 10 8.8 1.13 Same 3 3.7 0.81 Same 35 29.6 1.18 Same
Putnam Hospital 2014 5 8.2 0.61 Same 0 0.5 0.00 Same 24 20.1 1.20 Same
2015 6 7.0 0.86 Same 4 1.9 2.10 Same 23 23.0 1.00 Same
(Continued)

22
Summary of Hospital-Acquired Infection Data, 2015 New York State (Page 12 of 16)
Surgical Site Infections (SSI) Central Line Associated Blood Stream
Infections (CLABSI) Hospital Onset Clostridium difficile
Infections (CDI)
Hospital Year Observed infections
Predicted infections Ratio
How does this hospital compare to
the state average?
Observed infections
Predicted infections Ratio
How does this hospital compare to
the state average?
Observed infections
Predicted infection Ratio
How does this hospital compare to
the state average?
Queens Hospital 2014 10 6.1 1.63 Same 8 2.9 2.76 ^ Worse 24 44.0 0.55 **Better
2015 4 5.2 0.77 Same 7 6.0 1.16 Same 18 27.2 0.66 Same
Richmond Univ MC 2014 10 11.3 0.88 Same 6 5.7 1.06 Same 75 60.0 1.25 Same
2015 13 9.2 1.41 Same 14 11.2 1.25 Same 52 45.8 1.13 Same
Rochester General 2014 46 42.8 1.08 Same 5 7.3 0.68 Same 146 210.2 0.69 **Better
2015 46 44.2 1.04 Same 30 26.4 1.14 Same 128 167.2 0.77 **Better
Rome Memorial 2014 2 3.6 0.55 Same 0 0.6 0.00 Same 9 10.6 0.85 Same
2015 0 1.9 0.00 Same 1 1.5 0.65 Same 20 10.0 2.00 ^ Worse
Roswell Park 2014 15 12.0 1.26 Same No Data 26 35.3 0.74 Same
2015 20 12.4 1.61 Same No Data Not calculated
SUNY Downstate MedCr 2014 6 10.2 0.59 Same 9 3.7 2.46 ^ Worse 52 51.2 1.02 Same
2015 8 6.6 1.20 Same 44 12.8 3.43 ^ Worse 61 48.4 1.26 Same
Samaritan- Troy 2014 9 8.3 1.09 Same 0 1.0 0.00 Same 8 17.5 0.46 Same
2015 4 6.7 0.60 Same 3 5.2 0.57 Same 7 11.2 0.63 Same
Samaritan- Watertown 2014 7 8.1 0.86 Same 0 0.8 0.00 Same 23 17.1 1.35 Same
2015 7 5.8 1.22 Same 6 4.3 1.40 Same 18 32.9 0.55 **Better
Saratoga Hospital 2014 6 8.5 0.70 Same 0 1.2 0.00 Same 22 41.8 0.53 **Better
2015 9 8.4 1.07 Same 1 6.9 0.14 **Better 43 31.4 1.37 Same
Sisters of Charity 2014 16 13.7 1.17 Same 0 2.5 0.00 Same 35 39.4 0.89 Same
2015 18 12.2 1.47 Same 6 8.3 0.72 Same 30 30.2 0.99 Same
Sisters- St Joseph 2014 17 6.7 2.53 ^ Worse 2 1.1 1.79 Same 23 26.6 0.86 Same
2015 13 4.6 2.80 ^ Worse 3 4.3 0.70 Same 22 21.8 1.01 Same
(Continued)

23
Summary of Hospital-Acquired Infection Data, 2015 New York State (Page 13 of 16)
Surgical Site Infections (SSI) Central Line Associated Blood Stream
Infections (CLABSI) Hospital Onset Clostridium difficile
Infections (CDI)
Hospital Year Observed infections
Predicted infections Ratio
How does this hospital compare to
the state average?
Observed infections
Predicted infections Ratio
How does this hospital compare to
the state average?
Observed infections
Predicted infection Ratio
How does this hospital compare to
the state average?
South Nassau Comm. 2014 19 23.6 0.81 Same 1 3.6 0.28 Same 128 89.7 1.43 ^ Worse
2015 22 18.9 1.17 Same 6 18.1 0.33 **Better 114 99.6 1.14 Same
Southampton 2014 2 3.8 0.52 Same 0 0.7 0.00 Same 18 14.8 1.22 Same
2015 5 3.2 1.54 Same 4 2.7 1.50 Same 15 12.5 1.20 Same
Southside 2014 41 21.1 1.94 ^ Worse 0 3.1 0.00 **Better 63 60.9 1.03 Same
2015 16 22.6 0.71 Same 7 6.2 1.12 Same 44 47.0 0.94 Same
St Anthony 2014 0 1.9 0.00 Same 0 0.4 0.00 Same 7 10.8 0.65 Same
2015 0 1.6 0.00 Same 1 1.1 0.92 Same 7 5.9 1.18 Same
St Barnabas 2014 12 5.7 2.09 ^ Worse 2 2.8 0.72 Same 65 28.2 2.31 ^ Worse
2015 5 4.3 1.17 Same 12 5.7 2.11 ^ Worse 37 29.6 1.25 Same
St Catherine Siena 2014 3 5.8 0.51 Same 2 1.8 1.13 Same 71 51.6 1.37 Same
2015 5 5.6 0.90 Same 5 6.4 0.79 Same 49 46.3 1.06 Same
St Charles Hospital 2014 10 5.9 1.70 Same 3 2.1 1.44 Same 42 31.9 1.32 Same
2015 6 6.0 1.00 Same 6 4.5 1.34 Same 25 35.4 0.71 Same
St Elizabeth Medical 2014 11 13.3 0.83 Same 3 3.2 0.95 Same 61 41.3 1.48 ^ Worse
2015 8 11.4 0.70 Same 4 9.7 0.41 Same 51 34.7 1.47 Same
St Francis- Roslyn 2014 23 26.2 0.88 Same 8 8.2 0.98 Same 107 107.4 1.00 Same
2015 22 27.4 0.80 Same 14 19.4 0.72 Same 103 83.8 1.23 Same
St James Mercy 2014 1 1.1 0.89 Same 0 0.3 0.00 Same 1 2.5 0.41 Same
2015 Not calculated 0 0.3 0.00 Same 0 0.8 0.00 Same
(Continued)

24
Summary of Hospital-Acquired Infection Data, 2015 New York State (Page 14 of 16)
Surgical Site Infections (SSI) Central Line Associated Blood Stream
Infections (CLABSI) Hospital Onset Clostridium difficile
Infections (CDI)
Hospital Year Observed infections
Predicted infections Ratio
How does this hospital compare to
the state average?
Observed infections
Predicted infections Ratio
How does this hospital compare to
the state average?
Observed infections
Predicted infection Ratio
How does this hospital compare to
the state average?
St Johns Episcopal 2014 3 3.3 0.90 Same 2 2.0 1.00 Same 13 49.1 0.26 **Better
2015 5 2.6 1.92 Same 12 6.1 1.98 ^ Worse 13 24.6 0.53 Same
St Johns Riverside 2014 13 6.1 2.12 ^ Worse 2 1.1 1.89 Same 16 35.7 0.45 **Better
2015 8 4.7 1.71 Same 2 4.7 0.42 Same 23 17.3 1.33 Same
St Joseph -Bethpage 2014 4 4.0 1.00 Same 1 1.6 0.63 Same 39 39.4 0.99 Same
2015 8 3.2 2.50 ^ Worse 6 3.7 1.62 Same 33 27.7 1.19 Same
St Josephs- Elmira 2014 No Data No Data 4 4.8 0.83 Same
2015 No Data 0 0.3 0.00 Same 3 5.3 0.57 Same
St Josephs- Syracuse 2014 51 38.7 1.32 Same 15 9.7 1.55 Same 116 120.1 0.97 Same
2015 38 37.3 1.02 Same 41 31.6 1.30 Same 121 93.7 1.29 ^ Worse
St Josephs- Yonkers 2014 3 1.7 1.72 Same 1 0.8 1.20 Same 7 16.2 0.43 Same
2015 0 1.6 0.00 Same 2 2.5 0.81 Same 11 8.2 1.33 Same
St LukesNewburgh-Cor 2014 7 7.1 0.98 Same 0 0.9 0.00 Same 34 34.0 1.00 Same
2015 4 4.2 0.96 Same 1 3.5 0.29 Same 45 32.8 1.37 Same
St Marys Amsterdam 2014 2 3.3 0.60 Same 0 0.1 0.00 Same 6 14.1 0.42 Same
2015 1 2.2 0.45 Same 0 2.7 0.00 Same 9 12.3 0.73 Same
St Marys Troy 2014 3 2.3 1.30 Same 1 0.8 1.26 Same 1 7.5 0.13 **Better
2015 1 1.0 0.98 Same 3 2.3 1.28 Same 7 4.1 1.71 Same
St Peters Hospital 2014 49 51.6 0.95 Same 5 5.3 0.94 Same 61 92.7 0.66 **Better
2015 43 45.7 0.94 Same 21 32.1 0.66 Same 74 87.4 0.85 Same
Staten Island U N 2014 23 26.3 0.88 Same 8 7.7 1.04 Same 139 144.3 0.96 Same
2015 17 25.2 0.68 Same 9 19.4 0.46 **Better 117 120.8 0.97 Same
(Continued)

25
Summary of Hospital-Acquired Infection Data, 2015 New York State (Page 15 of 16)
Surgical Site Infections (SSI) Central Line Associated Blood Stream
Infections (CLABSI) Hospital Onset Clostridium difficile
Infections (CDI)
Hospital Year Observed infections
Predicted infections Ratio
How does this hospital compare to
the state average?
Observed infections
Predicted infections Ratio
How does this hospital compare to
the state average?
Observed infections
Predicted infection Ratio
How does this hospital compare to
the state average?
Strong Memorial 2014 37 38.0 0.97 Same 26 19.5 1.33 Same 247 220.9 1.12 Same
2015 29 33.7 0.86 Same 39 53.8 0.72 **Better 217 240.5 0.90 Same
Sunnyview Rehab Hosp 2014 No Data No Data 15 16.2 0.92 Same
2015 No Data 0 0.2 0.00 Same Not calculated
Syosset Hospital 2014 2 4.1 0.49 Same 0 0.5 0.00 Same 5 9.7 0.51 Same
2015 4 4.4 0.92 Same 1 1.2 0.85 Same 6 5.7 1.05 Same
TLC Lake Shore 2014 0 0.6 0.00 Same No Data 3 0.7 4.39 Same
2015 0 0.3 0.00 Same Not calculated 1 0.9 1.15 Same
UHS Chenango Memor 2014 0 1.3 0.00 Same 0 0.1 0.00 Same 0 3.6 0.00 Same
2015 4 1.0 3.83 ^ Worse 1 0.3 3.22 Same 2 2.4 0.82 Same
UHS Wilson/Bingh 2014 13 16.2 0.80 Same 3 3.6 0.83 Same 81 54.1 1.50 ^ Worse
2015 15 14.4 1.04 Same 9 13.0 0.69 Same 65 76.8 0.85 Same
United Memorial 2014 4 3.0 1.34 Same 0 0.4 0.00 Same 15 12.6 1.19 Same
2015 0 2.7 0.00 Same 0 1.0 0.00 Same 15 13.8 1.09 Same
Unity Hosp Rochester 2014 17 20.2 0.84 Same 4 3.3 1.23 Same 42 59.5 0.71 Same
2015 20 18.8 1.07 Same 6 14.6 0.41 **Better 29 51.6 0.56 **Better
Univ Hosp SUNY Upst 2014 8 16.6 0.48 **Better 5 13.0 0.39 **Better 113 107.3 1.05 Same
2015 22 12.9 1.70 ^ Worse 26 36.3 0.72 Same 94 89.6 1.05 Same
Univ Hosp StonyBrook 2014 27 39.6 0.68 **Better 10 10.8 0.93 Same 227 143.7 1.58 ^ Worse
2015 33 33.4 0.99 Same 22 27.2 0.81 Same 194 155.6 1.25 ^ Worse
Upst. Community Gen 2014 9 6.8 1.33 Same 1 0.9 1.13 Same 22 22.3 0.99 Same
2015 17 8.2 2.07 ^ Worse 0 2.7 0.00 Same 16 24.8 0.65 Same
Vassar Brothers 2014 8 23.1 0.35 **Better 8 4.0 2.00 Same 106 66.1 1.60 ^ Worse
2015 14 20.6 0.68 Same 9 15.2 0.59 Same 122 129.0 0.95 Same
(Continued)

26
Summary of Hospital-Acquired Infection Data, 2015 New York State (Page 16 of 16)
Surgical Site Infections (SSI) Central Line Associated Blood Stream
Infections (CLABSI) Hospital Onset Clostridium difficile
Infections (CDI)
Hospital Year Observed infections
Predicted infections Ratio
How does this hospital compare to
the state average?
Observed infections
Predicted infections Ratio
How does this hospital compare to
the state average?
Observed infections
Predicted infection Ratio
How does this hospital compare to
the state average?
Westchester Medical 2014 25 20.1 1.24 Same 23 18.5 1.24 Same 115 124.9 0.92 Same
2015 23 16.8 1.37 Same 34 41.5 0.82 Same 100 102.7 0.97 Same
White Plains Hosp 2014 14 12.2 1.15 Same 2 2.6 0.76 Same 42 62.1 0.68 **Better
2015 15 10.8 1.39 Same 12 12.3 0.97 Same 45 46.3 0.97 Same
Winthrop University 2014 27 36.6 0.74 Same 5 10.6 0.47 Same 173 140.5 1.23 ^ Worse
2015 37 30.8 1.20 Same 19 25.9 0.73 Same 129 119.6 1.08 Same
Woman and Childrens 2014 1 2.2 0.45 Same 10 4.9 2.04 Same 8 12.0 0.67 Same
2015 6 2.0 2.98 ^ Worse 14 9.2 1.53 Same Not calculated
Womans Christian 2014 3 4.7 0.64 Same 0 0.8 0.00 Same 17 17.5 0.97 Same
2015 0 3.5 0.00 **Better 0 3.8 0.00 **Better 22 18.4 1.19 Same
Woodhull Med Ctr 2014 6 4.7 1.28 Same 7 3.2 2.21 Same 51 34.1 1.50 ^ Worse
2015 1 3.1 0.32 Same 17 7.2 2.37 ^ Worse 33 37.0 0.89 Same
Wyckoff Heights 2014 6 5.9 1.01 Same 6 2.1 2.84 ^ Worse 23 39.0 0.59 **Better
2015 8 4.6 1.74 Same 14 7.0 2.00 ^ Worse 22 17.9 1.23 Same
Wyoming County Comm. 2014 0 1.0 0.00 Same Not calculated 0 3.9 0.00 Same
2015 1 1.1 0.93 Same 0 0.7 0.00 Same 0 2.2 0.00 Same
Each hospital’s 2015 data was compared to the NYS 2015 data. See Technical Report for details on risk adjustment methods. ** Significantly better than the NYS average. ^ Significantly worse than the NYS average. Same: not significantly different from the NYS average. No data: The hospital did not perform the procedures being monitored, or did not use any central lines. Not calculated: The hospital performed fewer than 20 procedures, used fewer than 50 central line days, or was a specialty hospital that was excluded from CDI risk adjustment.

27
Summary of hospital performance.
In 2015, 52 hospitals were flagged red for having an HAI rate significantly higher than the state average in one of the 21 indicators (i.e. colon SSI, CABG chest SSI, CABG donor SSI, hip SSI, hysterectomy SSI, overall SSI SIR, CLABSIs in eight types of ICUs and five types of wards, overall CLABSI SIR, and CDI). Hospital Infection Preventionists were required to submit improvement plans to NYSDOH to address each red flag. The details of the response and NYS involvement increase based on the number of consecutive years flagged high, following the NYSDOH HAI Reporting Program’s “Policy for Facilities with Consecutive Years of High HAI Rates” (http://www.health.ny.gov/statistics/facilities/hospital/hospital_acquired_infections/2015/docs/policy_repeat_high_hai_rates.pdf).
What should I do with this information? It’s important to understand that numbers alone won’t show how well a hospital is doing in preventing HAIs. This report shows how hospitals performed during a single year, 2015, based on a selected set of HAIs and with limited adjustment for differences between patient populations. Consumers should consult with doctors, healthcare facilities, health insurance carriers, and reputable healthcare websites before deciding where to receive care. Decisions regarding healthcare quality should not be based on these data alone.

28
Role of the State Health Department The NYSDOH collaborates with federal agencies, healthcare facilities, and the public with the common goal of reducing HAIs and antibiotic resistance. Some specific achievements in 2015 are listed below.
DOH continued to audit the hospitals to ensure that public reporting fairly reflects what is actually occurring in each hospital.
DOH continued to monitor the improvement plans of hospitals flagged with high HAI rates to encourage improvement and provide assistance as requested.
DOH continued leading a NYS CDI prevention collaborative. In 2015 DOH focused on improving communication of infection control information when patients are transferred between hospitals and nursing homes. Through use of webinar presentations, DOH educated participants on evidence-based infection prevention and control practices.
DOH visited facilities with high CRE rates, discussing a variety of topics including facility-wide CRE surveillance and prevention practices, barriers to implementation, antibiotic stewardship activities, and other strategies intended to reduce facility incidence rates.
DOH continued to provide grant funding to health care organizations to develop, implement, and evaluate strategies to reduce targeted HAIs.
DOH continued to act as a central resource for up-to-date, evidence-based information on HAI prevention, and DOH continued to assist facilities in responding to outbreaks.
Additional information on these topics is available in Part 2: Technical Report.

29
What Patients Can do to Prevent Infections
1. Keep hands clean. Be sure everyone cleans their hands before touching you. If you do not see your healthcare providers clean their hands before caring for you, don’t be shy about asking them to do so. Keep your own hands clean to avoid contaminating yourself.
2. Talk to you doctors about all your questions and concerns.
Clear communication is very important. Ask your doctor what specific steps he or she takes to prevent infections, as well as what you can do to help prevent infections.
3. Take antibiotics only if necessary and exactly as your doctor prescribes. Ask if tests will be done to make sure the right antibiotic is prescribed.
4. Know the signs and symptoms of infection so you can seek medical care quickly. Diarrhea while taking an antibiotic could be a sign of Clostridium difficile infection. Carefully follow your doctor’s instructions for post-operative care of your wounds. Watch for fever, as well as redness, pain, or discharge near a surgery or catheter site.
5. If you have a central line or urinary catheter, ask each day if it is necessary. Invasive devices provide a way for bacteria to enter the body. Carefully follow instructions for care of these devices when they are necessary.
Additional information on HAIs is available from CDC at http://www.cdc.gov/hai/.