Embed Size (px)
Citation preview
Horn of Africa Natural Hazard Probability and Risk Analysis Paul Bartel
Jordan Muller Humanitarian Information Unit
U.S. Department of State 28 June 2007
Executive Summary
The Horn of Africa (HOA), composed of Djibouti, Eritrea, Ethiopia, Kenya, and Somalia, suffers frequent natural disasters that commonly result in losses of life, destruction of infrastructure, and reduction of agricultural production. Formulating effective contingencies to respond to such emergencies is constrained by a limited understanding of the likelihood of a natural hazard occurring within a particular region and risks associated with that hazard. Robust early warning systems exist for national response and “hot spot” maps of risk have been produced at a global level; this level of resolution, however, is often not sufficient for sub-national resource distribution. This study presents the probabilities of natural hazards and the risk to populations or agricultural systems within the HOA, calculated on 1° by 1° grid cells. Such an analysis can provide a regional understanding of the probability of natural hazards as well as a more specific local characterization of the associated risks.
This study considers four types of natural hazards: droughts, floods, earthquakes and locust infestations. We recognize that these four natural hazards are not all of the natural hazards in the region, but they offer a good representation of several types of risk; including rapid onset versus slower onset hazards as well as those that primarily affect infrastructure versus those that primarily affect income and health. The analyses determine the annual probabilities from each hazard source individually and from drought, flooding, and locusts collectively (Seismic probabilities are not included in this combined probability analysis because damaging earthquakes occur an order of magnitude less frequently than the other hazard types). The resulting probability estimates for each hazard type are combined with measures of societal exposure to derive and map the risk associated with these four natural hazards. A full description of the probability and risk calculations are provided in an attached appendix.
Key questions: 1) What is the probability, or percent chance of occurrence, that a given natural disaster will develop in a
given area of the HOA in within a given year? 2) How exposed, or vulnerable, are different regions within the HOA to different types of hazard? 3) How do these hazards combine to describe the combined probability of natural hazard in any
particular area of the HOA? Key findings: Drought: Eastern and western Ethiopia and western Kenya are the areas most frequently affected by
severe drought, with a greater than 40% annual probability of moderate to severe drought during the rainy seasons.
Flooding: On the long-term average, the Shabeelle River floods once a year and the Juba, Awash, and Tana Rivers flood once every two years. The densely populated areas along these rivers in Ethiopia, Kenya and Somalia face the highest risk associated with flooding within the HOA.
Locust Infestation: Historical infestations are clustered in northern Eritrea and near the conjunction of Somalia, Ethiopia, and Djibouti, and the annual probability in these regions can exceed 30-40%. Over the past 15 years there have been 106 documented infestations, with 57% occurring in Eritrea, 26% in Ethiopia, and 17% in Somalia.
Seismic Activity: The largest earthquakes (greater than M 6.0) are most likely to occur along the Rift Valley regions of Djibouti, southern Eritrea and northeast Ethiopia; however, due to the relative
1
infrequency of large damaging earthquakes in the HOA, the risk from seismic hazard is not an annual concern like the other hazard types.
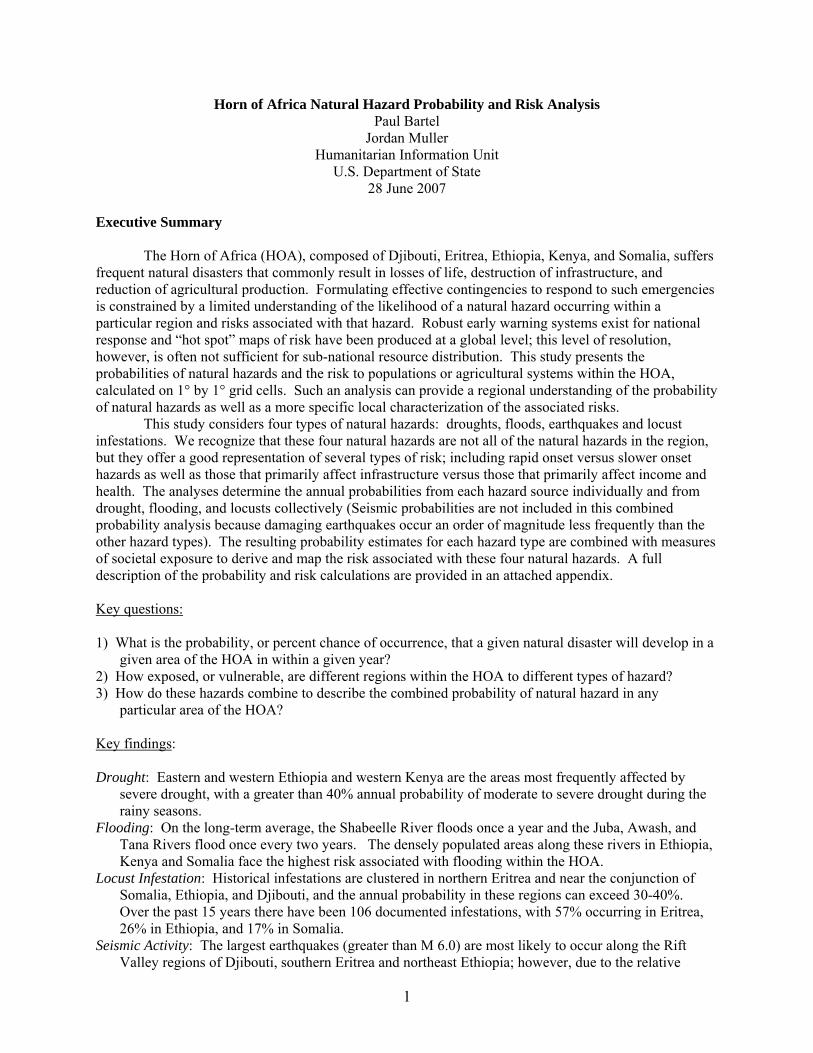
Combined Hazard: Calculations of joint probability of drought, flooding, and locust infestation suggest that most regions of the Horn could expect to receive a natural disaster on an annual to semi-annual basis with drought being the most probable over the most land area, followed by flooding.
2
Horn of Africa Natural Hazard Probability and Risk Analysis Paul Bartel
Jordan Muller Humanitarian Information Unit
U.S. Department of State 28 June 2007
Introduction
The Horn of Africa (HOA), composed of Djibouti, Eritrea, Ethiopia, Kenya, and Somalia, suffers frequent natural disasters that commonly result in losses of life, destruction of infrastructure, and reduction of agricultural production. The mitigation of complex humanitarian emergencies in the Horn of Africa (HOA) is aided by early warning systems (e.g. the Famine Early Warning System) that provide timely analyses of existing and forthcoming events that affect various forms of exposure for resident populations. However, formulating effective contingencies to respond to such warnings remains an ongoing problem. The Center for International Earth Science Information Network (CIESIN) has produced “hot spot” maps of risk at the global level, but the resolution is less useful at the regional or sub-continental level. To provide finer resolution, detailed risk maps have been developed for Somalia and Kenya; however, the other HOA countries lack coverage. This study presents the probabilities of natural hazards and the risk to populations or agricultural systems within the HOA, calculated on 1° by 1° grid cells. This level of resolution is much finer scale than other studies and uses data and calculations that are consistent across national boundaries.
Field personnel of the Office of Foreign Disaster Assistance (OFDA) within the U.S. Agency for International Development (USAID) expressed to an HIU field assessment team visiting in October to November, 2006 an interest in having access to a model that mapped risks to vulnerable populations. Such maps and analyses can also be of potential use to other USAID offices and bureaus, key NGO and US Government partners, and the UN Food and Agriculture Organization. This product reflects their needs by answering several analytical questions: 1) What is the probability, or percent chance of occurrence, that a given natural disaster will develop in a
given area of the HOA in within a given year? 2) How exposed, or vulnerable, are different regions within the HOA to different types of hazard? 3) How do these hazards combine to describe the combined probability of natural hazard in any
particular area of the HOA?
The primary goal is this analysis is to provide humanitarian aid decision-makers with a picture of the comparative and cumulative likelihood and risk of the different hazard types in the HOA countries. A secondary goal is to enable policy-makers to design mitigation programs on a regional, rather than a country-by-country, basis by demonstrating the value of regionally consistent data and analysis. We also hope that this product will demonstrate the necessity of collecting and reporting geospatial hazard and societal data at a resolution greater that 1° and encourage collectors in the field to establish consistent regional data reporting standards. Results Drought
Moderate to severe drought is defined, in this study, to have occurred in a given month when the average rainfall over a three-month period centered on that month is at least 1.5 standard deviations below the long-term monthly average rainfall. This approach compares the rainfall in a given month to the rainfall in that same month over the past 21 years. The calculation is performed independently for each grid cell, so the analysis should not be biased spatially or temporally. For example, 10 cm of rain in a
3
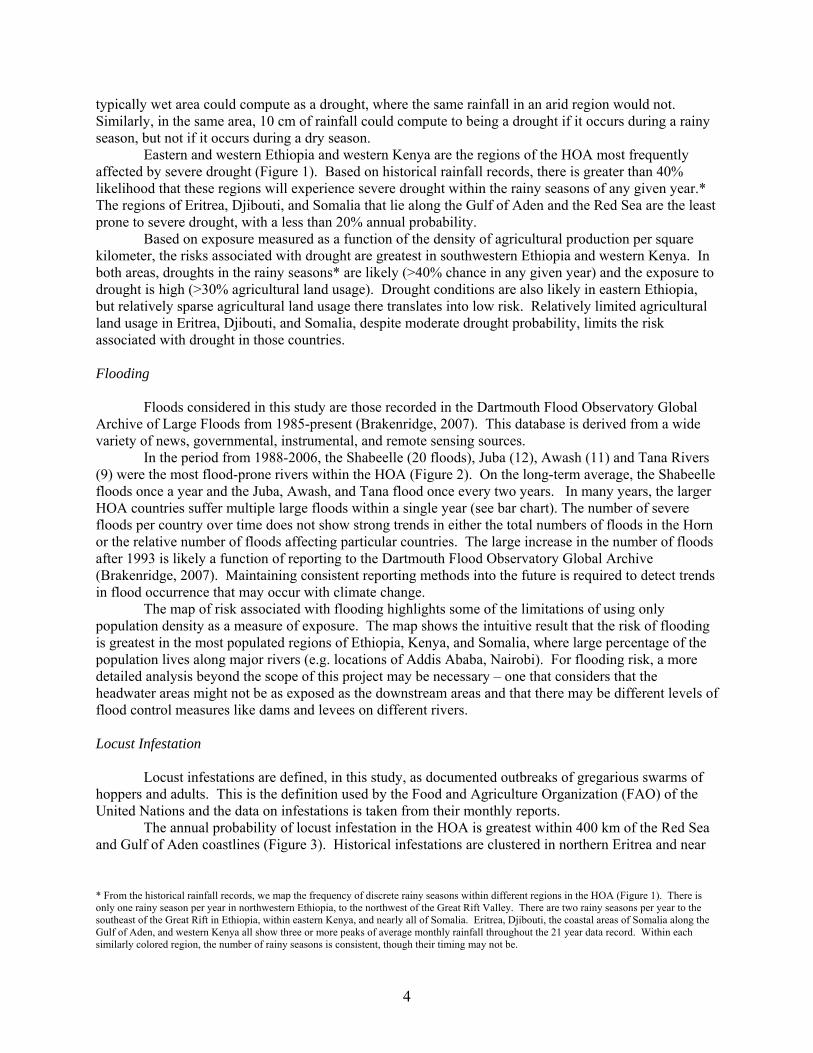
typically wet area could compute as a drought, where the same rainfall in an arid region would not. Similarly, in the same area, 10 cm of rainfall could compute to being a drought if it occurs during a rainy season, but not if it occurs during a dry season.
Eastern and western Ethiopia and western Kenya are the regions of the HOA most frequently affected by severe drought (Figure 1). Based on historical rainfall records, there is greater than 40% likelihood that these regions will experience severe drought within the rainy seasons of any given year.* The regions of Eritrea, Djibouti, and Somalia that lie along the Gulf of Aden and the Red Sea are the least prone to severe drought, with a less than 20% annual probability.
Based on exposure measured as a function of the density of agricultural production per square kilometer, the risks associated with drought are greatest in southwestern Ethiopia and western Kenya. In both areas, droughts in the rainy seasons* are likely (>40% chance in any given year) and the exposure to drought is high (>30% agricultural land usage). Drought conditions are also likely in eastern Ethiopia, but relatively sparse agricultural land usage there translates into low risk. Relatively limited agricultural land usage in Eritrea, Djibouti, and Somalia, despite moderate drought probability, limits the risk associated with drought in those countries. Flooding
Floods considered in this study are those recorded in the Dartmouth Flood Observatory Global Archive of Large Floods from 1985-present (Brakenridge, 2007). This database is derived from a wide variety of news, governmental, instrumental, and remote sensing sources.
In the period from 1988-2006, the Shabeelle (20 floods), Juba (12), Awash (11) and Tana Rivers (9) were the most flood-prone rivers within the HOA (Figure 2). On the long-term average, the Shabeelle floods once a year and the Juba, Awash, and Tana flood once every two years. In many years, the larger HOA countries suffer multiple large floods within a single year (see bar chart). The number of severe floods per country over time does not show strong trends in either the total numbers of floods in the Horn or the relative number of floods affecting particular countries. The large increase in the number of floods after 1993 is likely a function of reporting to the Dartmouth Flood Observatory Global Archive (Brakenridge, 2007). Maintaining consistent reporting methods into the future is required to detect trends in flood occurrence that may occur with climate change.
The map of risk associated with flooding highlights some of the limitations of using only population density as a measure of exposure. The map shows the intuitive result that the risk of flooding is greatest in the most populated regions of Ethiopia, Kenya, and Somalia, where large percentage of the population lives along major rivers (e.g. locations of Addis Ababa, Nairobi). For flooding risk, a more detailed analysis beyond the scope of this project may be necessary – one that considers that the headwater areas might not be as exposed as the downstream areas and that there may be different levels of flood control measures like dams and levees on different rivers. Locust Infestation
Locust infestations are defined, in this study, as documented outbreaks of gregarious swarms of hoppers and adults. This is the definition used by the Food and Agriculture Organization (FAO) of the United Nations and the data on infestations is taken from their monthly reports.
The annual probability of locust infestation in the HOA is greatest within 400 km of the Red Sea and Gulf of Aden coastlines (Figure 3). Historical infestations are clustered in northern Eritrea and near * From the historical rainfall records, we map the frequency of discrete rainy seasons within different regions in the HOA (Figure 1). There is only one rainy season per year in northwestern Ethiopia, to the northwest of the Great Rift Valley. There are two rainy seasons per year to the southeast of the Great Rift in Ethiopia, within eastern Kenya, and nearly all of Somalia. Eritrea, Djibouti, the coastal areas of Somalia along the Gulf of Aden, and western Kenya all show three or more peaks of average monthly rainfall throughout the 21 year data record. Within each similarly colored region, the number of rainy seasons is consistent, though their timing may not be.
4
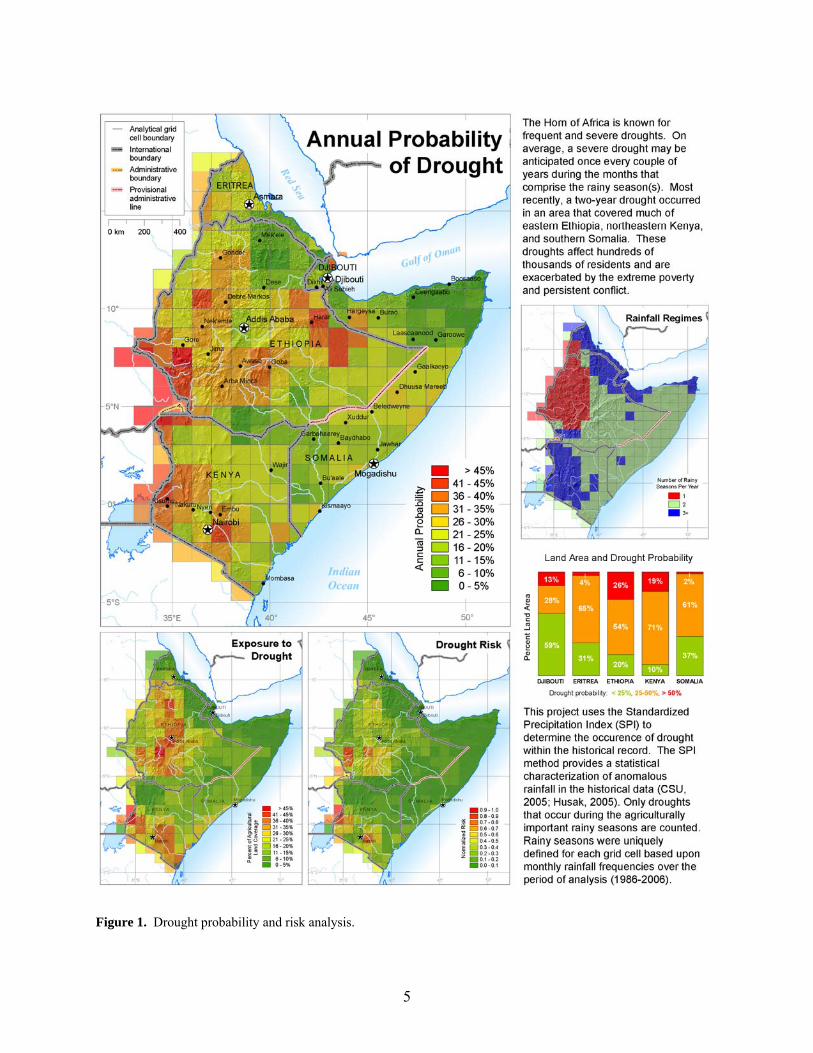
Figure 1. Drought probability and risk analysis.
5
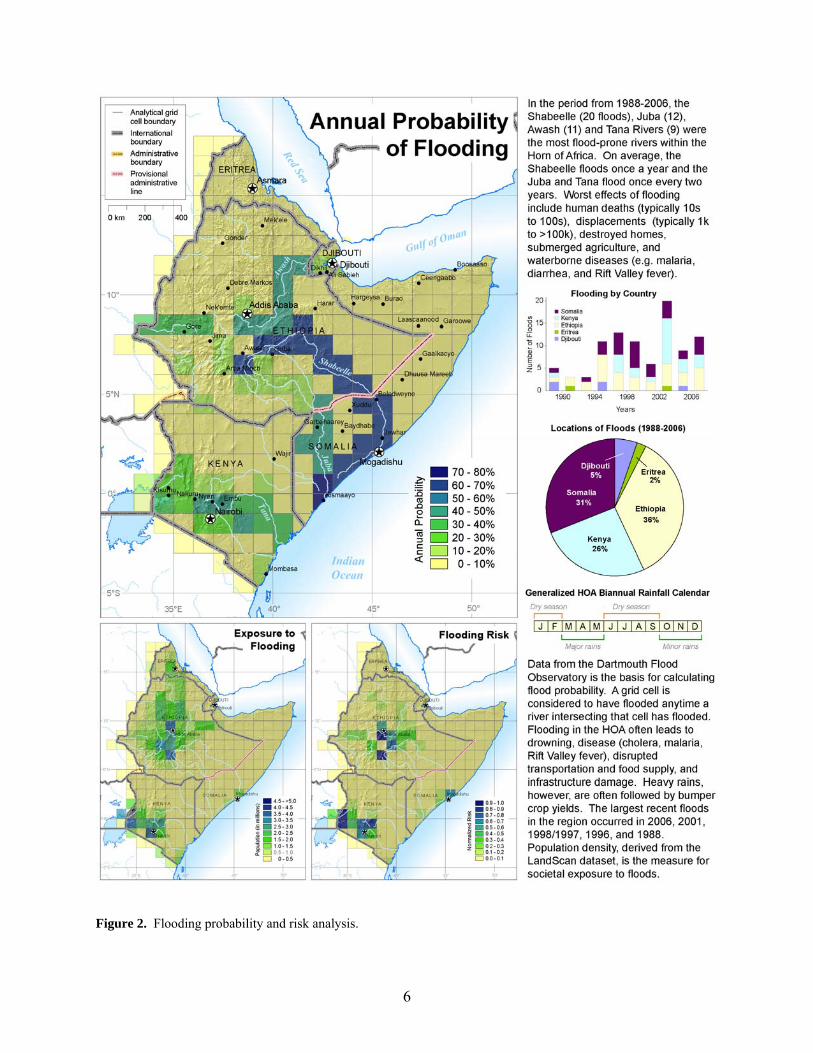
Figure 2. Flooding probability and risk analysis.
6
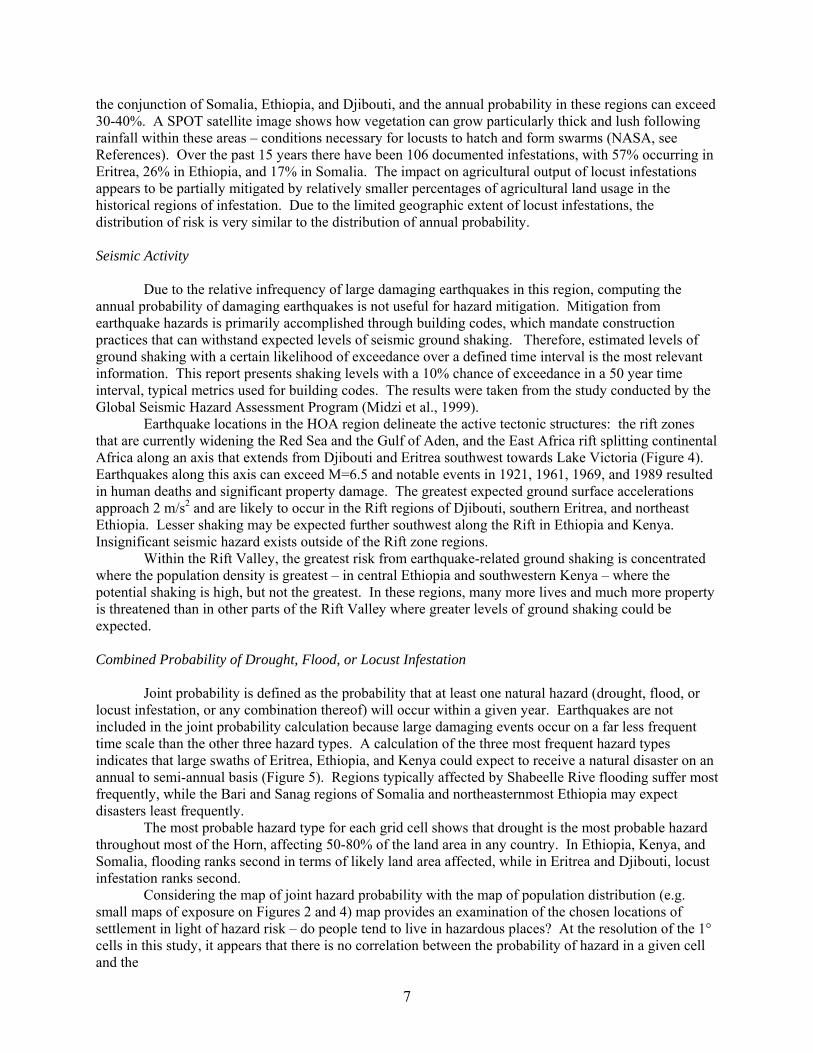
the conjunction of Somalia, Ethiopia, and Djibouti, and the annual probability in these regions can exceed 30-40%. A SPOT satellite image shows how vegetation can grow particularly thick and lush following rainfall within these areas – conditions necessary for locusts to hatch and form swarms (NASA, see References). Over the past 15 years there have been 106 documented infestations, with 57% occurring in Eritrea, 26% in Ethiopia, and 17% in Somalia. The impact on agricultural output of locust infestations appears to be partially mitigated by relatively smaller percentages of agricultural land usage in the historical regions of infestation. Due to the limited geographic extent of locust infestations, the distribution of risk is very similar to the distribution of annual probability. Seismic Activity
Due to the relative infrequency of large damaging earthquakes in this region, computing the annual probability of damaging earthquakes is not useful for hazard mitigation. Mitigation from earthquake hazards is primarily accomplished through building codes, which mandate construction practices that can withstand expected levels of seismic ground shaking. Therefore, estimated levels of ground shaking with a certain likelihood of exceedance over a defined time interval is the most relevant information. This report presents shaking levels with a 10% chance of exceedance in a 50 year time interval, typical metrics used for building codes. The results were taken from the study conducted by the Global Seismic Hazard Assessment Program (Midzi et al., 1999).
Earthquake locations in the HOA region delineate the active tectonic structures: the rift zones that are currently widening the Red Sea and the Gulf of Aden, and the East Africa rift splitting continental Africa along an axis that extends from Djibouti and Eritrea southwest towards Lake Victoria (Figure 4). Earthquakes along this axis can exceed M=6.5 and notable events in 1921, 1961, 1969, and 1989 resulted in human deaths and significant property damage. The greatest expected ground surface accelerations approach 2 m/s2 and are likely to occur in the Rift regions of Djibouti, southern Eritrea, and northeast Ethiopia. Lesser shaking may be expected further southwest along the Rift in Ethiopia and Kenya. Insignificant seismic hazard exists outside of the Rift zone regions.
Within the Rift Valley, the greatest risk from earthquake-related ground shaking is concentrated where the population density is greatest – in central Ethiopia and southwestern Kenya – where the potential shaking is high, but not the greatest. In these regions, many more lives and much more property is threatened than in other parts of the Rift Valley where greater levels of ground shaking could be expected. Combined Probability of Drought, Flood, or Locust Infestation
Joint probability is defined as the probability that at least one natural hazard (drought, flood, or locust infestation, or any combination thereof) will occur within a given year. Earthquakes are not included in the joint probability calculation because large damaging events occur on a far less frequent time scale than the other three hazard types. A calculation of the three most frequent hazard types indicates that large swaths of Eritrea, Ethiopia, and Kenya could expect to receive a natural disaster on an annual to semi-annual basis (Figure 5). Regions typically affected by Shabeelle Rive flooding suffer most frequently, while the Bari and Sanag regions of Somalia and northeasternmost Ethiopia may expect disasters least frequently.
The most probable hazard type for each grid cell shows that drought is the most probable hazard throughout most of the Horn, affecting 50-80% of the land area in any country. In Ethiopia, Kenya, and Somalia, flooding ranks second in terms of likely land area affected, while in Eritrea and Djibouti, locust infestation ranks second.
Considering the map of joint hazard probability with the map of population distribution (e.g. small maps of exposure on Figures 2 and 4) map provides an examination of the chosen locations of settlement in light of hazard risk – do people tend to live in hazardous places? At the resolution of the 1° cells in this study, it appears that there is no correlation between the probability of hazard in a given cell and the
7
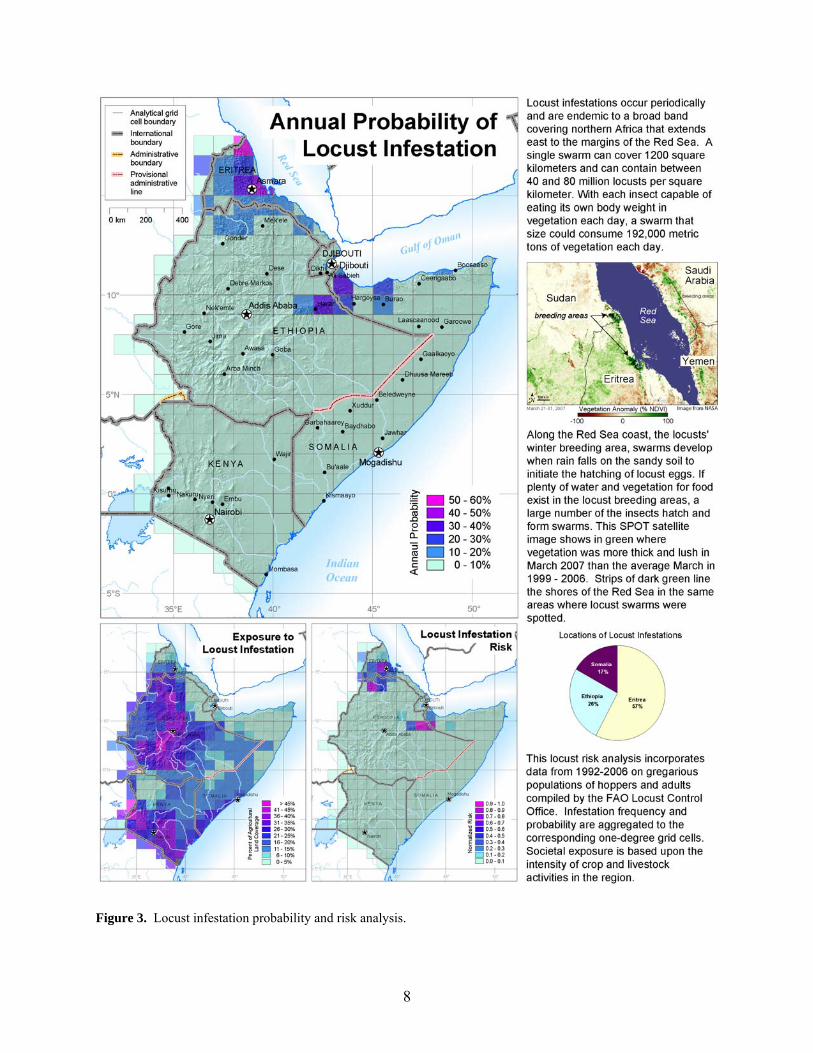
Figure 3. Locust infestation probability and risk analysis.
8
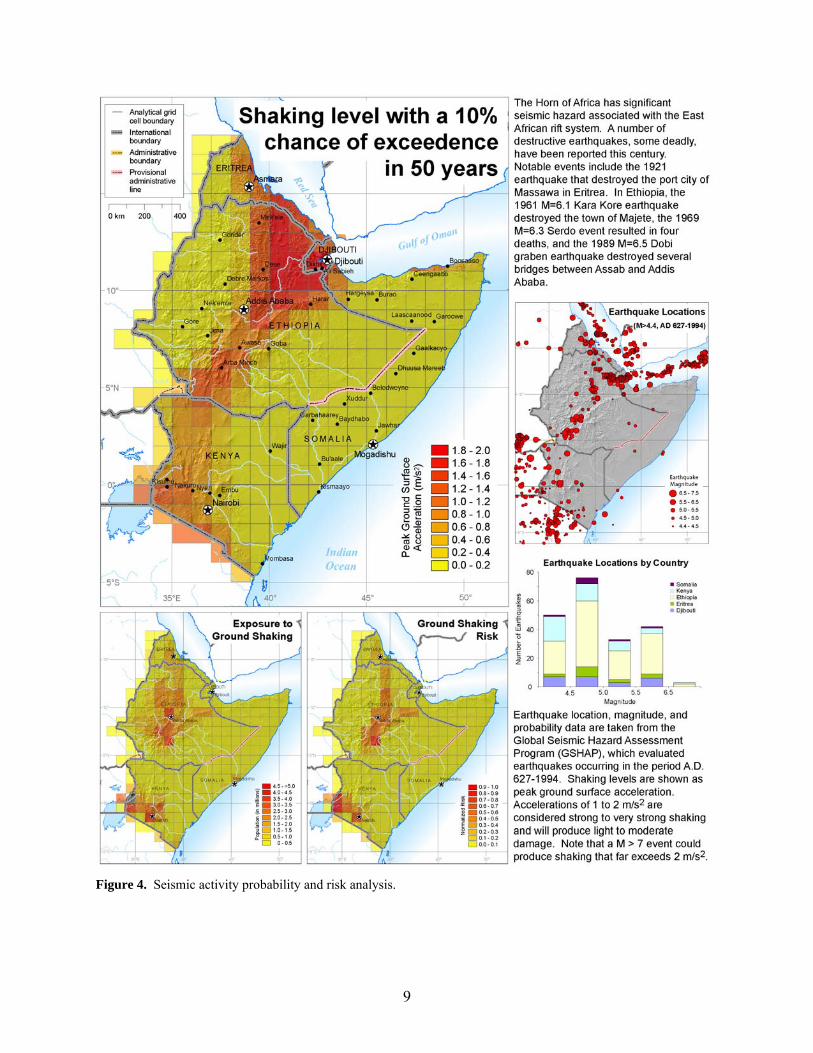
Figure 4. Seismic activity probability and risk analysis.
9
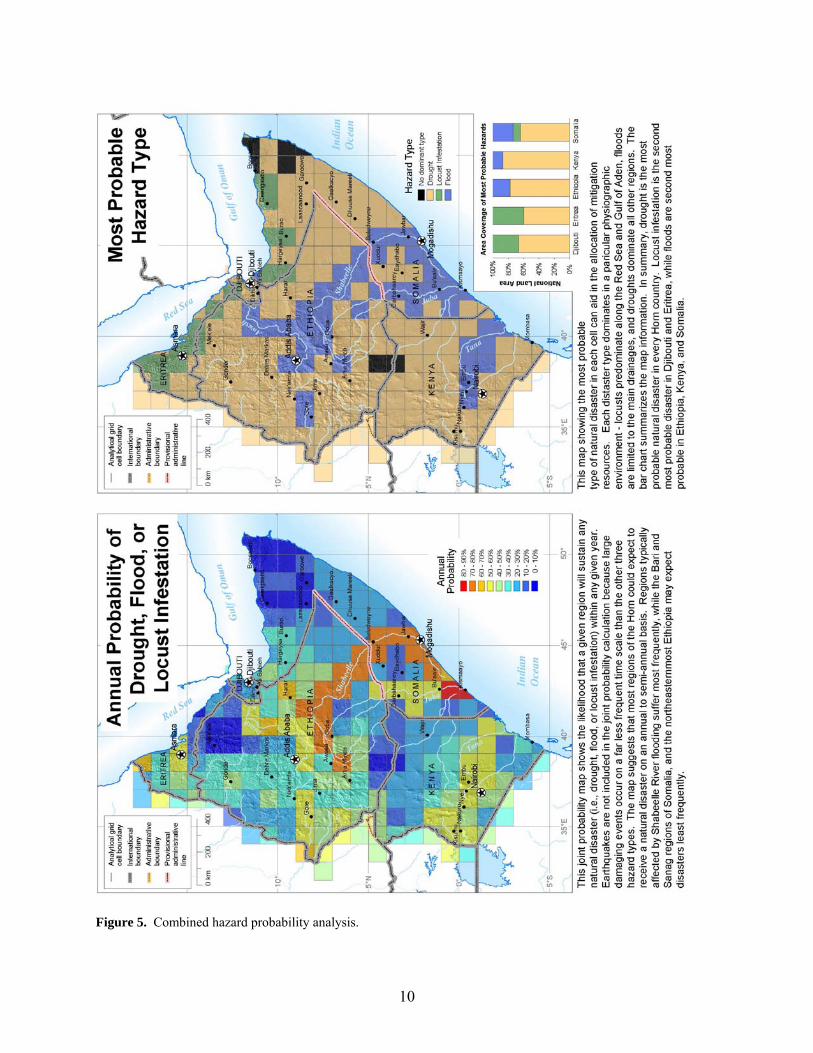
Figure 5. Combined hazard probability analysis.
10
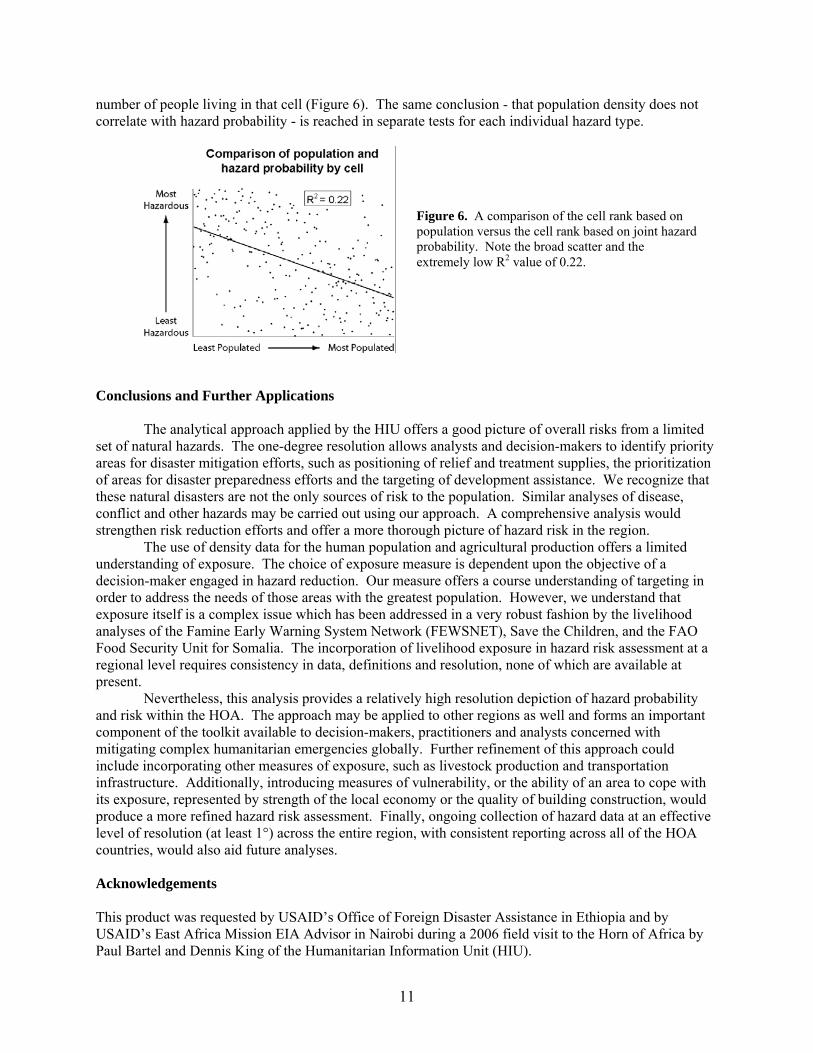
number of people living in that cell (Figure 6). The same conclusion - that population density does not correlate with hazard probability - is reached in separate tests for each individual hazard type.
Figure 6. A comparison of the cell rank based on population versus the cell rank based on joint hazard probability. Note the broad scatter and the extremely low R2 value of 0.22.
Conclusions and Further Applications The analytical approach applied by the HIU offers a good picture of overall risks from a limited set of natural hazards. The one-degree resolution allows analysts and decision-makers to identify priority areas for disaster mitigation efforts, such as positioning of relief and treatment supplies, the prioritization of areas for disaster preparedness efforts and the targeting of development assistance. We recognize that these natural disasters are not the only sources of risk to the population. Similar analyses of disease, conflict and other hazards may be carried out using our approach. A comprehensive analysis would strengthen risk reduction efforts and offer a more thorough picture of hazard risk in the region.
The use of density data for the human population and agricultural production offers a limited understanding of exposure. The choice of exposure measure is dependent upon the objective of a decision-maker engaged in hazard reduction. Our measure offers a course understanding of targeting in order to address the needs of those areas with the greatest population. However, we understand that exposure itself is a complex issue which has been addressed in a very robust fashion by the livelihood analyses of the Famine Early Warning System Network (FEWSNET), Save the Children, and the FAO Food Security Unit for Somalia. The incorporation of livelihood exposure in hazard risk assessment at a regional level requires consistency in data, definitions and resolution, none of which are available at present.
Nevertheless, this analysis provides a relatively high resolution depiction of hazard probability and risk within the HOA. The approach may be applied to other regions as well and forms an important component of the toolkit available to decision-makers, practitioners and analysts concerned with mitigating complex humanitarian emergencies globally. Further refinement of this approach could include incorporating other measures of exposure, such as livestock production and transportation infrastructure. Additionally, introducing measures of vulnerability, or the ability of an area to cope with its exposure, represented by strength of the local economy or the quality of building construction, would produce a more refined hazard risk assessment. Finally, ongoing collection of hazard data at an effective level of resolution (at least 1°) across the entire region, with consistent reporting across all of the HOA countries, would also aid future analyses. Acknowledgements This product was requested by USAID’s Office of Foreign Disaster Assistance in Ethiopia and by USAID’s East Africa Mission EIA Advisor in Nairobi during a 2006 field visit to the Horn of Africa by Paul Bartel and Dennis King of the Humanitarian Information Unit (HIU).
11
Bibliographic Resources: 1) Brakenridge, G.R., 2007, Global Active Archive of Large Flood Events, Dartmouth Flood
Observatory, Hanover, USA, digital media, http://www.dartmouth.edu/%7Efloods/ Archives/index.html.
2) Midzi, V., Hlatywayo, D. J., Chapola, L. S., Kebede, F., Atakan, K., Lombe, D. K., Turyomurugyendo, G., & Tugume, F. A., 1999. Seismic hazard assessment in Eastern and Southern Africa, Annali di Geofisica, GSHAP Special Volume.
3) USGS, 2006, Earthquake Rates and Probabilities in the United States: A PSHA Perspective. http://eqint.cr.usgs.gov/eq-men/html/Earthquake_Rates_and_Probability.html
4) Food and Agricultural Organization of the United Nations, Information available at http://www.fao.org/, Locust data available at http://www.fao.org/ag/locusts/en/mapper/index.html.
5) NOAA Climate Prediction Center, Information available at http://www.cpc.noaa.gov/, Precipitation data available at ftp://ftp.cpc.ncep.noaa.gov/fews/ RFE1.0_10day_archive/ dat_files/.
6) Anon., 2005, 3.0 Methodology-3.1 SPI Defined http://ccc.atmos.colostate.edu/pub/spi.pdf 7) Husak, 2005, Methods for the Statistical Evaluation of African Precipitation 8) Global Seismic Hazard Program, Information and data available at
http://www.seismo.ethz.ch/GSHAP/. 9) LandScanTM Global Population Database. Oak Ridge, TN: Oak Ridge National Laboratory. Available
at http://www.ornl.gov/landscan/ 10) Lipshutz, S., 1968, Theory and Problems of Probability, Schaum’s Outline Series, McGraw-Hill,
New York, 153 p. 11) NASA Earth Observatory, Information and imagery available at
http://earthobservatory.nasa.gov/Newsroom/NewImages/images.php3?img_id=17610 Author Contact Information: Paul Bartel [email protected] (202) 203-7787 Jordan Muller [email protected] (202) 203-7776
12

Appendix on Methodology Calculating Probabilities, Exposure, and Risk Calculating Probabilities of Hazards To calculate the probability of a particular hazard H, historical rates of hazard occurrences are converted into expected numbers of events within a given time span:
E[N(HI)] = λ(HI)*T, where E[N(HI)] is the expected number of events of hazard type I in time T given a historical mean rate of events λ. The expected number of events is converted into a probability of one or more events by the formula
P(1 or more events) = 1 – exp(-Σ E[N(HI)]), where the summation is over all events within a given region. This calculation assumes a Poissonian, or time-independent, distribution of probability. That is, its determination is independent of the timing and magnitude of the most recent events in the region (USGS, 2006).
Estimating Societal Exposure to Natural Hazards The societal exposure to natural hazards depends on several factors, including a) its temporal extent (immediate vs. long-term), b) its primary victim (agricultural production, animal husbandry, or human health), and c) its affected environment (urban vs. rural). For example, earthquake and flood events predominantly affect human populations, so population density (pop/km2) is the appropriate measure of exposure. In contrast, droughts and locust infestations primarily affect agricultural production systems, so crop-use intensity indices (CUI) are a proxy for exposure. Since the different measures of exposure have different physical units, the measures are normalized on a scale of 0 to 1, from their minimum to maximum value. The HIU has associated exposure with the relative density of population (in the cases of seismic and flood events) and production (in the cases of locust infestations and drought). We recognize that population density and crop use intensity are rather limited and coarse indicators of exposure. Our selection of these exposure criteria was largely due to their being available on a uniform region-wide basis. Note that density measures of exposure underestimate the overexposed risk posed to highly dispersed populations living in marginal areas. Accordingly, our use of density as an exposure measure should be considered in terms of its qualitative rather than quantitative value. Estimating Risk
The measure of risk R(H) is obtained by combining the probability P(H), or likelihood, of a hazard occurring with the societal exposure X(H) to that hazard. For each of the four hazard types, we compute within spatial grid cells the likelihood of a hazardous event occurring within a defined period of time. That hazard probability is then multiplied by exposure factors, which vary depending on the hazard type. R(H) = Probability of hazard occurring [P(H)] * Societal exposure to that hazard [X(H)] Spatial and Temporal Extent of Analysis
The calculations are based on 1° by 1° grid cells that are aligned with the integer latitude and longitude values and intersect or are included within the borders of Djibouti, Eritrea, Ethiopia, Kenya, and
13
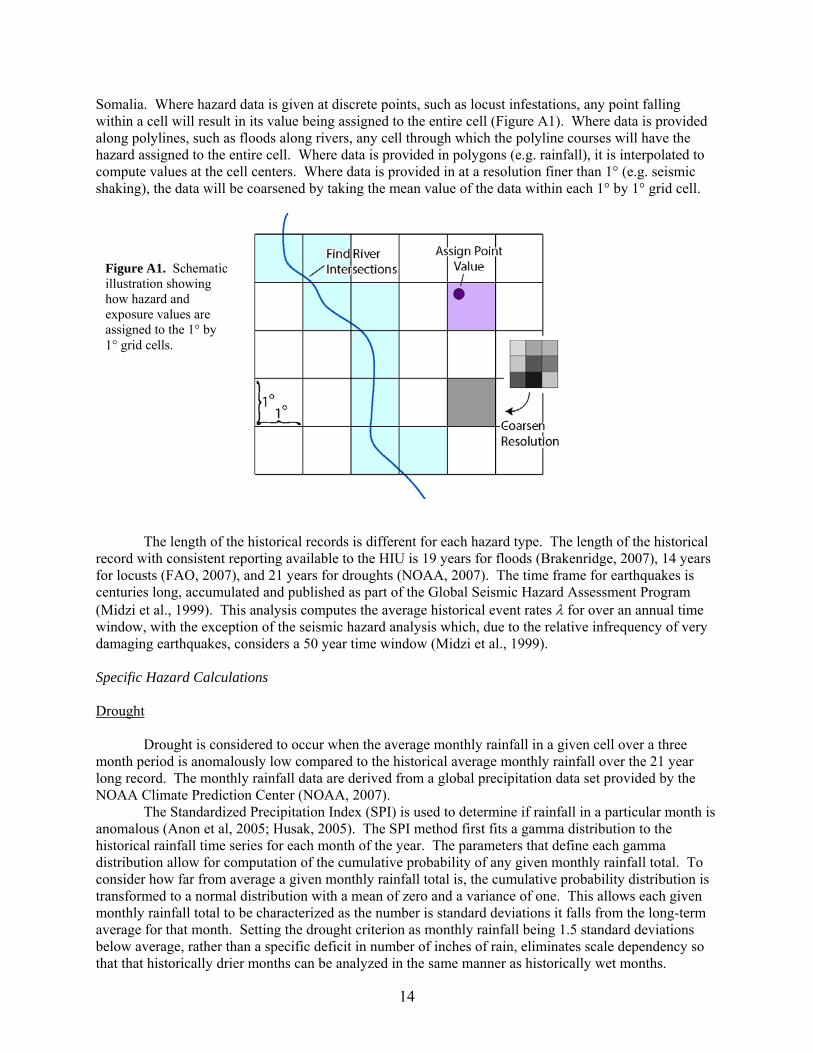
Somalia. Where hazard data is given at discrete points, such as locust infestations, any point falling within a cell will result in its value being assigned to the entire cell (Figure A1). Where data is provided along polylines, such as floods along rivers, any cell through which the polyline courses will have the hazard assigned to the entire cell. Where data is provided in polygons (e.g. rainfall), it is interpolated to compute values at the cell centers. Where data is provided in at a resolution finer than 1° (e.g. seismic shaking), the data will be coarsened by taking the mean value of the data within each 1° by 1° grid cell.
Figure A1. Schematic illustration showing how hazard and exposure values are assigned to the 1° by 1° grid cells.
The length of the historical records is different for each hazard type. The length of the historical record with consistent reporting available to the HIU is 19 years for floods (Brakenridge, 2007), 14 years for locusts (FAO, 2007), and 21 years for droughts (NOAA, 2007). The time frame for earthquakes is centuries long, accumulated and published as part of the Global Seismic Hazard Assessment Program (Midzi et al., 1999). This analysis computes the average historical event rates λ for over an annual time window, with the exception of the seismic hazard analysis which, due to the relative infrequency of very damaging earthquakes, considers a 50 year time window (Midzi et al., 1999). Specific Hazard Calculations Drought
Drought is considered to occur when the average monthly rainfall in a given cell over a three month period is anomalously low compared to the historical average monthly rainfall over the 21 year long record. The monthly rainfall data are derived from a global precipitation data set provided by the NOAA Climate Prediction Center (NOAA, 2007).
The Standardized Precipitation Index (SPI) is used to determine if rainfall in a particular month is anomalous (Anon et al, 2005; Husak, 2005). The SPI method first fits a gamma distribution to the historical rainfall time series for each month of the year. The parameters that define each gamma distribution allow for computation of the cumulative probability of any given monthly rainfall total. To consider how far from average a given monthly rainfall total is, the cumulative probability distribution is transformed to a normal distribution with a mean of zero and a variance of one. This allows each given monthly rainfall total to be characterized as the number is standard deviations it falls from the long-term average for that month. Setting the drought criterion as monthly rainfall being 1.5 standard deviations below average, rather than a specific deficit in number of inches of rain, eliminates scale dependency so that that historically drier months can be analyzed in the same manner as historically wet months.
14
In this study, droughts are only counted when they occur within the typical rainy seasons, because drought months outside of these periods are considered to not be critical to the important growing season(s). The number and timing of rainy seasons were uniquely defined for each grid cell based upon location of inflection points in a plot of average monthly rainfall. The probability and exposure calculation for drought is the same as that for locust infestation, with the exception that data record is 21 years long.
For the period 1986-2006, the mean annual rate of severe drought within a given grid cell is
λD = Number of infestations / 21 years.
For a time span of interest T of one year, the expected number of infestations in a given grid cell is:
E[N(HD)] = λD *T,
and the probability of a severe drought over any given year is
P(1 or droughts) = 1 – exp(-Σ E[N(HD)]).
The exposure to drought XD is a function of crop use intensity (CUI). To create an agricultural exposure index XCUI, we divide CUI /km2 for a given grid cell by its maximum value throughout the entire HOA region. XCUI then has normalized values 0 ≤ XCUI ≤ 1.
Risk for drought is the product of the hazard probability and the societal exposure
RL = P(HD)*XCUI,
and its normalized magnitude will range from 0 to 1.
Flooding For a flood on a given river, all 1° by 1° cells through which the river courses are considered to be affected by the flood. The Dartmouth Flood Observatory Global Archive of Large Flood Events database (see References) is the sources the historical flood information. The flood information in the database is derived from various news, governmental, instrumental, and remote sensing sources. For the period 1988-2006, the mean annual rate of floods within a given grid cell is
λF = Number of floods / 18 years.
For a time span of interest of one year, T = 1 year, the expected number of floods in a given grid cell is:
E[N(HF)] = λF *T,
and the probability of a flood over any given year is
P(1 or more floods) = 1 – exp(-Σ E[N(HF)]).
We use population density as the exposure measure for flood hazards. This study uses LANDSCAN data for population density (see References), which provides population estimates within 30” by 30” grid cells. Population density values are coarsened to the 1° by 1° resolution in this study by summing the total population of the 30” by 30” within each 1° by 1° cell. The normalized population in each grid cell
15
(normalized by the maximum population cell value within the entire HOA region) provides population exposure XPOP that ranges from 0 to 1.
Risk for flood hazard is subsequently defined as
RF = P(HF)*XPOP. Locust Infestation The data on locust infestation are derived from monthly reports from the Food and Agriculture Organization (FAO) of the United Nations (see References). For the period 1992-2006, the mean annual rate of locust infestations within a given grid cell is
λL = Number of infestations / 15 years.
For a time span of interest T of one year, the expected number of infestations in a given grid cell is:
E[N(HL)] = λL *T,
and the probability of a locust infestation over any given year is
P(1 or more infestations) = 1 – exp(-Σ E[N(HL)]).
As for the case of drought, we consider the exposure to locusts XL to be a function of crop use intensity (CUI). Risk for locust infestation is therefore
RL = P(HL)*XCUI. Seismic Activity
In a project lasting from 1992-1997, the Global Seismic Hazard Assessment Program (GSHAP, see References) conducted probabilistic seismic hazard studies on the tectonically active regions of the world, including East Africa. We use their results for probability of seismic hazard in East Africa, in the form of mapped distributions of probable ground shaking associated with recurring earthquakes (Midzi et al., 1999). They calculate the peak ground surface acceleration (PGA) with a 10% chance of exceedence in a 50 year time span. PGA measures the ground shaking that building structures are likely to be subject to, and is given in units of m/s2. According to the U.S. Geological Survey, PGA values greater than 1 m/s2, or 10% of gravitational acceleration, are considered sufficient to cause building damage. This study uses the geographical distribution of the PGA levels is a proxy for the seismic hazard probability. To define the seismic hazard in the same geospatial terms as the other hazard types, we take the GSHAP PGA values at the grid cell centers and apply that values to entire grid cell. This results in only minor coarsening of the original GSHAP calculations. The exposure to earthquakes would ideally be measured by population density and building construction quality, but this study was unable to find building construction information of sufficient detail to impact the study.
Risk for destruction due to seismic activity is therefore
RS = P(HS)*XPOP. Joint Probability of Drought, Flood, or Locust Infestation For three independent hazard types with annual probabilities P(HD), P(HF), P(HL), the probability of one or more of the hazard types occurring in a given year is given by
16
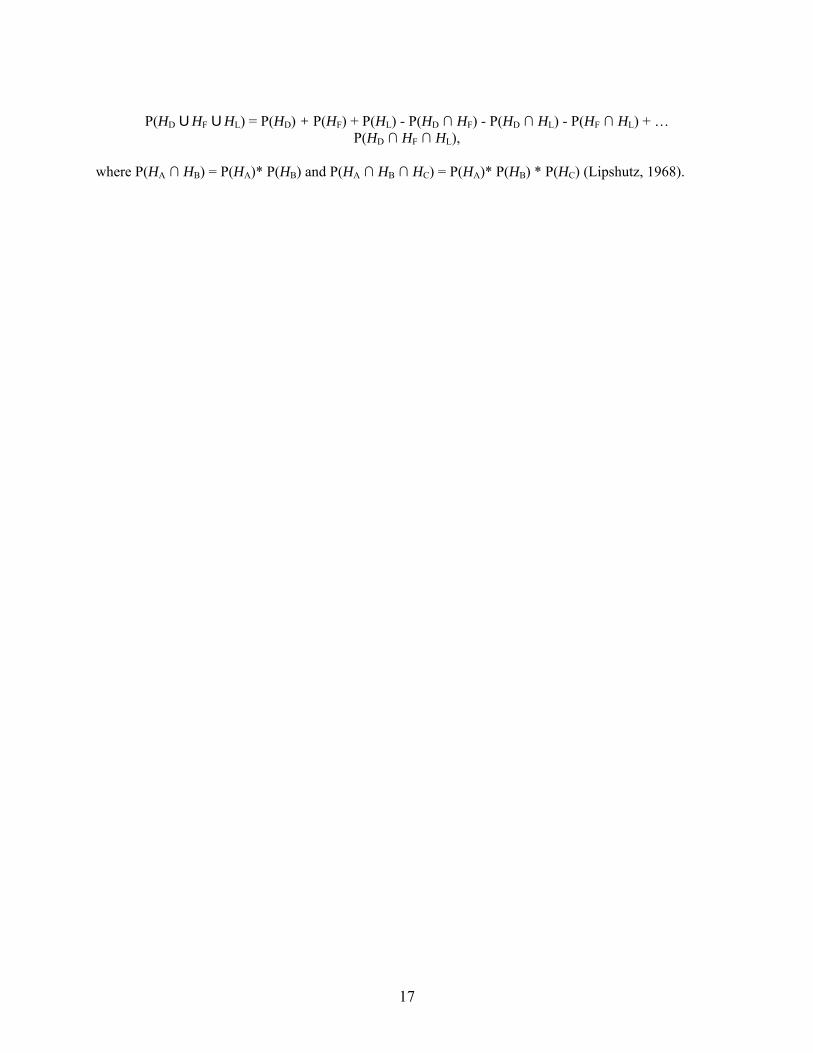
P(HD U HF U HL) = P(HD) + P(HF) + P(HL) - P(HD ∩ HF) - P(HD ∩ HL) - P(HF ∩ HL) + …
P(HD ∩ HF ∩ HL),
where P(HA ∩ HB) = P(HA)* P(HB) and P(HA ∩ HB ∩ HC) = P(HA)* P(HB) * P(HC) (Lipshutz, 1968).
17