Embed Size (px)
Citation preview
The reservoir fluids enter the completion through the sand screen filter and flow into the inflow control housing where the AICD is mounted. The fluids then travel through the AICD into the production stream to the surface together with the production from the rest of the screens. The size is interchangeable at the rig site if the calibration modelling using the actual log data acquired after drilling suggests that a different size than planned should be used.
Modelling the AICDTo model the flow performance of the AICD, a mathematical equation has been proposed to allow the simulation of AICD in reservoir simulators. The differential pressure across the AICD is expressed by the function f(ρ,μ)5:
Equation 1:
, x and y are user input strength parameters based on AICD size, q is the local volumetric mixture flow rate and the user inputs ρ_cal and μ_cal are original calibration density and viscosity referring to fresh water at 1000 kg/m3 and 1 cP. The ρ_mix and μ_mix are mixture density and viscosity at downhole conditions:
Equation 2:
Equation 3:
α is the fraction of fluid, and coefficients a, b, c, d, e, and f have been implemented to the mixture equation to aid better description of the mixture properties at multiphase conditions. A simplified approach for modelling is to set these values to 1. Voll et al. (2014) have described a workflow for generating field specific regression coefficients using linear and non-linear methods.7
Horizontal infill well with AICDs improves production in mature field – a case studyIIhami Giden, Michael Nirtl, Hans Thomas Maier, OMV Austria E&P GmbH;Ismarullizam Mohd Ismail, TendekaFirst Break, October 2019
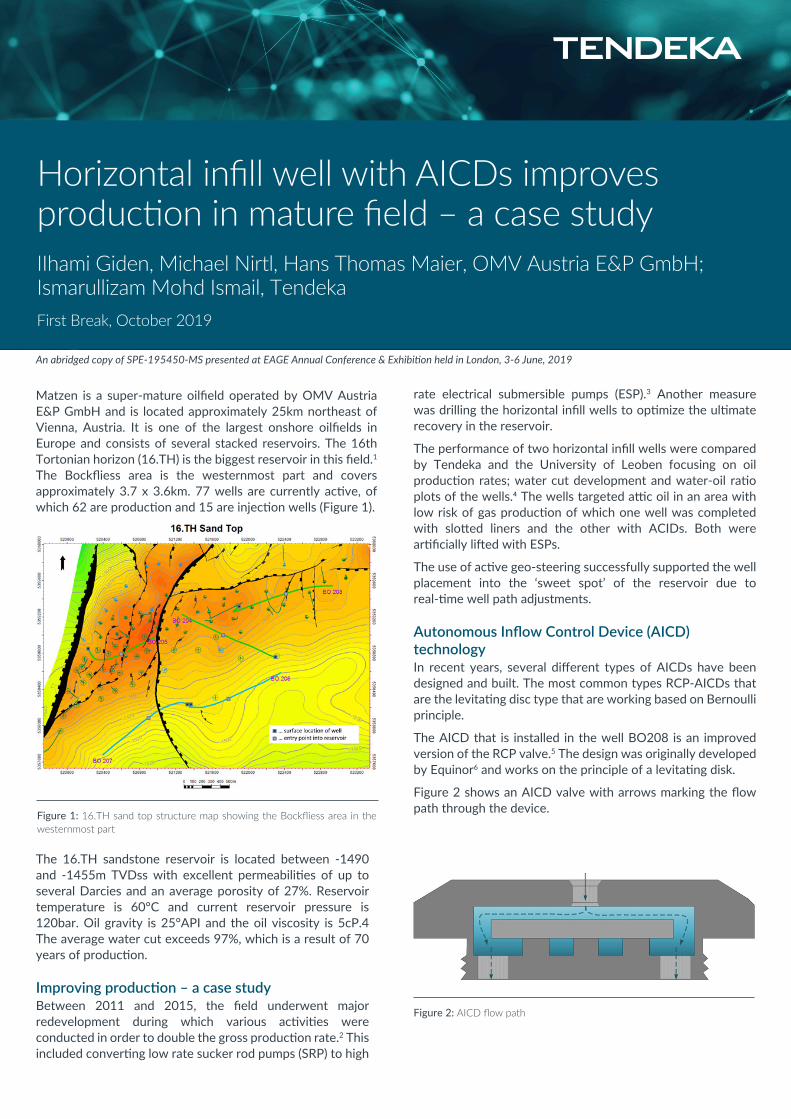
Matzen is a super-mature oilfield operated by OMV Austria E&P GmbH and is located approximately 25km northeast of Vienna, Austria. It is one of the largest onshore oilfields in Europe and consists of several stacked reservoirs. The 16th Tortonian horizon (16.TH) is the biggest reservoir in this field.1 The Bockfliess area is the westernmost part and covers approximately 3.7 x 3.6km. 77 wells are currently active, of which 62 are production and 15 are injection wells (Figure 1).
Figure 1: 16.TH sand top structure map showing the Bockfliess area in the westernmost part
The 16.TH sandstone reservoir is located between -1490 and -1455m TVDss with excellent permeabilities of up to several Darcies and an average porosity of 27%. Reservoir temperature is 60°C and current reservoir pressure is 120bar. Oil gravity is 25°API and the oil viscosity is 5cP.4 The average water cut exceeds 97%, which is a result of 70 years of production.
Improving production – a case studyBetween 2011 and 2015, the field underwent major redevelopment during which various activities were conducted in order to double the gross production rate.2 This included converting low rate sucker rod pumps (SRP) to high
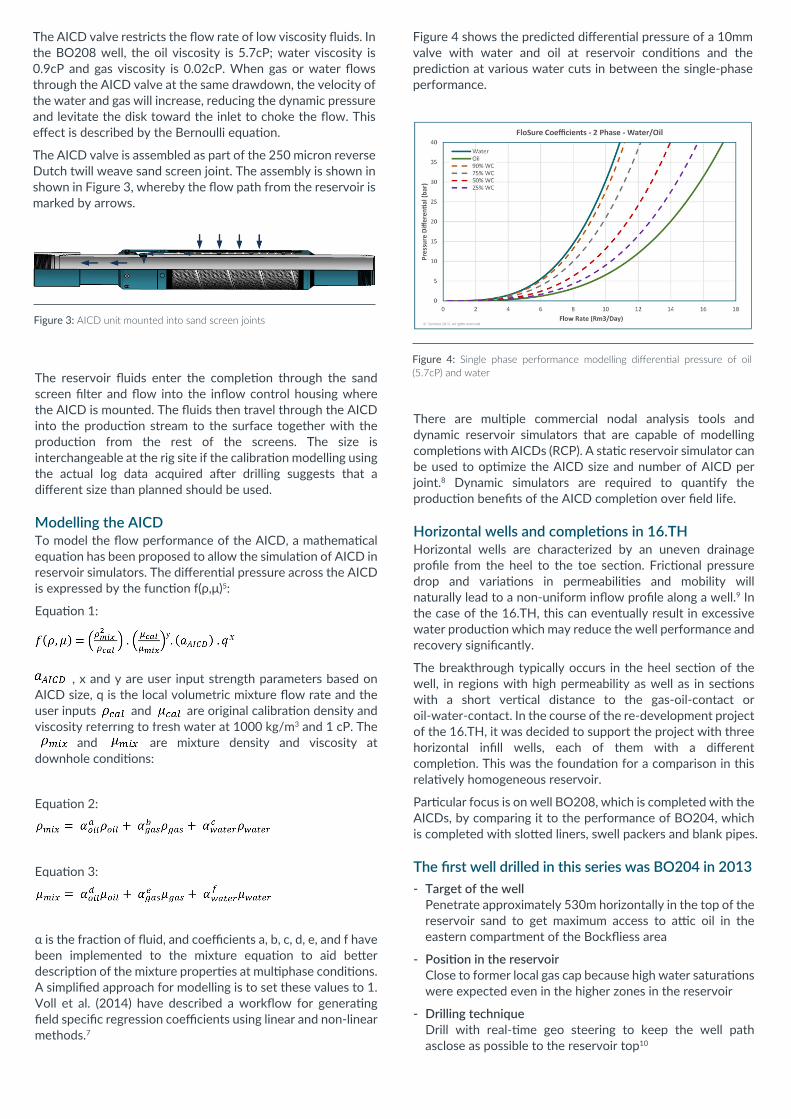
Figure 2: AICD flow path
An abridged copy of SPE-195450-MS presented at EAGE Annual Conference & Exhibition held in London, 3-6 June, 2019
rate electrical submersible pumps (ESP).3 Another measure was drilling the horizontal infill wells to optimize the ultimate recovery in the reservoir.
The performance of two horizontal infill wells were compared by Tendeka and the University of Leoben focusing on oil production rates; water cut development and water-oil ratio plots of the wells.4 The wells targeted attic oil in an area with low risk of gas production of which one well was completed with slotted liners and the other with ACIDs. Both were artificially lifted with ESPs.
The use of active geo-steering successfully supported the well placement into the ‘sweet spot’ of the reservoir due to real-time well path adjustments.
Autonomous Inflow Control Device (AICD) technologyIn recent years, several different types of AICDs have been designed and built. The most common types RCP-AICDs that are the levitating disc type that are working based on Bernoulli principle.
The AICD that is installed in the well BO208 is an improved version of the RCP valve.5 The design was originally developed by Equinor6 and works on the principle of a levitating disk.
Figure 2 shows an AICD valve with arrows marking the flow path through the device.
The AICD valve restricts the flow rate of low viscosity fluids. In the BO208 well, the oil viscosity is 5.7cP; water viscosity is 0.9cP and gas viscosity is 0.02cP. When gas or water flows through the AICD valve at the same drawdown, the velocity of the water and gas will increase, reducing the dynamic pressure and levitate the disk toward the inlet to choke the flow. This effect is described by the Bernoulli equation.
The AICD valve is assembled as part of the 250 micron reverse Dutch twill weave sand screen joint. The assembly is shown in shown in Figure 3, whereby the flow path from the reservoir is marked by arrows.
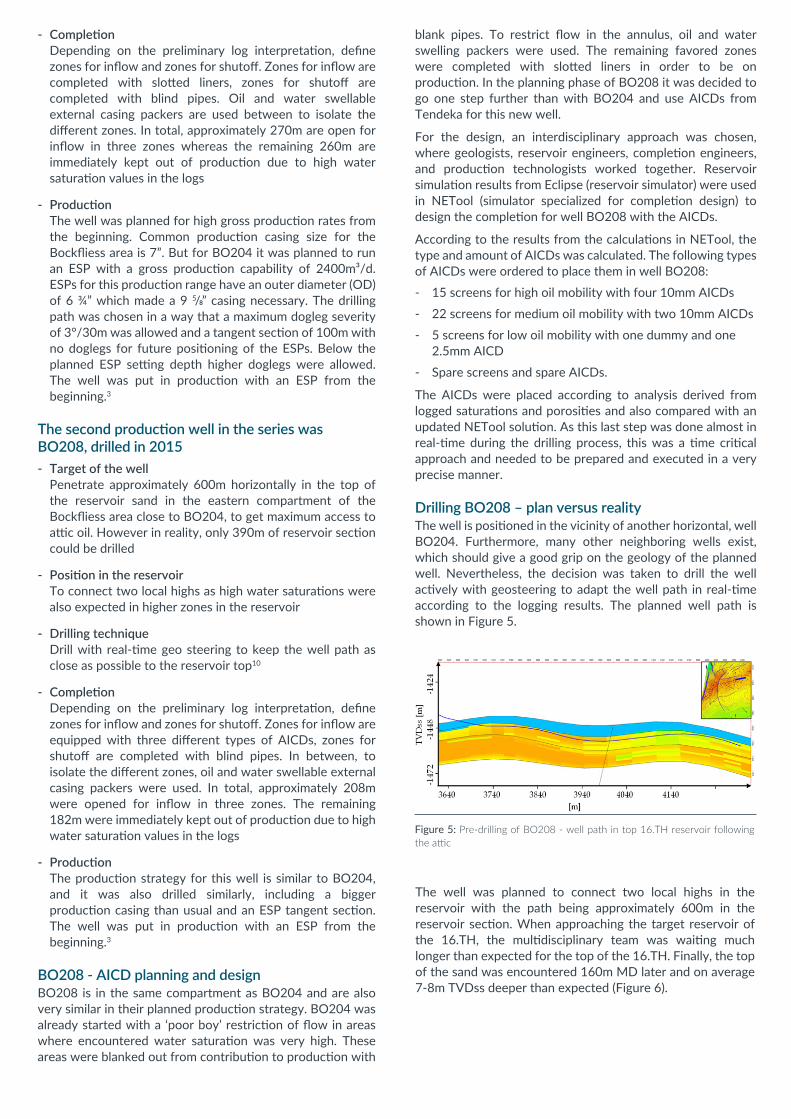
Figure 4 shows the predicted differential pressure of a 10mm valve with water and oil at reservoir conditions and the prediction at various water cuts in between the single-phase performance.
The reservoir fluids enter the completion through the sand screen filter and flow into the inflow control housing where the AICD is mounted. The fluids then travel through the AICD into the production stream to the surface together with the production from the rest of the screens. The size is interchangeable at the rig site if the calibration modelling using the actual log data acquired after drilling suggests that a different size than planned should be used.
Modelling the AICDTo model the flow performance of the AICD, a mathematical equation has been proposed to allow the simulation of AICD in reservoir simulators. The differential pressure across the AICD is expressed by the function f(ρ,μ)5:
Equation 1:
, x and y are user input strength parameters based on AICD size, q is the local volumetric mixture flow rate and the user inputs ρ_cal and μ_cal are original calibration density and viscosity referring to fresh water at 1000 kg/m3 and 1 cP. The ρ_mix and μ_mix are mixture density and viscosity at downhole conditions:
Equation 2:
Equation 3:
α is the fraction of fluid, and coefficients a, b, c, d, e, and f have been implemented to the mixture equation to aid better description of the mixture properties at multiphase conditions. A simplified approach for modelling is to set these values to 1. Voll et al. (2014) have described a workflow for generating field specific regression coefficients using linear and non-linear methods.7
Matzen is a super-mature oilfield operated by OMV Austria E&P GmbH and is located approximately 25km northeast of Vienna, Austria. It is one of the largest onshore oilfields in Europe and consists of several stacked reservoirs. The 16th Tortonian horizon (16.TH) is the biggest reservoir in this field.1 The Bockfliess area is the westernmost part and covers approximately 3.7 x 3.6km. 77 wells are currently active, of which 62 are production and 15 are injection wells (Figure 1).
The 16.TH sandstone reservoir is located between -1490 and -1455m TVDss with excellent permeabilities of up to several Darcies and an average porosity of 27%. Reservoir temperature is 60°C and current reservoir pressure is 120bar. Oil gravity is 25°API and the oil viscosity is 5cP.4 The average water cut exceeds 97%, which is a result of 70 years of production.
Improving production – a case studyBetween 2011 and 2015, the field underwent major redevelopment during which various activities were conducted in order to double the gross production rate.2 This included converting low rate sucker rod pumps (SRP) to high
Figure 3: AICD unit mounted into sand screen joints
rate electrical submersible pumps (ESP).3 Another measure was drilling the horizontal infill wells to optimize the ultimate recovery in the reservoir.
The performance of two horizontal infill wells were compared by Tendeka and the University of Leoben focusing on oil production rates; water cut development and water-oil ratio plots of the wells.4 The wells targeted attic oil in an area with low risk of gas production of which one well was completed with slotted liners and the other with ACIDs. Both were artificially lifted with ESPs.
The use of active geo-steering successfully supported the well placement into the ‘sweet spot’ of the reservoir due to real-time well path adjustments.
Autonomous Inflow Control Device (AICD) technologyIn recent years, several different types of AICDs have been designed and built. The most common types RCP-AICDs that are the levitating disc type that are working based on Bernoulli principle.
The AICD that is installed in the well BO208 is an improved version of the RCP valve.5 The design was originally developed by Equinor6 and works on the principle of a levitating disk.
Figure 2 shows an AICD valve with arrows marking the flow path through the device.
The AICD valve restricts the flow rate of low viscosity fluids. In the BO208 well, the oil viscosity is 5.7cP; water viscosity is 0.9cP and gas viscosity is 0.02cP. When gas or water flows through the AICD valve at the same drawdown, the velocity of the water and gas will increase, reducing the dynamic pressure and levitate the disk toward the inlet to choke the flow. This effect is described by the Bernoulli equation.
The AICD valve is assembled as part of the 250 micron reverse Dutch twill weave sand screen joint. The assembly is shown in shown in Figure 3, whereby the flow path from the reservoir is marked by arrows.
Figure 4 shows the predicted differential pressure of a 10mm valve with water and oil at reservoir conditions and the prediction at various water cuts in between the single-phase performance.
Figure 4: Single phase performance modelling differential pressure of oil (5.7cP) and water
There are multiple commercial nodal analysis tools and dynamic reservoir simulators that are capable of modelling completions with AICDs (RCP). A static reservoir simulator can be used to optimize the AICD size and number of AICD per joint.8 Dynamic simulators are required to quantify the production benefits of the AICD completion over field life.
Horizontal wells and completions in 16.THHorizontal wells are characterized by an uneven drainage profile from the heel to the toe section. Frictional pressure drop and variations in permeabilities and mobility will naturally lead to a non-uniform inflow profile along a well.9 In the case of the 16.TH, this can eventually result in excessive water production which may reduce the well performance and recovery significantly.
The breakthrough typically occurs in the heel section of the well, in regions with high permeability as well as in sections with a short vertical distance to the gas-oil-contact or oil-water-contact. In the course of the re-development project of the 16.TH, it was decided to support the project with three horizontal infill wells, each of them with a different completion. This was the foundation for a comparison in this relatively homogeneous reservoir.
Particular focus is on well BO208, which is completed with the AICDs, by comparing it to the performance of BO204, which is completed with slotted liners, swell packers and blank pipes.
The first well drilled in this series was BO204 in 2013- Target of the well Penetrate approximately 530m horizontally in the top of the
reservoir sand to get maximum access to attic oil in the eastern compartment of the Bockfliess area
- Position in the reservoir Close to former local gas cap because high water saturations
were expected even in the higher zones in the reservoir
- Drilling technique Drill with real-time geo steering to keep the well path
asclose as possible to the reservoir top10
- Completion Depending on the preliminary log interpretation, define
zones for inflow and zones for shutoff. Zones for inflow are completed with slotted liners, zones for shutoff are completed with blind pipes. Oil and water swellable external casing packers are used between to isolate the different zones. In total, approximately 270m are open for inflow in three zones whereas the remaining 260m are immediately kept out of production due to high water saturation values in the logs
- Production The well was planned for high gross production rates from
the beginning. Common production casing size for the Bockfliess area is 7”. But for BO204 it was planned to run an ESP with a gross production capability of 2400m³/d. ESPs for this production range have an outer diameter (OD) of 6 ¾” which made a 9 5/8” casing necessary. The drilling path was chosen in a way that a maximum dogleg severity of 3°/30m was allowed and a tangent section of 100m with no doglegs for future positioning of the ESPs. Below the planned ESP setting depth higher doglegs were allowed. The well was put in production with an ESP from the beginning.3
The second production well in the series was BO208, drilled in 2015- Target of the well Penetrate approximately 600m horizontally in the top of
the reservoir sand in the eastern compartment of the Bockfliess area close to BO204, to get maximum access to attic oil. However in reality, only 390m of reservoir section could be drilled
- Position in the reservoir To connect two local highs as high water saturations were
also expected in higher zones in the reservoir
- Drilling technique Drill with real-time geo steering to keep the well path as
close as possible to the reservoir top10
- Completion Depending on the preliminary log interpretation, define
zones for inflow and zones for shutoff. Zones for inflow are equipped with three different types of AICDs, zones for shutoff are completed with blind pipes. In between, to isolate the different zones, oil and water swellable external casing packers were used. In total, approximately 208m were opened for inflow in three zones. The remaining 182m were immediately kept out of production due to high water saturation values in the logs
- Production The production strategy for this well is similar to BO204,
and it was also drilled similarly, including a bigger production casing than usual and an ESP tangent section. The well was put in production with an ESP from the beginning.3
BO208 - AICD planning and designBO208 is in the same compartment as BO204 and are also very similar in their planned production strategy. BO204 was already started with a ‘poor boy’ restriction of flow in areas where encountered water saturation was very high. These areas were blanked out from contribution to production with
blank pipes. To restrict flow in the annulus, oil and water swelling packers were used. The remaining favored zones were completed with slotted liners in order to be on production. In the planning phase of BO208 it was decided to go one step further than with BO204 and use AICDs from Tendeka for this new well.
For the design, an interdisciplinary approach was chosen, where geologists, reservoir engineers, completion engineers, and production technologists worked together. Reservoir simulation results from Eclipse (reservoir simulator) were used in NETool (simulator specialized for completion design) to design the completion for well BO208 with the AICDs.
According to the results from the calculations in NETool, the type and amount of AICDs was calculated. The following types of AICDs were ordered to place them in well BO208:
- 15 screens for high oil mobility with four 10mm AICDs
- 22 screens for medium oil mobility with two 10mm AICDs
- 5 screens for low oil mobility with one dummy and one 2.5mm AICD
- Spare screens and spare AICDs.
The AICDs were placed according to analysis derived from logged saturations and porosities and also compared with an updated NETool solution. As this last step was done almost in real-time during the drilling process, this was a time critical approach and needed to be prepared and executed in a very precise manner.
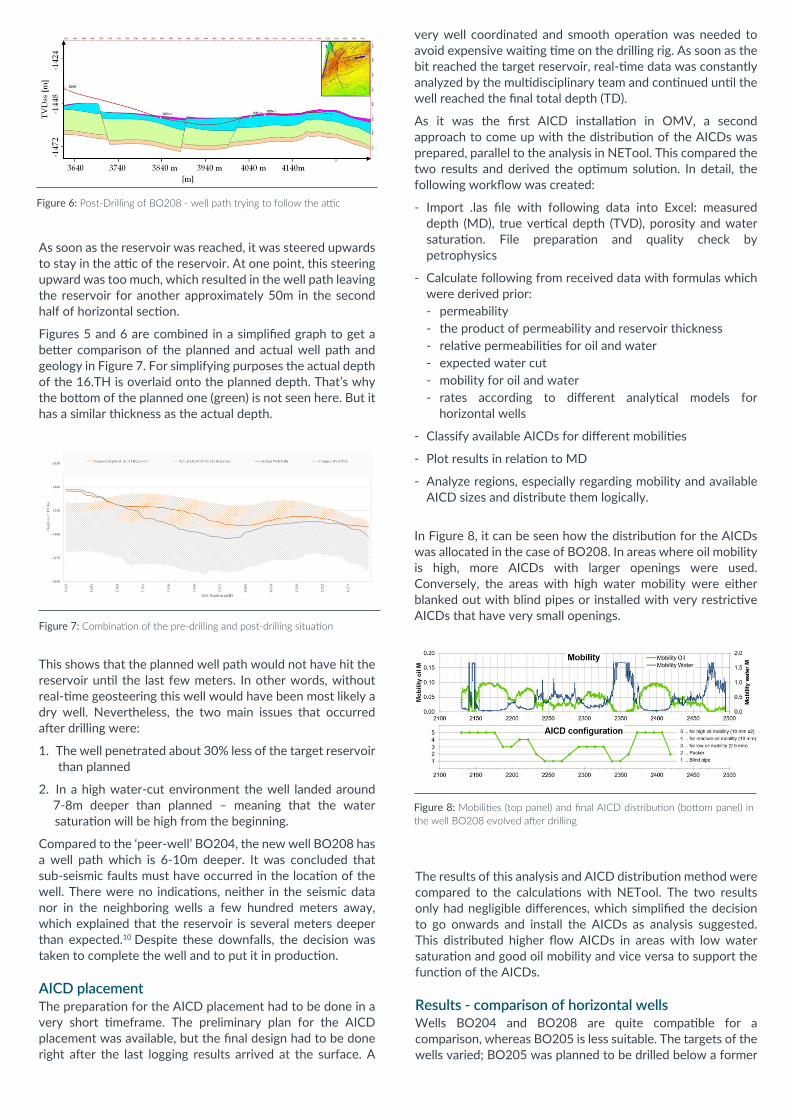
Drilling BO208 – plan versus realityThe well is positioned in the vicinity of another horizontal, well BO204. Furthermore, many other neighboring wells exist, which should give a good grip on the geology of the planned well. Nevertheless, the decision was taken to drill the well actively with geosteering to adapt the well path in real-time according to the logging results. The planned well path is shown in Figure 5.
The well was planned to connect two local highs in the reservoir with the path being approximately 600m in the reservoir section. When approaching the target reservoir of the 16.TH, the multidisciplinary team was waiting much longer than expected for the top of the 16.TH. Finally, the top of the sand was encountered 160m MD later and on average 7-8m TVDss deeper than expected (Figure 6).
As soon as the reservoir was reached, it was steered upwards to stay in the attic of the reservoir. At one point, this steering upward was too much, which resulted in the well path leaving the reservoir for another approximately 50m in the second half of horizontal section.
Figures 5 and 6 are combined in a simplified graph to get a better comparison of the planned and actual well path and geology in Figure 7. For simplifying purposes the actual depth of the 16.TH is overlaid onto the planned depth. That’s why the bottom of the planned one (green) is not seen here. But it has a similar thickness as the actual depth.
This shows that the planned well path would not have hit the reservoir until the last few meters. In other words, without real-time geosteering this well would have been most likely a dry well. Nevertheless, the two main issues that occurred after drilling were:
1. The well penetrated about 30% less of the target reservoir than planned
2. In a high water-cut environment the well landed around 7-8m deeper than planned – meaning that the water saturation will be high from the beginning.
Compared to the ‘peer-well’ BO204, the new well BO208 has a well path which is 6-10m deeper. It was concluded that sub-seismic faults must have occurred in the location of the well. There were no indications, neither in the seismic data nor in the neighboring wells a few hundred meters away, which explained that the reservoir is several meters deeper than expected.10 Despite these downfalls, the decision was taken to complete the well and to put it in production.
AICD placementThe preparation for the AICD placement had to be done in a very short timeframe. The preliminary plan for the AICD placement was available, but the final design had to be done right after the last logging results arrived at the surface. A
very well coordinated and smooth operation was needed to avoid expensive waiting time on the drilling rig. As soon as the bit reached the target reservoir, real-time data was constantly analyzed by the multidisciplinary team and continued until the well reached the final total depth (TD).
As it was the first AICD installation in OMV, a second approach to come up with the distribution of the AICDs was prepared, parallel to the analysis in NETool. This compared the two results and derived the optimum solution. In detail, the following workflow was created:
- Import .las file with following data into Excel: measured depth (MD), true vertical depth (TVD), porosity and water saturation. File preparation and quality check by petrophysics
- Calculate following from received data with formulas which were derived prior:
- permeability - the product of permeability and reservoir thickness - relative permeabilities for oil and water - expected water cut - mobility for oil and water - rates according to different analytical models for
horizontal wells
- Classify available AICDs for different mobilities
- Plot results in relation to MD
- Analyze regions, especially regarding mobility and available AICD sizes and distribute them logically.
In Figure 8, it can be seen how the distribution for the AICDs was allocated in the case of BO208. In areas where oil mobility is high, more AICDs with larger openings were used. Conversely, the areas with high water mobility were either blanked out with blind pipes or installed with very restrictive AICDs that have very small openings.
The results of this analysis and AICD distribution method were compared to the calculations with NETool. The two results only had negligible differences, which simplified the decision to go onwards and install the AICDs as analysis suggested. This distributed higher flow AICDs in areas with low water saturation and good oil mobility and vice versa to support the function of the AICDs.
Results - comparison of horizontal wellsWells BO204 and BO208 are quite compatible for a comparison, whereas BO205 is less suitable. The targets of the wells varied; BO205 was planned to be drilled below a former
gas cap in a different compartment to both BO204 and BO208, which are used to target attic oil at the top of the reservoir.
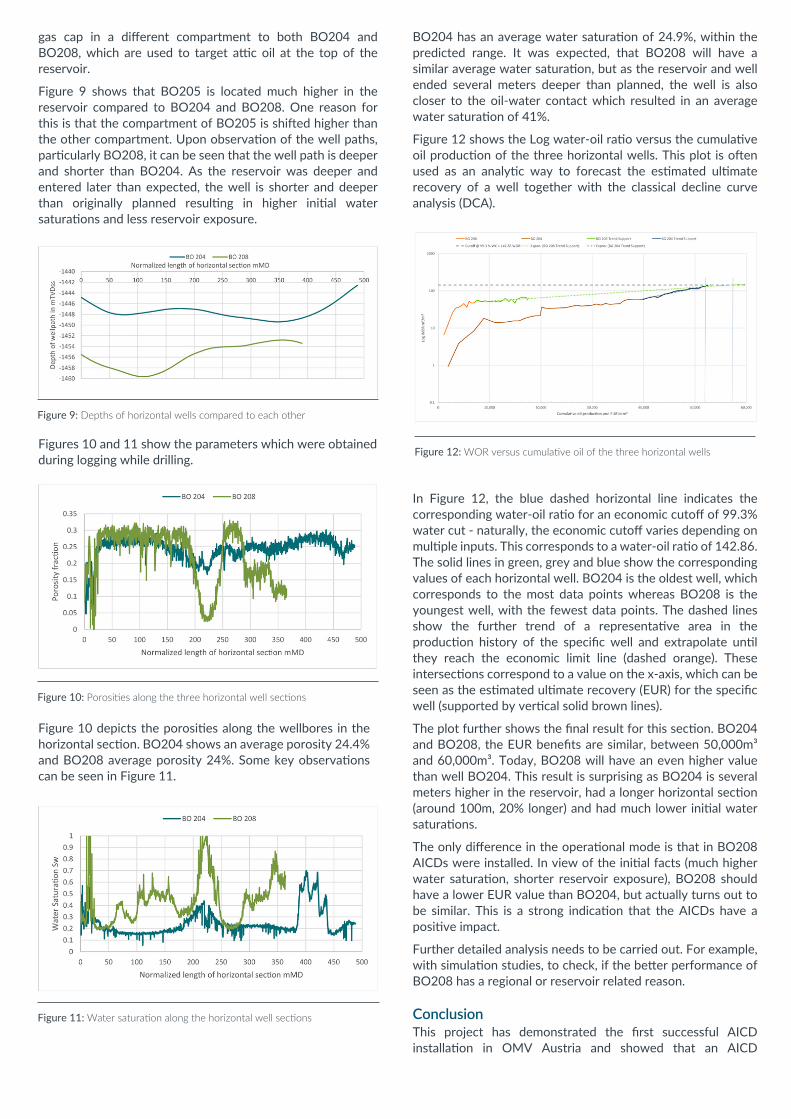
Figure 9 shows that BO205 is located much higher in the reservoir compared to BO204 and BO208. One reason for this is that the compartment of BO205 is shifted higher than the other compartment. Upon observation of the well paths, particularly BO208, it can be seen that the well path is deeper and shorter than BO204. As the reservoir was deeper and entered later than expected, the well is shorter and deeper than originally planned resulting in higher initial water saturations and less reservoir exposure.
Figures 10 and 11 show the parameters which were obtained during logging while drilling.
Figure 10 depicts the porosities along the wellbores in the horizontal section. BO204 shows an average porosity 24.4% and BO208 average porosity 24%. Some key observations can be seen in Figure 11.
BO204 has an average water saturation of 24.9%, within the predicted range. It was expected, that BO208 will have a similar average water saturation, but as the reservoir and well ended several meters deeper than planned, the well is also closer to the oil-water contact which resulted in an average water saturation of 41%.
Figure 12 shows the Log water-oil ratio versus the cumulative oil production of the three horizontal wells. This plot is often used as an analytic way to forecast the estimated ultimate recovery of a well together with the classical decline curve analysis (DCA).
In Figure 12, the blue dashed horizontal line indicates the corresponding water-oil ratio for an economic cutoff of 99.3% water cut - naturally, the economic cutoff varies depending on multiple inputs. This corresponds to a water-oil ratio of 142.86. The solid lines in green, grey and blue show the corresponding values of each horizontal well. BO204 is the oldest well, which corresponds to the most data points whereas BO208 is the youngest well, with the fewest data points. The dashed lines show the further trend of a representative area in the production history of the specific well and extrapolate until they reach the economic limit line (dashed orange). These intersections correspond to a value on the x-axis, which can be seen as the estimated ultimate recovery (EUR) for the specific well (supported by vertical solid brown lines).
The plot further shows the final result for this section. BO204 and BO208, the EUR benefits are similar, between 50,000m³ and 60,000m³. Today, BO208 will have an even higher value than well BO204. This result is surprising as BO204 is several meters higher in the reservoir, had a longer horizontal section (around 100m, 20% longer) and had much lower initial water saturations.
The only difference in the operational mode is that in BO208 AICDs were installed. In view of the initial facts (much higher water saturation, shorter reservoir exposure), BO208 should have a lower EUR value than BO204, but actually turns out to be similar. This is a strong indication that the AICDs have a positive impact.
Further detailed analysis needs to be carried out. For example, with simulation studies, to check, if the better performance of BO208 has a regional or reservoir related reason.
ConclusionThis project has demonstrated the first successful AICD installation in OMV Austria and showed that an AICD
installation improved the production performance of a well, which had to cope with geological uncertainties. Nonetheless, most likely due to the AICDs, the well is performing similar to a peer well.
An analytical approach which can support the placement of the AICDs was successfully demonstrated.
Further analysis of the performance of the AICDs needs to be done, for instance by using tracers. The tracers will show, from which part of the well the inflow is coming and confirm the function of the AICDs.
An economic evaluation to compare the performance of the horizontal wells with each other is also planned.
References1. Poellitzer, S., Gruenwalder, M., Kienberger, G., & Clemens, T. (2008). How to Optimise Oil Recovery after almost 60 Years of Production from the Matzen Field, Austria. SPE-113303-MS. Rome, Italy: Europec/EAGE Conference and Exhibition, 9-12 June.
2. Giden, I., Kometer, B., Toth, P., Geier, H., Florian, T., & Sieberer, M. (2016). Technology Driven Rejuvenation of a Mature Field by Doubling the Gross Production Rate. SPE-181892-MS. Dubai, UAE: SPE Annual Technical Conference and Exhibition, 26–28 September.
3. Giden, I., Kometer, B., Buerssner, P., & Lobianco, L. (2017). Re-Development of an Onshore Mature Oil Field to Double Gross Production by the use of Sensor-Equipped Electrical Submersible Pumps. SPE-185870-MS. Paris, France: SPE Europec featured at 79th EAGE Conference and Exhibition.
4. Kienberger, G., & Fuchs, R. (2006). Case History of the Matzen Field - Matzen Sand (16th TH): A Story of Success; Where is the End? SPE 100329. Vienna, Austria: SPE Annual Technical Conference and Exhibition, 12-15 June.
5. Halvorsen, M., Madsen, M., Mo, V., Mohd Ismail, I., & Green, A. (2016). Enhanced Oil Recovery On Troll Field By Implementing Autonomous Inflow Control Device. SPE-180037-MS. Bergen, Norway: SPE Bergen One Day Seminar.
6. Mathiesen, V., Werswick, B., Aakre, H., & Elseth, G. (2011). Autonomous Valve, A Game Changer Of Inflow Control In Horizontal Wells. SPE-145737-MS. Aberdeen, UK: Offshore Europe.
7. Voll, B. A., Mohd Ismail, I., & Oguche, I. (2014). Sustaining Production by Limiting Water Cut and Gas Break Through With Autonomous Inflow Control Technology. SPE-171149. Moscow, Russia: SPE Russian Oil and Gas Exploration & Production Technical Conference and Exhibition.
8. Ahmad, F., Al-Neaimi, A., Saif, O. Y., Channa, Z., Iwama, H., Sarsekov, A., . . . Abazeed, O. (2016). Rejuvenating a High GOR, Light Oil Reservoir Using AICD Completion Technology for Gas Control. SPE-183486-MS. Abu Dhabi, UAE: Abu Dhabi International Petroleum Exhibition & Conference.
9. Halvorsen, M., Elseth, G., & Naevdal, O. M. (2012). Increased oil production at Troll by autonomous inflow control with RCP valves. SPE-159634-MS. San Antonio, Texas, USA: SPE Annual Technical Conference and Exhibition.
10. Toth, P., Knezevic, R., Blanzano, A., Chinellato, F., Vergani, V., Gorshenina, O., & Dolan, J. (2016). Production Acceleration in a Key Reservoir by Proactive Well Placement, Utilizing Innovative Logging-While-Drilling (LWD) Technology in the Vienna Basin, Austria. SPE-180155-MS. Vienna, Austria: SPE Europec/EAGE Annual Conference and Exhibition, 30 May - 2 June.
There are multiple commercial nodal analysis tools and dynamic reservoir simulators that are capable of modelling completions with AICDs (RCP). A static reservoir simulator can be used to optimize the AICD size and number of AICD per joint.8 Dynamic simulators are required to quantify the production benefits of the AICD completion over field life.
Horizontal wells and completions in 16.THHorizontal wells are characterized by an uneven drainage profile from the heel to the toe section. Frictional pressure drop and variations in permeabilities and mobility will naturally lead to a non-uniform inflow profile along a well.9 In the case of the 16.TH, this can eventually result in excessive water production which may reduce the well performance and recovery significantly.
The breakthrough typically occurs in the heel section of the well, in regions with high permeability as well as in sections with a short vertical distance to the gas-oil-contact or oil-water-contact. In the course of the re-development project of the 16.TH, it was decided to support the project with three horizontal infill wells, each of them with a different completion. This was the foundation for a comparison in this relatively homogeneous reservoir.
Particular focus is on well BO208, which is completed with the AICDs, by comparing it to the performance of BO204, which is completed with slotted liners, swell packers and blank pipes.
The first well drilled in this series was BO204 in 2013- Target of the well Penetrate approximately 530m horizontally in the top of the
reservoir sand to get maximum access to attic oil in the eastern compartment of the Bockfliess area
- Position in the reservoir Close to former local gas cap because high water saturations
were expected even in the higher zones in the reservoir
- Drilling technique Drill with real-time geo steering to keep the well path
asclose as possible to the reservoir top10
- Completion Depending on the preliminary log interpretation, define
zones for inflow and zones for shutoff. Zones for inflow are completed with slotted liners, zones for shutoff are completed with blind pipes. Oil and water swellable external casing packers are used between to isolate the different zones. In total, approximately 270m are open for inflow in three zones whereas the remaining 260m are immediately kept out of production due to high water saturation values in the logs
- Production The well was planned for high gross production rates from
the beginning. Common production casing size for the Bockfliess area is 7”. But for BO204 it was planned to run an ESP with a gross production capability of 2400m³/d. ESPs for this production range have an outer diameter (OD) of 6 ¾” which made a 9 5/8” casing necessary. The drilling path was chosen in a way that a maximum dogleg severity of 3°/30m was allowed and a tangent section of 100m with no doglegs for future positioning of the ESPs. Below the planned ESP setting depth higher doglegs were allowed. The well was put in production with an ESP from the beginning.3
The second production well in the series was BO208, drilled in 2015- Target of the well Penetrate approximately 600m horizontally in the top of
the reservoir sand in the eastern compartment of the Bockfliess area close to BO204, to get maximum access to attic oil. However in reality, only 390m of reservoir section could be drilled
- Position in the reservoir To connect two local highs as high water saturations were
also expected in higher zones in the reservoir
- Drilling technique Drill with real-time geo steering to keep the well path as
close as possible to the reservoir top10
- Completion Depending on the preliminary log interpretation, define
zones for inflow and zones for shutoff. Zones for inflow are equipped with three different types of AICDs, zones for shutoff are completed with blind pipes. In between, to isolate the different zones, oil and water swellable external casing packers were used. In total, approximately 208m were opened for inflow in three zones. The remaining 182m were immediately kept out of production due to high water saturation values in the logs
- Production The production strategy for this well is similar to BO204,
and it was also drilled similarly, including a bigger production casing than usual and an ESP tangent section. The well was put in production with an ESP from the beginning.3
BO208 - AICD planning and designBO208 is in the same compartment as BO204 and are also very similar in their planned production strategy. BO204 was already started with a ‘poor boy’ restriction of flow in areas where encountered water saturation was very high. These areas were blanked out from contribution to production with
blank pipes. To restrict flow in the annulus, oil and water swelling packers were used. The remaining favored zones were completed with slotted liners in order to be on production. In the planning phase of BO208 it was decided to go one step further than with BO204 and use AICDs from Tendeka for this new well.
For the design, an interdisciplinary approach was chosen, where geologists, reservoir engineers, completion engineers, and production technologists worked together. Reservoir simulation results from Eclipse (reservoir simulator) were used in NETool (simulator specialized for completion design) to design the completion for well BO208 with the AICDs.
According to the results from the calculations in NETool, the type and amount of AICDs was calculated. The following types of AICDs were ordered to place them in well BO208:
- 15 screens for high oil mobility with four 10mm AICDs
- 22 screens for medium oil mobility with two 10mm AICDs
- 5 screens for low oil mobility with one dummy and one 2.5mm AICD
- Spare screens and spare AICDs.
The AICDs were placed according to analysis derived from logged saturations and porosities and also compared with an updated NETool solution. As this last step was done almost in real-time during the drilling process, this was a time critical approach and needed to be prepared and executed in a very precise manner.
Drilling BO208 – plan versus realityThe well is positioned in the vicinity of another horizontal, well BO204. Furthermore, many other neighboring wells exist, which should give a good grip on the geology of the planned well. Nevertheless, the decision was taken to drill the well actively with geosteering to adapt the well path in real-time according to the logging results. The planned well path is shown in Figure 5.
Figure 5: Pre-drilling of BO208 - well path in top 16.TH reservoir following the attic
The well was planned to connect two local highs in the reservoir with the path being approximately 600m in the reservoir section. When approaching the target reservoir of the 16.TH, the multidisciplinary team was waiting much longer than expected for the top of the 16.TH. Finally, the top of the sand was encountered 160m MD later and on average 7-8m TVDss deeper than expected (Figure 6).
As soon as the reservoir was reached, it was steered upwards to stay in the attic of the reservoir. At one point, this steering upward was too much, which resulted in the well path leaving the reservoir for another approximately 50m in the second half of horizontal section.
Figures 5 and 6 are combined in a simplified graph to get a better comparison of the planned and actual well path and geology in Figure 7. For simplifying purposes the actual depth of the 16.TH is overlaid onto the planned depth. That’s why the bottom of the planned one (green) is not seen here. But it has a similar thickness as the actual depth.
This shows that the planned well path would not have hit the reservoir until the last few meters. In other words, without real-time geosteering this well would have been most likely a dry well. Nevertheless, the two main issues that occurred after drilling were:
1. The well penetrated about 30% less of the target reservoir than planned
2. In a high water-cut environment the well landed around 7-8m deeper than planned – meaning that the water saturation will be high from the beginning.
Compared to the ‘peer-well’ BO204, the new well BO208 has a well path which is 6-10m deeper. It was concluded that sub-seismic faults must have occurred in the location of the well. There were no indications, neither in the seismic data nor in the neighboring wells a few hundred meters away, which explained that the reservoir is several meters deeper than expected.10 Despite these downfalls, the decision was taken to complete the well and to put it in production.
AICD placementThe preparation for the AICD placement had to be done in a very short timeframe. The preliminary plan for the AICD placement was available, but the final design had to be done right after the last logging results arrived at the surface. A
very well coordinated and smooth operation was needed to avoid expensive waiting time on the drilling rig. As soon as the bit reached the target reservoir, real-time data was constantly analyzed by the multidisciplinary team and continued until the well reached the final total depth (TD).
As it was the first AICD installation in OMV, a second approach to come up with the distribution of the AICDs was prepared, parallel to the analysis in NETool. This compared the two results and derived the optimum solution. In detail, the following workflow was created:
- Import .las file with following data into Excel: measured depth (MD), true vertical depth (TVD), porosity and water saturation. File preparation and quality check by petrophysics
- Calculate following from received data with formulas which were derived prior:
- permeability - the product of permeability and reservoir thickness - relative permeabilities for oil and water - expected water cut - mobility for oil and water - rates according to different analytical models for
horizontal wells
- Classify available AICDs for different mobilities
- Plot results in relation to MD
- Analyze regions, especially regarding mobility and available AICD sizes and distribute them logically.
In Figure 8, it can be seen how the distribution for the AICDs was allocated in the case of BO208. In areas where oil mobility is high, more AICDs with larger openings were used. Conversely, the areas with high water mobility were either blanked out with blind pipes or installed with very restrictive AICDs that have very small openings.
The results of this analysis and AICD distribution method were compared to the calculations with NETool. The two results only had negligible differences, which simplified the decision to go onwards and install the AICDs as analysis suggested. This distributed higher flow AICDs in areas with low water saturation and good oil mobility and vice versa to support the function of the AICDs.
Results - comparison of horizontal wellsWells BO204 and BO208 are quite compatible for a comparison, whereas BO205 is less suitable. The targets of the wells varied; BO205 was planned to be drilled below a former
gas cap in a different compartment to both BO204 and BO208, which are used to target attic oil at the top of the reservoir.
Figure 9 shows that BO205 is located much higher in the reservoir compared to BO204 and BO208. One reason for this is that the compartment of BO205 is shifted higher than the other compartment. Upon observation of the well paths, particularly BO208, it can be seen that the well path is deeper and shorter than BO204. As the reservoir was deeper and entered later than expected, the well is shorter and deeper than originally planned resulting in higher initial water saturations and less reservoir exposure.
Figures 10 and 11 show the parameters which were obtained during logging while drilling.
Figure 10 depicts the porosities along the wellbores in the horizontal section. BO204 shows an average porosity 24.4% and BO208 average porosity 24%. Some key observations can be seen in Figure 11.
BO204 has an average water saturation of 24.9%, within the predicted range. It was expected, that BO208 will have a similar average water saturation, but as the reservoir and well ended several meters deeper than planned, the well is also closer to the oil-water contact which resulted in an average water saturation of 41%.
Figure 12 shows the Log water-oil ratio versus the cumulative oil production of the three horizontal wells. This plot is often used as an analytic way to forecast the estimated ultimate recovery of a well together with the classical decline curve analysis (DCA).
In Figure 12, the blue dashed horizontal line indicates the corresponding water-oil ratio for an economic cutoff of 99.3% water cut - naturally, the economic cutoff varies depending on multiple inputs. This corresponds to a water-oil ratio of 142.86. The solid lines in green, grey and blue show the corresponding values of each horizontal well. BO204 is the oldest well, which corresponds to the most data points whereas BO208 is the youngest well, with the fewest data points. The dashed lines show the further trend of a representative area in the production history of the specific well and extrapolate until they reach the economic limit line (dashed orange). These intersections correspond to a value on the x-axis, which can be seen as the estimated ultimate recovery (EUR) for the specific well (supported by vertical solid brown lines).
The plot further shows the final result for this section. BO204 and BO208, the EUR benefits are similar, between 50,000m³ and 60,000m³. Today, BO208 will have an even higher value than well BO204. This result is surprising as BO204 is several meters higher in the reservoir, had a longer horizontal section (around 100m, 20% longer) and had much lower initial water saturations.
The only difference in the operational mode is that in BO208 AICDs were installed. In view of the initial facts (much higher water saturation, shorter reservoir exposure), BO208 should have a lower EUR value than BO204, but actually turns out to be similar. This is a strong indication that the AICDs have a positive impact.
Further detailed analysis needs to be carried out. For example, with simulation studies, to check, if the better performance of BO208 has a regional or reservoir related reason.
ConclusionThis project has demonstrated the first successful AICD installation in OMV Austria and showed that an AICD
installation improved the production performance of a well, which had to cope with geological uncertainties. Nonetheless, most likely due to the AICDs, the well is performing similar to a peer well.
An analytical approach which can support the placement of the AICDs was successfully demonstrated.
Further analysis of the performance of the AICDs needs to be done, for instance by using tracers. The tracers will show, from which part of the well the inflow is coming and confirm the function of the AICDs.
An economic evaluation to compare the performance of the horizontal wells with each other is also planned.
References1. Poellitzer, S., Gruenwalder, M., Kienberger, G., & Clemens, T. (2008). How to Optimise Oil Recovery after almost 60 Years of Production from the Matzen Field, Austria. SPE-113303-MS. Rome, Italy: Europec/EAGE Conference and Exhibition, 9-12 June.
2. Giden, I., Kometer, B., Toth, P., Geier, H., Florian, T., & Sieberer, M. (2016). Technology Driven Rejuvenation of a Mature Field by Doubling the Gross Production Rate. SPE-181892-MS. Dubai, UAE: SPE Annual Technical Conference and Exhibition, 26–28 September.
3. Giden, I., Kometer, B., Buerssner, P., & Lobianco, L. (2017). Re-Development of an Onshore Mature Oil Field to Double Gross Production by the use of Sensor-Equipped Electrical Submersible Pumps. SPE-185870-MS. Paris, France: SPE Europec featured at 79th EAGE Conference and Exhibition.
4. Kienberger, G., & Fuchs, R. (2006). Case History of the Matzen Field - Matzen Sand (16th TH): A Story of Success; Where is the End? SPE 100329. Vienna, Austria: SPE Annual Technical Conference and Exhibition, 12-15 June.
5. Halvorsen, M., Madsen, M., Mo, V., Mohd Ismail, I., & Green, A. (2016). Enhanced Oil Recovery On Troll Field By Implementing Autonomous Inflow Control Device. SPE-180037-MS. Bergen, Norway: SPE Bergen One Day Seminar.
6. Mathiesen, V., Werswick, B., Aakre, H., & Elseth, G. (2011). Autonomous Valve, A Game Changer Of Inflow Control In Horizontal Wells. SPE-145737-MS. Aberdeen, UK: Offshore Europe.
7. Voll, B. A., Mohd Ismail, I., & Oguche, I. (2014). Sustaining Production by Limiting Water Cut and Gas Break Through With Autonomous Inflow Control Technology. SPE-171149. Moscow, Russia: SPE Russian Oil and Gas Exploration & Production Technical Conference and Exhibition.
8. Ahmad, F., Al-Neaimi, A., Saif, O. Y., Channa, Z., Iwama, H., Sarsekov, A., . . . Abazeed, O. (2016). Rejuvenating a High GOR, Light Oil Reservoir Using AICD Completion Technology for Gas Control. SPE-183486-MS. Abu Dhabi, UAE: Abu Dhabi International Petroleum Exhibition & Conference.
9. Halvorsen, M., Elseth, G., & Naevdal, O. M. (2012). Increased oil production at Troll by autonomous inflow control with RCP valves. SPE-159634-MS. San Antonio, Texas, USA: SPE Annual Technical Conference and Exhibition.
10. Toth, P., Knezevic, R., Blanzano, A., Chinellato, F., Vergani, V., Gorshenina, O., & Dolan, J. (2016). Production Acceleration in a Key Reservoir by Proactive Well Placement, Utilizing Innovative Logging-While-Drilling (LWD) Technology in the Vienna Basin, Austria. SPE-180155-MS. Vienna, Austria: SPE Europec/EAGE Annual Conference and Exhibition, 30 May - 2 June.
There are multiple commercial nodal analysis tools and dynamic reservoir simulators that are capable of modelling completions with AICDs (RCP). A static reservoir simulator can be used to optimize the AICD size and number of AICD per joint.8 Dynamic simulators are required to quantify the production benefits of the AICD completion over field life.
Horizontal wells and completions in 16.THHorizontal wells are characterized by an uneven drainage profile from the heel to the toe section. Frictional pressure drop and variations in permeabilities and mobility will naturally lead to a non-uniform inflow profile along a well.9 In the case of the 16.TH, this can eventually result in excessive water production which may reduce the well performance and recovery significantly.
The breakthrough typically occurs in the heel section of the well, in regions with high permeability as well as in sections with a short vertical distance to the gas-oil-contact or oil-water-contact. In the course of the re-development project of the 16.TH, it was decided to support the project with three horizontal infill wells, each of them with a different completion. This was the foundation for a comparison in this relatively homogeneous reservoir.
Particular focus is on well BO208, which is completed with the AICDs, by comparing it to the performance of BO204, which is completed with slotted liners, swell packers and blank pipes.
The first well drilled in this series was BO204 in 2013- Target of the well Penetrate approximately 530m horizontally in the top of the
reservoir sand to get maximum access to attic oil in the eastern compartment of the Bockfliess area
- Position in the reservoir Close to former local gas cap because high water saturations
were expected even in the higher zones in the reservoir
- Drilling technique Drill with real-time geo steering to keep the well path
asclose as possible to the reservoir top10
- Completion Depending on the preliminary log interpretation, define
zones for inflow and zones for shutoff. Zones for inflow are completed with slotted liners, zones for shutoff are completed with blind pipes. Oil and water swellable external casing packers are used between to isolate the different zones. In total, approximately 270m are open for inflow in three zones whereas the remaining 260m are immediately kept out of production due to high water saturation values in the logs
- Production The well was planned for high gross production rates from
the beginning. Common production casing size for the Bockfliess area is 7”. But for BO204 it was planned to run an ESP with a gross production capability of 2400m³/d. ESPs for this production range have an outer diameter (OD) of 6 ¾” which made a 9 5/8” casing necessary. The drilling path was chosen in a way that a maximum dogleg severity of 3°/30m was allowed and a tangent section of 100m with no doglegs for future positioning of the ESPs. Below the planned ESP setting depth higher doglegs were allowed. The well was put in production with an ESP from the beginning.3
The second production well in the series was BO208, drilled in 2015- Target of the well Penetrate approximately 600m horizontally in the top of
the reservoir sand in the eastern compartment of the Bockfliess area close to BO204, to get maximum access to attic oil. However in reality, only 390m of reservoir section could be drilled
- Position in the reservoir To connect two local highs as high water saturations were
also expected in higher zones in the reservoir
- Drilling technique Drill with real-time geo steering to keep the well path as
close as possible to the reservoir top10
- Completion Depending on the preliminary log interpretation, define
zones for inflow and zones for shutoff. Zones for inflow are equipped with three different types of AICDs, zones for shutoff are completed with blind pipes. In between, to isolate the different zones, oil and water swellable external casing packers were used. In total, approximately 208m were opened for inflow in three zones. The remaining 182m were immediately kept out of production due to high water saturation values in the logs
- Production The production strategy for this well is similar to BO204,
and it was also drilled similarly, including a bigger production casing than usual and an ESP tangent section. The well was put in production with an ESP from the beginning.3
BO208 - AICD planning and designBO208 is in the same compartment as BO204 and are also very similar in their planned production strategy. BO204 was already started with a ‘poor boy’ restriction of flow in areas where encountered water saturation was very high. These areas were blanked out from contribution to production with
blank pipes. To restrict flow in the annulus, oil and water swelling packers were used. The remaining favored zones were completed with slotted liners in order to be on production. In the planning phase of BO208 it was decided to go one step further than with BO204 and use AICDs from Tendeka for this new well.
For the design, an interdisciplinary approach was chosen, where geologists, reservoir engineers, completion engineers, and production technologists worked together. Reservoir simulation results from Eclipse (reservoir simulator) were used in NETool (simulator specialized for completion design) to design the completion for well BO208 with the AICDs.
According to the results from the calculations in NETool, the type and amount of AICDs was calculated. The following types of AICDs were ordered to place them in well BO208:
- 15 screens for high oil mobility with four 10mm AICDs
- 22 screens for medium oil mobility with two 10mm AICDs
- 5 screens for low oil mobility with one dummy and one 2.5mm AICD
- Spare screens and spare AICDs.
The AICDs were placed according to analysis derived from logged saturations and porosities and also compared with an updated NETool solution. As this last step was done almost in real-time during the drilling process, this was a time critical approach and needed to be prepared and executed in a very precise manner.
Drilling BO208 – plan versus realityThe well is positioned in the vicinity of another horizontal, well BO204. Furthermore, many other neighboring wells exist, which should give a good grip on the geology of the planned well. Nevertheless, the decision was taken to drill the well actively with geosteering to adapt the well path in real-time according to the logging results. The planned well path is shown in Figure 5.
The well was planned to connect two local highs in the reservoir with the path being approximately 600m in the reservoir section. When approaching the target reservoir of the 16.TH, the multidisciplinary team was waiting much longer than expected for the top of the 16.TH. Finally, the top of the sand was encountered 160m MD later and on average 7-8m TVDss deeper than expected (Figure 6).
Figure 6: Post-Drilling of BO208 - well path trying to follow the attic
As soon as the reservoir was reached, it was steered upwards to stay in the attic of the reservoir. At one point, this steering upward was too much, which resulted in the well path leaving the reservoir for another approximately 50m in the second half of horizontal section.
Figures 5 and 6 are combined in a simplified graph to get a better comparison of the planned and actual well path and geology in Figure 7. For simplifying purposes the actual depth of the 16.TH is overlaid onto the planned depth. That’s why the bottom of the planned one (green) is not seen here. But it has a similar thickness as the actual depth.
Figure 7: Combination of the pre-drilling and post-drilling situation
This shows that the planned well path would not have hit the reservoir until the last few meters. In other words, without real-time geosteering this well would have been most likely a dry well. Nevertheless, the two main issues that occurred after drilling were:
1. The well penetrated about 30% less of the target reservoir than planned
2. In a high water-cut environment the well landed around 7-8m deeper than planned – meaning that the water saturation will be high from the beginning.
Compared to the ‘peer-well’ BO204, the new well BO208 has a well path which is 6-10m deeper. It was concluded that sub-seismic faults must have occurred in the location of the well. There were no indications, neither in the seismic data nor in the neighboring wells a few hundred meters away, which explained that the reservoir is several meters deeper than expected.10 Despite these downfalls, the decision was taken to complete the well and to put it in production.
AICD placementThe preparation for the AICD placement had to be done in a very short timeframe. The preliminary plan for the AICD placement was available, but the final design had to be done right after the last logging results arrived at the surface. A
very well coordinated and smooth operation was needed to avoid expensive waiting time on the drilling rig. As soon as the bit reached the target reservoir, real-time data was constantly analyzed by the multidisciplinary team and continued until the well reached the final total depth (TD).
As it was the first AICD installation in OMV, a second approach to come up with the distribution of the AICDs was prepared, parallel to the analysis in NETool. This compared the two results and derived the optimum solution. In detail, the following workflow was created:
- Import .las file with following data into Excel: measured depth (MD), true vertical depth (TVD), porosity and water saturation. File preparation and quality check by petrophysics
- Calculate following from received data with formulas which were derived prior:
- permeability - the product of permeability and reservoir thickness - relative permeabilities for oil and water - expected water cut - mobility for oil and water - rates according to different analytical models for
horizontal wells
- Classify available AICDs for different mobilities
- Plot results in relation to MD
- Analyze regions, especially regarding mobility and available AICD sizes and distribute them logically.
In Figure 8, it can be seen how the distribution for the AICDs was allocated in the case of BO208. In areas where oil mobility is high, more AICDs with larger openings were used. Conversely, the areas with high water mobility were either blanked out with blind pipes or installed with very restrictive AICDs that have very small openings.
The results of this analysis and AICD distribution method were compared to the calculations with NETool. The two results only had negligible differences, which simplified the decision to go onwards and install the AICDs as analysis suggested. This distributed higher flow AICDs in areas with low water saturation and good oil mobility and vice versa to support the function of the AICDs.
Results - comparison of horizontal wellsWells BO204 and BO208 are quite compatible for a comparison, whereas BO205 is less suitable. The targets of the wells varied; BO205 was planned to be drilled below a former
Figure 8: Mobilities (top panel) and final AICD distribution (bottom panel) in the well BO208 evolved after drilling
gas cap in a different compartment to both BO204 and BO208, which are used to target attic oil at the top of the reservoir.
Figure 9 shows that BO205 is located much higher in the reservoir compared to BO204 and BO208. One reason for this is that the compartment of BO205 is shifted higher than the other compartment. Upon observation of the well paths, particularly BO208, it can be seen that the well path is deeper and shorter than BO204. As the reservoir was deeper and entered later than expected, the well is shorter and deeper than originally planned resulting in higher initial water saturations and less reservoir exposure.
Figures 10 and 11 show the parameters which were obtained during logging while drilling.
Figure 10 depicts the porosities along the wellbores in the horizontal section. BO204 shows an average porosity 24.4% and BO208 average porosity 24%. Some key observations can be seen in Figure 11.
BO204 has an average water saturation of 24.9%, within the predicted range. It was expected, that BO208 will have a similar average water saturation, but as the reservoir and well ended several meters deeper than planned, the well is also closer to the oil-water contact which resulted in an average water saturation of 41%.
Figure 12 shows the Log water-oil ratio versus the cumulative oil production of the three horizontal wells. This plot is often used as an analytic way to forecast the estimated ultimate recovery of a well together with the classical decline curve analysis (DCA).
In Figure 12, the blue dashed horizontal line indicates the corresponding water-oil ratio for an economic cutoff of 99.3% water cut - naturally, the economic cutoff varies depending on multiple inputs. This corresponds to a water-oil ratio of 142.86. The solid lines in green, grey and blue show the corresponding values of each horizontal well. BO204 is the oldest well, which corresponds to the most data points whereas BO208 is the youngest well, with the fewest data points. The dashed lines show the further trend of a representative area in the production history of the specific well and extrapolate until they reach the economic limit line (dashed orange). These intersections correspond to a value on the x-axis, which can be seen as the estimated ultimate recovery (EUR) for the specific well (supported by vertical solid brown lines).
The plot further shows the final result for this section. BO204 and BO208, the EUR benefits are similar, between 50,000m³ and 60,000m³. Today, BO208 will have an even higher value than well BO204. This result is surprising as BO204 is several meters higher in the reservoir, had a longer horizontal section (around 100m, 20% longer) and had much lower initial water saturations.
The only difference in the operational mode is that in BO208 AICDs were installed. In view of the initial facts (much higher water saturation, shorter reservoir exposure), BO208 should have a lower EUR value than BO204, but actually turns out to be similar. This is a strong indication that the AICDs have a positive impact.
Further detailed analysis needs to be carried out. For example, with simulation studies, to check, if the better performance of BO208 has a regional or reservoir related reason.
ConclusionThis project has demonstrated the first successful AICD installation in OMV Austria and showed that an AICD
installation improved the production performance of a well, which had to cope with geological uncertainties. Nonetheless, most likely due to the AICDs, the well is performing similar to a peer well.
An analytical approach which can support the placement of the AICDs was successfully demonstrated.
Further analysis of the performance of the AICDs needs to be done, for instance by using tracers. The tracers will show, from which part of the well the inflow is coming and confirm the function of the AICDs.
An economic evaluation to compare the performance of the horizontal wells with each other is also planned.
References1. Poellitzer, S., Gruenwalder, M., Kienberger, G., & Clemens, T. (2008). How to Optimise Oil Recovery after almost 60 Years of Production from the Matzen Field, Austria. SPE-113303-MS. Rome, Italy: Europec/EAGE Conference and Exhibition, 9-12 June.
2. Giden, I., Kometer, B., Toth, P., Geier, H., Florian, T., & Sieberer, M. (2016). Technology Driven Rejuvenation of a Mature Field by Doubling the Gross Production Rate. SPE-181892-MS. Dubai, UAE: SPE Annual Technical Conference and Exhibition, 26–28 September.
3. Giden, I., Kometer, B., Buerssner, P., & Lobianco, L. (2017). Re-Development of an Onshore Mature Oil Field to Double Gross Production by the use of Sensor-Equipped Electrical Submersible Pumps. SPE-185870-MS. Paris, France: SPE Europec featured at 79th EAGE Conference and Exhibition.
4. Kienberger, G., & Fuchs, R. (2006). Case History of the Matzen Field - Matzen Sand (16th TH): A Story of Success; Where is the End? SPE 100329. Vienna, Austria: SPE Annual Technical Conference and Exhibition, 12-15 June.
5. Halvorsen, M., Madsen, M., Mo, V., Mohd Ismail, I., & Green, A. (2016). Enhanced Oil Recovery On Troll Field By Implementing Autonomous Inflow Control Device. SPE-180037-MS. Bergen, Norway: SPE Bergen One Day Seminar.
6. Mathiesen, V., Werswick, B., Aakre, H., & Elseth, G. (2011). Autonomous Valve, A Game Changer Of Inflow Control In Horizontal Wells. SPE-145737-MS. Aberdeen, UK: Offshore Europe.
7. Voll, B. A., Mohd Ismail, I., & Oguche, I. (2014). Sustaining Production by Limiting Water Cut and Gas Break Through With Autonomous Inflow Control Technology. SPE-171149. Moscow, Russia: SPE Russian Oil and Gas Exploration & Production Technical Conference and Exhibition.
8. Ahmad, F., Al-Neaimi, A., Saif, O. Y., Channa, Z., Iwama, H., Sarsekov, A., . . . Abazeed, O. (2016). Rejuvenating a High GOR, Light Oil Reservoir Using AICD Completion Technology for Gas Control. SPE-183486-MS. Abu Dhabi, UAE: Abu Dhabi International Petroleum Exhibition & Conference.
9. Halvorsen, M., Elseth, G., & Naevdal, O. M. (2012). Increased oil production at Troll by autonomous inflow control with RCP valves. SPE-159634-MS. San Antonio, Texas, USA: SPE Annual Technical Conference and Exhibition.
10. Toth, P., Knezevic, R., Blanzano, A., Chinellato, F., Vergani, V., Gorshenina, O., & Dolan, J. (2016). Production Acceleration in a Key Reservoir by Proactive Well Placement, Utilizing Innovative Logging-While-Drilling (LWD) Technology in the Vienna Basin, Austria. SPE-180155-MS. Vienna, Austria: SPE Europec/EAGE Annual Conference and Exhibition, 30 May - 2 June.
There are multiple commercial nodal analysis tools and dynamic reservoir simulators that are capable of modelling completions with AICDs (RCP). A static reservoir simulator can be used to optimize the AICD size and number of AICD per joint.8 Dynamic simulators are required to quantify the production benefits of the AICD completion over field life.
Horizontal wells and completions in 16.THHorizontal wells are characterized by an uneven drainage profile from the heel to the toe section. Frictional pressure drop and variations in permeabilities and mobility will naturally lead to a non-uniform inflow profile along a well.9 In the case of the 16.TH, this can eventually result in excessive water production which may reduce the well performance and recovery significantly.
The breakthrough typically occurs in the heel section of the well, in regions with high permeability as well as in sections with a short vertical distance to the gas-oil-contact or oil-water-contact. In the course of the re-development project of the 16.TH, it was decided to support the project with three horizontal infill wells, each of them with a different completion. This was the foundation for a comparison in this relatively homogeneous reservoir.
Particular focus is on well BO208, which is completed with the AICDs, by comparing it to the performance of BO204, which is completed with slotted liners, swell packers and blank pipes.
The first well drilled in this series was BO204 in 2013- Target of the well Penetrate approximately 530m horizontally in the top of the
reservoir sand to get maximum access to attic oil in the eastern compartment of the Bockfliess area
- Position in the reservoir Close to former local gas cap because high water saturations
were expected even in the higher zones in the reservoir
- Drilling technique Drill with real-time geo steering to keep the well path
asclose as possible to the reservoir top10
- Completion Depending on the preliminary log interpretation, define
zones for inflow and zones for shutoff. Zones for inflow are completed with slotted liners, zones for shutoff are completed with blind pipes. Oil and water swellable external casing packers are used between to isolate the different zones. In total, approximately 270m are open for inflow in three zones whereas the remaining 260m are immediately kept out of production due to high water saturation values in the logs
- Production The well was planned for high gross production rates from
the beginning. Common production casing size for the Bockfliess area is 7”. But for BO204 it was planned to run an ESP with a gross production capability of 2400m³/d. ESPs for this production range have an outer diameter (OD) of 6 ¾” which made a 9 5/8” casing necessary. The drilling path was chosen in a way that a maximum dogleg severity of 3°/30m was allowed and a tangent section of 100m with no doglegs for future positioning of the ESPs. Below the planned ESP setting depth higher doglegs were allowed. The well was put in production with an ESP from the beginning.3
The second production well in the series was BO208, drilled in 2015- Target of the well Penetrate approximately 600m horizontally in the top of
the reservoir sand in the eastern compartment of the Bockfliess area close to BO204, to get maximum access to attic oil. However in reality, only 390m of reservoir section could be drilled
- Position in the reservoir To connect two local highs as high water saturations were
also expected in higher zones in the reservoir
- Drilling technique Drill with real-time geo steering to keep the well path as
close as possible to the reservoir top10
- Completion Depending on the preliminary log interpretation, define
zones for inflow and zones for shutoff. Zones for inflow are equipped with three different types of AICDs, zones for shutoff are completed with blind pipes. In between, to isolate the different zones, oil and water swellable external casing packers were used. In total, approximately 208m were opened for inflow in three zones. The remaining 182m were immediately kept out of production due to high water saturation values in the logs
- Production The production strategy for this well is similar to BO204,
and it was also drilled similarly, including a bigger production casing than usual and an ESP tangent section. The well was put in production with an ESP from the beginning.3
BO208 - AICD planning and designBO208 is in the same compartment as BO204 and are also very similar in their planned production strategy. BO204 was already started with a ‘poor boy’ restriction of flow in areas where encountered water saturation was very high. These areas were blanked out from contribution to production with
blank pipes. To restrict flow in the annulus, oil and water swelling packers were used. The remaining favored zones were completed with slotted liners in order to be on production. In the planning phase of BO208 it was decided to go one step further than with BO204 and use AICDs from Tendeka for this new well.
For the design, an interdisciplinary approach was chosen, where geologists, reservoir engineers, completion engineers, and production technologists worked together. Reservoir simulation results from Eclipse (reservoir simulator) were used in NETool (simulator specialized for completion design) to design the completion for well BO208 with the AICDs.
According to the results from the calculations in NETool, the type and amount of AICDs was calculated. The following types of AICDs were ordered to place them in well BO208:
- 15 screens for high oil mobility with four 10mm AICDs
- 22 screens for medium oil mobility with two 10mm AICDs
- 5 screens for low oil mobility with one dummy and one 2.5mm AICD
- Spare screens and spare AICDs.
The AICDs were placed according to analysis derived from logged saturations and porosities and also compared with an updated NETool solution. As this last step was done almost in real-time during the drilling process, this was a time critical approach and needed to be prepared and executed in a very precise manner.
Drilling BO208 – plan versus realityThe well is positioned in the vicinity of another horizontal, well BO204. Furthermore, many other neighboring wells exist, which should give a good grip on the geology of the planned well. Nevertheless, the decision was taken to drill the well actively with geosteering to adapt the well path in real-time according to the logging results. The planned well path is shown in Figure 5.
The well was planned to connect two local highs in the reservoir with the path being approximately 600m in the reservoir section. When approaching the target reservoir of the 16.TH, the multidisciplinary team was waiting much longer than expected for the top of the 16.TH. Finally, the top of the sand was encountered 160m MD later and on average 7-8m TVDss deeper than expected (Figure 6).
As soon as the reservoir was reached, it was steered upwards to stay in the attic of the reservoir. At one point, this steering upward was too much, which resulted in the well path leaving the reservoir for another approximately 50m in the second half of horizontal section.
Figures 5 and 6 are combined in a simplified graph to get a better comparison of the planned and actual well path and geology in Figure 7. For simplifying purposes the actual depth of the 16.TH is overlaid onto the planned depth. That’s why the bottom of the planned one (green) is not seen here. But it has a similar thickness as the actual depth.
This shows that the planned well path would not have hit the reservoir until the last few meters. In other words, without real-time geosteering this well would have been most likely a dry well. Nevertheless, the two main issues that occurred after drilling were:
1. The well penetrated about 30% less of the target reservoir than planned
2. In a high water-cut environment the well landed around 7-8m deeper than planned – meaning that the water saturation will be high from the beginning.
Compared to the ‘peer-well’ BO204, the new well BO208 has a well path which is 6-10m deeper. It was concluded that sub-seismic faults must have occurred in the location of the well. There were no indications, neither in the seismic data nor in the neighboring wells a few hundred meters away, which explained that the reservoir is several meters deeper than expected.10 Despite these downfalls, the decision was taken to complete the well and to put it in production.
AICD placementThe preparation for the AICD placement had to be done in a very short timeframe. The preliminary plan for the AICD placement was available, but the final design had to be done right after the last logging results arrived at the surface. A
very well coordinated and smooth operation was needed to avoid expensive waiting time on the drilling rig. As soon as the bit reached the target reservoir, real-time data was constantly analyzed by the multidisciplinary team and continued until the well reached the final total depth (TD).
As it was the first AICD installation in OMV, a second approach to come up with the distribution of the AICDs was prepared, parallel to the analysis in NETool. This compared the two results and derived the optimum solution. In detail, the following workflow was created:
- Import .las file with following data into Excel: measured depth (MD), true vertical depth (TVD), porosity and water saturation. File preparation and quality check by petrophysics
- Calculate following from received data with formulas which were derived prior:
- permeability - the product of permeability and reservoir thickness - relative permeabilities for oil and water - expected water cut - mobility for oil and water - rates according to different analytical models for
horizontal wells
- Classify available AICDs for different mobilities
- Plot results in relation to MD
- Analyze regions, especially regarding mobility and available AICD sizes and distribute them logically.
In Figure 8, it can be seen how the distribution for the AICDs was allocated in the case of BO208. In areas where oil mobility is high, more AICDs with larger openings were used. Conversely, the areas with high water mobility were either blanked out with blind pipes or installed with very restrictive AICDs that have very small openings.
The results of this analysis and AICD distribution method were compared to the calculations with NETool. The two results only had negligible differences, which simplified the decision to go onwards and install the AICDs as analysis suggested. This distributed higher flow AICDs in areas with low water saturation and good oil mobility and vice versa to support the function of the AICDs.
Results - comparison of horizontal wellsWells BO204 and BO208 are quite compatible for a comparison, whereas BO205 is less suitable. The targets of the wells varied; BO205 was planned to be drilled below a former
gas cap in a different compartment to both BO204 and BO208, which are used to target attic oil at the top of the reservoir.
Figure 9 shows that BO205 is located much higher in the reservoir compared to BO204 and BO208. One reason for this is that the compartment of BO205 is shifted higher than the other compartment. Upon observation of the well paths, particularly BO208, it can be seen that the well path is deeper and shorter than BO204. As the reservoir was deeper and entered later than expected, the well is shorter and deeper than originally planned resulting in higher initial water saturations and less reservoir exposure.
Figure 9: Depths of horizontal wells compared to each other
Figures 10 and 11 show the parameters which were obtained during logging while drilling.
Figure 10: Porosities along the three horizontal well sections
Figure 10 depicts the porosities along the wellbores in the horizontal section. BO204 shows an average porosity 24.4% and BO208 average porosity 24%. Some key observations can be seen in Figure 11.
Figure 11: Water saturation along the horizontal well sections
BO204 has an average water saturation of 24.9%, within the predicted range. It was expected, that BO208 will have a similar average water saturation, but as the reservoir and well ended several meters deeper than planned, the well is also closer to the oil-water contact which resulted in an average water saturation of 41%.
Figure 12 shows the Log water-oil ratio versus the cumulative oil production of the three horizontal wells. This plot is often used as an analytic way to forecast the estimated ultimate recovery of a well together with the classical decline curve analysis (DCA).
Figure 12: WOR versus cumulative oil of the three horizontal wells
In Figure 12, the blue dashed horizontal line indicates the corresponding water-oil ratio for an economic cutoff of 99.3% water cut - naturally, the economic cutoff varies depending on multiple inputs. This corresponds to a water-oil ratio of 142.86. The solid lines in green, grey and blue show the corresponding values of each horizontal well. BO204 is the oldest well, which corresponds to the most data points whereas BO208 is the youngest well, with the fewest data points. The dashed lines show the further trend of a representative area in the production history of the specific well and extrapolate until they reach the economic limit line (dashed orange). These intersections correspond to a value on the x-axis, which can be seen as the estimated ultimate recovery (EUR) for the specific well (supported by vertical solid brown lines).
The plot further shows the final result for this section. BO204 and BO208, the EUR benefits are similar, between 50,000m³ and 60,000m³. Today, BO208 will have an even higher value than well BO204. This result is surprising as BO204 is several meters higher in the reservoir, had a longer horizontal section (around 100m, 20% longer) and had much lower initial water saturations.
The only difference in the operational mode is that in BO208 AICDs were installed. In view of the initial facts (much higher water saturation, shorter reservoir exposure), BO208 should have a lower EUR value than BO204, but actually turns out to be similar. This is a strong indication that the AICDs have a positive impact.
Further detailed analysis needs to be carried out. For example, with simulation studies, to check, if the better performance of BO208 has a regional or reservoir related reason.
ConclusionThis project has demonstrated the first successful AICD installation in OMV Austria and showed that an AICD
installation improved the production performance of a well, which had to cope with geological uncertainties. Nonetheless, most likely due to the AICDs, the well is performing similar to a peer well.
An analytical approach which can support the placement of the AICDs was successfully demonstrated.
Further analysis of the performance of the AICDs needs to be done, for instance by using tracers. The tracers will show, from which part of the well the inflow is coming and confirm the function of the AICDs.
An economic evaluation to compare the performance of the horizontal wells with each other is also planned.
References1. Poellitzer, S., Gruenwalder, M., Kienberger, G., & Clemens, T. (2008). How to Optimise Oil Recovery after almost 60 Years of Production from the Matzen Field, Austria. SPE-113303-MS. Rome, Italy: Europec/EAGE Conference and Exhibition, 9-12 June.
2. Giden, I., Kometer, B., Toth, P., Geier, H., Florian, T., & Sieberer, M. (2016). Technology Driven Rejuvenation of a Mature Field by Doubling the Gross Production Rate. SPE-181892-MS. Dubai, UAE: SPE Annual Technical Conference and Exhibition, 26–28 September.
3. Giden, I., Kometer, B., Buerssner, P., & Lobianco, L. (2017). Re-Development of an Onshore Mature Oil Field to Double Gross Production by the use of Sensor-Equipped Electrical Submersible Pumps. SPE-185870-MS. Paris, France: SPE Europec featured at 79th EAGE Conference and Exhibition.
4. Kienberger, G., & Fuchs, R. (2006). Case History of the Matzen Field - Matzen Sand (16th TH): A Story of Success; Where is the End? SPE 100329. Vienna, Austria: SPE Annual Technical Conference and Exhibition, 12-15 June.
5. Halvorsen, M., Madsen, M., Mo, V., Mohd Ismail, I., & Green, A. (2016). Enhanced Oil Recovery On Troll Field By Implementing Autonomous Inflow Control Device. SPE-180037-MS. Bergen, Norway: SPE Bergen One Day Seminar.
6. Mathiesen, V., Werswick, B., Aakre, H., & Elseth, G. (2011). Autonomous Valve, A Game Changer Of Inflow Control In Horizontal Wells. SPE-145737-MS. Aberdeen, UK: Offshore Europe.
7. Voll, B. A., Mohd Ismail, I., & Oguche, I. (2014). Sustaining Production by Limiting Water Cut and Gas Break Through With Autonomous Inflow Control Technology. SPE-171149. Moscow, Russia: SPE Russian Oil and Gas Exploration & Production Technical Conference and Exhibition.
8. Ahmad, F., Al-Neaimi, A., Saif, O. Y., Channa, Z., Iwama, H., Sarsekov, A., . . . Abazeed, O. (2016). Rejuvenating a High GOR, Light Oil Reservoir Using AICD Completion Technology for Gas Control. SPE-183486-MS. Abu Dhabi, UAE: Abu Dhabi International Petroleum Exhibition & Conference.
9. Halvorsen, M., Elseth, G., & Naevdal, O. M. (2012). Increased oil production at Troll by autonomous inflow control with RCP valves. SPE-159634-MS. San Antonio, Texas, USA: SPE Annual Technical Conference and Exhibition.
10. Toth, P., Knezevic, R., Blanzano, A., Chinellato, F., Vergani, V., Gorshenina, O., & Dolan, J. (2016). Production Acceleration in a Key Reservoir by Proactive Well Placement, Utilizing Innovative Logging-While-Drilling (LWD) Technology in the Vienna Basin, Austria. SPE-180155-MS. Vienna, Austria: SPE Europec/EAGE Annual Conference and Exhibition, 30 May - 2 June.
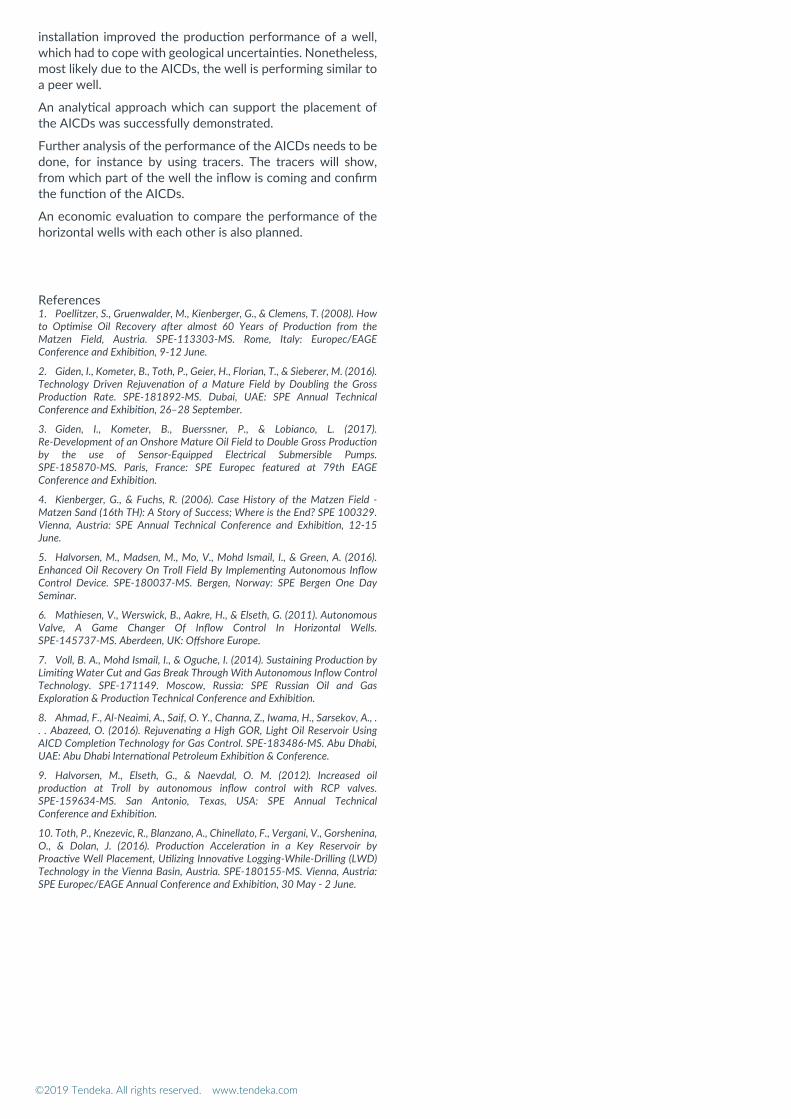
©2019 Tendeka. All rights reserved.
There are multiple commercial nodal analysis tools and dynamic reservoir simulators that are capable of modelling completions with AICDs (RCP). A static reservoir simulator can be used to optimize the AICD size and number of AICD per joint.8 Dynamic simulators are required to quantify the production benefits of the AICD completion over field life.
Horizontal wells and completions in 16.THHorizontal wells are characterized by an uneven drainage profile from the heel to the toe section. Frictional pressure drop and variations in permeabilities and mobility will naturally lead to a non-uniform inflow profile along a well.9 In the case of the 16.TH, this can eventually result in excessive water production which may reduce the well performance and recovery significantly.
The breakthrough typically occurs in the heel section of the well, in regions with high permeability as well as in sections with a short vertical distance to the gas-oil-contact or oil-water-contact. In the course of the re-development project of the 16.TH, it was decided to support the project with three horizontal infill wells, each of them with a different completion. This was the foundation for a comparison in this relatively homogeneous reservoir.
Particular focus is on well BO208, which is completed with the AICDs, by comparing it to the performance of BO204, which is completed with slotted liners, swell packers and blank pipes.
The first well drilled in this series was BO204 in 2013- Target of the well Penetrate approximately 530m horizontally in the top of the
reservoir sand to get maximum access to attic oil in the eastern compartment of the Bockfliess area
- Position in the reservoir Close to former local gas cap because high water saturations
were expected even in the higher zones in the reservoir
- Drilling technique Drill with real-time geo steering to keep the well path
asclose as possible to the reservoir top10
- Completion Depending on the preliminary log interpretation, define
zones for inflow and zones for shutoff. Zones for inflow are completed with slotted liners, zones for shutoff are completed with blind pipes. Oil and water swellable external casing packers are used between to isolate the different zones. In total, approximately 270m are open for inflow in three zones whereas the remaining 260m are immediately kept out of production due to high water saturation values in the logs
- Production The well was planned for high gross production rates from
the beginning. Common production casing size for the Bockfliess area is 7”. But for BO204 it was planned to run an ESP with a gross production capability of 2400m³/d. ESPs for this production range have an outer diameter (OD) of 6 ¾” which made a 9 5/8” casing necessary. The drilling path was chosen in a way that a maximum dogleg severity of 3°/30m was allowed and a tangent section of 100m with no doglegs for future positioning of the ESPs. Below the planned ESP setting depth higher doglegs were allowed. The well was put in production with an ESP from the beginning.3
The second production well in the series was BO208, drilled in 2015- Target of the well Penetrate approximately 600m horizontally in the top of
the reservoir sand in the eastern compartment of the Bockfliess area close to BO204, to get maximum access to attic oil. However in reality, only 390m of reservoir section could be drilled
- Position in the reservoir To connect two local highs as high water saturations were
also expected in higher zones in the reservoir
- Drilling technique Drill with real-time geo steering to keep the well path as
close as possible to the reservoir top10
- Completion Depending on the preliminary log interpretation, define
zones for inflow and zones for shutoff. Zones for inflow are equipped with three different types of AICDs, zones for shutoff are completed with blind pipes. In between, to isolate the different zones, oil and water swellable external casing packers were used. In total, approximately 208m were opened for inflow in three zones. The remaining 182m were immediately kept out of production due to high water saturation values in the logs
- Production The production strategy for this well is similar to BO204,
and it was also drilled similarly, including a bigger production casing than usual and an ESP tangent section. The well was put in production with an ESP from the beginning.3
BO208 - AICD planning and designBO208 is in the same compartment as BO204 and are also very similar in their planned production strategy. BO204 was already started with a ‘poor boy’ restriction of flow in areas where encountered water saturation was very high. These areas were blanked out from contribution to production with
blank pipes. To restrict flow in the annulus, oil and water swelling packers were used. The remaining favored zones were completed with slotted liners in order to be on production. In the planning phase of BO208 it was decided to go one step further than with BO204 and use AICDs from Tendeka for this new well.
For the design, an interdisciplinary approach was chosen, where geologists, reservoir engineers, completion engineers, and production technologists worked together. Reservoir simulation results from Eclipse (reservoir simulator) were used in NETool (simulator specialized for completion design) to design the completion for well BO208 with the AICDs.
According to the results from the calculations in NETool, the type and amount of AICDs was calculated. The following types of AICDs were ordered to place them in well BO208:
- 15 screens for high oil mobility with four 10mm AICDs
- 22 screens for medium oil mobility with two 10mm AICDs
- 5 screens for low oil mobility with one dummy and one 2.5mm AICD
- Spare screens and spare AICDs.
The AICDs were placed according to analysis derived from logged saturations and porosities and also compared with an updated NETool solution. As this last step was done almost in real-time during the drilling process, this was a time critical approach and needed to be prepared and executed in a very precise manner.
Drilling BO208 – plan versus realityThe well is positioned in the vicinity of another horizontal, well BO204. Furthermore, many other neighboring wells exist, which should give a good grip on the geology of the planned well. Nevertheless, the decision was taken to drill the well actively with geosteering to adapt the well path in real-time according to the logging results. The planned well path is shown in Figure 5.
The well was planned to connect two local highs in the reservoir with the path being approximately 600m in the reservoir section. When approaching the target reservoir of the 16.TH, the multidisciplinary team was waiting much longer than expected for the top of the 16.TH. Finally, the top of the sand was encountered 160m MD later and on average 7-8m TVDss deeper than expected (Figure 6).
As soon as the reservoir was reached, it was steered upwards to stay in the attic of the reservoir. At one point, this steering upward was too much, which resulted in the well path leaving the reservoir for another approximately 50m in the second half of horizontal section.
Figures 5 and 6 are combined in a simplified graph to get a better comparison of the planned and actual well path and geology in Figure 7. For simplifying purposes the actual depth of the 16.TH is overlaid onto the planned depth. That’s why the bottom of the planned one (green) is not seen here. But it has a similar thickness as the actual depth.
This shows that the planned well path would not have hit the reservoir until the last few meters. In other words, without real-time geosteering this well would have been most likely a dry well. Nevertheless, the two main issues that occurred after drilling were:
1. The well penetrated about 30% less of the target reservoir than planned
2. In a high water-cut environment the well landed around 7-8m deeper than planned – meaning that the water saturation will be high from the beginning.
Compared to the ‘peer-well’ BO204, the new well BO208 has a well path which is 6-10m deeper. It was concluded that sub-seismic faults must have occurred in the location of the well. There were no indications, neither in the seismic data nor in the neighboring wells a few hundred meters away, which explained that the reservoir is several meters deeper than expected.10 Despite these downfalls, the decision was taken to complete the well and to put it in production.
AICD placementThe preparation for the AICD placement had to be done in a very short timeframe. The preliminary plan for the AICD placement was available, but the final design had to be done right after the last logging results arrived at the surface. A
very well coordinated and smooth operation was needed to avoid expensive waiting time on the drilling rig. As soon as the bit reached the target reservoir, real-time data was constantly analyzed by the multidisciplinary team and continued until the well reached the final total depth (TD).
As it was the first AICD installation in OMV, a second approach to come up with the distribution of the AICDs was prepared, parallel to the analysis in NETool. This compared the two results and derived the optimum solution. In detail, the following workflow was created:
- Import .las file with following data into Excel: measured depth (MD), true vertical depth (TVD), porosity and water saturation. File preparation and quality check by petrophysics
- Calculate following from received data with formulas which were derived prior:
- permeability - the product of permeability and reservoir thickness - relative permeabilities for oil and water - expected water cut - mobility for oil and water - rates according to different analytical models for
horizontal wells
- Classify available AICDs for different mobilities
- Plot results in relation to MD
- Analyze regions, especially regarding mobility and available AICD sizes and distribute them logically.
In Figure 8, it can be seen how the distribution for the AICDs was allocated in the case of BO208. In areas where oil mobility is high, more AICDs with larger openings were used. Conversely, the areas with high water mobility were either blanked out with blind pipes or installed with very restrictive AICDs that have very small openings.
The results of this analysis and AICD distribution method were compared to the calculations with NETool. The two results only had negligible differences, which simplified the decision to go onwards and install the AICDs as analysis suggested. This distributed higher flow AICDs in areas with low water saturation and good oil mobility and vice versa to support the function of the AICDs.
Results - comparison of horizontal wellsWells BO204 and BO208 are quite compatible for a comparison, whereas BO205 is less suitable. The targets of the wells varied; BO205 was planned to be drilled below a former
gas cap in a different compartment to both BO204 and BO208, which are used to target attic oil at the top of the reservoir.
Figure 9 shows that BO205 is located much higher in the reservoir compared to BO204 and BO208. One reason for this is that the compartment of BO205 is shifted higher than the other compartment. Upon observation of the well paths, particularly BO208, it can be seen that the well path is deeper and shorter than BO204. As the reservoir was deeper and entered later than expected, the well is shorter and deeper than originally planned resulting in higher initial water saturations and less reservoir exposure.
Figures 10 and 11 show the parameters which were obtained during logging while drilling.
Figure 10 depicts the porosities along the wellbores in the horizontal section. BO204 shows an average porosity 24.4% and BO208 average porosity 24%. Some key observations can be seen in Figure 11.
BO204 has an average water saturation of 24.9%, within the predicted range. It was expected, that BO208 will have a similar average water saturation, but as the reservoir and well ended several meters deeper than planned, the well is also closer to the oil-water contact which resulted in an average water saturation of 41%.
Figure 12 shows the Log water-oil ratio versus the cumulative oil production of the three horizontal wells. This plot is often used as an analytic way to forecast the estimated ultimate recovery of a well together with the classical decline curve analysis (DCA).
In Figure 12, the blue dashed horizontal line indicates the corresponding water-oil ratio for an economic cutoff of 99.3% water cut - naturally, the economic cutoff varies depending on multiple inputs. This corresponds to a water-oil ratio of 142.86. The solid lines in green, grey and blue show the corresponding values of each horizontal well. BO204 is the oldest well, which corresponds to the most data points whereas BO208 is the youngest well, with the fewest data points. The dashed lines show the further trend of a representative area in the production history of the specific well and extrapolate until they reach the economic limit line (dashed orange). These intersections correspond to a value on the x-axis, which can be seen as the estimated ultimate recovery (EUR) for the specific well (supported by vertical solid brown lines).
The plot further shows the final result for this section. BO204 and BO208, the EUR benefits are similar, between 50,000m³ and 60,000m³. Today, BO208 will have an even higher value than well BO204. This result is surprising as BO204 is several meters higher in the reservoir, had a longer horizontal section (around 100m, 20% longer) and had much lower initial water saturations.
The only difference in the operational mode is that in BO208 AICDs were installed. In view of the initial facts (much higher water saturation, shorter reservoir exposure), BO208 should have a lower EUR value than BO204, but actually turns out to be similar. This is a strong indication that the AICDs have a positive impact.
Further detailed analysis needs to be carried out. For example, with simulation studies, to check, if the better performance of BO208 has a regional or reservoir related reason.
ConclusionThis project has demonstrated the first successful AICD installation in OMV Austria and showed that an AICD
www.tendeka.com
installation improved the production performance of a well, which had to cope with geological uncertainties. Nonetheless, most likely due to the AICDs, the well is performing similar to a peer well.
An analytical approach which can support the placement of the AICDs was successfully demonstrated.
Further analysis of the performance of the AICDs needs to be done, for instance by using tracers. The tracers will show, from which part of the well the inflow is coming and confirm the function of the AICDs.
An economic evaluation to compare the performance of the horizontal wells with each other is also planned.
References1. Poellitzer, S., Gruenwalder, M., Kienberger, G., & Clemens, T. (2008). How to Optimise Oil Recovery after almost 60 Years of Production from the Matzen Field, Austria. SPE-113303-MS. Rome, Italy: Europec/EAGE Conference and Exhibition, 9-12 June.
2. Giden, I., Kometer, B., Toth, P., Geier, H., Florian, T., & Sieberer, M. (2016). Technology Driven Rejuvenation of a Mature Field by Doubling the Gross Production Rate. SPE-181892-MS. Dubai, UAE: SPE Annual Technical Conference and Exhibition, 26–28 September.
3. Giden, I., Kometer, B., Buerssner, P., & Lobianco, L. (2017). Re-Development of an Onshore Mature Oil Field to Double Gross Production by the use of Sensor-Equipped Electrical Submersible Pumps. SPE-185870-MS. Paris, France: SPE Europec featured at 79th EAGE Conference and Exhibition.
4. Kienberger, G., & Fuchs, R. (2006). Case History of the Matzen Field - Matzen Sand (16th TH): A Story of Success; Where is the End? SPE 100329. Vienna, Austria: SPE Annual Technical Conference and Exhibition, 12-15 June.
5. Halvorsen, M., Madsen, M., Mo, V., Mohd Ismail, I., & Green, A. (2016). Enhanced Oil Recovery On Troll Field By Implementing Autonomous Inflow Control Device. SPE-180037-MS. Bergen, Norway: SPE Bergen One Day Seminar.
6. Mathiesen, V., Werswick, B., Aakre, H., & Elseth, G. (2011). Autonomous Valve, A Game Changer Of Inflow Control In Horizontal Wells. SPE-145737-MS. Aberdeen, UK: Offshore Europe.
7. Voll, B. A., Mohd Ismail, I., & Oguche, I. (2014). Sustaining Production by Limiting Water Cut and Gas Break Through With Autonomous Inflow Control Technology. SPE-171149. Moscow, Russia: SPE Russian Oil and Gas Exploration & Production Technical Conference and Exhibition.
8. Ahmad, F., Al-Neaimi, A., Saif, O. Y., Channa, Z., Iwama, H., Sarsekov, A., . . . Abazeed, O. (2016). Rejuvenating a High GOR, Light Oil Reservoir Using AICD Completion Technology for Gas Control. SPE-183486-MS. Abu Dhabi, UAE: Abu Dhabi International Petroleum Exhibition & Conference.
9. Halvorsen, M., Elseth, G., & Naevdal, O. M. (2012). Increased oil production at Troll by autonomous inflow control with RCP valves. SPE-159634-MS. San Antonio, Texas, USA: SPE Annual Technical Conference and Exhibition.
10. Toth, P., Knezevic, R., Blanzano, A., Chinellato, F., Vergani, V., Gorshenina, O., & Dolan, J. (2016). Production Acceleration in a Key Reservoir by Proactive Well Placement, Utilizing Innovative Logging-While-Drilling (LWD) Technology in the Vienna Basin, Austria. SPE-180155-MS. Vienna, Austria: SPE Europec/EAGE Annual Conference and Exhibition, 30 May - 2 June.