Embed Size (px)
Citation preview
1
Investor Open House 2011Horizon Oil Sands
May 2011
THE PREMIUM VALUE DEFINED GROWTH INDEPENDENT
Horizon Oil Sands
Investor Open House
May 2011
2
Investor Open House 2011Horizon Oil Sands
May 2011
CNQSlide 3
Certain statements in this document or documents incorporated herein by reference constitute forward-looking statements or information (collectively Certain statements relating to the Company in this document or documents incorporated herein by reference constitute forward-looking statements or information (collectively referred to herein as “forward-looking statements”) within the meaning of applicable securities legislation. Forward-looking statements can be identified by the words “believe”, “anticipate”, “expect”, “plan”, “estimate”, “target”, “continue”, “could” “intend”, “may”, “potential”, “predict”, “should”, “will”, “objective”, “project”, “forecast”, “goal”, “guidance”, “outlook”, “effort” “seeks”, “schedule” or expressions of a similar nature suggesting future outcome or statements regarding an outlook. Disclosure related to expected future commodity pricing, production volumes, royalties, operating costs, capital expenditures, and other guidance provided in the 2010 outlook section and throughout this document and the documents incorporated herein by reference constitute forward looking statements. Disclosure of plans relating to existing and future developments including but not limited to Horizon, Primrose East, Pelican Lake, Olowi Field (Offshore Gabon), and the Kirby Thermal Oil Sands Project also constitute forward-looking statements. This forward-looking information is based on annual budgets and multi-year forecasts and is reviewed and revised throughout the year if necessary in the context of targeted financial ratios, project returns, product pricing expectations and balance in project risk and time horizons. These statements are not guarantees of future performance and are subject to certain risks. The reader should not place undue reliance on these forward looking statements as there can be no assurances that the plans, initiatives or expectations upon which they are based will occur.
In addition, statements relating to “reserves” are deemed to be forward-looking statements as they involve the implied assessment based on certain estimates and assumptions that the reserves described can be profitably produced in the future. There are numerous uncertainties inherent in estimating quantities of proved crude oil and natural gas reserves and in projecting future rates of production and the timing of development expenditures. The total amount or timing of actual future production may vary significantly from reserve and production estimates.
The forward-looking statements are based on current expectations, estimates and projections about the Company and the industry in which the Company operates, which speak only as of the date such statements were made or as of the date of the report or document in which they are contained and are subject to known and unknown risks, uncertainties and other factors that could cause the actual results, performance or achievements of the Company to be materially different from any future results, performance or achievements expressed or implied by such forward-looking statements. Such risks and uncertainties include, among others: general economic and business conditions which will, among other things, impact demand for and market prices of the Company’s products; volatility of and assumptions regarding crude oil and natural gas prices; fluctuations in currency and interest rates; assumptions on which the Company’s current guidance is based; economic conditions in the countries and regions in which the Company conducts business; political uncertainty, including actions of or against terrorists, insurgent groups or other conflict including conflict between states; industry capacity; ability of the Company to implement its business strategy, including exploration and development activities; impact of competition; the Company’s defense of lawsuits; availability and cost of seismic, drilling and other equipment; ability of the Company and its subsidiaries to complete its capital programs; the Company’s and its subsidiaries’ ability to secure adequate transportation for its products; unexpected difficulties in mining, extracting or upgrading the Company’s bitumen products; potential delays or changes in plans with respect to exploration or development projects or capital expenditures; ability of the Company to attract the necessary labour required to build its thermal and oil sands mining projects; operating hazards and other difficulties inherent in the exploration for and production and sale of crude oil and natural gas; availability and cost of financing; the Company’s and its subsidiaries’ success of exploration and development activities and their ability to replace and expand crude oil and natural gas reserves; timing and success of integrating the business and operations of acquired companies; production levels; imprecision of reserve estimates and estimates of recoverable quantities of crude oil, bitumen, natural gas and liquids not currently classified as proved; actions by governmental authorities; government regulations and the expenditures required to comply with them (especially safety and environmental laws and regulations and the impact of climate change initiatives on capital and operating costs); asset retirement obligations; the adequacy of the Company’s provision for taxes; and other circumstances affecting revenues and expenses. Certain of these factors are discussed in more detail under the heading “Risk Factors”. The Company’s operations have been, and at times in the future may be affected by political developments and by federal, provincial and local laws and regulations such as restrictions on production, changes in taxes, royalties and other amounts payable to governments or governmental agencies, price or gathering rate controls and environmental protection regulations. Should one or more of these risks or uncertainties materialize, or should any of the Company’s assumptions prove incorrect, actual results may vary in material respects from those projected in the forward-looking statements. The impact of any one factor on a particular forward-looking statement is not determinable with certainty as such factors are dependent upon other factors, and the Company’s course of action would depend upon its assessment of the future considering all information then available.
Readers are cautioned that the foregoing list of important factors is not exhaustive. Unpredictable or unknown factors not discussed in this report could also have material adverse effects on forward-looking statements. Although the Company believes that the expectations conveyed by the forward-looking statements are reasonable based on information available to it on the date such forward-looking statements are made, no assurances can be given as to future results, levels of activity and achievements. All subsequent forward-looking statements, whether written or oral, attributable to the Company or persons acting on its behalf are expressly qualified in their entirety by these cautionary statements. Except as required by law, the Company assumes no obligation to update forward-looking statements should circumstances or Management’s estimates or opinions change.
Forward Looking StatementsForward Looking Statements
CNQSlide 4
Special Note Regarding Currency, Production and ReservesIn this document, all references to dollars refer to Canadian dollars unless otherwise stated. Production data is presented on a before royalties basis unless otherwise stated. In addition, reference is made to oil and gas in common units called barrel of oil equivalent (“boe”). A boe is derived by converting six thousand cubic feet of natural gas to one barrel of crude oil (6 mcf:1 bbl). This conversion may be misleading, particularly if used in isolation, since the 6mcf:1bbl ratio is based on an energy equivalency at the burner tip and does not represent the value equivalency at the well head.
ReservesFor the year ended December 31, 2010 the Company retained Independent Qualified Reserves Evaluators (”Evaluators”), Sproule Associates Limited and Sproule International Limited (together as “Sproule”) and GLJ Petroleum Consultants Ltd. (“GLJ”), to evaluate and review all of the Company’s proved and proved plus probable reserves with an effective date of December 31, 2010 and a preparation date of February 14, 2011. Sproule evaluated the North America and International crude oil, NGL and natural gas reserves. GLJ evaluated the Horizon SCO reserves. The evaluation and review was conducted in accordance with the standards contained in the Canadian Oil and Gas Evaluation Handbook (“COGE Handbook”) and disclosed in accordance with National Instrument 51-101 – Standards of Disclosure for Oil and Gas Activities (“NI 51-101”) requirements. In previous years, Canadian Natural had been granted an exemption order from the securities regulators in Canada that allowed substitution of U.S. Securities Exchange Commission (“SEC”) requirements for certain NI 51-101 reserves disclosures. This exemption expired on December 31, 2010. As a result, the 2010 reserves disclosure is presented in accordance with Canadian reporting requirements using forecast prices and escalated costs. The recovery and reserves estimates of crude oil, NGL and natural gas reserves provided in this presentation are estimates only and there is no guarantee that the estimated reserves will be recovered. Actual crude oil, NGL and natural gas reserves may be greater than or less than the estimates provided.
Reserves estimates provided in this presentation are company gross, before royalties.
Resources Other Than ReservesThe contingent resources other than reserves (“resources”) estimates provided in this presentation are internally evaluated by qualified reserves evaluators in accordance with the COGE Handbook as directed by NI 51-101. No independent third party evaluation or audit was completed. Resources provided are best estimates as of December 31, 2010. The resources are evaluated using deterministic methods which represent the expected outcome with no optimism or conservatism.
Resources, as per the COGE Handbook definition, are those quantities of petroleum estimated, as of a given date, to be potentially recoverable from know accumulations using established technology or technology under development, but are not currently considered commercially viable due to one or more contingencies. There is no certainty that it will be commercially viable to produce any portion of these resources.
Due to the inherent differences in standards and requirements employed in the evaluation of reserves and contingent resources, the total volumes of reserves or resources are not to be considered indicative of total volumes that may actually be recovered and are provided for illustrative purposes only.
Petroleum, bitumen or natural gas initially-in-place volumes provided are discovered resources which include: production, reserves, contingent resources and unrecoverable volumes.
Special Note Regarding non-GAAP Financial MeasuresManagement's discussion and analysis includes references to financial measures commonly used in the oil and gas industry, such as cash flow, cash flow per share and EBITDA (net earnings before interest, taxes, depreciation depletion and amortization, asset retirement obligation accretion, unrealized foreign exchange, stock-based compensation expense and unrealized risk management activity). These financial measures are not defined by generally accepted accounting principles (“GAAP”) and therefore are referred to as non-GAAP measures. The non-GAAP measures used by the Company may not be comparable to similar measures presented by other companies. The Company uses these non-GAAP measures to evaluate the performance of the Company and of its business segments. The non-GAAP measures should not be considered an alternative to or more meaningful than net earnings, as determined in accordance with Canadian GAAP, as an indication of the Company's performance.
Volumes shown are Company share before royalties unless otherwise stated.
Reporting DisclosuresReporting Disclosures
3
Investor Open House 2011Horizon Oil Sands
May 2011
CNQSlide 5
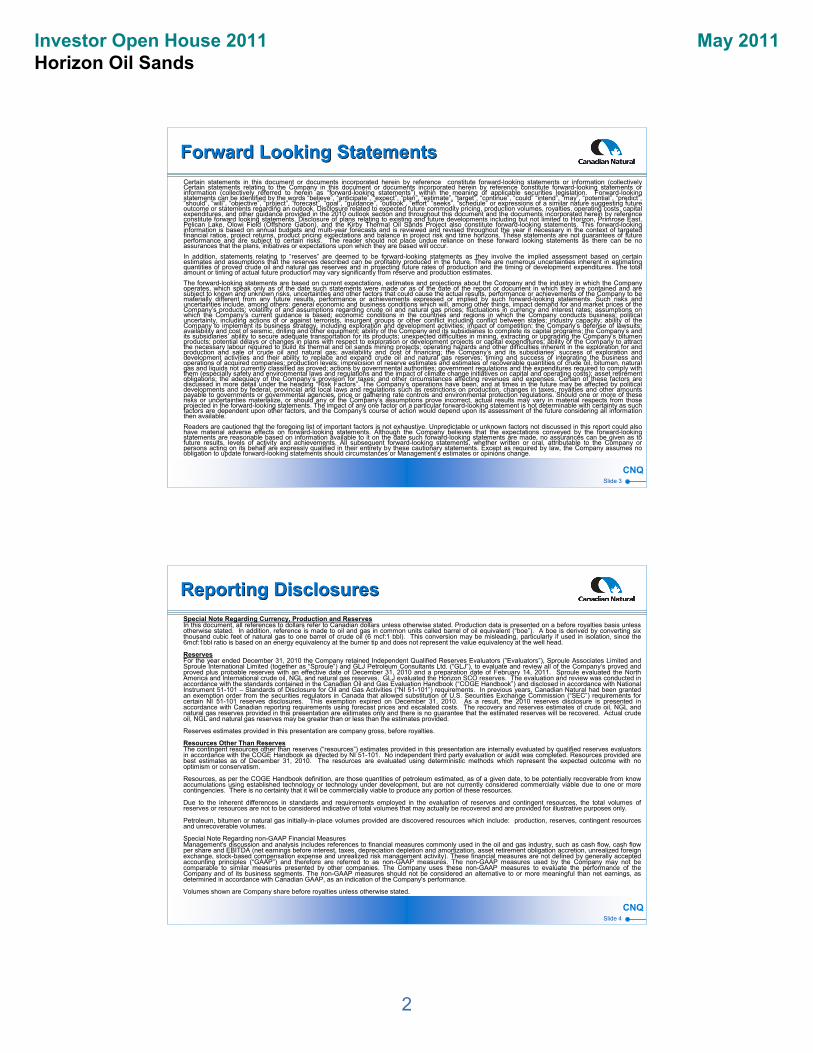
*Discovered Bitumen Initially in Place and excludes BIIP attributableto Birch Mountain East SAGD property. Note: Volumes are gross lease.
Horizon Oil SandsHorizon Oil Sands
• Mining resources– 14.3 Billion barrels BIIP* – Company gross proved plus
probable SCO reserves –2.9 Billion barrels
– Best estimate contingent resources other than reserves –3.0 Billion barrels of bitumen
– Phased development (SCO)• 110 Mbbl/d capacity
(Phase 1)• Target expansion to
232 to 250 Mbbl/d• Target future expansions to
~500 Mbbl/d
• Significant free cash flow generation for decades
World Class Opportunity World Class Opportunity
UTS
SYN
SHC
SYN
SYN
DVN
PCASU
PCA
IOL
ECA
SU
SU
IOL
HSE
XOM
SHC
SU
SynencoSHC
XOM
ECA
ECA
Deer Creek
SU
FortMcMurray
~4
3 m
iles
CNQ
CNQ
CNQHorizon
Oil Sands
CNQSlide 6
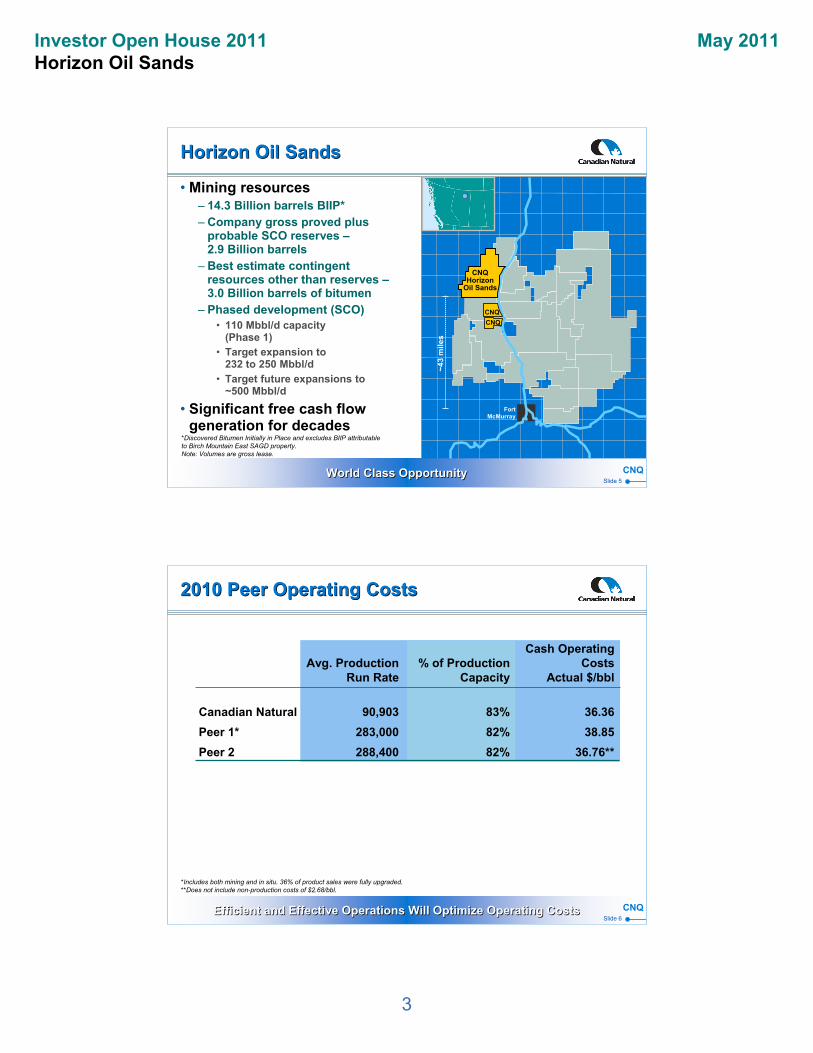
Cash OperatingAvg. Production % of Production Costs
Run Rate Capacity Actual $/bbl
Canadian Natural 90,903 83% 36.36
Peer 1* 283,000 82% 38.85
Peer 2 288,400 82% 36.76**
2010 Peer Operating Costs2010 Peer Operating Costs
Efficient and Effective Operations Will Optimize Operating CostsEfficient and Effective Operations Will Optimize Operating Costs
*Includes both mining and in situ. 36% of product sales were fully upgraded.**Does not include non-production costs of $2.68/bbl.
4
Investor Open House 2011Horizon Oil Sands
May 2011
CNQSlide 7
Cash OperatingAvg. Production % of Production Costs
Run Rate Capacity Actual $/bbl
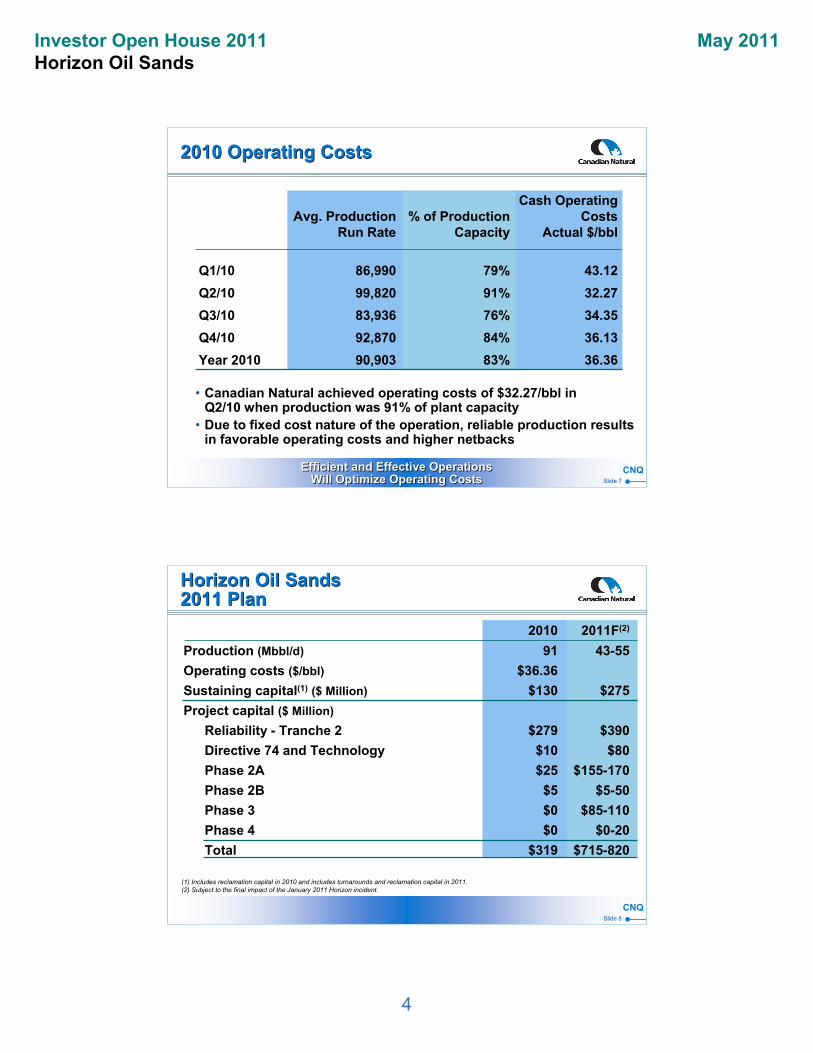
Q1/10 86,990 79% 43.12
Q2/10 99,820 91% 32.27
Q3/10 83,936 76% 34.35
Q4/10 92,870 84% 36.13
Year 2010 90,903 83% 36.36
2010 Operating Costs2010 Operating Costs
• Canadian Natural achieved operating costs of $32.27/bbl inQ2/10 when production was 91% of plant capacity
• Due to fixed cost nature of the operation, reliable production results in favorable operating costs and higher netbacks
Efficient and Effective Operations Will Optimize Operating Costs
Efficient and Effective Operations Will Optimize Operating Costs
CNQSlide 8
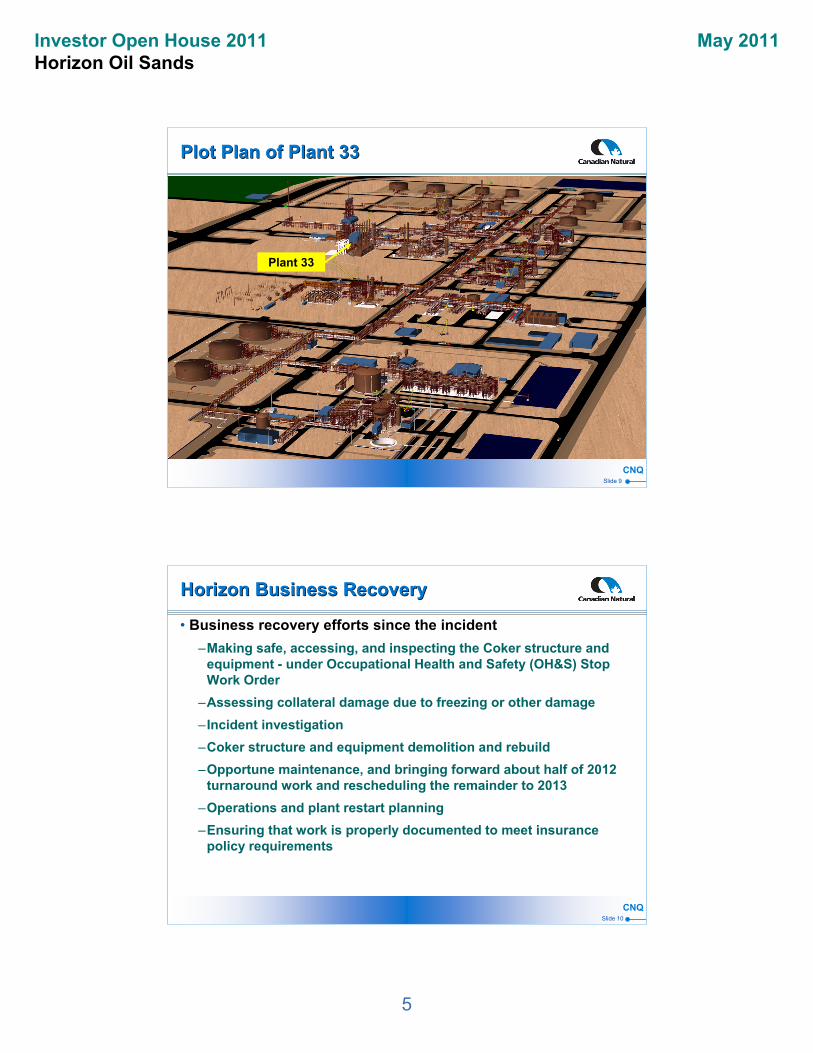
Horizon Oil Sands 2011 PlanHorizon Oil Sands 2011 Plan
(1) Includes reclamation capital in 2010 and includes turnarounds and reclamation capital in 2011.(2) Subject to the final impact of the January 2011 Horizon incident.
2010 2011F(2)
Production (Mbbl/d) 91 43-55
Operating costs ($/bbl) $36.36
Sustaining capital(1) ($ Million) $130 $275
Project capital ($ Million)
Reliability - Tranche 2 $279 $390
Directive 74 and Technology $10 $80
Phase 2A $25 $155-170
Phase 2B $5 $5-50
Phase 3 $0 $85-110
Phase 4 $0 $0-20
Total $319 $715-820
5
Investor Open House 2011Horizon Oil Sands
May 2011
CNQSlide 9
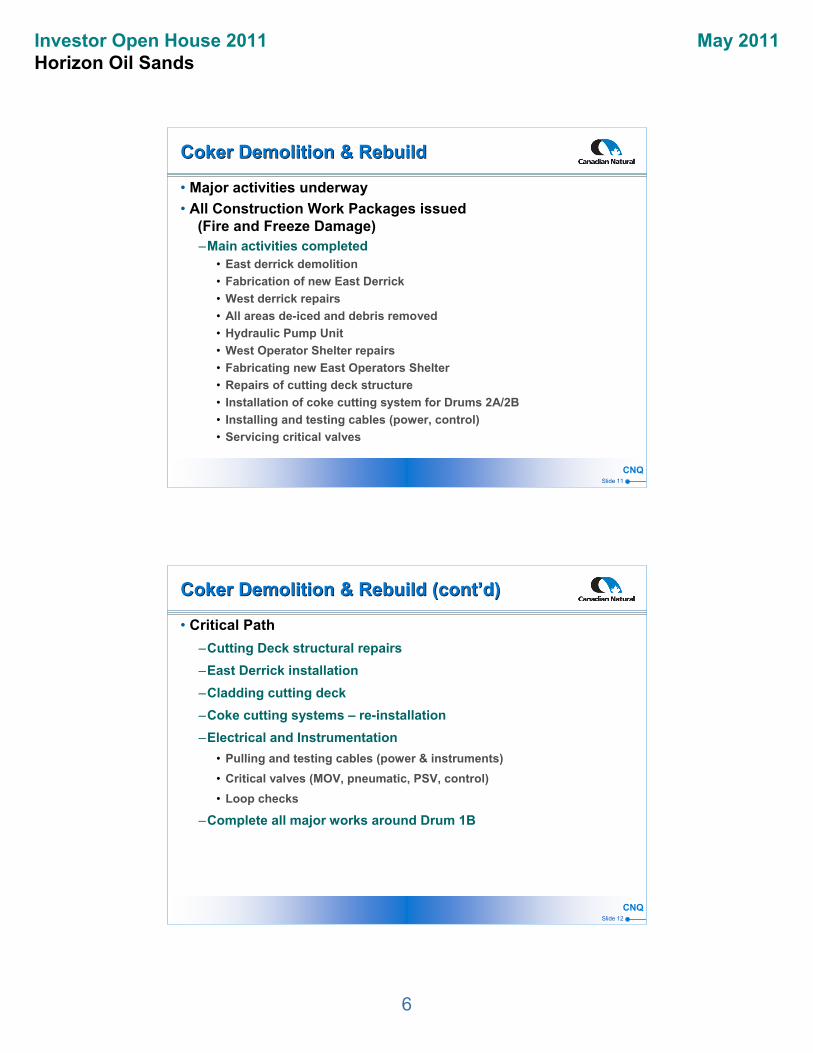
Plot Plan of Plant 33Plot Plan of Plant 33
Plant 33
CNQSlide 10
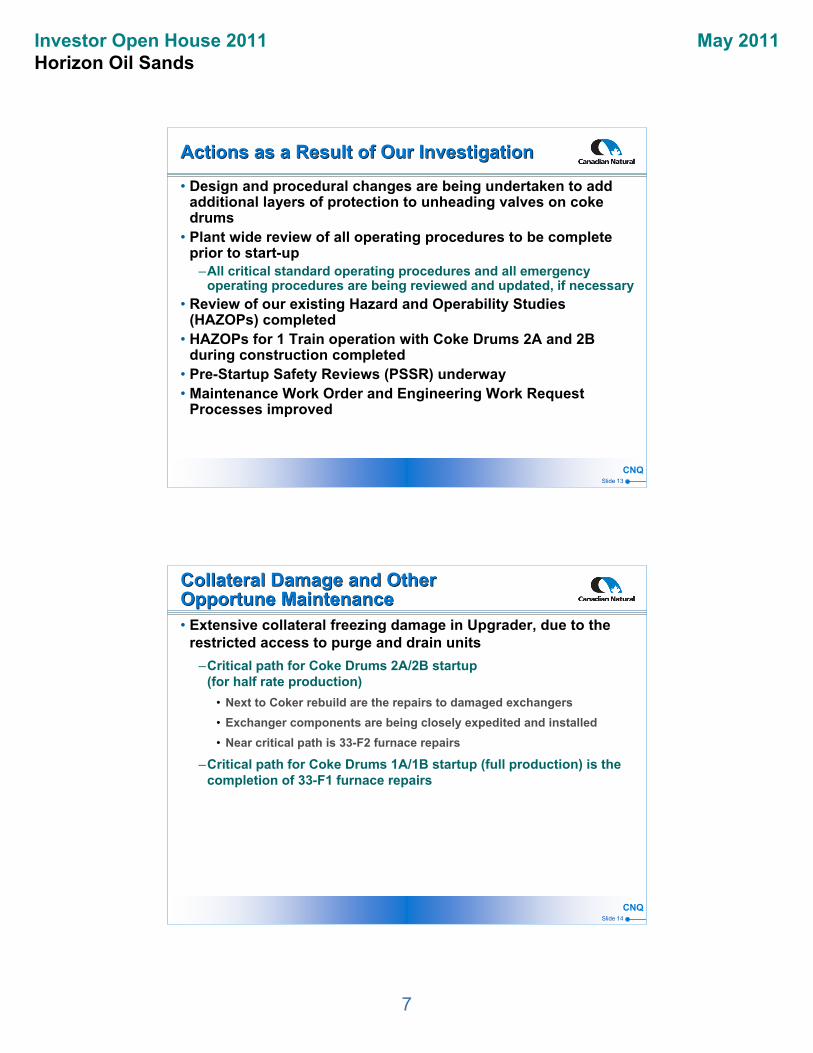
Horizon Business RecoveryHorizon Business Recovery
• Business recovery efforts since the incident
–Making safe, accessing, and inspecting the Coker structure and equipment - under Occupational Health and Safety (OH&S) Stop Work Order
–Assessing collateral damage due to freezing or other damage
– Incident investigation
–Coker structure and equipment demolition and rebuild
–Opportune maintenance, and bringing forward about half of 2012 turnaround work and rescheduling the remainder to 2013
–Operations and plant restart planning
–Ensuring that work is properly documented to meet insurance policy requirements
6
Investor Open House 2011Horizon Oil Sands
May 2011
CNQSlide 11
Coker Demolition & RebuildCoker Demolition & Rebuild
• Major activities underway
• All Construction Work Packages issued(Fire and Freeze Damage)–Main activities completed
• East derrick demolition
• Fabrication of new East Derrick
• West derrick repairs
• All areas de-iced and debris removed
• Hydraulic Pump Unit
• West Operator Shelter repairs
• Fabricating new East Operators Shelter
• Repairs of cutting deck structure
• Installation of coke cutting system for Drums 2A/2B
• Installing and testing cables (power, control)
• Servicing critical valves
CNQSlide 12
• Critical Path
–Cutting Deck structural repairs
–East Derrick installation
–Cladding cutting deck
–Coke cutting systems – re-installation
–Electrical and Instrumentation
• Pulling and testing cables (power & instruments)
• Critical valves (MOV, pneumatic, PSV, control)
• Loop checks
–Complete all major works around Drum 1B
Coker Demolition & Rebuild (cont’d)Coker Demolition & Rebuild (cont’d)
7
Investor Open House 2011Horizon Oil Sands
May 2011
CNQSlide 13
Actions as a Result of Our InvestigationActions as a Result of Our Investigation
• Design and procedural changes are being undertaken to add additional layers of protection to unheading valves on coke drums
• Plant wide review of all operating procedures to be complete prior to start-up
–All critical standard operating procedures and all emergency operating procedures are being reviewed and updated, if necessary
• Review of our existing Hazard and Operability Studies (HAZOPs) completed
• HAZOPs for 1 Train operation with Coke Drums 2A and 2B during construction completed
• Pre-Startup Safety Reviews (PSSR) underway• Maintenance Work Order and Engineering Work Request
Processes improved
CNQSlide 14
Collateral Damage and Other Opportune MaintenanceCollateral Damage and Other Opportune Maintenance• Extensive collateral freezing damage in Upgrader, due to the
restricted access to purge and drain units
–Critical path for Coke Drums 2A/2B startup (for half rate production)
• Next to Coker rebuild are the repairs to damaged exchangers
• Exchanger components are being closely expedited and installed
• Near critical path is 33-F2 furnace repairs
–Critical path for Coke Drums 1A/1B startup (full production) is the completion of 33-F1 furnace repairs
8
Investor Open House 2011Horizon Oil Sands
May 2011
CNQSlide 15
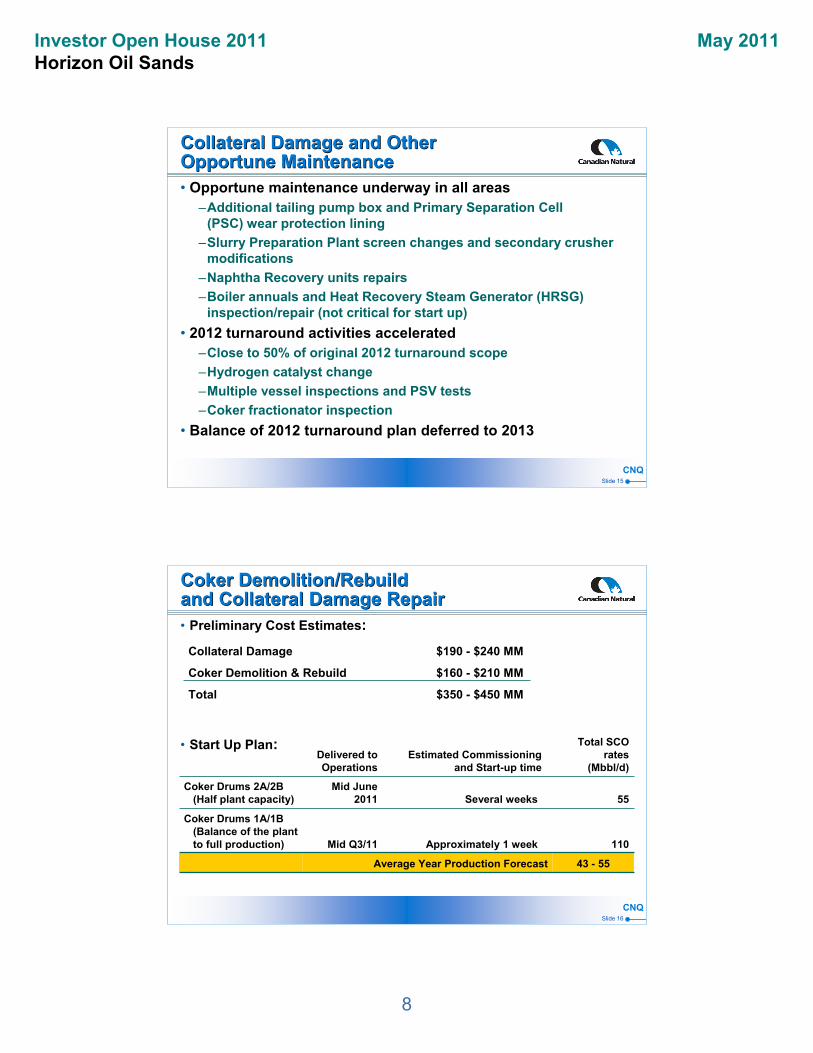
Collateral Damage and Other Opportune MaintenanceCollateral Damage and Other Opportune Maintenance• Opportune maintenance underway in all areas
–Additional tailing pump box and Primary Separation Cell(PSC) wear protection lining
–Slurry Preparation Plant screen changes and secondary crusher modifications
–Naphtha Recovery units repairs
–Boiler annuals and Heat Recovery Steam Generator (HRSG) inspection/repair (not critical for start up)
• 2012 turnaround activities accelerated–Close to 50% of original 2012 turnaround scope
–Hydrogen catalyst change
–Multiple vessel inspections and PSV tests
–Coker fractionator inspection
• Balance of 2012 turnaround plan deferred to 2013
CNQSlide 16
Coker Demolition/Rebuild and Collateral Damage RepairCoker Demolition/Rebuild and Collateral Damage Repair• Preliminary Cost Estimates:
Collateral Damage $190 - $240 MM
Coker Demolition & Rebuild $160 - $210 MM
Total $350 - $450 MM
• Start Up Plan:
43 - 55Average Year Production Forecast
110Approximately 1 weekMid Q3/11
Coker Drums 1A/1B (Balance of the plant to full production)
55Several weeksMid June
2011Coker Drums 2A/2B
(Half plant capacity)
Total SCO rates
(Mbbl/d)Estimated Commissioning
and Start-up timeDelivered to Operations
9
Investor Open House 2011Horizon Oil Sands
May 2011
CNQSlide 17
2011 Operations Look Ahead2011 Operations Look Ahead
• Start up preparation and other activities–Procedures
• All start up & critical procedures are being reviewed and refresher training is currently underway including Emergency Operating Procedures (EOP)
• Independent field walk-downs of critical procedures are also underway–Training
• Front line Supervisory training ongoing• Extensive refresher training has started
–Startup preparations to be completed and verified via PSSR process–Preliminary investigation recommendations are being addressed
• Procedures• Safety, Instrumentation and Systems (SIS) Interlock Devices• Training
• Return our focus to reliable operations–We will embed operating discipline within the implementation of
Process Safety Management (PSM) at Horizon
CNQSlide 18
Environmental PerformanceEnvironmental Performance
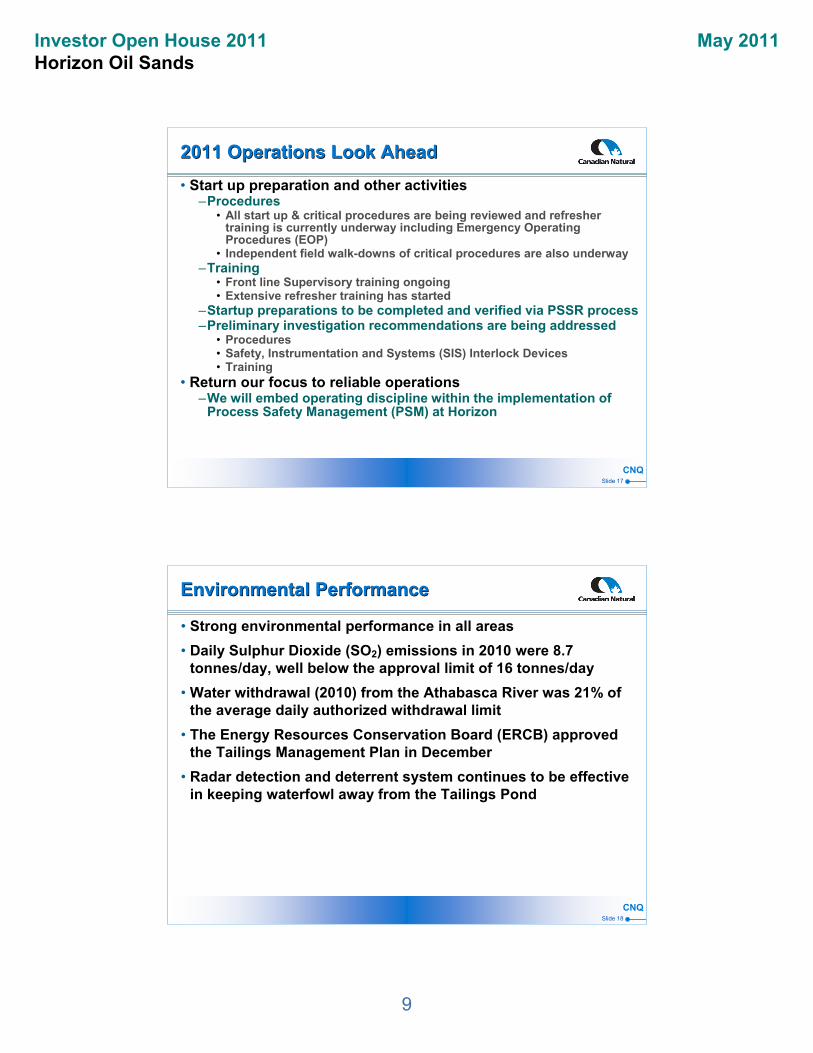
• Strong environmental performance in all areas
• Daily Sulphur Dioxide (SO2) emissions in 2010 were 8.7 tonnes/day, well below the approval limit of 16 tonnes/day
• Water withdrawal (2010) from the Athabasca River was 21% of the average daily authorized withdrawal limit
• The Energy Resources Conservation Board (ERCB) approved the Tailings Management Plan in December
• Radar detection and deterrent system continues to be effective in keeping waterfowl away from the Tailings Pond
10
Investor Open House 2011Horizon Oil Sands
May 2011
CNQSlide 19
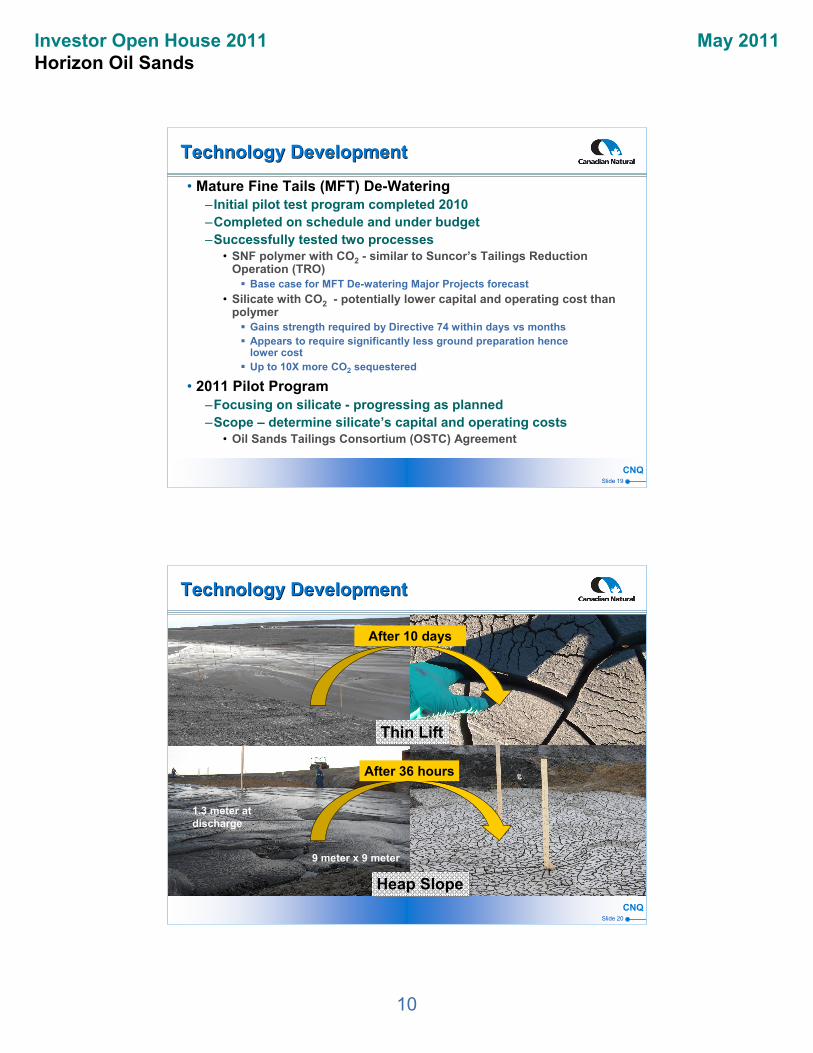
• Mature Fine Tails (MFT) De-Watering– Initial pilot test program completed 2010–Completed on schedule and under budget–Successfully tested two processes
• SNF polymer with CO2 - similar to Suncor’s Tailings Reduction Operation (TRO) Base case for MFT De-watering Major Projects forecast
• Silicate with CO2 - potentially lower capital and operating cost than polymer Gains strength required by Directive 74 within days vs months Appears to require significantly less ground preparation hence
lower cost Up to 10X more CO2 sequestered
• 2011 Pilot Program–Focusing on silicate - progressing as planned–Scope – determine silicate’s capital and operating costs
• Oil Sands Tailings Consortium (OSTC) Agreement
Technology DevelopmentTechnology Development
CNQSlide 20
1.3 meter at discharge
9 meter x 9 meter
Heap SlopeHeap Slope
After 10 days
Thin LiftThin Lift
Technology DevelopmentTechnology Development
After 36 hours
11
Investor Open House 2011Horizon Oil Sands
May 2011
CNQSlide 21
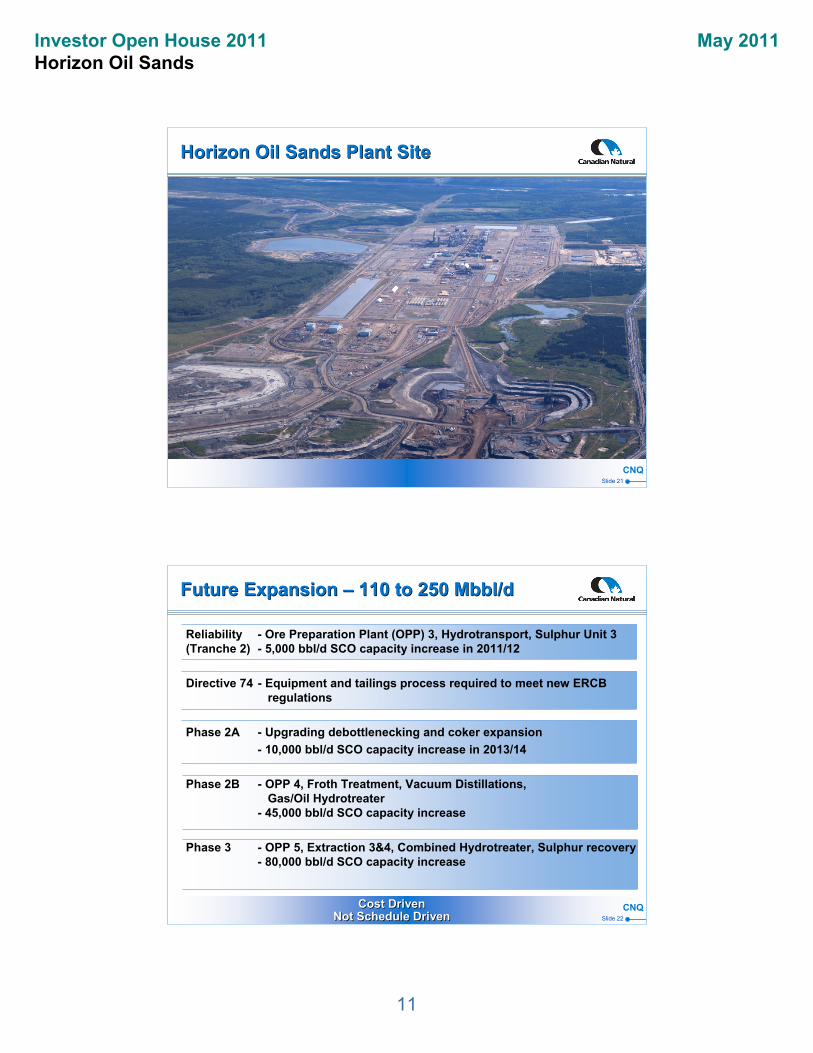
Horizon Oil Sands Plant SiteHorizon Oil Sands Plant Site
CNQSlide 22
Reliability - Ore Preparation Plant (OPP) 3, Hydrotransport, Sulphur Unit 3 (Tranche 2) - 5,000 bbl/d SCO capacity increase in 2011/12
Directive 74 - Equipment and tailings process required to meet new ERCB regulations
Phase 2A - Upgrading debottlenecking and coker expansion
- 10,000 bbl/d SCO capacity increase in 2013/14
Phase 2B - OPP 4, Froth Treatment, Vacuum Distillations, Gas/Oil Hydrotreater
- 45,000 bbl/d SCO capacity increase
Phase 3 - OPP 5, Extraction 3&4, Combined Hydrotreater, Sulphur recovery- 80,000 bbl/d SCO capacity increase
Future Expansion – 110 to 250 Mbbl/dFuture Expansion – 110 to 250 Mbbl/d
Cost Driven Not Schedule Driven
Cost Driven Not Schedule Driven
12
Investor Open House 2011Horizon Oil Sands
May 2011
CNQSlide 23
Expansion Strategyup to 250 Mbbl/d 34º API SCOExpansion Strategyup to 250 Mbbl/d 34º API SCO• Execution strategy
–Debottlenecking and expansion to be combined
–Expansion will be broken into 46 individual projects
• Stop and start at Canadian Natural’s discretion
–Each project (46) will be broken into Engineering & Procurement (E&P) and Construction (C)
• E&P will fully comply with 80%/100% rule used in Phase 1
• Lump sum E&P or lump sum C will be used when possible
• Highly unlikely to use lump sum Engineering, Procurement and Construction (EPC)
–Construction labor force to be capped at 5,500
• Phase 1 peak 10,000
–Yearly capital exposure capped at $2.0 Billion - $2.5 Billion
CNQSlide 24
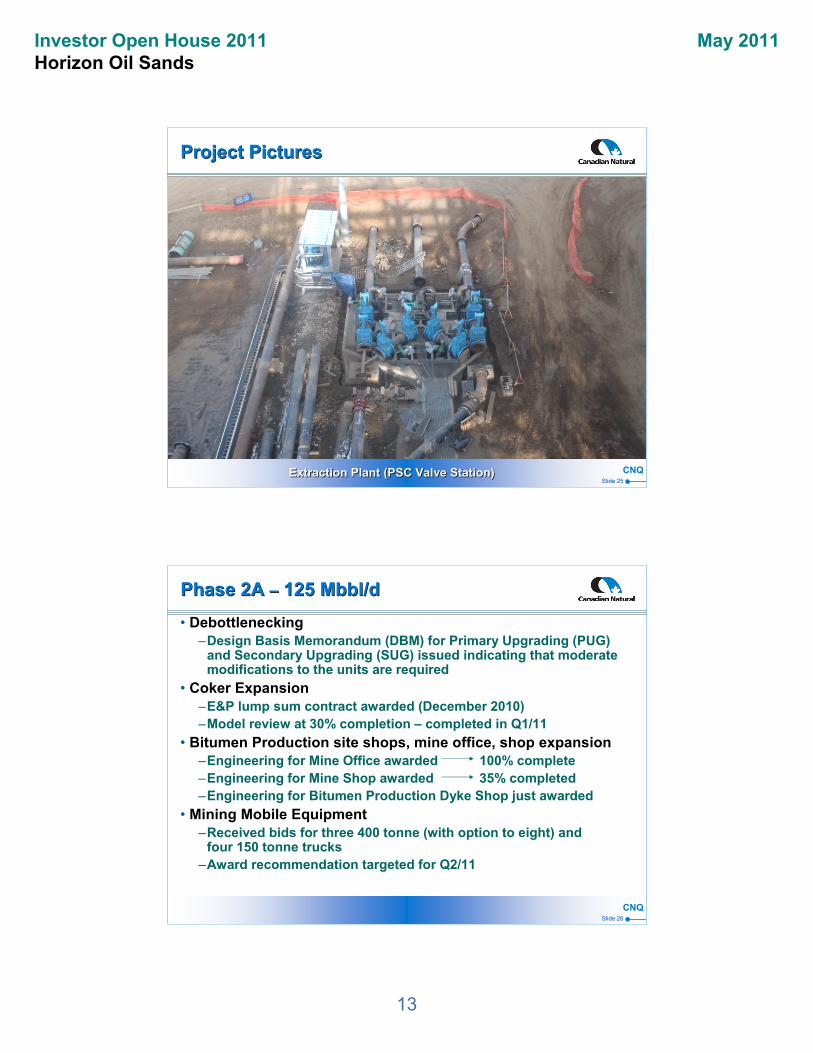
Project PicturesProject Pictures
OPP 3 Area (Surge Bin & Conveyor Systems)
OPP 3 Area (Surge Bin & Conveyor Systems)
13
Investor Open House 2011Horizon Oil Sands
May 2011
CNQSlide 25
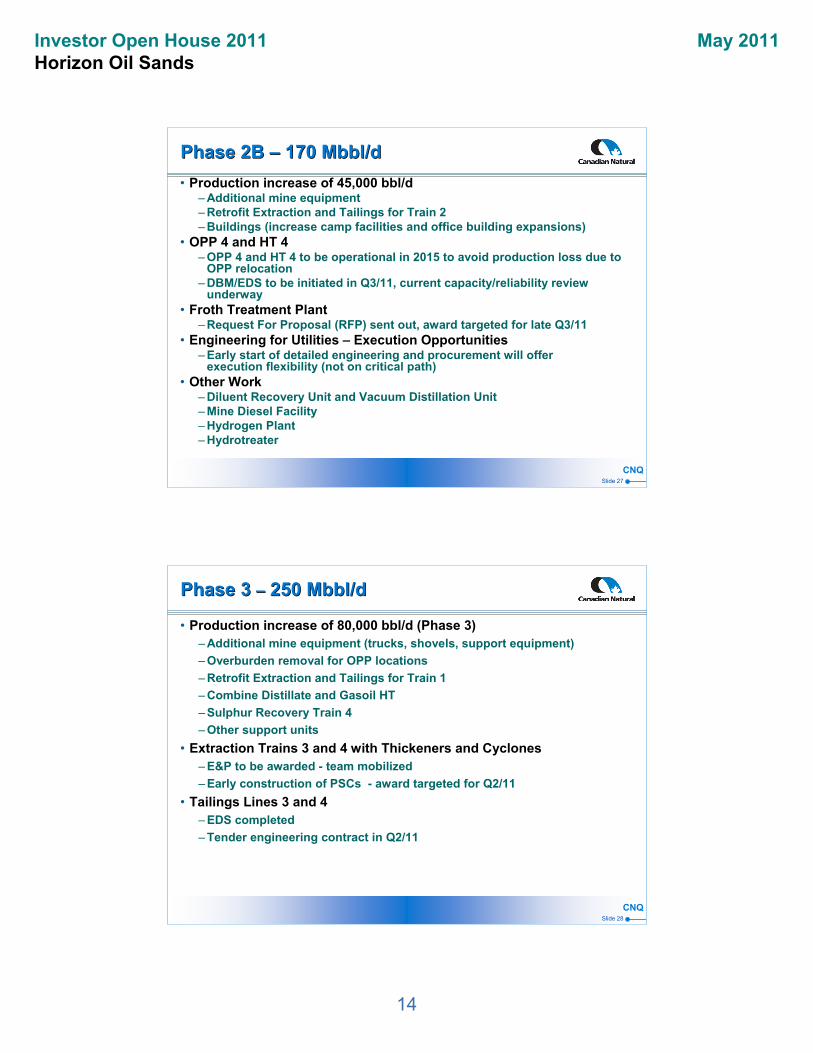
Project PicturesProject Pictures
Extraction Plant (PSC Valve Station)Extraction Plant (PSC Valve Station)
CNQSlide 26
• Debottlenecking –Design Basis Memorandum (DBM) for Primary Upgrading (PUG)
and Secondary Upgrading (SUG) issued indicating that moderate modifications to the units are required
• Coker Expansion–E&P lump sum contract awarded (December 2010)–Model review at 30% completion – completed in Q1/11
• Bitumen Production site shops, mine office, shop expansion–Engineering for Mine Office awarded 100% complete–Engineering for Mine Shop awarded 35% completed–Engineering for Bitumen Production Dyke Shop just awarded
• Mining Mobile Equipment–Received bids for three 400 tonne (with option to eight) and
four 150 tonne trucks–Award recommendation targeted for Q2/11
Phase 2A – 125 Mbbl/dPhase 2A – 125 Mbbl/d
14
Investor Open House 2011Horizon Oil Sands
May 2011
CNQSlide 27
• Production increase of 45,000 bbl/d – Additional mine equipment – Retrofit Extraction and Tailings for Train 2– Buildings (increase camp facilities and office building expansions)
• OPP 4 and HT 4– OPP 4 and HT 4 to be operational in 2015 to avoid production loss due to
OPP relocation– DBM/EDS to be initiated in Q3/11, current capacity/reliability review
underway• Froth Treatment Plant
– Request For Proposal (RFP) sent out, award targeted for late Q3/11• Engineering for Utilities – Execution Opportunities
– Early start of detailed engineering and procurement will offer execution flexibility (not on critical path)
• Other Work– Diluent Recovery Unit and Vacuum Distillation Unit– Mine Diesel Facility– Hydrogen Plant– Hydrotreater
Phase 2B – 170 Mbbl/dPhase 2B – 170 Mbbl/d
CNQSlide 28
Phase 3 – 250 Mbbl/dPhase 3 – 250 Mbbl/d
• Production increase of 80,000 bbl/d (Phase 3)– Additional mine equipment (trucks, shovels, support equipment)
– Overburden removal for OPP locations
– Retrofit Extraction and Tailings for Train 1
– Combine Distillate and Gasoil HT
– Sulphur Recovery Train 4
– Other support units
• Extraction Trains 3 and 4 with Thickeners and Cyclones– E&P to be awarded - team mobilized
– Early construction of PSCs - award targeted for Q2/11
• Tailings Lines 3 and 4– EDS completed
– Tender engineering contract in Q2/11
15
Investor Open House 2011Horizon Oil Sands
May 2011
CNQSlide 29
Project Guiding PrinciplesIncorporation of Lessons LearnedProject Guiding PrinciplesIncorporation of Lessons Learned• Strategies to continue from Phase 1
– “Managed Open Site” labour policy– Front End Loading DBM, EDS (FEL) approach– Utilize good contractors from Phase 1– Continued use of Fly-In, Fly-Out program to leverage Canadian
labour force
• Strategies to Enhance– Strengthen safety focus “No one gets hurt”– Adopt an “Aggressive Modularization Target”, to perform even more
Modularization and work off site– Enforce the “80%/100% Rule” by plant (based on level of design
completion and materials on site) to establish construction “Gates”– Projects segregated to Engineering (E), Procurement (P), (in some cases
E&P), Construction (C)– Construction itself will be broken into pieces (if possible), integrated
sequence of construction (as far as can be practically achieved)– Maximize direct contracting with specialized construction contractors
CNQSlide 30
Project Guiding PrinciplesIncorporation of Lessons Learned (Cont’d)Project Guiding PrinciplesIncorporation of Lessons Learned (Cont’d)
• Strategies to modify, based on previous learnings– Execute for cost certainty, manage projects as cost driven not
schedule driven
– Do not execute as a Mega-Project
– Establish Horizon project “Production Phasing for Profit”, staging production increases over time
– Adherence to Canadian Natural’s Engineering, Procurement, Construction, Pre-commissioning and Commissioning Standards
– Increase the quantity and quality of the “on the ground” supervision that is being done by Canadian Natural personnel
– Minimize winter work: NO “tool in hand” work from Dec 15 to Feb 1
– Be prepared to stop construction if productivity is poor
– Limit construction work force to 5,500
– Limit capital spending to $2.5 Billion per year
– Minimum interference with ongoing (Phase 1) Operations, minimize brown field activities
16
Investor Open House 2011Horizon Oil Sands
May 2011
CNQSlide 31
• We are committed in expanding to 232,000 bbl/d and ultimately 500,000 bbl/d
• Conditions–Cost certainty
–Robust and flexible execution strategy in place
–Ability to generate returns and compete for capital
Decades of Value GrowthDecades of Value Growth
Maximize Value for ShareholdersMaximize Value for Shareholders
THE PREMIUM VALUE DEFINED GROWTH INDEPENDENT
Questions and Answers
-You can find PDF versions of this and other publications from Canadian Natural at: www.cnrl.com
-Documents can be requested by calling our Investor Relations department at: 403-514-7777 or by emailing us at: [email protected]