Embed Size (px)
Citation preview
HORIZON 2020Two years on
Research and Innovation
EUROPEAN COMMISSION
Directorate-General for Research and InnovationDirectorate A – Policy Development and CoordinationUnit A.1 – Internal and external communication
E-mail: [email protected]
European CommissionB-1049 Brussels
EUROPEAN COMMISSION
Directorate-General for Research and InnovationHorizon 20202016 EUR XXXX EN
Horizon 2020 Two years on
Europe Direct is a service to help you find answers to your questions about the European Union
Freephone number (*):00 800 6 7 8 9 10 11
(*) The information given is free, as are most calls (though some operators, phone boxes or hotels may charge you).
LEGAL NOTICE
Neither the European Commission nor any person acting on behalf of the Commission is responsible for the use which might be made of the following information.
More information on the European Union is available on the internet (http://europa.eu).
Luxembourg: Publications Office of the European Union, 2016
Print ISBN 978-92-79-64551-8 doi:10.2777/839838 KI-06-16-357-EN-C
PDF ISBN 978-92-79-64550-1 doi:10.2777/141055 KI-06-16-357-EN-N
© European Union, 2016Reproduction is authorised provided the source is acknowledged.
Cover images, from top left to bottom right: © Lonely, # 46246900, 2011. © ag visuell #16440826, 2011. © Sean Gladwell #6018533, 2011. © LwRedStorm, #3348265. 2011. © kras99, #43746830, 2012. Source: Fotolia.com
FOR
EWO
RD
3
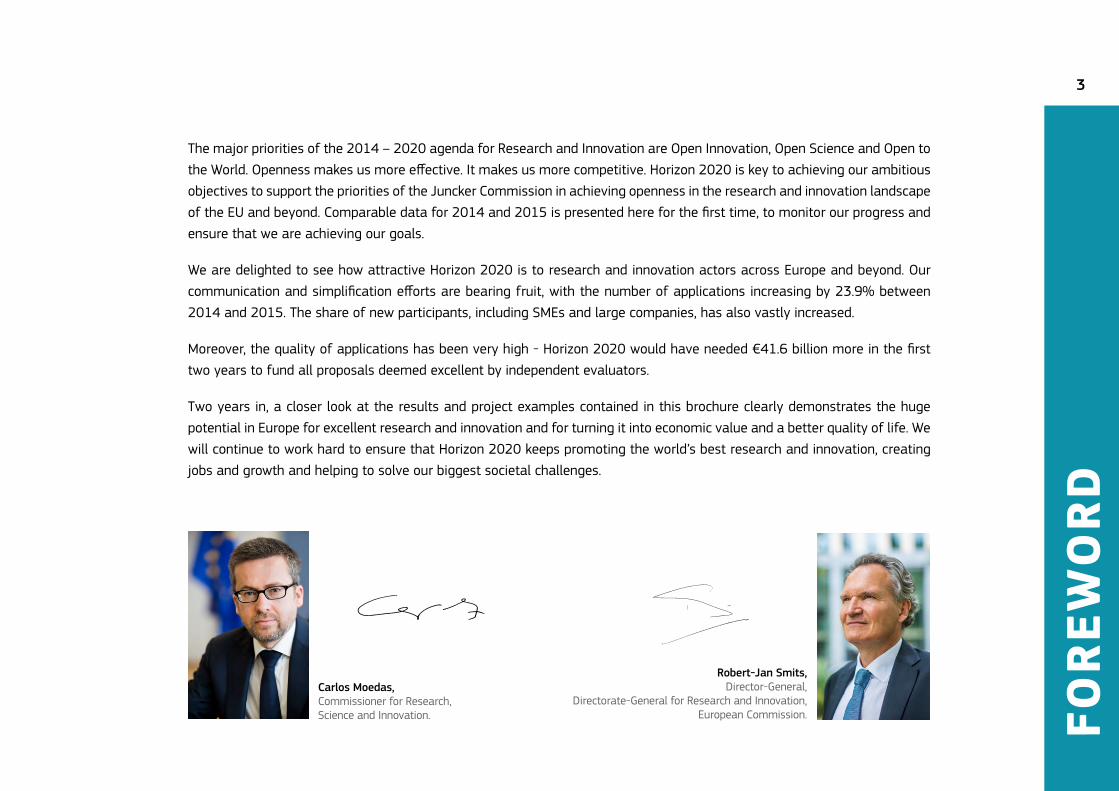
Carlos Moedas, Commissioner for Research, Science and Innovation.
Robert-Jan Smits, Director-General,
Directorate-General for Research and Innovation, European Commission.
The major priorities of the 2014 – 2020 agenda for Research and Innovation are Open Innovation, Open Science and Open to the World. Openness makes us more effective. It makes us more competitive. Horizon 2020 is key to achieving our ambitious objectives to support the priorities of the Juncker Commission in achieving openness in the research and innovation landscape of the EU and beyond. Comparable data for 2014 and 2015 is presented here for the first time, to monitor our progress and ensure that we are achieving our goals.
We are delighted to see how attractive Horizon 2020 is to research and innovation actors across Europe and beyond. Our communication and simplification efforts are bearing fruit, with the number of applications increasing by 23.9% between 2014 and 2015. The share of new participants, including SMEs and large companies, has also vastly increased.
Moreover, the quality of applications has been very high - Horizon 2020 would have needed €41.6 billion more in the first two years to fund all proposals deemed excellent by independent evaluators.
Two years in, a closer look at the results and project examples contained in this brochure clearly demonstrates the huge potential in Europe for excellent research and innovation and for turning it into economic value and a better quality of life. We will continue to work hard to ensure that Horizon 2020 keeps promoting the world’s best research and innovation, creating jobs and growth and helping to solve our biggest societal challenges.
TAB
LE O
F C
ON
TEN
TS4
Foreword 3
Introduction 5
1 APPLICATIONS 6
2 SUCCESS RATES 11
3 SIGNED GRANT AGREEMENTS 16
4 NEWCOMERS 24
5 SME INSTRUMENT 26
6 TIME TO GRANT 29
7 EXPERTS 31
8 SURVEY RESULTS 34
Project Examples 37
Glossary 42
INTR
OD
UC
TIO
N
5
• Over 76,400 eligible proposals were submitted for calls in the first two years of Horizon 2020, requesting a total EU financial contribution of €125.4bn.
• Around 9,200 proposals were retained for funding. The overall success rate of eligible full proposals in the first two years is 11.8%. Oversubscription is therefore a main concern.
• Over 9,000 grant agreements were signed by 1 September 2016, with a budget allocation of over €15.9bn in EU funding.
• More than 90% of all grant agreements were signed within the legal target of eight months.
• Around 49% of the participants in Horizon 2020 are newcomers.
• The 20% budget target for the funding of small and medium-sized enterprises was achieved.
The information in this booklet excludes Horizon 2020 funding related to the European Institute of Innovation and Technology (EIT), Public-Public Partnerships, some Public-Private Partnerships and the financial instruments under Horizon 2020.
For more detailed information on participations and implementation of the first two years of Horizon 2020, please see the Monitoring Report 2015.
KEY FACTS AND FIGURES FIRST TWO YEARS
1APPLICATIONS
7
1538
8
1456
0
1334
9
1303
8
9615
7156
4540
4038
3660
3149
3062
2699
2833
2287
1948
1655
1403
1429
1309
828
741
656
635
617
430
347
369
214
3998
1856
6
1696
9
1760
6
1581
1
1121
9
8414
5531
4687
4250
3717
3717
3366
3203
3240
2456
1924
1777
1674
1790
1137
773
840
809
775
674
591
380
263
4863
0
2000
4000
6000
8000
10000
12000
14000
16000
18000
20000
UK DE IT ES FR NL BE EL SE AT PT DK FI PL IE HU SI RO CZ BG CY HR EE SK LT LV LU MT EU Average
2014 2015
APP
LIC
ATIO
NS
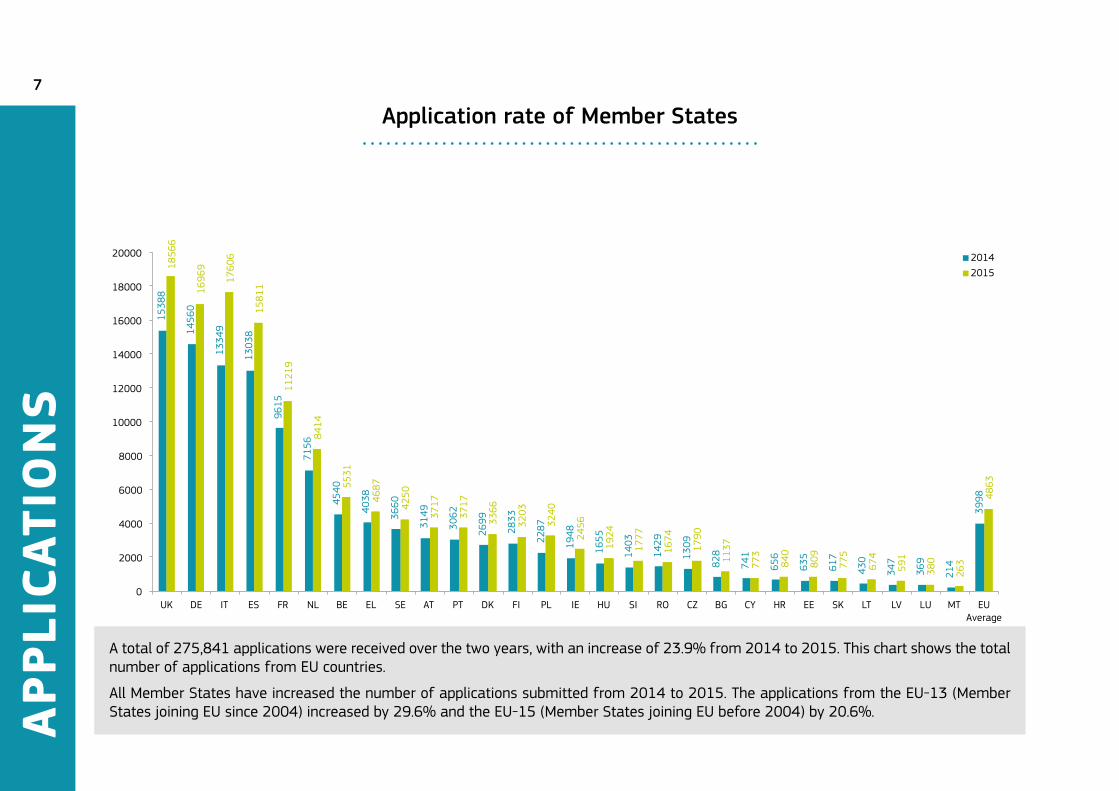
A total of 275,841 applications were received over the two years, with an increase of 23.9% from 2014 to 2015. This chart shows the total number of applications from EU countries.
All Member States have increased the number of applications submitted from 2014 to 2015. The applications from the EU-13 (Member States joining EU since 2004) increased by 29.6% and the EU-15 (Member States joining EU before 2004) by 20.6%.
Application rate of Member States
8
APP
LIC
ATIO
NS
Application rate of Member States per inhabitant
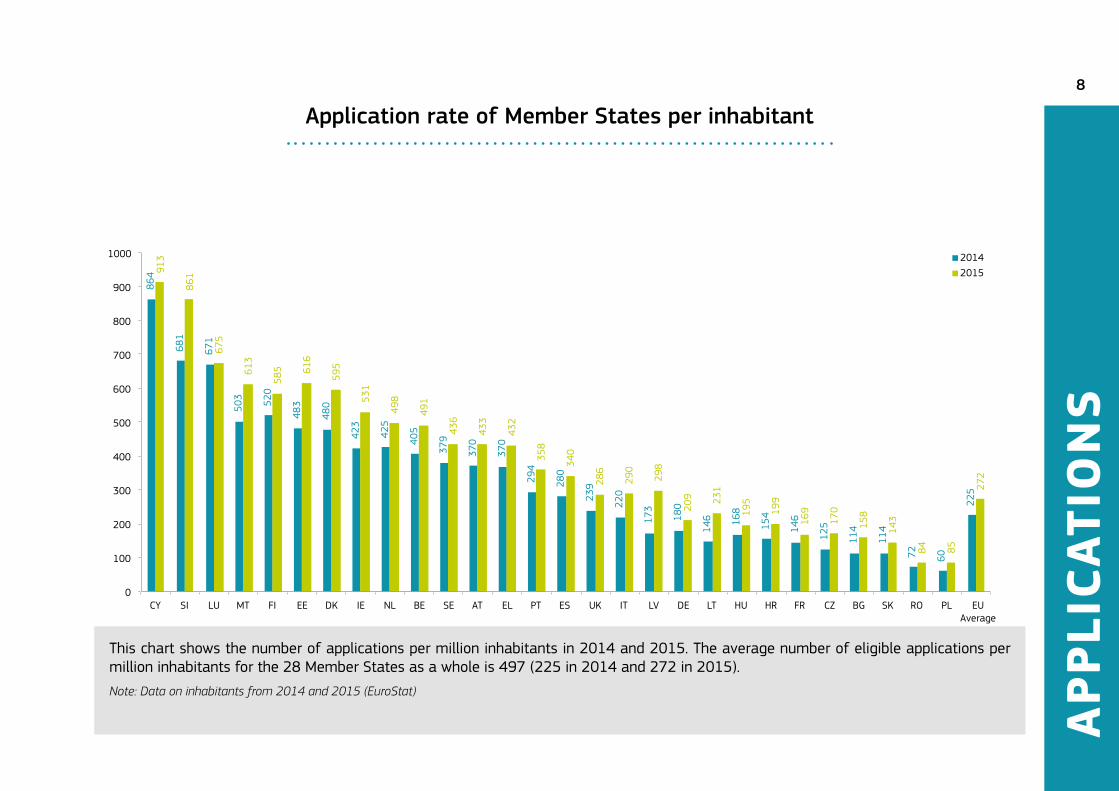
This chart shows the number of applications per million inhabitants in 2014 and 2015. The average number of eligible applications per million inhabitants for the 28 Member States as a whole is 497 (225 in 2014 and 272 in 2015). Note: Data on inhabitants from 2014 and 2015 (EuroStat)
864
681
671
503 520
483
480
423
425
405
379
370
370
294
280
239
220
173
180
146 16
8
154
146
125
114
114
72
60
225
913
861
675
613
585 61
6
595
531
498
491
436
433
432
358
340
286
290
298
209 23
1
195
199
169
170
158
143
84
85
272
0
100
200
300
400
500
600
700
800
900
1000
CY SI LU MT FI EE DK IE NL BE SE AT EL PT ES UK IT LV DE LT HU HR FR CZ BG SK RO PL EU Average
2014 2015
9
2133
1748
1642
1038
507
171
189
112
53
55
48
29
13
3418
2092
1997
1536
725
419
205
199
138
115
108
65
17
0
500
1000
1500
2000
2500
3000
3500
4000
Switzerland Norway Israel Turkey Serbia Ukraine Iceland FYR of Macedonia
Bosnia and Herzegovina
Republic of Moldova
Albania Montenegro Faroe Islands
2014 2015
APP
LIC
ATIO
NS
9
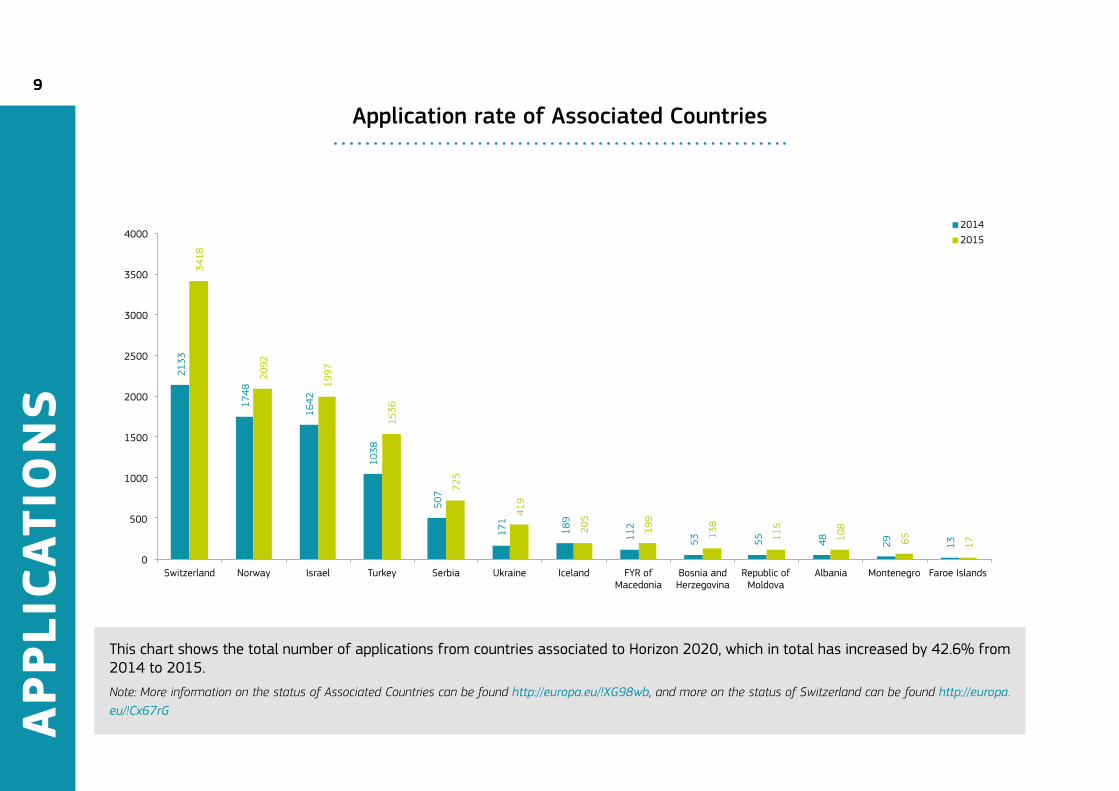
This chart shows the total number of applications from countries associated to Horizon 2020, which in total has increased by 42.6% from 2014 to 2015.Note: More information on the status of Associated Countries can be found http://europa.eu/!XG98wb, and more on the status of Switzerland can be found http://europa.eu/!Cx67rG
Application rate of Associated Countries
10
APP
LIC
ATIO
NS
10
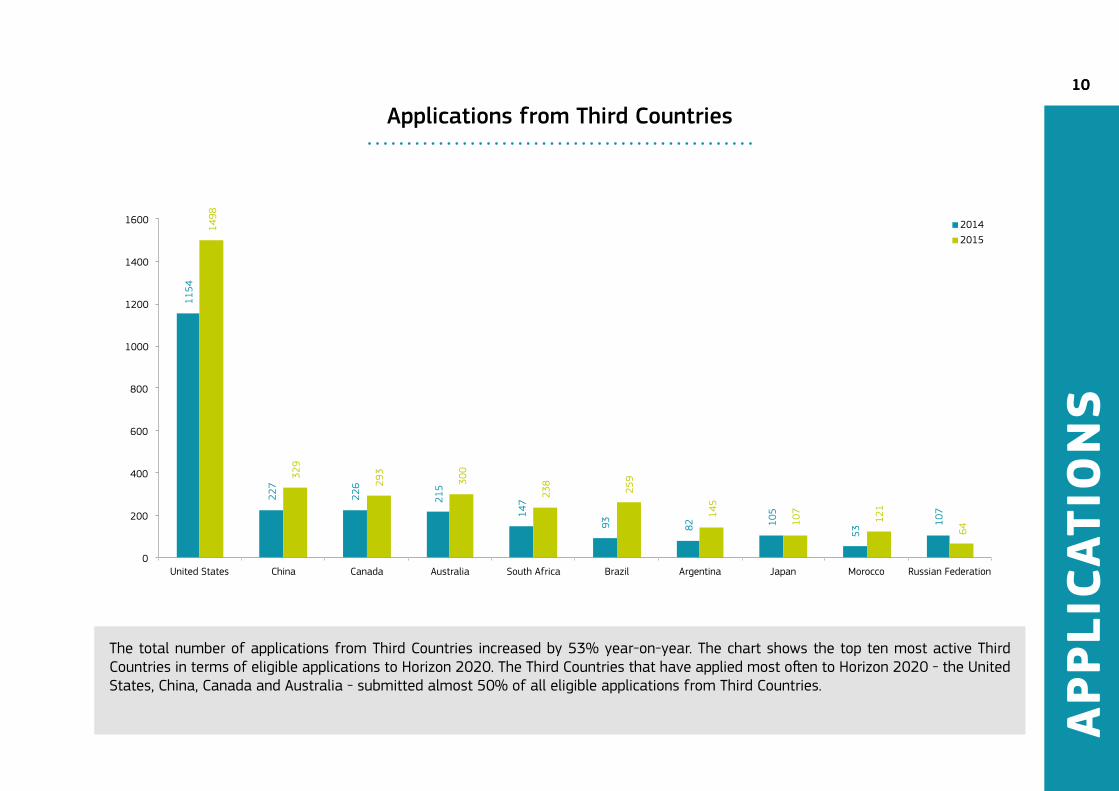
Applications from Third Countries
The total number of applications from Third Countries increased by 53% year-on-year. The chart shows the top ten most active Third Countries in terms of eligible applications to Horizon 2020. The Third Countries that have applied most often to Horizon 2020 - the United States, China, Canada and Australia - submitted almost 50% of all eligible applications from Third Countries.
1154
227
226
215
147
93
82
105
53 10
7
1498
329
293
300
238
259
145
107
121
64
0
200
400
600
800
1000
1200
1400
1600
United States China Canada Australia South Africa Brazil Argentina Japan Morocco Russian Federation
2014 2015
2SUCCESS RATES
12
13,2%
86,8%
10,7%
89,3%
11,8%
88,2%
Proposals not retained for funding Proposals retained for funding
SUC
CES
S R
ATES
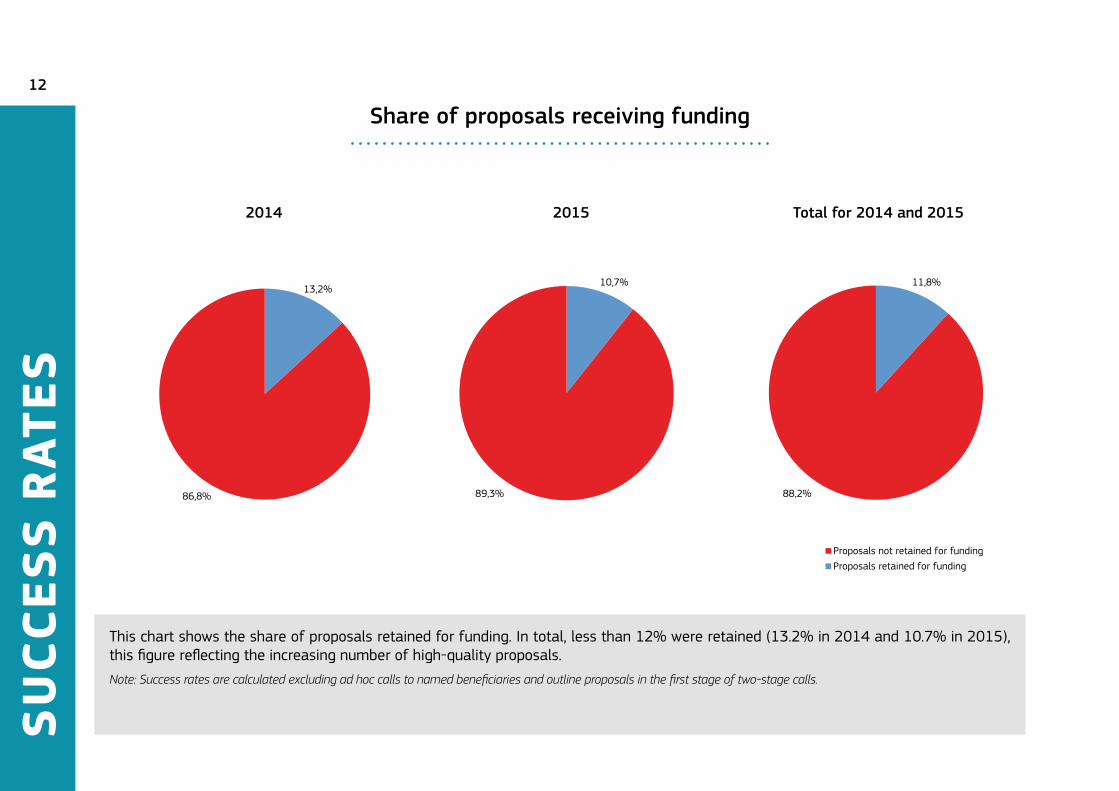
This chart shows the share of proposals retained for funding. In total, less than 12% were retained (13.2% in 2014 and 10.7% in 2015), this figure reflecting the increasing number of high-quality proposals.Note: Success rates are calculated excluding ad hoc calls to named beneficiaries and outline proposals in the first stage of two-stage calls.
Share of proposals receiving funding
Total for 2014 and 201520152014
13
SUC
CES
S R
ATES
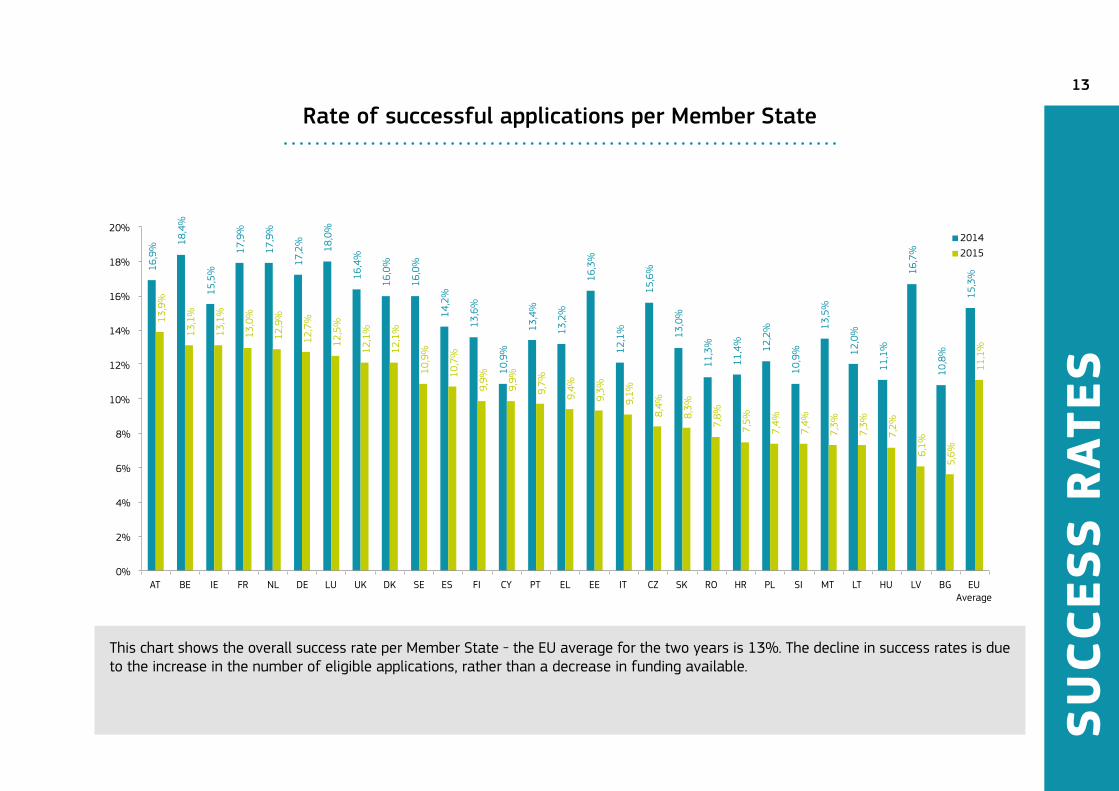
This chart shows the overall success rate per Member State - the EU average for the two years is 13%. The decline in success rates is due to the increase in the number of eligible applications, rather than a decrease in funding available.
Rate of successful applications per Member State 16
,9%
18,4
%
15,5
%
17,9
%
17,9
%
17,2
%
18,0
%
16,4
%
16,0
%
16,0
%
14,2
%
13,6
%
10,9
%
13,4
%
13,2
%
16,3
%
12,1
%
15,6
%
13,0
%
11,3
%
11,4
%
12,2
%
10,9
%
13,5
%
12,0
%
11,1
%
16,7
%
10,8
%
15,3
%
13,9
%
13,1
%
13,1
%
13,0
%
12,9
%
12,7
%
12,5
%
12,1
%
12,1
%
10,9
%
10,7
%
9,9%
9,9%
9,7%
9,4%
9,3%
9,1%
8,4%
8,3%
7,8%
7,5%
7,4%
7,4%
7,3%
7,3%
7,2%
6,1%
5,6%
11,1
%
0%
2%
4%
6%
8%
10%
12%
14%
16%
18%
20%
AT BE IE FR NL DE LU UK DK SE ES FI CY PT EL EE IT CZ SK RO HR PL SI MT LT HU LV BG EU Average
2014 2015
14
24,2
%
20,8
%
18,2
%
15,4
%
13,8
%
14,3
%
18,2
%
13,9
%
13,3
%
11,2
%
10,4
%
10,1
%
0%
5%
10%
15%
20%
25%
30%
Public Bodies Other Entities Research Organisations EU Average Universities Private Sector
2014 2015
SUC
CES
S R
ATES
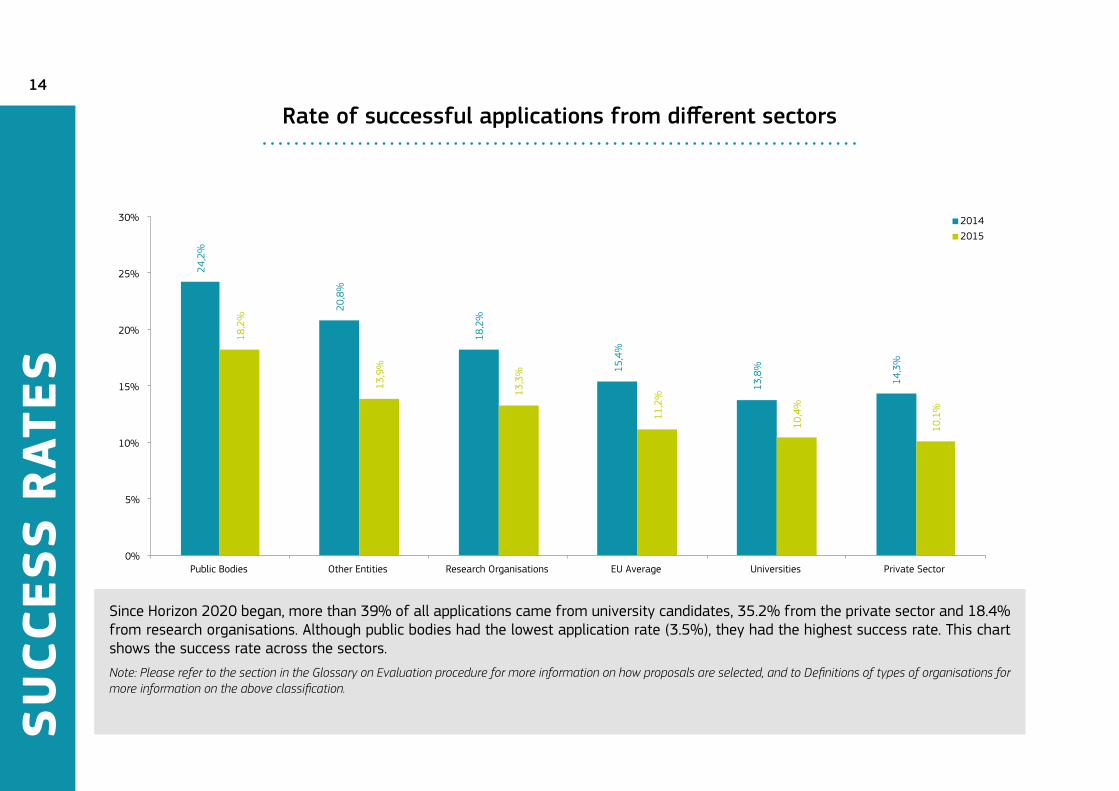
Since Horizon 2020 began, more than 39% of all applications came from university candidates, 35.2% from the private sector and 18.4% from research organisations. Although public bodies had the lowest application rate (3.5%), they had the highest success rate. This chart shows the success rate across the sectors. Note: Please refer to the section in the Glossary on Evaluation procedure for more information on how proposals are selected, and to Definitions of types of organisations for more information on the above classification.
Rate of successful applications from different sectors
15
SUC
CES
S R
ATES
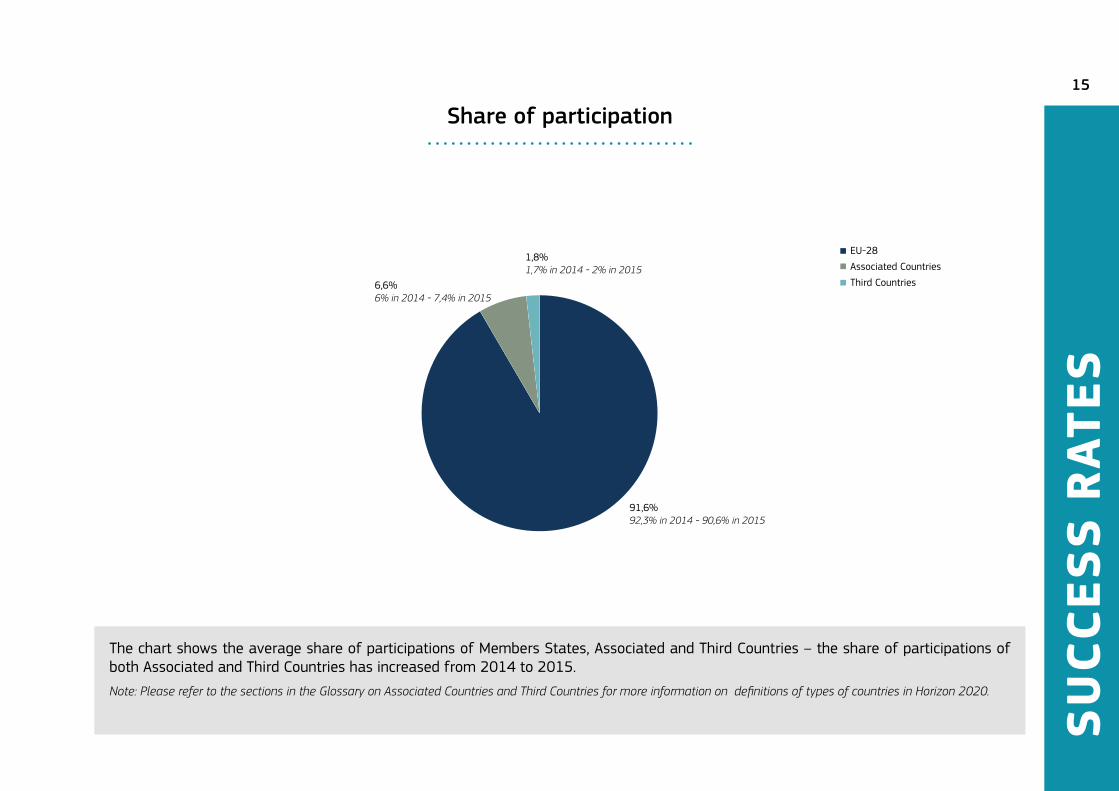
The chart shows the average share of participations of Members States, Associated and Third Countries – the share of participations of both Associated and Third Countries has increased from 2014 to 2015.Note: Please refer to the sections in the Glossary on Associated Countries and Third Countries for more information on definitions of types of countries in Horizon 2020.
Share of participation
91,6%92,3% in 2014 - 90,6% in 2015
6,6%6% in 2014 - 7,4% in 2015
1,8%1,7% in 2014 - 2% in 2015
EU-28
Associated Countries
Third Countries
3SIGNED GRANT
AGREEMENTS
17
2014 2015
13,5
%
13,3
%
10,0
%
9,0%
9,2%
6,6%
4,4%
2,7%
3,0%
2,9%
2,2%
2,2%
2,1%
1,6%
1,6%
1,1%
1,0%
1,0%
0,9%
0,5%
0,6%
0,6%
0,4%
0,4%
0,3%
0,4%
0,3%
0,2%
3,6%
13,3
%
12,9
%
10,4
%
9,7%
8,5%
6,3%
4,3%
3,0%
2,8%
2,7%
2,5%
2,2%
1,9%
1,9%
1,5%
0,9%
0,8%
0,8%
0,8%
0,5%
0,5%
0,4%
0,4%
0,4%
0,3%
0,3%
0,2%
0,1%
3,6%
0,0%
2,0%
4,0%
6,0%
8,0%
10,0%
12,0%
14,0%
16,0%
UK DE ES IT FR NL BE AT SE EL DK PT FI IE PL CZ HU RO SI CY EE BG HR SK LT LU LV MT EU Average
SIG
NED
GR
AN
T A
GR
EEM
ENTS
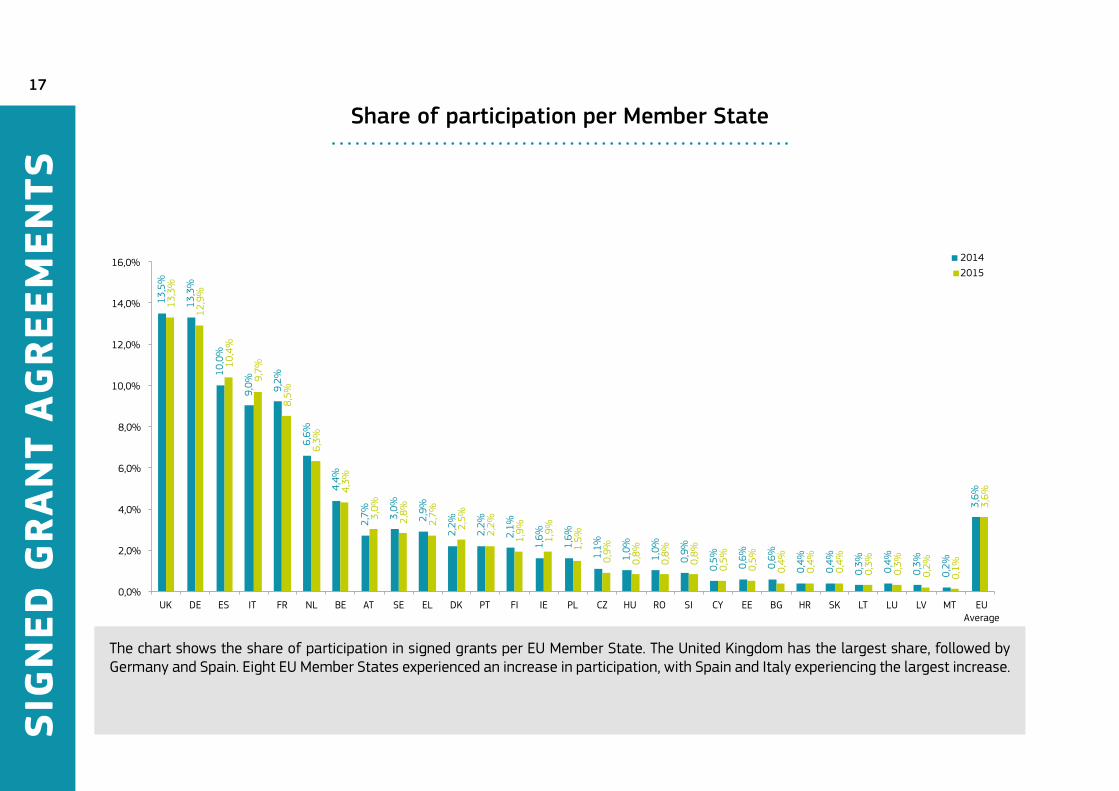
The chart shows the share of participation in signed grants per EU Member State. The United Kingdom has the largest share, followed by Germany and Spain. Eight EU Member States experienced an increase in participation, with Spain and Italy experiencing the largest increase.
Share of participation per Member State
18
SIG
NED
GR
AN
T A
GR
EEM
ENTS
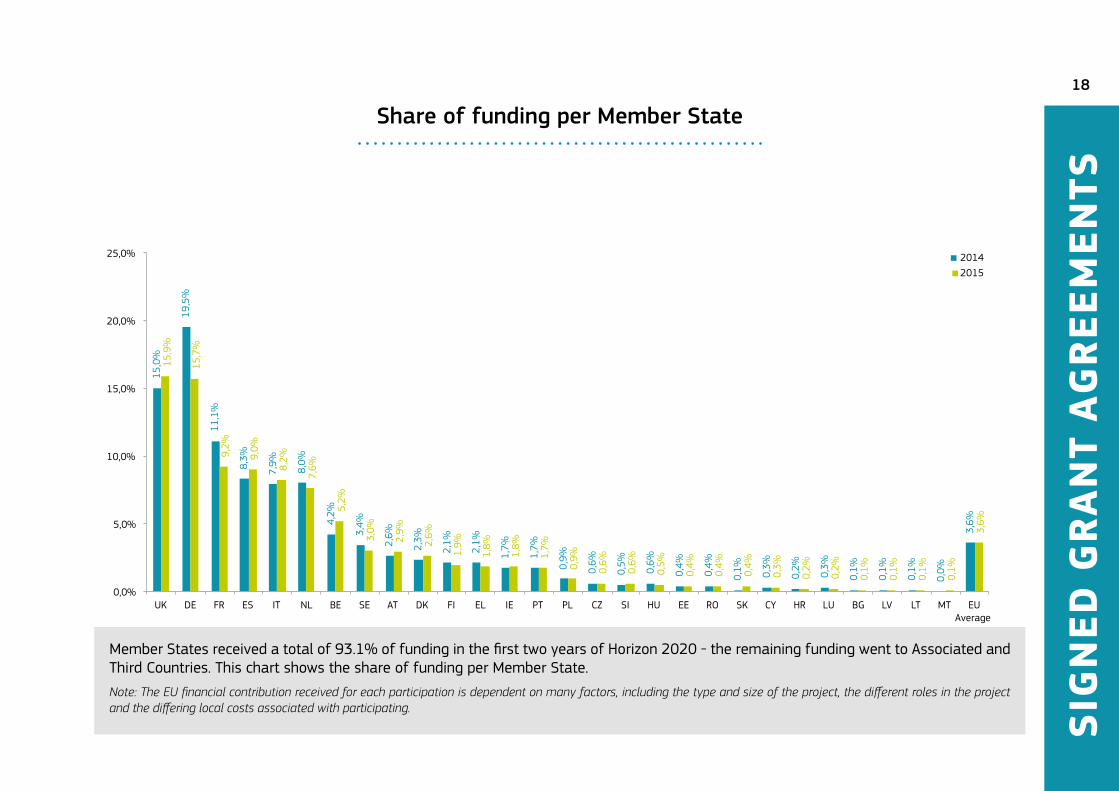
Member States received a total of 93.1% of funding in the first two years of Horizon 2020 - the remaining funding went to Associated and Third Countries. This chart shows the share of funding per Member State. Note: The EU financial contribution received for each participation is dependent on many factors, including the type and size of the project, the different roles in the project and the differing local costs associated with participating.
Share of funding per Member State15
,0%
19,5
%
11,1
%
8,3%
7,9%
8,0%
4,2%
3,4%
2,6%
2,3%
2,1%
2,1%
1,7%
1,7%
0,9%
0,6%
0,5%
0,6%
0,4%
0,4%
0,1%
0,3%
0,2%
0,3%
0,1%
0,1%
0,1%
0,0%
3,6%
15,9
%
15,7
%
9,2%
9,0%
8,2%
7,6%
5,2%
3,0%
2,9%
2,6%
1,9%
1,8%
1,8%
1,7%
0,9%
0,6%
0,6%
0,5%
0,4%
0,4%
0,4%
0,3%
0,2%
0,2%
0,1%
0,1%
0,1%
0,1%
3,6%
0,0%
5,0%
10,0%
15,0%
20,0%
25,0%
UK DE FR ES IT NL BE SE AT DK FI EL IE PT PL CZ SI HU EE RO SK CY HR LU BG LV LT MT EU Average
2014 2015
19
€32,
0
€40,
2
€35,
0
€41,
3
€32,
0
€32,
4
€31,
7
€26,
2
€29,
9
€23,
0
€20,
4
€19,
7
€8,0
€20,
4
€15,
1
€16,
6
€13,
9
€14,
3
€11,
0
€1,9
€4,9
€4,8
€5,4
€2,5
€3,4
€1,9
€1,6
€1,7
€15,
8
€34,
3
€33,
7
€33,
7
€30,
2
€29,
2
€25,
4
€25,
3
€25,
2
€23,
2
€20,
6
€20,
4
€18,
2
€15,
1
€14,
4
€14,
4
€12,
6
€12,
0
€10,
3
€10,
0
€5,4
€4,2
€4,0
€3,8
€3,4
€3,1
€1,8
€1,4
€1,4
€13,
4
€0,0
€5,0
€10,0
€15,0
€20,0
€25,0
€30,0
€35,0
€40,0
€45,0
BE NL DK LU IE FI CY AT SE EE SI UK MT DE ES EL PT FR IT SK CZ HU LV LT HR PL RO BG EU28
2014 2015
SIG
NED
GR
AN
T A
GR
EEM
ENTS
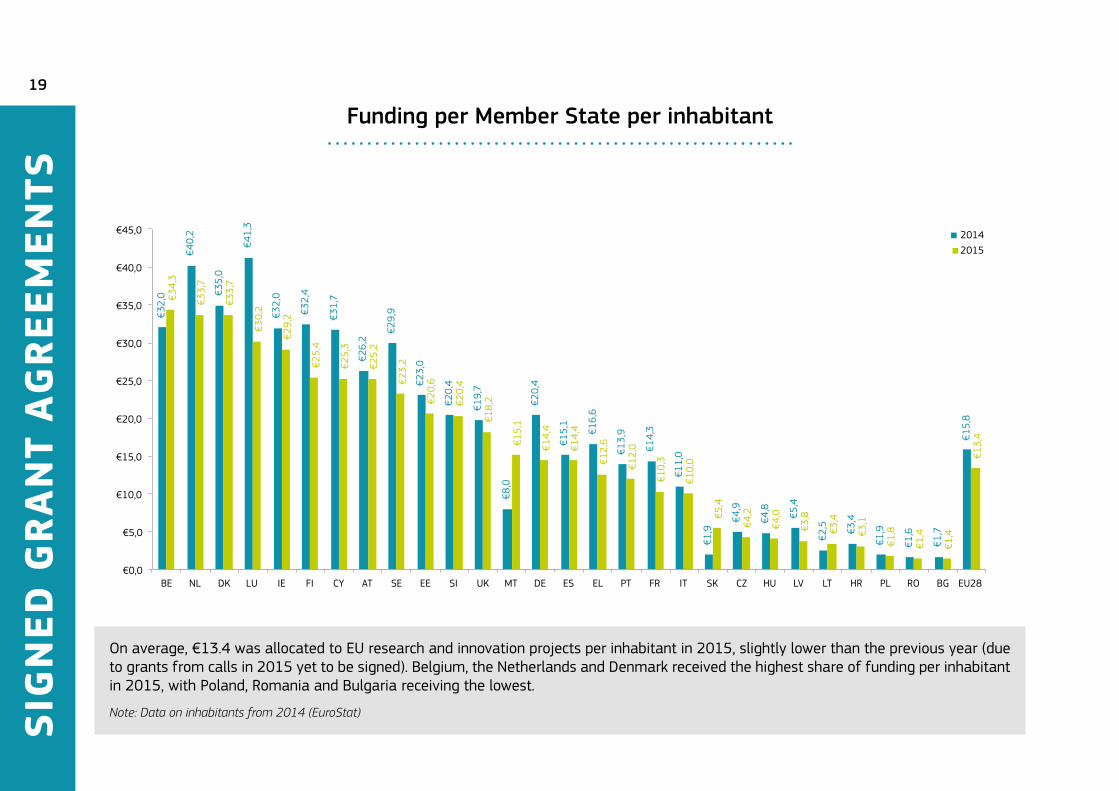
On average, €13.4 was allocated to EU research and innovation projects per inhabitant in 2015, slightly lower than the previous year (due to grants from calls in 2015 yet to be signed). Belgium, the Netherlands and Denmark received the highest share of funding per inhabitant in 2015, with Poland, Romania and Bulgaria receiving the lowest.
Note: Data on inhabitants from 2014 (EuroStat)
Funding per Member State per inhabitant
20
SIG
NED
GR
AN
T A
GR
EEM
ENTS
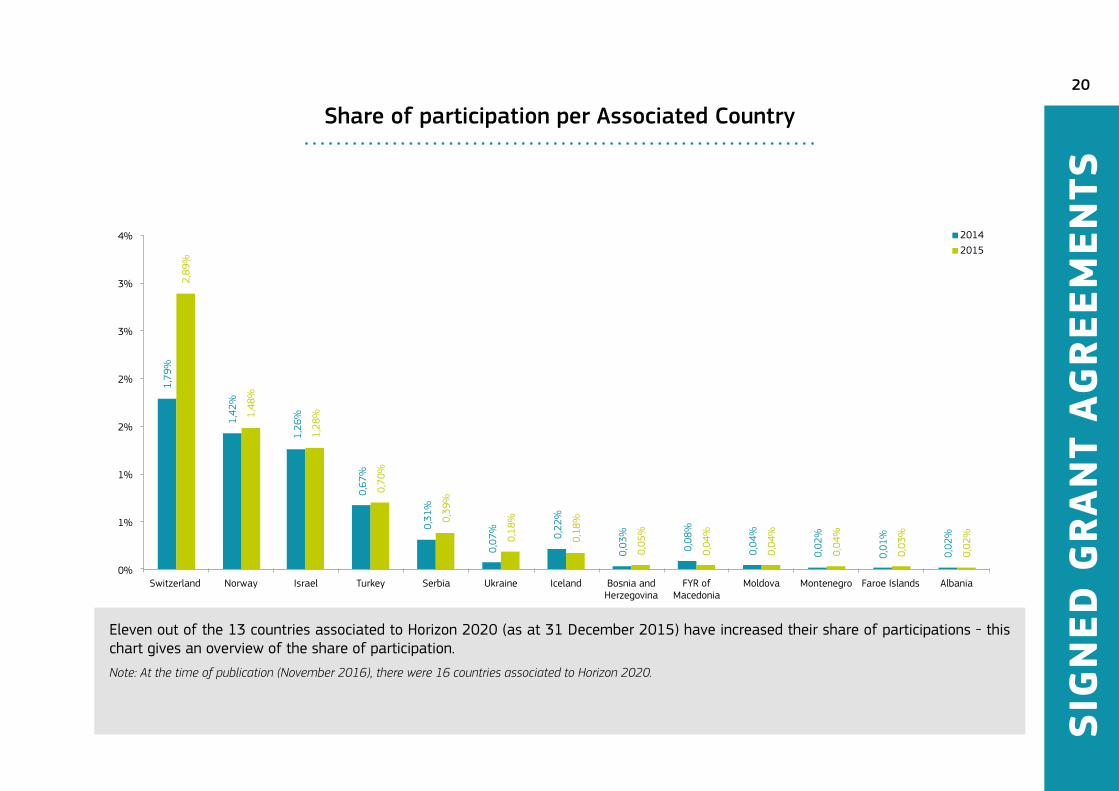
Eleven out of the 13 countries associated to Horizon 2020 (as at 31 December 2015) have increased their share of participations - this chart gives an overview of the share of participation.Note: At the time of publication (November 2016), there were 16 countries associated to Horizon 2020.
Share of participation per Associated Country
1,79
%
1,42
%
1,26
%
0,67
%
0,31
%
0,07
%
0,22
%
0,03
%
0,08
%
0,04
%
0,02
%
0,01
%
0,02
%
2,89
%
1,48
%
1,28
%
0,70
%
0,39
%
0,18
%
0,18
%
0,05
%
0,04
%
0,04
%
0,04
%
0,03
%
0,02
%
0%
1%
1%
2%
2%
3%
3%
4%
Switzerland Norway Israel Turkey Serbia Ukraine Iceland Bosnia and Herzegovina
Moldova Montenegro Faroe Islands Albania
2014 2015
FYR of Macedonia
21
0,18
%
0,16
%
0,15
%
0,13
%
0,08
%
0,12
%
0,08
%
0,06
%
0,05
%
0,03
%
0,29
%
0,17
%
0,17
%
0,08
%
0,10
%
0,04
% 0,
07%
0,07
%
0,04
%
0,05
%
0,00%
0,05%
0,10%
0,15%
0,20%
0,25%
0,30%
0,35%
United States South Africa People's Republicof China
Canada Australia Russian Federation Brazil Kenya Taiwan Republic of Korea
2014 2015
SIG
NED
GR
AN
T A
GR
EEM
ENTS
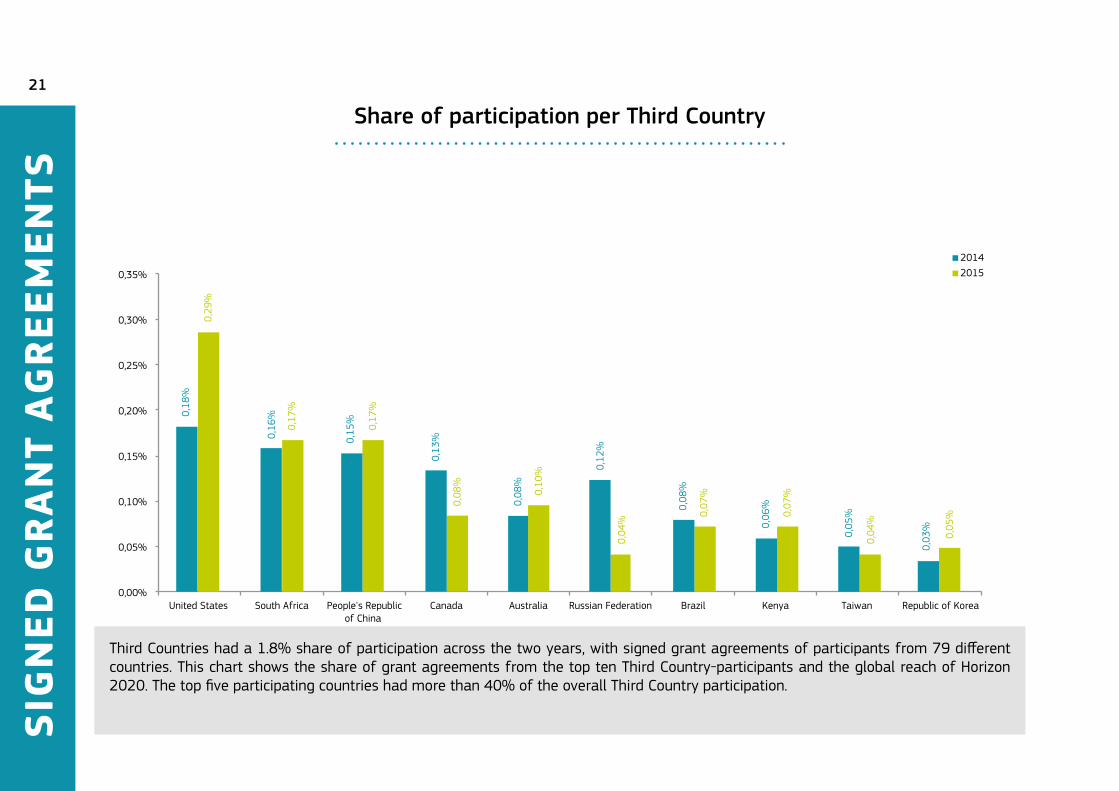
Third Countries had a 1.8% share of participation across the two years, with signed grant agreements of participants from 79 different countries. This chart shows the share of grant agreements from the top ten Third Country-participants and the global reach of Horizon 2020. The top five participating countries had more than 40% of the overall Third Country participation.
Share of participation per Third Country
22
SIG
NED
GR
AN
T A
GR
EEM
ENTS
2014 2015
33,8
%
31,0
%
23,1
%
6,4%
5,8%
35,4
%
32,6
%
21,5
%
5,7%
4,8%
0,0%
5,0%
10,0%
15,0%
20,0%
25,0%
30,0%
35,0%
40,0%
Universities (HES) Private Sector (PRC)
Research Organisations
(REC)
Public Bodies (PUB)
Other Entities (OTH)
38,1
%
26,0
%
30,0
%
3,5%
2,4%
41,3
%
27,4
%
23,4
%
4,1%
3,7%
0,0%
5,0%
10,0%
15,0%
20,0%
25,0%
30,0%
35,0%
40,0%
45,0%
Universities (HES) Private Sector (PRC)
Research Organisations
(REC)
Public Bodies (PUB)
Other Entities (OTH)
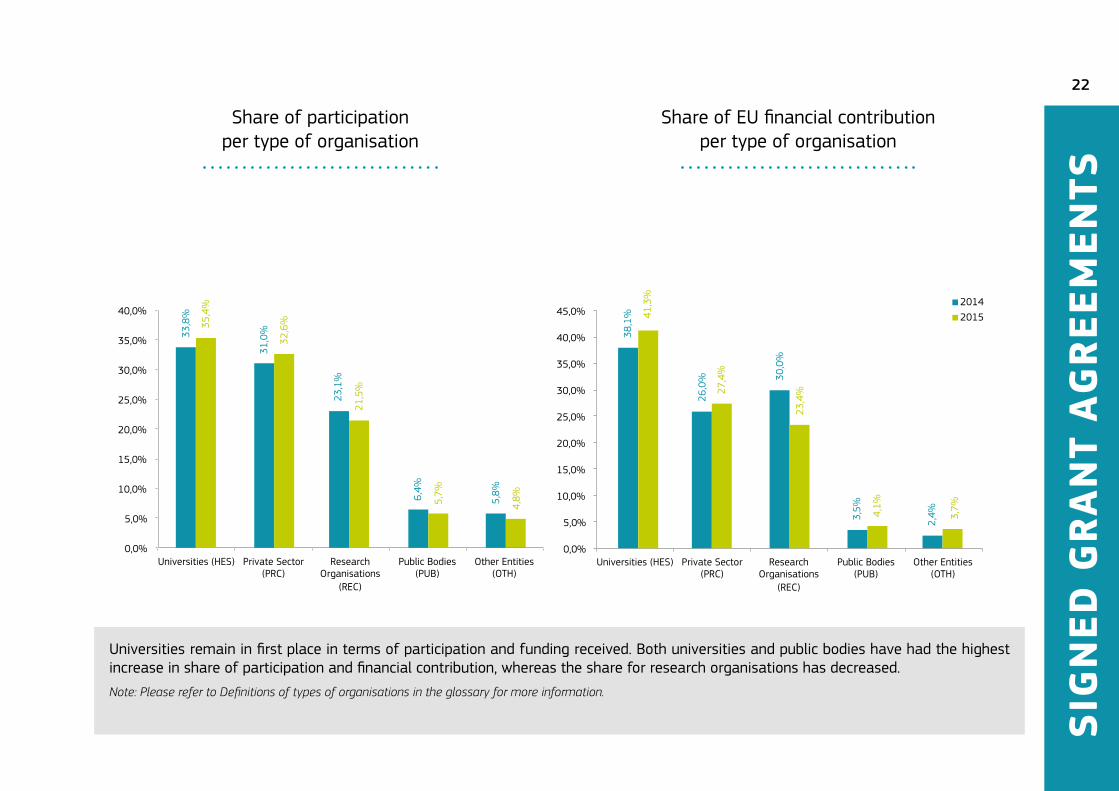
Share of participation per type of organisation
Share of EU financial contribution per type of organisation
Universities remain in first place in terms of participation and funding received. Both universities and public bodies have had the highest increase in share of participation and financial contribution, whereas the share for research organisations has decreased.Note: Please refer to Definitions of types of organisations in the glossary for more information.
23
SIG
NED
GR
AN
T A
GR
EEM
ENTS
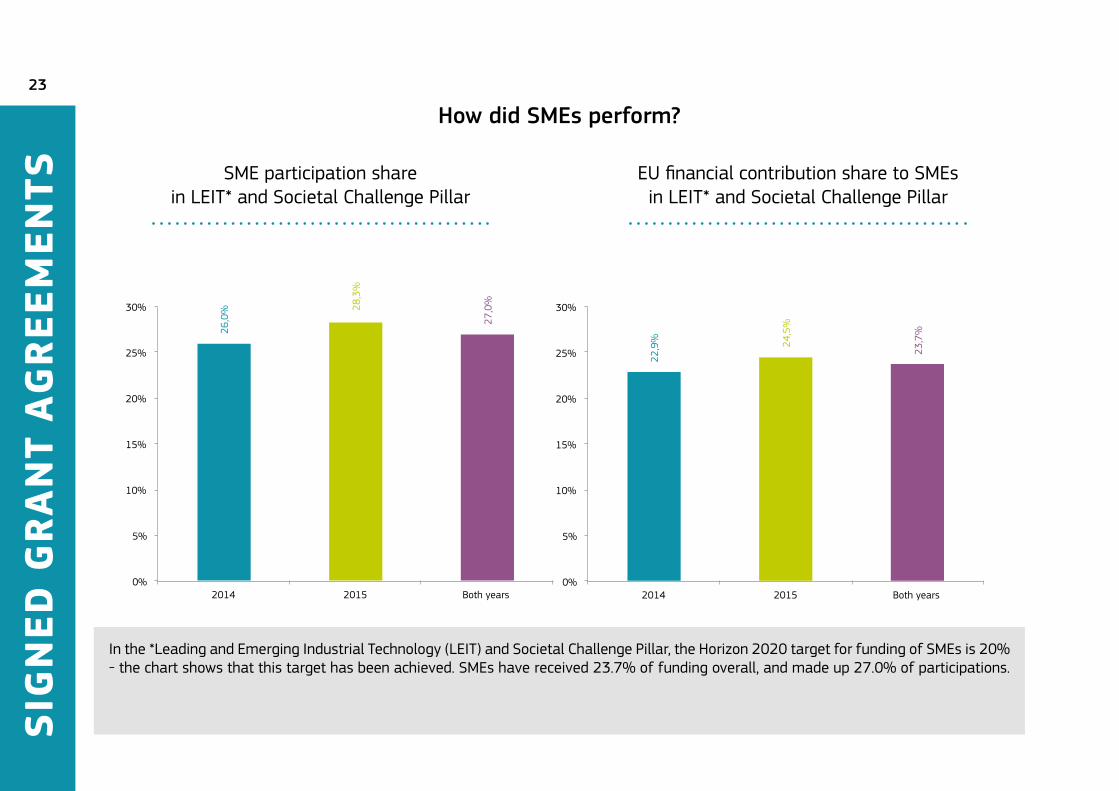
In the *Leading and Emerging Industrial Technology (LEIT) and Societal Challenge Pillar, the Horizon 2020 target for funding of SMEs is 20% - the chart shows that this target has been achieved. SMEs have received 23.7% of funding overall, and made up 27.0% of participations.
SME participation share in LEIT* and Societal Challenge Pillar
EU financial contribution share to SMEs in LEIT* and Societal Challenge Pillar
How did SMEs perform?
26,0
% 28
,3%
27,0
%
0%
5%
10%
15%
20%
25%
30%
2014 2015 Both years
22,9
%
24,5
%
23,7
%
0%
5%
10%
15%
20%
25%
30%
2014 2015 Both years
4NEWCOMERS
25
49,0%
51,0%
2,5%
13,6%
69,8%
8,8%
5,3%
Private Sector (PRC)
Public Bodies (PUB)
Research Organisations (REC)
Universities (HES)
Other Entities (OTH)
FP7 Participants
Newcomers
NEW
CO
MER
S
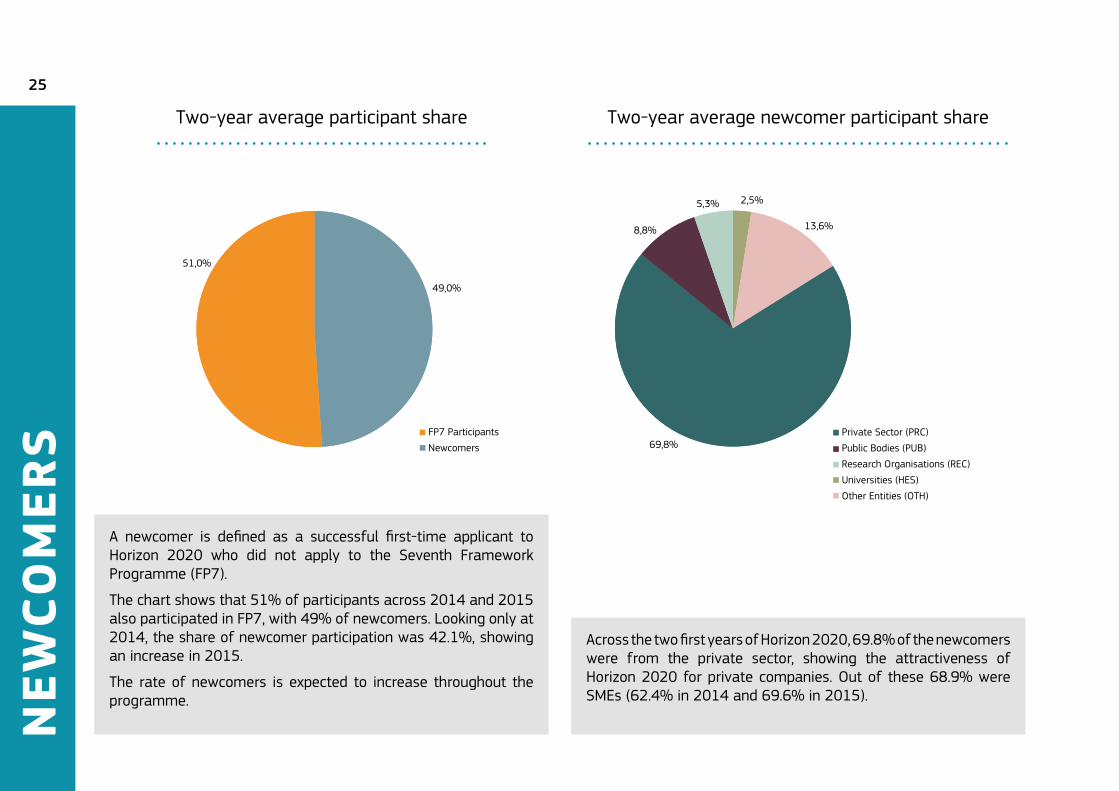
A newcomer is defined as a successful first-time applicant to Horizon 2020 who did not apply to the Seventh Framework Programme (FP7).
The chart shows that 51% of participants across 2014 and 2015 also participated in FP7, with 49% of newcomers. Looking only at 2014, the share of newcomer participation was 42.1%, showing an increase in 2015.
The rate of newcomers is expected to increase throughout the programme.
Across the two first years of Horizon 2020, 69.8% of the newcomers were from the private sector, showing the attractiveness of Horizon 2020 for private companies. Out of these 68.9% were SMEs (62.4% in 2014 and 69.6% in 2015).
Two-year average participant share Two-year average newcomer participant share
5SME INSTRUMENT
27
1659
1269
780
632
498
320 42
5
410
263
154 26
1
206
197
235
249
136
114
112
122
121
80
45 10
1
51
48
44
8 24
306
497
2497
1794
1191
855
729
545
507
475
328
309
301
295
266
227
213
187
176
156
133
132
129
110
105
100
78
41
39
14
426
778
0
500
1000
1500
2000
2500
3000
IT ES UK DE FR PL HU NL SI BG FI SE DK PT EL IE BE AT SK EE CZ LV RO HR LT CY MT LU EU Av.
AC
2014 2015
SME
INST
RU
MEN
T
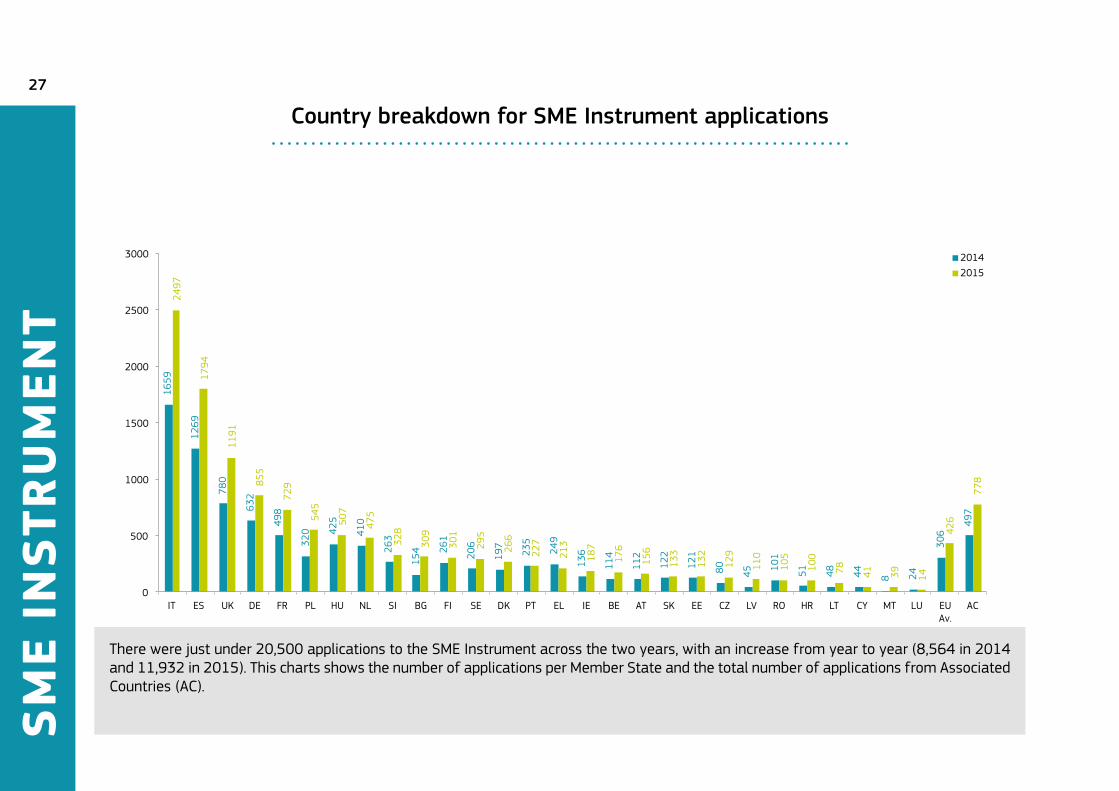
There were just under 20,500 applications to the SME Instrument across the two years, with an increase from year to year (8,564 in 2014 and 11,932 in 2015). This charts shows the number of applications per Member State and the total number of applications from Associated Countries (AC).
Country breakdown for SME Instrument applications
SEC
TIO
N T
ITLE
28
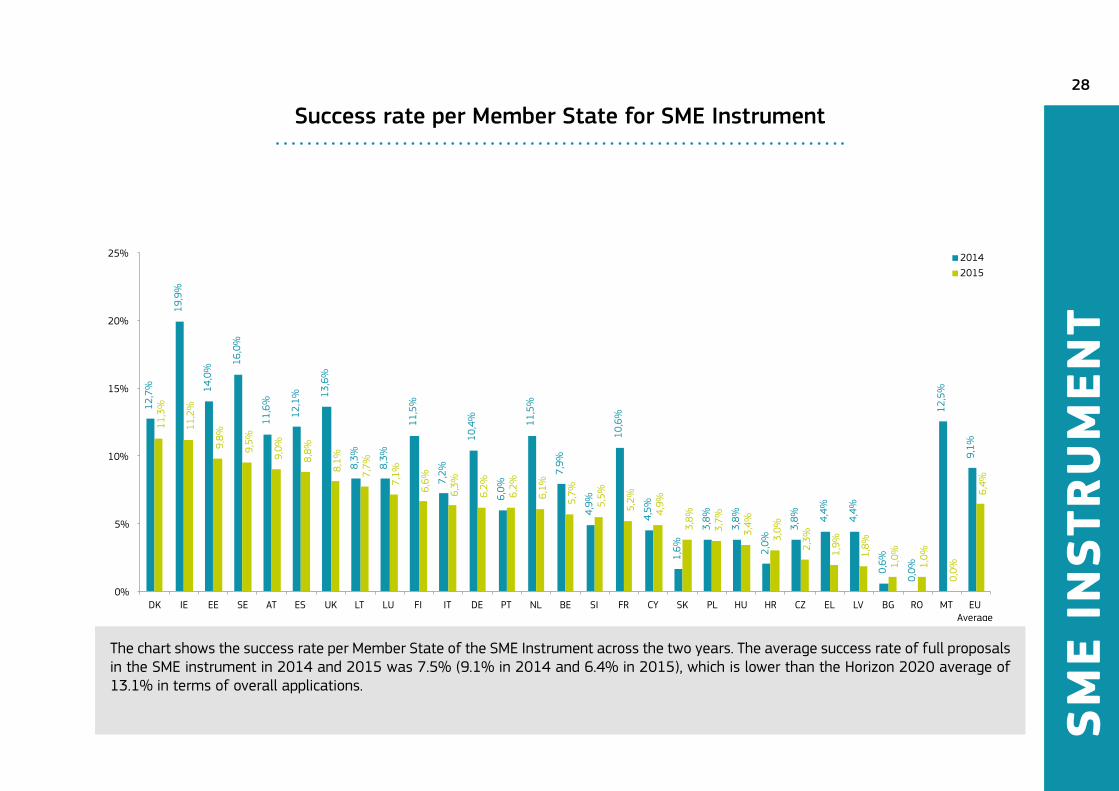
The chart shows the success rate per Member State of the SME Instrument across the two years. The average success rate of full proposals in the SME instrument in 2014 and 2015 was 7.5% (9.1% in 2014 and 6.4% in 2015), which is lower than the Horizon 2020 average of 13.1% in terms of overall applications.
Success rate per Member State for SME Instrument
SME
INST
RU
MEN
T
12,7
%
19,9
%
14,0
% 16
,0%
11,6
%
12,1
%
13,6
%
8,3%
8,3%
11,5
%
7,2%
10,4
%
6,0%
11,5
%
7,9%
4,9%
10,6
%
4,5%
1,6%
3,8%
3,8%
2,0%
3,8%
4,4%
4,4%
0,6%
0,0%
12,5
%
9,1%
11,3
%
11,2
%
9,8%
9,5%
9,0%
8,8%
8,1%
7,7%
7,1%
6,6%
6,3%
6,2%
6,2%
6,1%
5,7%
5,5%
5,2%
4,9%
3,8%
3,7%
3,4%
3,0%
2,3%
1,9%
1,8%
1,0%
1,0%
0,0%
6,4%
0%
5%
10%
15%
20%
25%
DK IE EE SE AT ES UK LT LU FI IT DE PT NL BE SI FR CY SK PL HU HR CZ EL LV BG RO MT EU Average
2014 2015
6TIME TO GRANT
303,
0
216,
6
184,
9
201,
7
0
50
100
150
200
250
300
350
FP7 2014 2015 2014 and 2015
90,7%
9,4%
On-time signings so far in Horizon 2020 Signings outside of 245 days
30
TIM
E TO
GR
AN
T
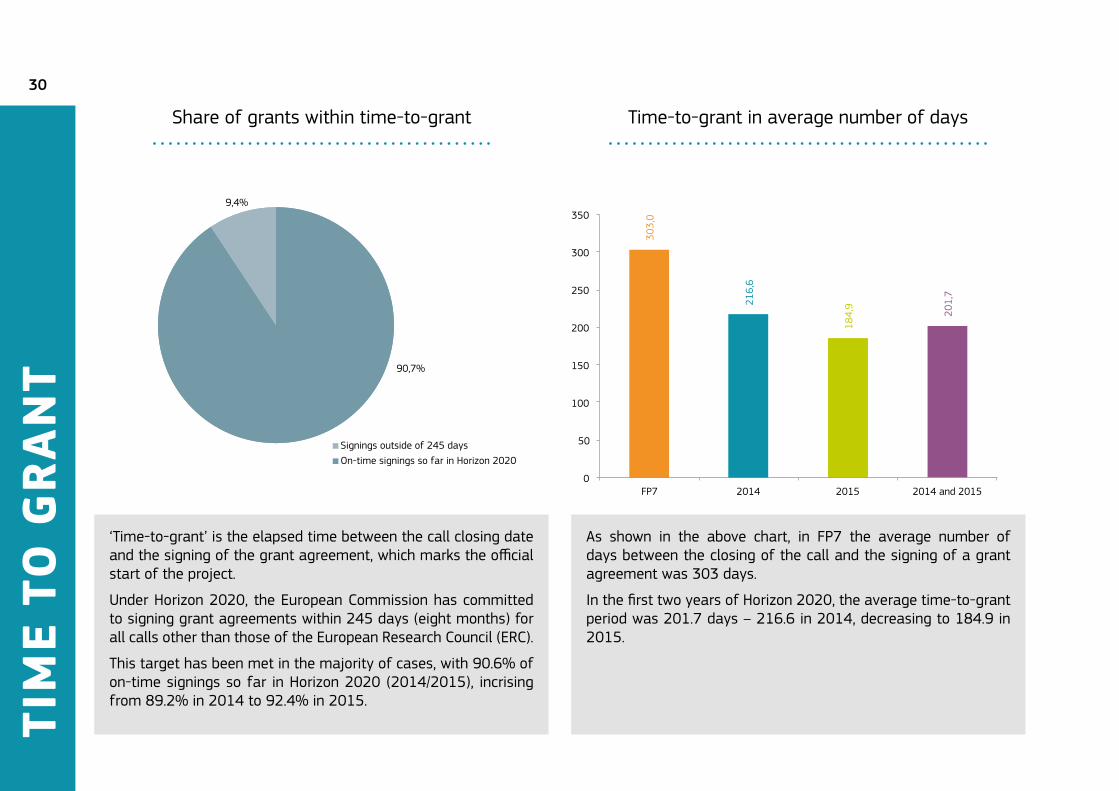
‘Time-to-grant’ is the elapsed time between the call closing date and the signing of the grant agreement, which marks the official start of the project.
Under Horizon 2020, the European Commission has committed to signing grant agreements within 245 days (eight months) for all calls other than those of the European Research Council (ERC).
This target has been met in the majority of cases, with 90.6% of on-time signings so far in Horizon 2020 (2014/2015), incrising from 89.2% in 2014 to 92.4% in 2015.
As shown in the above chart, in FP7 the average number of days between the closing of the call and the signing of a grant agreement was 303 days.
In the first two years of Horizon 2020, the average time-to-grant period was 201.7 days – 216.6 in 2014, decreasing to 184.9 in 2015.
Share of grants within time-to-grant Time-to-grant in average number of days
7EXPERTS
32
EXPE
RTS
62%
38%
Newcomer FP7 evaluator
Men Women
37%
63%
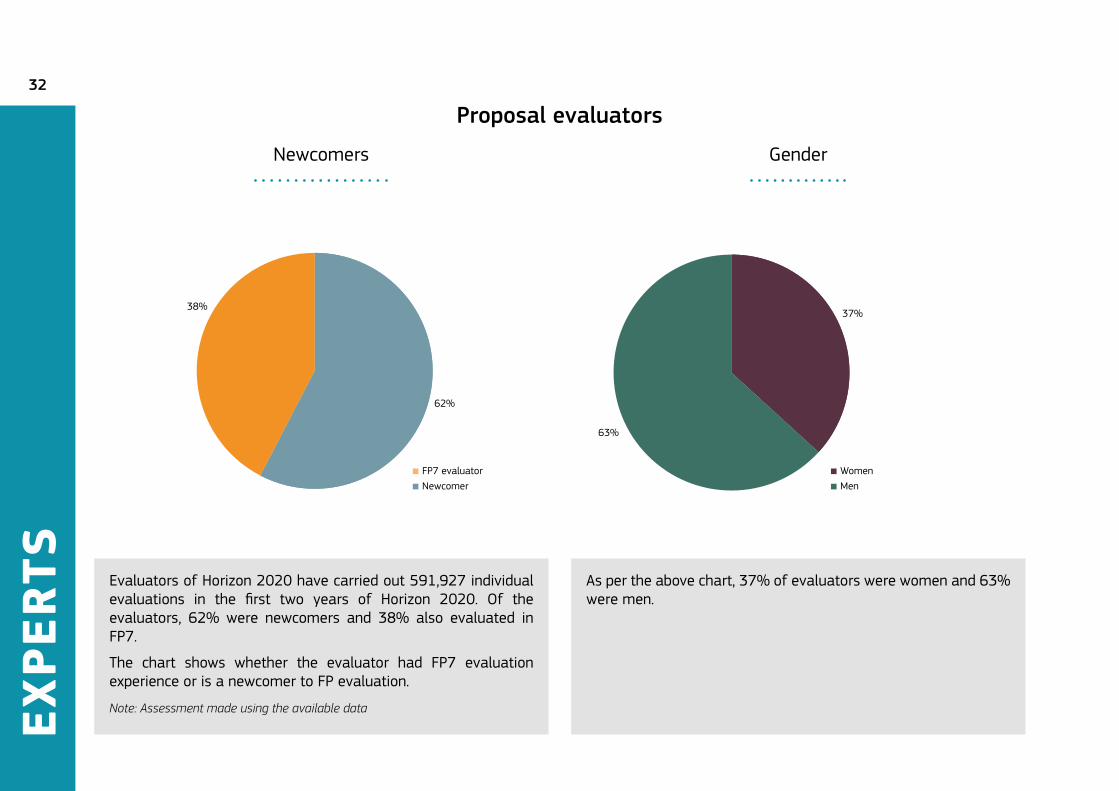
Proposal evaluators
Newcomers Gender
Evaluators of Horizon 2020 have carried out 591,927 individual evaluations in the first two years of Horizon 2020. Of the evaluators, 62% were newcomers and 38% also evaluated in FP7.
The chart shows whether the evaluator had FP7 evaluation experience or is a newcomer to FP evaluation.
Note: Assessment made using the available data
As per the above chart, 37% of evaluators were women and 63% were men.
33
EXPE
RTS
72%
15%
7,0%
6%
42%
26%
18%
10%
4%
Universities (HES)
Research Organisations (REC)
Private Sector (PRC)
Other Entities (OTH)
Public Bodies (PUB)
EU-15
EU-13
Third Countries
Associated Countries
Country of origin Type of organisation background
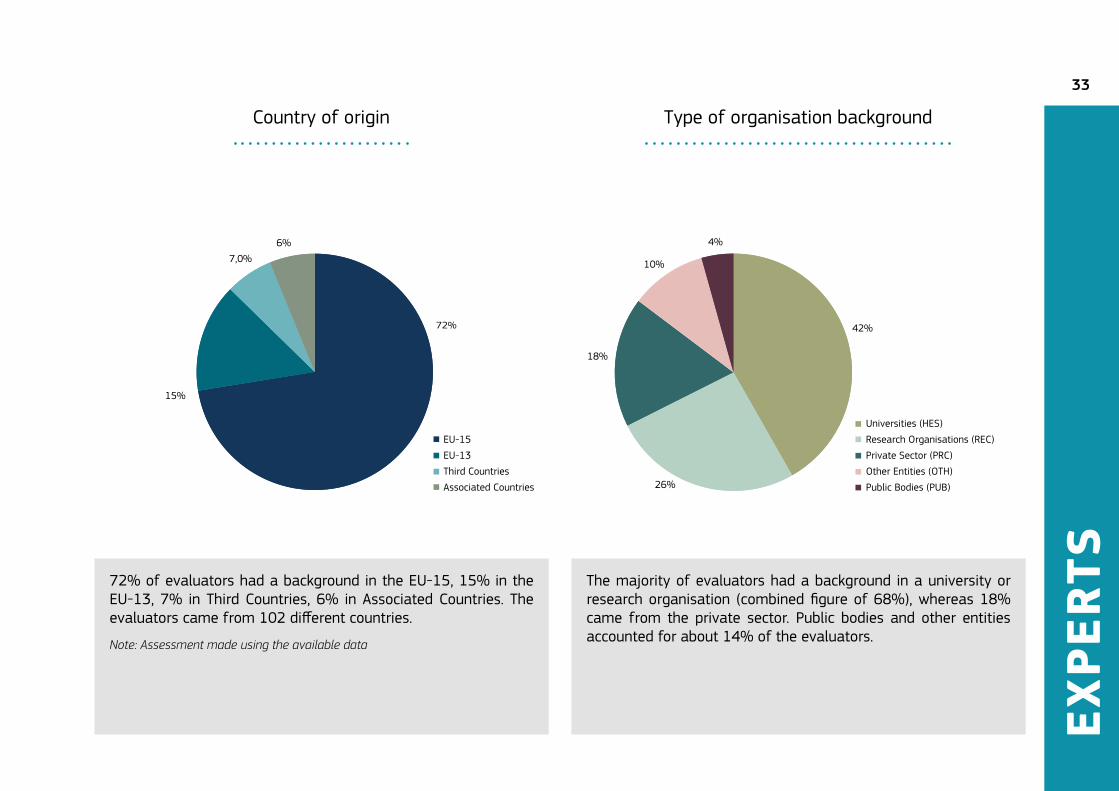
72% of evaluators had a background in the EU-15, 15% in the EU-13, 7% in Third Countries, 6% in Associated Countries. The evaluators came from 102 different countries.
Note: Assessment made using the available data
The majority of evaluators had a background in a university or research organisation (combined figure of 68%), whereas 18% came from the private sector. Public bodies and other entities accounted for about 14% of the evaluators.
8SURVEY RESULTS
SURV
EY R
ESU
LTS
35
42,2%
24,3%
19,0%
14,5%
EU-15
EU-13
Associated Countries
Third Countries
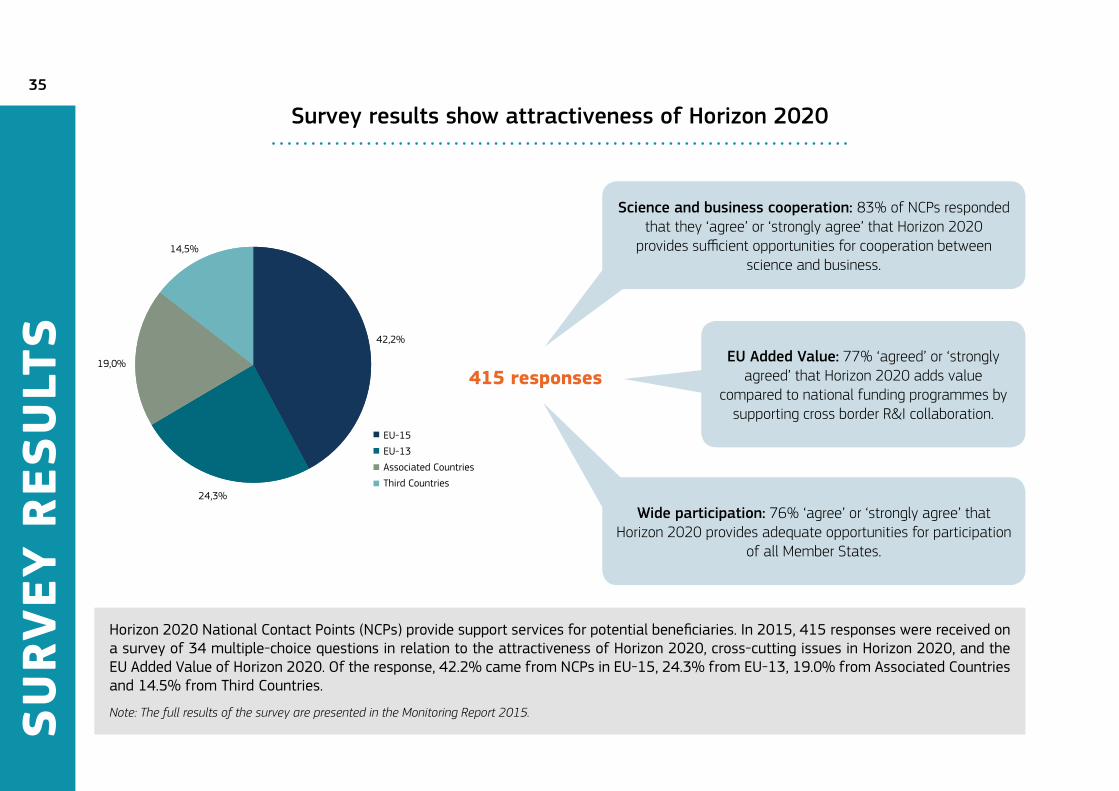
Horizon 2020 National Contact Points (NCPs) provide support services for potential beneficiaries. In 2015, 415 responses were received on a survey of 34 multiple-choice questions in relation to the attractiveness of Horizon 2020, cross-cutting issues in Horizon 2020, and the EU Added Value of Horizon 2020. Of the response, 42.2% came from NCPs in EU-15, 24.3% from EU-13, 19.0% from Associated Countries and 14.5% from Third Countries.
Note: The full results of the survey are presented in the Monitoring Report 2015.
Survey results show attractiveness of Horizon 2020
Science and business cooperation: 83% of NCPs responded that they ‘agree’ or ‘strongly agree’ that Horizon 2020
provides sufficient opportunities for cooperation between science and business.
EU Added Value: 77% ‘agreed’ or ‘strongly agreed’ that Horizon 2020 adds value
compared to national funding programmes by supporting cross border R&I collaboration.
Wide participation: 76% ‘agree’ or ‘strongly agree’ that Horizon 2020 provides adequate opportunities for participation
of all Member States.
415 responses
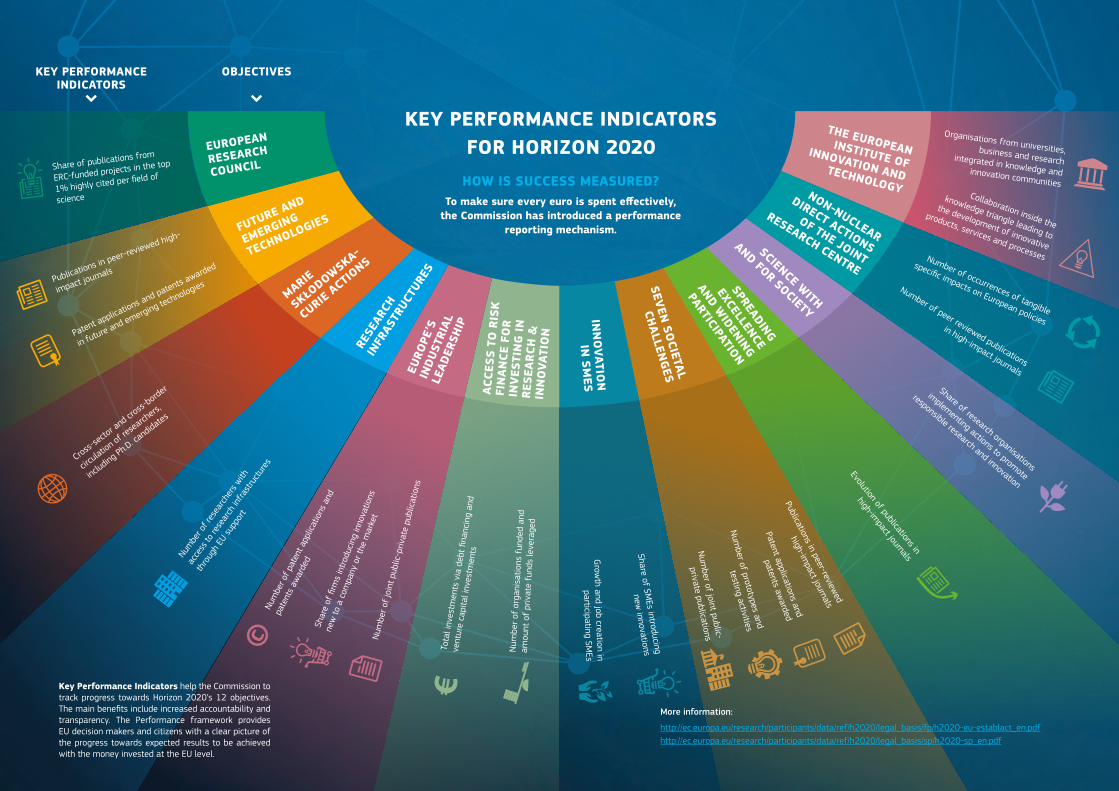
HOW IS SUCCESS MEASURED?To make sure every euro is spent effectively,
the Commission has introduced a performance reporting mechanism.
Key Performance Indicators help the Commission to track progress towards Horizon 2020’s 12 objectives. The main benefits include increased accountability and transparency. The Performance framework provides EU decision makers and citizens with a clear picture of the progress towards expected results to be achieved with the money invested at the EU level.
KEY PERFORMANCE INDICATORS FOR HORIZON 2020
MARIE
SKŁODOWSKA-
CURIE ACTIO
NS
SPREADING
EXCELLENCE
AND WIDENING
PARTICIPATION
SCIENCE WITH
AND FOR SOCIETY
RESE
ARCH
INFR
ASTR
UCTU
RES
NON-NUCLEAR
DIRECT ACTIONS
OF THE JOINT
RESEARCH CENTRE
EURO
PE’S
IN
DUST
RIAL
LE
ADER
SHIP
THE EUROPEAN INSTITUTE OF INNOVATION AND TECHNOLOGY
FUTURE AND
EMERGING
TECHNOLOGIES
ACCE
SS T
O R
ISK
FIN
AN
CE F
OR
INV
ESTI
NG
IN
RESE
ARC
H &
IN
NO
VATI
ON
SEVEN SO
CIETAL
CHALLEN
GES
Share of publications from
ERC-funded projects in the top
1% highly cited per field of
science
Cross-s
ector
and cr
oss-bo
rder
circulatio
n of re
search
ers,
includin
g Ph.D. cand
idates
Evolution of publications in
high-impact journals
Share of research organisations
implementing actions to promote
responsible research and innovation
Num
ber o
f res
earc
hers
with
acce
ss to
rese
arch
infra
stru
ctur
es
thro
ugh
EU su
ppor
t
Number of occurrences of tangible
specific impacts on European policies
Number of peer reviewed publications
in high-impact journals
Num
ber o
f pat
ent a
pplic
atio
ns a
nd
pate
nts
awar
ded
Shar
e of
firm
s in
trod
ucin
g in
nova
tions
new
to a
com
pany
or t
he m
arke
t
Organisations from universities, business and research integrated in knowledge and innovation communities
Num
ber o
f jo
int p
ublic
-priv
ate
publ
icat
ions
Collaboration inside the
knowledge triangle leading to
the development of innovative
products, services and processes
Patent applications and patents a
warded
in future and emerging technologies
Num
ber
of o
rgan
isat
ions
fun
ded
and
amou
nt o
f pr
ivat
e fu
nds
leve
rage
d
Publications in peer-reviewed
high-impact journals
Share of SMEs introducing
new innovations
Publications in peer-reviewed high-
impact journals
Tota
l inv
estm
ents
via
deb
t fina
ncin
g an
d
vent
ure
capi
tal i
nves
tmen
ts
Patent applications and
patents awarded
Num
ber of prototypes and
testing activities
Num
ber of joint public-
private publications
Grow
th and job creation in participating SM
Es
More information:
http://ec.europa.eu/research/participants/data/ref/h2020/legal_basis/fp/h2020-eu-establact_en.pdfhttp://ec.europa.eu/research/participants/data/ref/h2020/legal_basis/sp/h2020-sp_en.pdf
EUROPEAN
RESEARCH
COUNCIL
INN
OVATIO
N
IN SM
ES
OBJECTIVES
KEY PERFORMANCE INDICATORS
8PROJECT EXAMPLES
PRO
JEC
T EX
AM
PLES
38
© prathaan - Fotolia.com
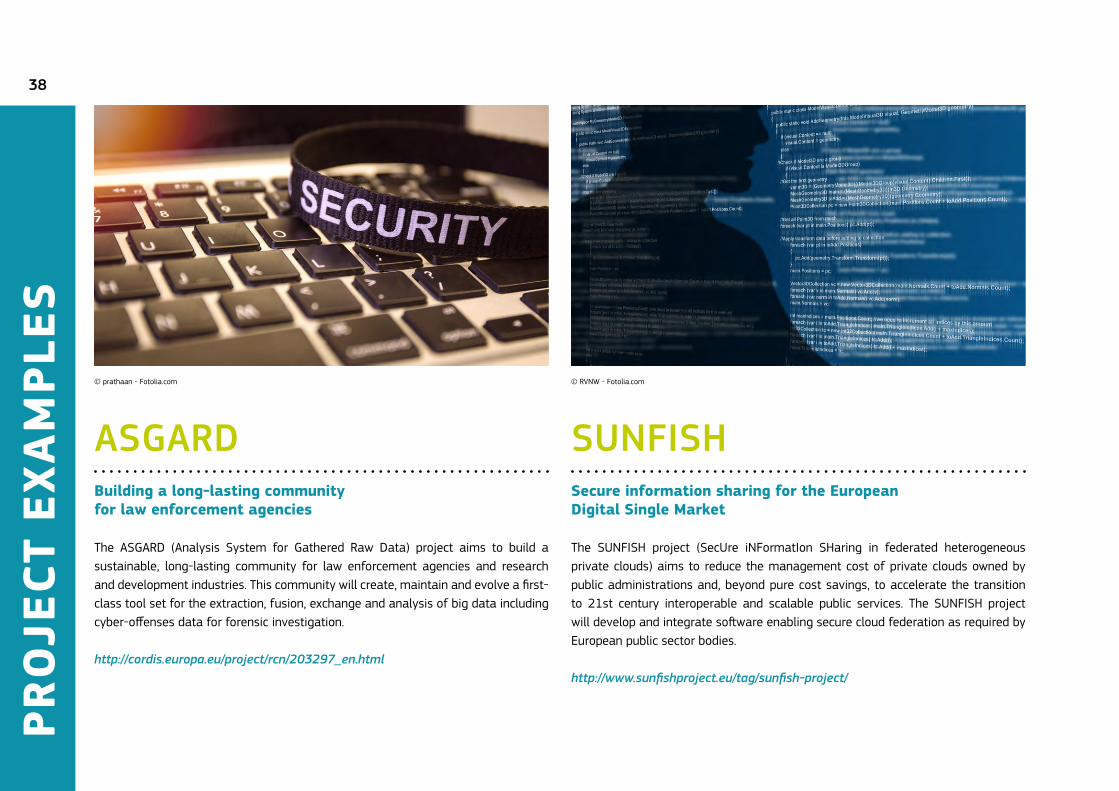
ASGARD Building a long-lasting community for law enforcement agencies
The ASGARD (Analysis System for Gathered Raw Data) project aims to build a sustainable, long-lasting community for law enforcement agencies and research and development industries. This community will create, maintain and evolve a first-class tool set for the extraction, fusion, exchange and analysis of big data including cyber-offenses data for forensic investigation.
http://cordis.europa.eu/project/rcn/203297_en.html
© RVNW - Fotolia.com
SUNFISHSecure information sharing for the European Digital Single Market
The SUNFISH project (SecUre iNFormatIon SHaring in federated heterogeneous private clouds) aims to reduce the management cost of private clouds owned by public administrations and, beyond pure cost savings, to accelerate the transition to 21st century interoperable and scalable public services. The SUNFISH project will develop and integrate software enabling secure cloud federation as required by European public sector bodies.
http://www.sunfishproject.eu/tag/sunfish-project/
PRO
JEC
T EX
AM
PLES
39
© ipopba - Fotolia.com
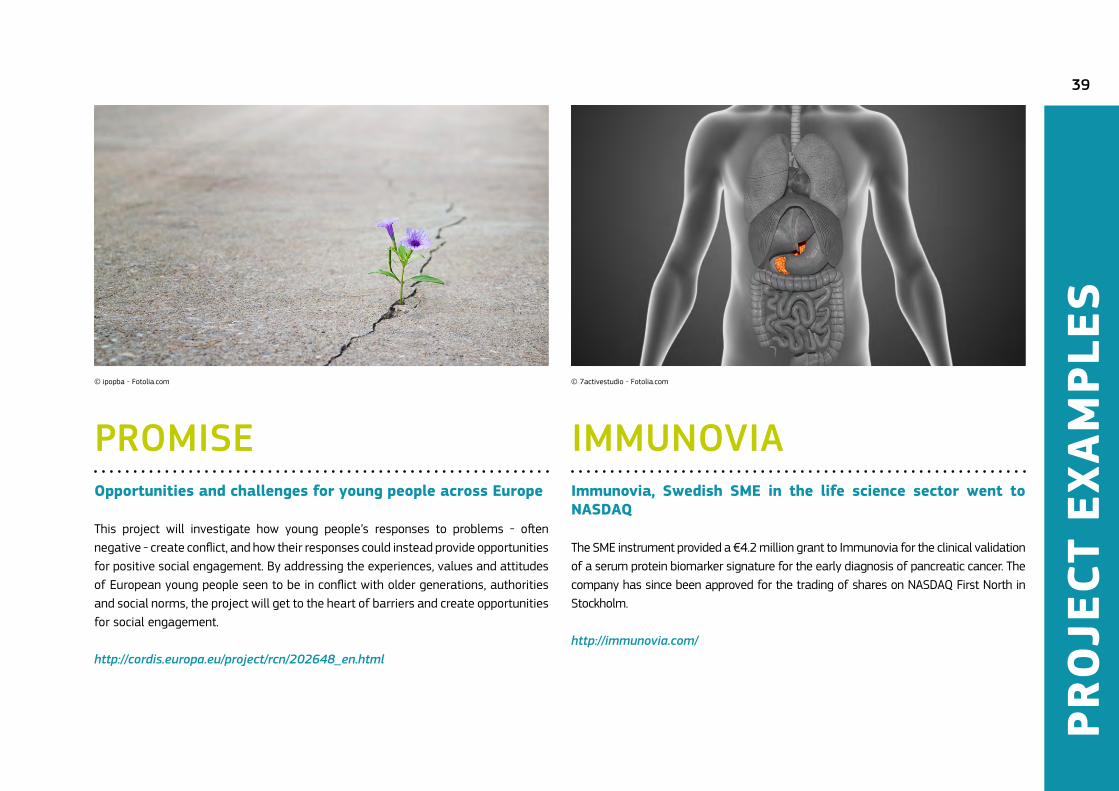
PROMISE
Opportunities and challenges for young people across Europe
This project will investigate how young people’s responses to problems - often negative - create conflict, and how their responses could instead provide opportunities for positive social engagement. By addressing the experiences, values and attitudes of European young people seen to be in conflict with older generations, authorities and social norms, the project will get to the heart of barriers and create opportunities for social engagement.
http://cordis.europa.eu/project/rcn/202648_en.html
© 7activestudio - Fotolia.com
IMMUNOVIAImmunovia, Swedish SME in the life science sector went to NASDAQ The SME instrument provided a €4.2 million grant to Immunovia for the clinical validation of a serum protein biomarker signature for the early diagnosis of pancreatic cancer. The company has since been approved for the trading of shares on NASDAQ First North in Stockholm.
http://immunovia.com/
PRO
JEC
T EX
AM
PLES
40
© zhu difeng - Fotolia.com
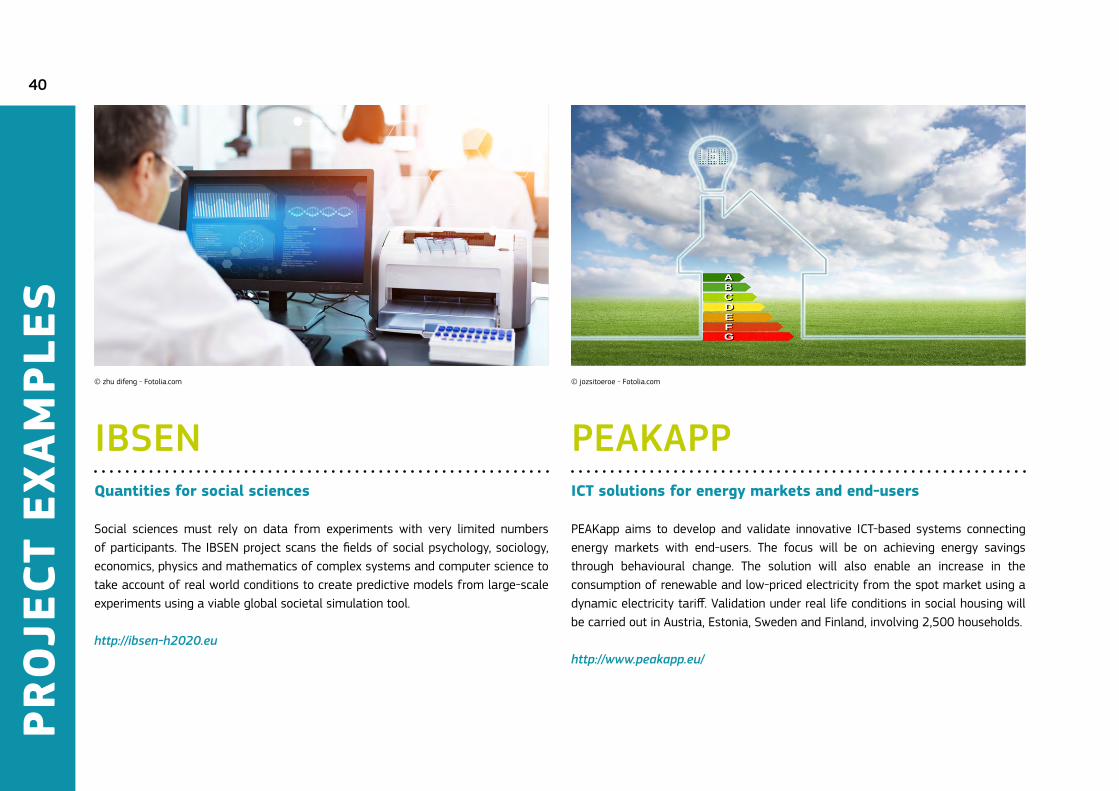
IBSENQuantities for social sciences
Social sciences must rely on data from experiments with very limited numbers of participants. The IBSEN project scans the fields of social psychology, sociology, economics, physics and mathematics of complex systems and computer science to take account of real world conditions to create predictive models from large-scale experiments using a viable global societal simulation tool.
http://ibsen-h2020.eu
© jozsitoeroe - Fotolia.com
PEAKAPPICT solutions for energy markets and end-users
PEAKapp aims to develop and validate innovative ICT-based systems connecting energy markets with end-users. The focus will be on achieving energy savings through behavioural change. The solution will also enable an increase in the consumption of renewable and low-priced electricity from the spot market using a dynamic electricity tariff. Validation under real life conditions in social housing will be carried out in Austria, Estonia, Sweden and Finland, involving 2,500 households.
http://www.peakapp.eu/
PRO
JEC
T EX
AM
PLES
41
© kentoh - Fotolia.com
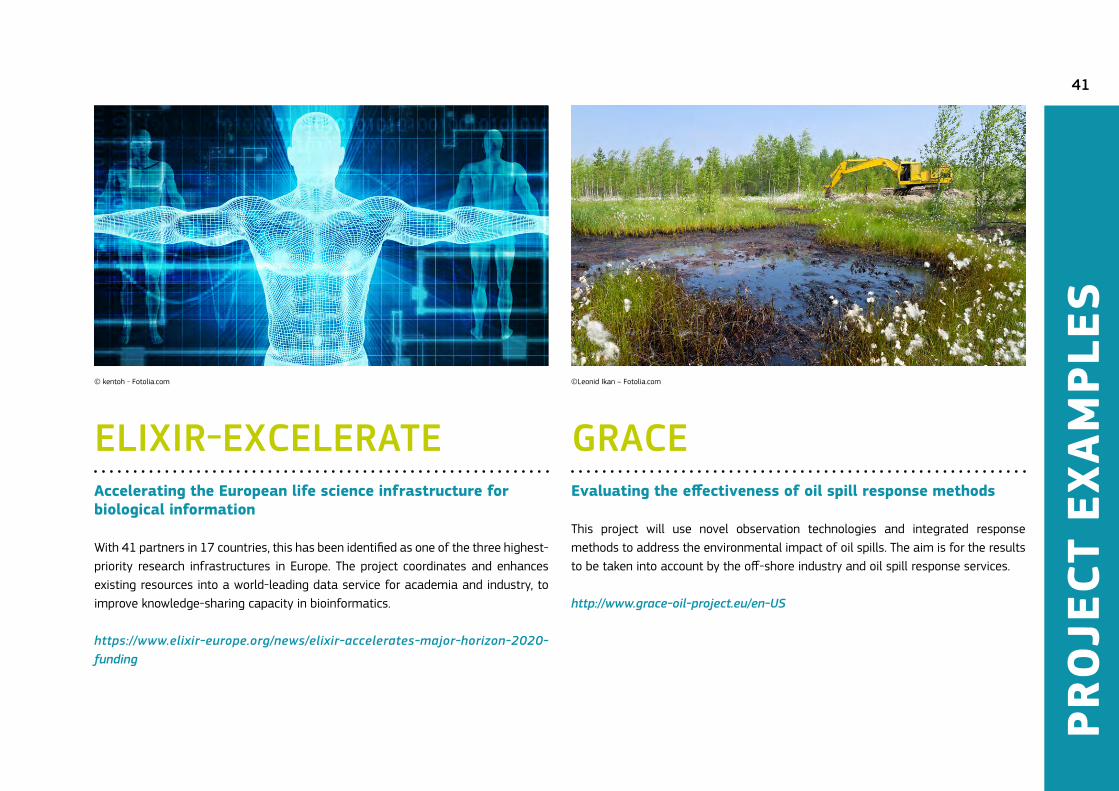
ELIXIR-EXCELERATE Accelerating the European life science infrastructure for biological information
With 41 partners in 17 countries, this has been identified as one of the three highest-priority research infrastructures in Europe. The project coordinates and enhances existing resources into a world-leading data service for academia and industry, to improve knowledge-sharing capacity in bioinformatics.
https://www.elixir-europe.org/news/elixir-accelerates-major-horizon-2020-funding
©Leonid Ikan – Fotolia.com
GRACEEvaluating the effectiveness of oil spill response methods
This project will use novel observation technologies and integrated response methods to address the environmental impact of oil spills. The aim is for the results to be taken into account by the off-shore industry and oil spill response services.
http://www.grace-oil-project.eu/en-US
8GLOSSARY
GLO
SSA
RY43
A proposal is submitted by one or more applicants. Proposals could have just one applicant – a single principal investigator - while multi-partner proposals group together many applicants. An applicant might also be involved in more than one proposal, in which case it is involved in multiple applications for funding.
Some calls have two stages: applicants first submit outline proposals, which are evaluated to select those that could be developed further into full proposals. The statistics on proposals presented in this publication refer only to full proposals. If the proposal is successful and is awarded funding it becomes a project, which is implemented by one or more participants. And a participant might be involved in other projects, in which case it has a number of participations.
The overall success rate of eligible full proposals is 11.8% and has declined from 2014 to 2015. It should however be noted that this is mainly due to the strong increase in the number of submitted proposals, rather than less funding. At the same time, there is an increased interest from potential applicants in Horizon 2020, demonstrated by the fact that 49.0% of successful applicants were newcomers and the share is increasing.
Applicant Legal entity submitting an application for a call for proposals. When the application is submitted in name of a consortium, then the applicant is the coordinator.
Associated country Associated countries are third countries that are party to an international agreement with the European Union, as identified in Article 7 of Regulation (EU) No 1290/2013 [Horizon 2020]. They participate in Horizon 2020 under the same conditions as EU Member States. As of 31 December 2015, there are thirteen countries associated to Horizon 2020. Please refer also to: http://bit.ly/H2020AC Please check here for more information on the status of Switzerland in Horizon 2020: http://bit.ly/H2020Switzerland
Beneficiary The legal person, other than the European Commission, who is a party to the Grant Agreement.
Call for proposals Procedure to invite applicants to submit project proposals with the objective of receiving funds from the European Union.
Civil Society Organisation Any legal entity that is non-governmental, non-profit, not representing commercial interests and pursuing a common purpose in the public interest.
Definitions of types of organisations Private Sector: Private, for-profit entities, including small or medium-sized enterprises and excluding Universities and Higher or Secondary Education Establishments. Public Body: Any legal entity established as a public body by national law or an international organisation. Excludes Research Organisations and Higher or Secondary Education Establishments. Research Organisation: A legal entity that is established as a non-profit organisation and whose main objective is carrying out research or technological development.University: A legal entity that is recognised by its national education system as a University or Higher or Secondary Education Establishment. It can be a public or a private body. Other: Any entity not falling into one of the other four categories
Eligibility criteria are used to determine whether a proposal meets the requirements to become eligible for a European Union grant. Article 10 of the Horizon 2020 Rules for Participation provide that the following participants are eligible for funding from the Union: (a) any legal entity established in a Member State or associated country, or created under Union law; (b) any international European interest organisation; and (c) any legal entity established in a third country identified in the work programme. The work programme can also apply more specific conditions for particular actions.
Evaluation procedure Proposals for projects to be funded in Horizon 2020 are evaluated on the basis of selection criteria (financial and operational capacity) and award criteria (excellence, impact, efficiency of implementation). These widely published criteria provide an objective method of choosing, from the great number of proposals often received, the very best projects that most closely meet the objectives
GLO
SSA
RY
44
of the calls for proposals. In this way, Horizon 2020 funds only high-quality, excellent research and innovation projects. Unless otherwise specified in the conditions of the call for proposals, each of the award criteria is scored between 0 and 5. The total score is calculated as a weighted sum of the scores for each criterion. The default is equal weight for all criteria. For Innovation Actions and the SME Instrument the impact criterion is given a weight of 1.5 to determine the ranking. Other weightings may be specified in the conditions of the call for proposals.
Evaluation threshold These are the minimum evaluation scores that a Horizon 2020 project proposal must receive in order to be ranked. The default thresholds are a score of least 3 out of 5 for each individual criterion and a score of at least 10 out of 15 for the sum of the individual scores. The thresholds are applied to unweighted scores. Different thresholds may be specified in the conditions of the call for proposals. Proposals scoring below any of the thresholds will be rejected.
FP7 The Seventh Framework Programme of the European Community for research, technological development and demonstration activities (2007-13); the Seventh Framework Programme.
Grants to named beneficiaries: Most programme parts of Horizon 2020, have ad hoc calls to named beneficiaries. These calls have no deadline, and encompass projects in many different areas. These correspond to Identified beneficiary actions (in which the legal entities to be granted are listed in the adopted Work Programme) and Specific Grant Agreements (SGA) awarded in the context of Framework Partnership Agreements (FPA), establishing a long-term cooperation mechanism between the Commission/Agency and the beneficiaries of grants.
Grant Grants are direct financial contributions, by way of donation, from the EU budget in order to finance any of the following: a) an action intended to help achieve an EU policy objective; b) the functioning of a body which pursues an aim of general EU interest or has an objective forming part of, and supporting, an EU policy (‘operating grants’).
Grant Agreement A contract concluded between the European Commission (representing the European Union) and the beneficiary (or beneficiaries) under which the parties receive the rights and obligations (e.g. the right of the Union’s financial contribution and the obligation to carry out the research and development work). It consists of the basic text and annexes.
Member State A state that is party to treaties of the European Union and thereby subject to the privileges and obligations of European Union membership.
Participant Any legal entity carrying out an action or part of an action under Regulation (EU) No1290/2013 [Horizon 2020] having rights and obligations with regard to the European Union or another funding body under the terms of the Horizon 2020 Rules for Participation (Regulation 1290/2013).
Small or Medium-Sized Enterprise (SME) A micro, small or medium-sized enterprise within the meaning of Recommendation 2003/361/EC. Necessary (but not sufficient) conditions for being an SME are a number of employees smaller than 250 and an annual turnover not exceeding €50 million, and/or an annual balance sheet total not exceeding €43 million. These ceilings apply to the figures for individual firms only. A firm which is part of larger grouping may need to include employee/turnover/balance sheet data from that grouping too.
Third Country A state that is not a Member State of the EU. For the purposes of presentation of information in this brochure, “third country” does not include Associated countries.
Two-stage call The proposal coordinator submits a short proposal that is evaluated; successful proposals are invited to submit a full proposal. The evaluation of this full proposal leads to an ordered list to be forwarded to the Commission for ranking selection. A more extensive list of definitions can be found at : http://bit.ly/H2020Glossary
HOW TO OBTAIN EU PUBLICATIONS
Free publications:• one copy:
via EU Bookshop (http://bookshop.europa.eu);• more than one copy or posters/maps:
from the European Union’s representations (http://ec.europa.eu/represent_en.htm); from the delegations in non-EU countries (http://eeas.europa.eu/delegations/index_en.htm); by contacting the Europe Direct service (http://europa.eu/europedirect/index_en.htm) or calling 00 800 6 7 8 9 10 11 (freephone number from anywhere in the EU) (*). (*) The information given is free, as are most calls (though some operators, phone boxes or hotels may charge you).
Priced publications:• via EU Bookshop (http://bookshop.europa.eu).