Embed Size (px)
Citation preview
Michael BordoMichael Bordo
Hoover Institution, Stanford University;
Rutgers University and NBER
To be presented at the Session “New Perspectives on the Great Depression”American Economic Association; Chicago; January 8, 2012
Introduction� The financial crisis of 2007-2008 and the Great Recession are often compared to the Great
Depression of the 1930s.
�I raise and answer some questions:
1. What is similar between now and then?
2. What is different?
2
2. What is different?
3. What were the monetary policy lessons that came out of the 1930s experience?
4. Which of them were of value in dealing with the recent experience?
5. What do we need to learn from the recent experience?
Some Comparisons between Now and
Then
Similarities
The Downturn
3
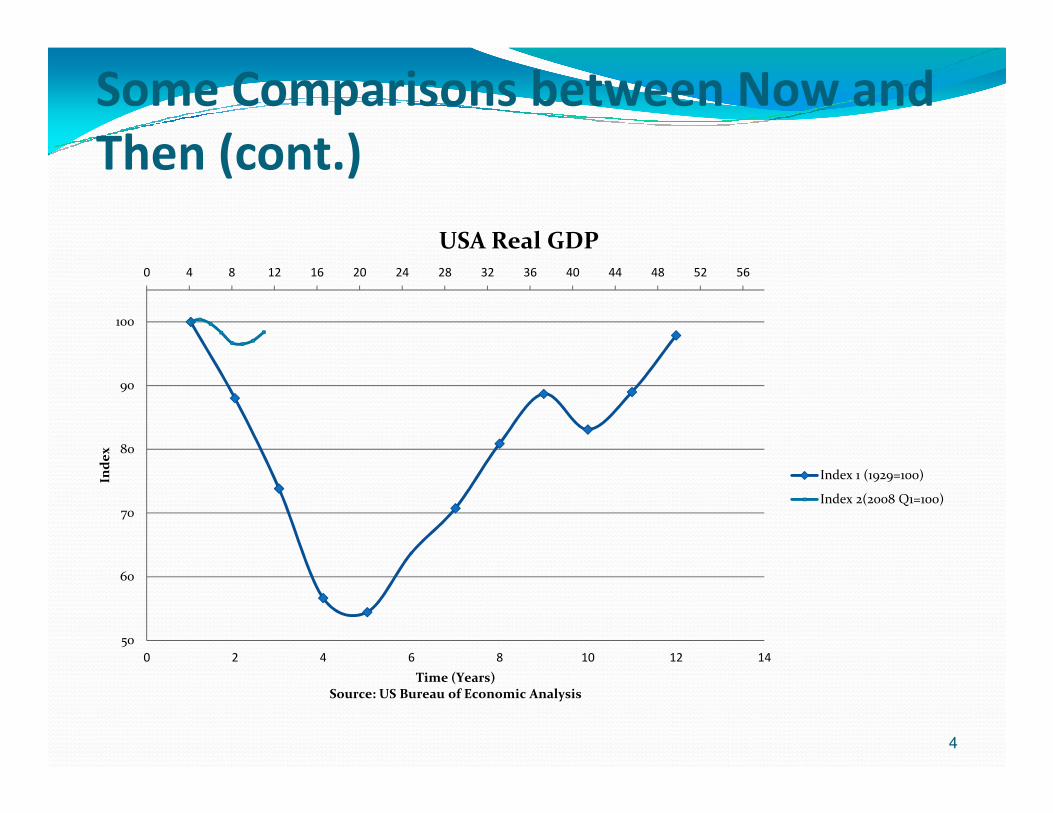
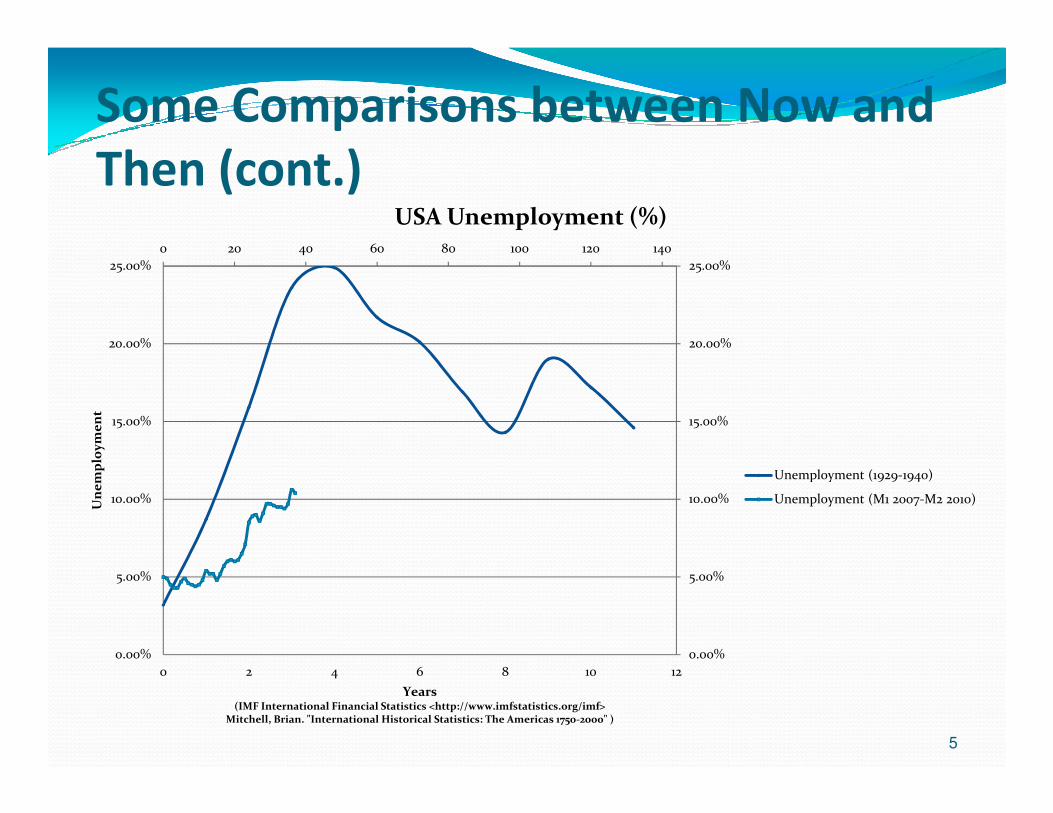
�First, the recent Great Recession was a relatively minor event in terms of the decline
in the real economy compared to the 1930s seen in real GDP and unemployment.
Some Comparisons between Now and
Then (cont.)
0 4 8 12 16 20 24 28 32 36 40 44 48 52 56
90
100
USA Real GDP
50
60
70
80
0 2 4 6 8 10 12 14
Ind
ex
Time (Years)Source: US Bureau of Economic Analysis
Index 1 (1929=100)
Index 2(2008 Q1=100)
4
Some Comparisons between Now and
Then (cont.)
0 20 40 60 80 100 120 140
20.00%
25.00%
20.00%
25.00%
USA Unemployment (%)
0.00%
5.00%
10.00%
15.00%
0.00%
5.00%
10.00%
15.00%
0 2 4 6 8 10 12
Un
em
plo
ym
en
t
Years(IMF International Financial Statistics <http://www.imfstatistics.org/imf>
Mitchell, Brian. "International Historical Statistics: The Americas 1750-2000" )
Unemployment (1929-1940)
Unemployment (M1 2007-M2 2010)
5
Some Comparisons between Now and
Then (cont.)
90
100
110
120
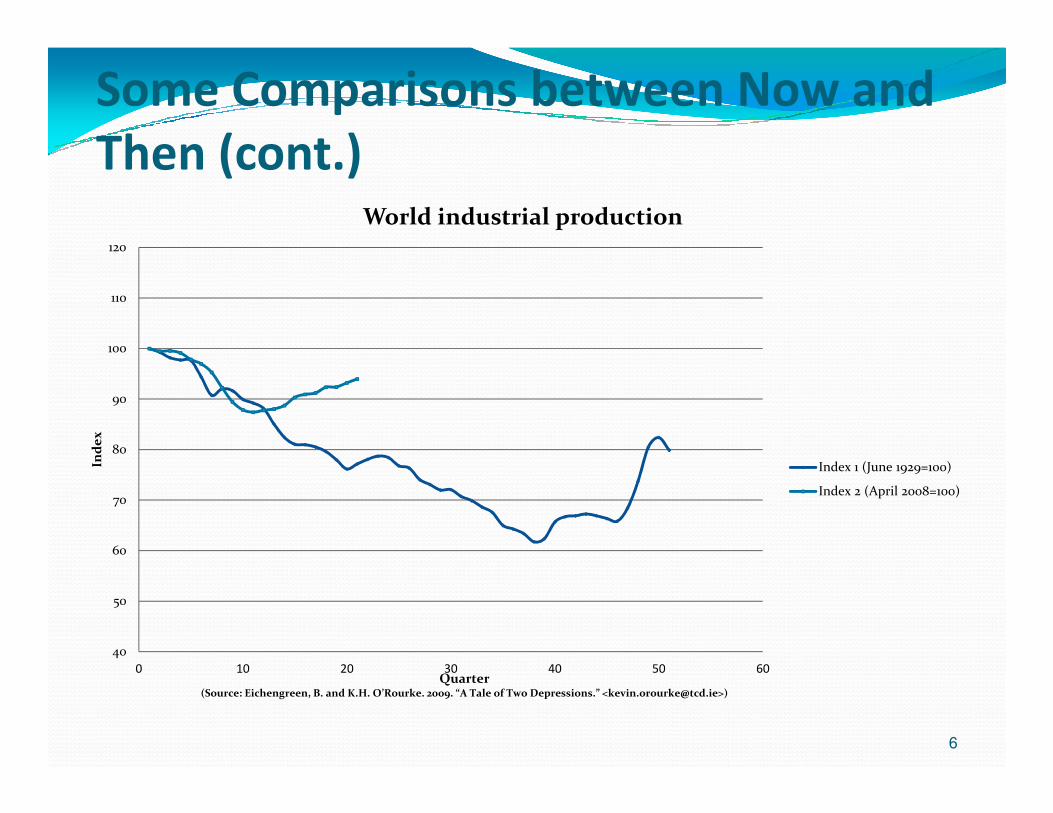
World industrial production
40
50
60
70
80
0 10 20 30 40 50 60
Ind
ex
Quarter(Source: Eichengreen, B. and K.H. O’Rourke. 2009. “A Tale of Two Depressions.” <[email protected]>)
Index 1 (June 1929=100)
Index 2 (April 2008=100)
6
Some Comparisons between
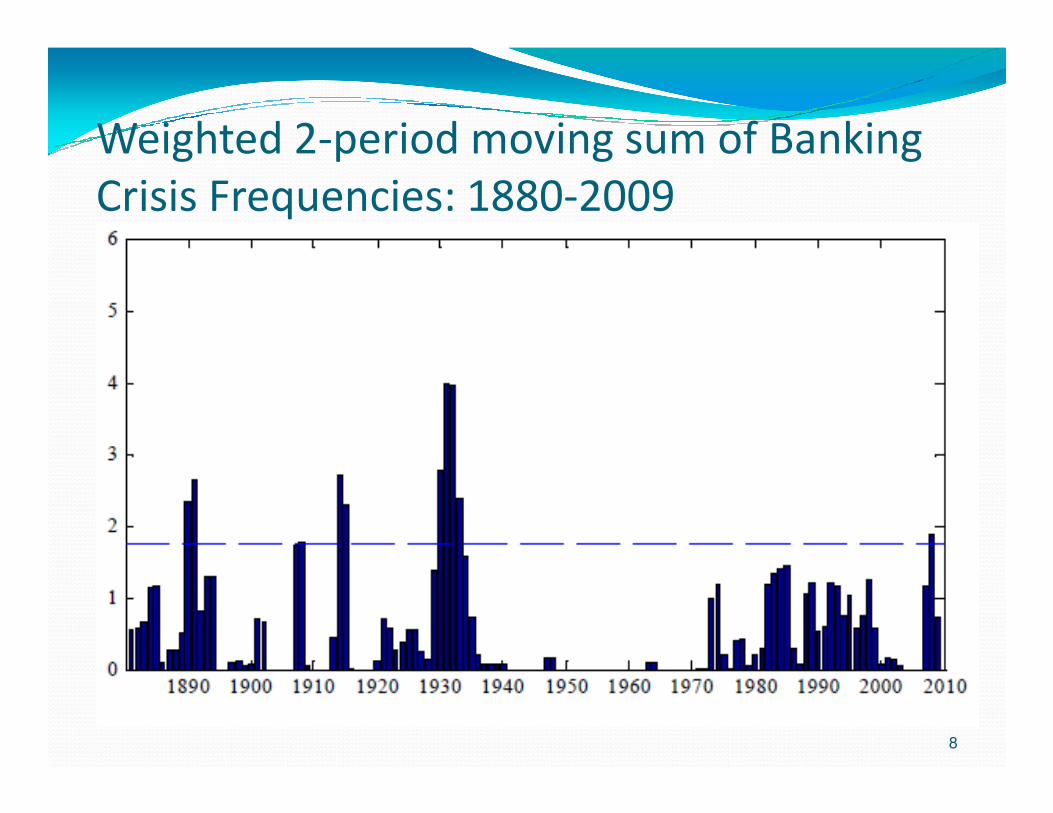
Now and Then (cont.)� Both the recent financial crisis and the Great
Depression were global financial crises
� However, the global incidence of the recent crisis is much less than in the 1930’s. Bordo and Landon Lane much less than in the 1930’s. Bordo and Landon Lane (2010a)
� Moreover, the mean weighted cumulative percentage loss of real output for countries with financial crises 2007-2008 of -2.95% was one third of the comparable measure for the early 1930’s at -9.35%
7
Weighted 2-period moving sum of Banking
Crisis Frequencies: 1880-2009
8
Some Comparisons between Now and
Then (cont.)
�These data don’t answer the counterfactual question, “what would have happened if the Fed and other central banks didn’t follow the aggressive and other central banks didn’t follow the aggressive policies they did?”
�Nor if there hadn’t been deposit insurance, automatic stabilizers etc.
9
The Recovery� Both episodes had sluggish recoveries in terms of the
real economy expanding after the business cycle trough at the same pace as the downturn
� The recovery after 1933 was very rapid (33%) but not � The recovery after 1933 was very rapid (33%) but not quite sufficient to completely reverse the preceding downturn
� The recovery may have been impeded by the New Deal Cartelization Policies (Cole and Ohanian 2004)
10
The Recovery
� The recent recovery is sluggish, a jobless recovery like the two preceding recessions
� Its sluggishness likely reflects the collapse of the housing market following the housing burst (Bordoand Haubrich 2011)
11
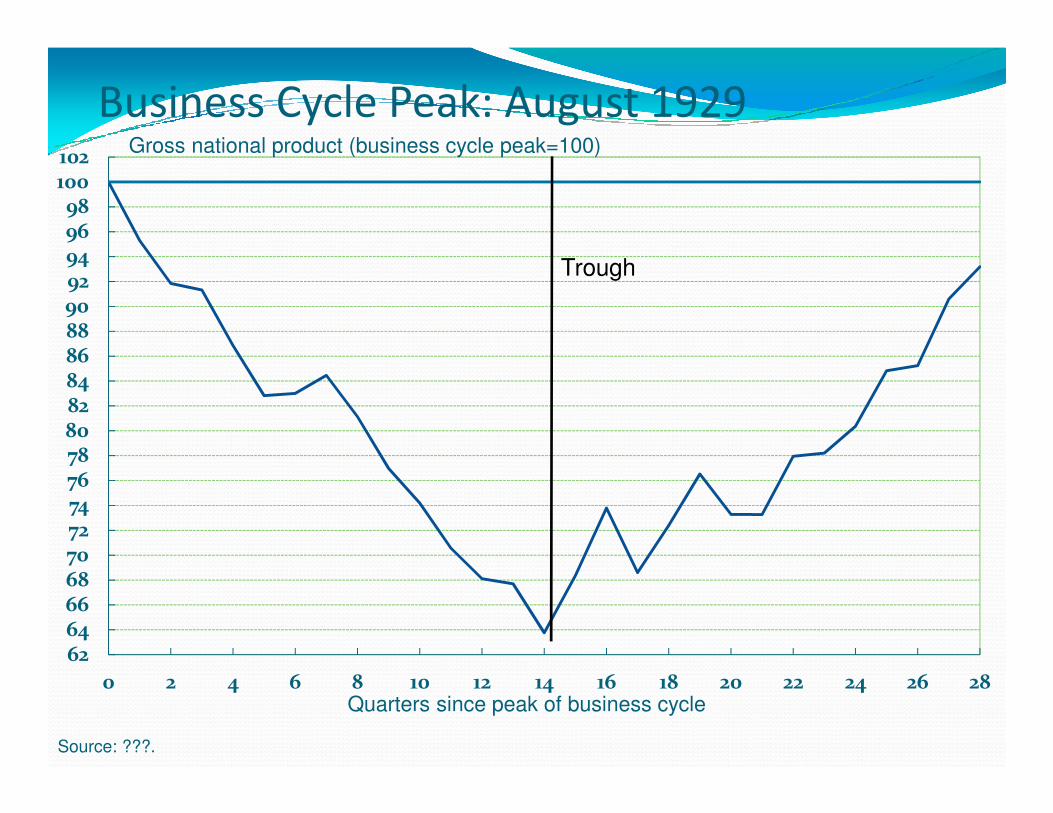
Business Cycle Peak: August 1929
828486889092949698
100102 Gross national product (business cycle peak=100)
Trough
6264666870727476788082
0 2 4 6 8 10 12 14 16 18 20 22 24 26 28Quarters since peak of business cycle
Source: ???.
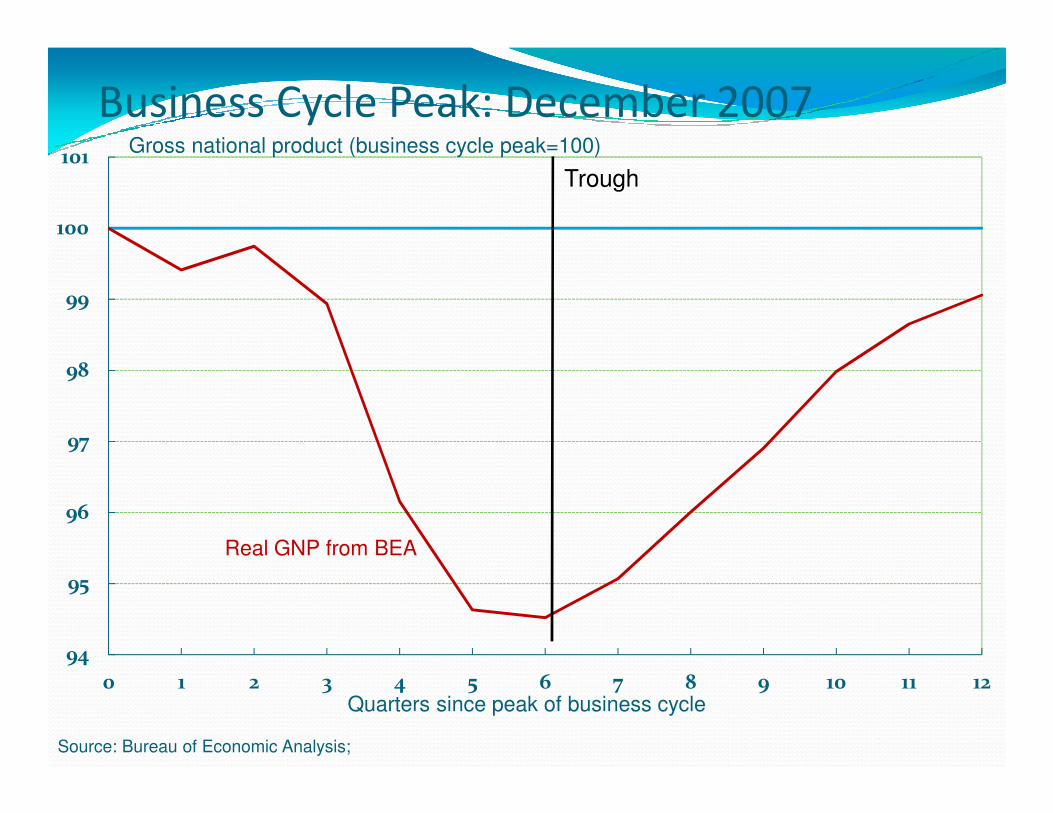
Business Cycle Peak: December 2007
98
99
100
101Trough
Gross national product (business cycle peak=100)
94
95
96
97
0 1 2 3 4 5 6 7 8 9 10 11 12Quarters since peak of business cycle
Source: Bureau of Economic Analysis;
Real GNP from BEA
Some Comparisons between Now and
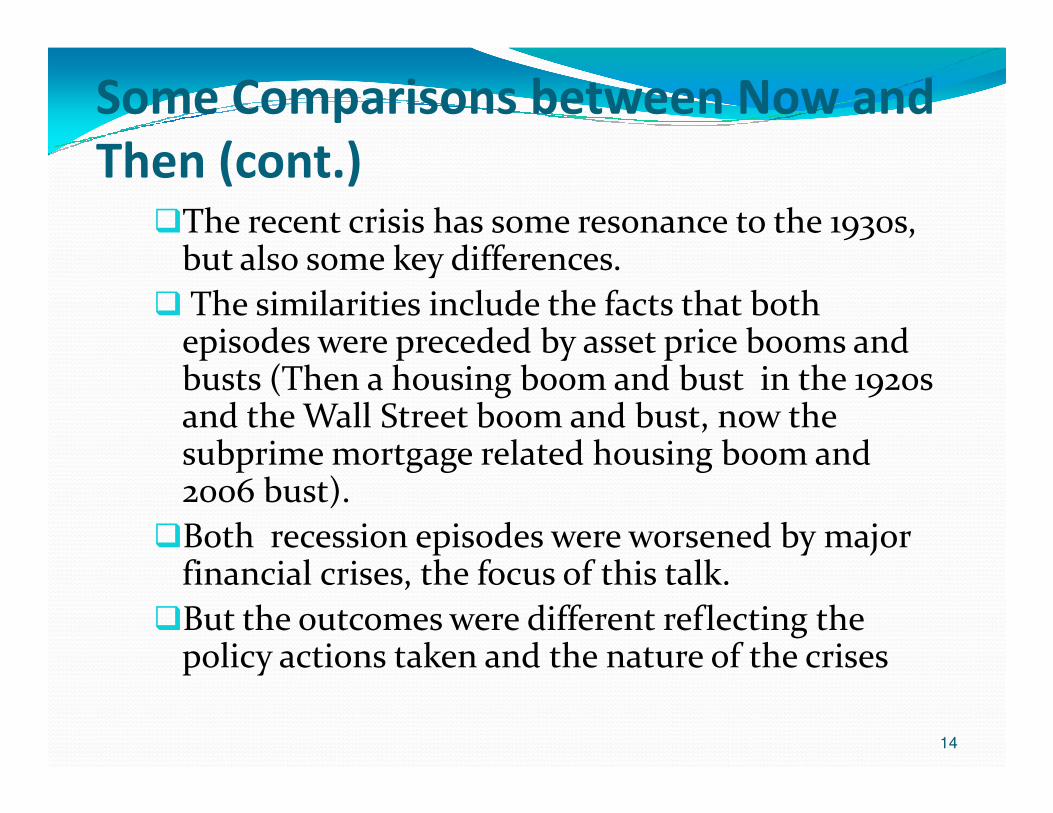
Then (cont.)�The recent crisis has some resonance to the 1930s,
but also some key differences.
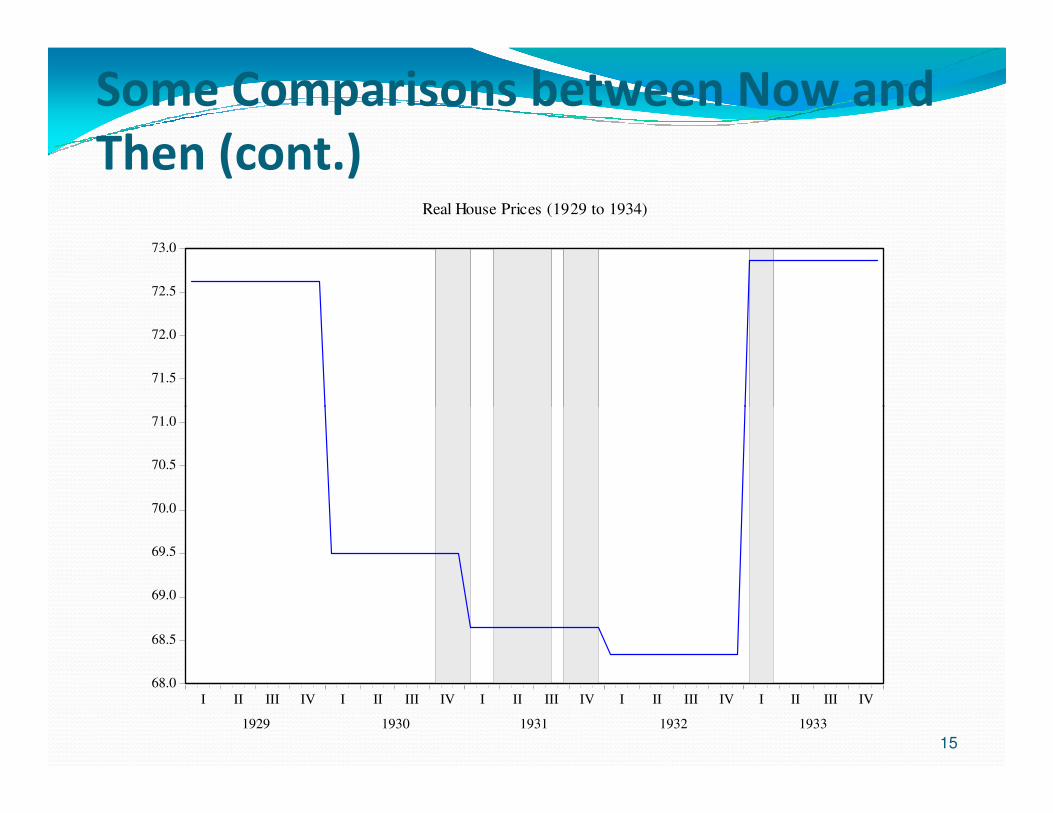
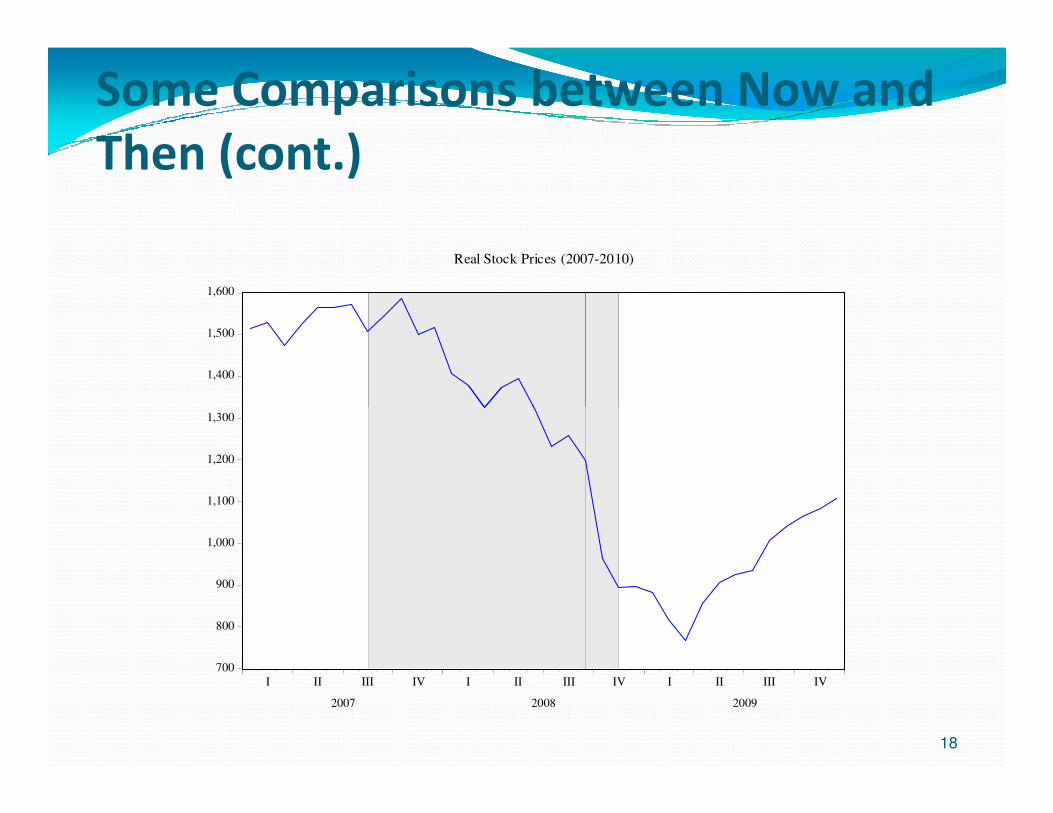
� The similarities include the facts that both episodes were preceded by asset price booms and busts (Then a housing boom and bust in the 1920s and the Wall Street boom and bust, now the and the Wall Street boom and bust, now the subprime mortgage related housing boom and 2006 bust).
�Both recession episodes were worsened by major financial crises, the focus of this talk.
�But the outcomes were different reflecting the policy actions taken and the nature of the crises
14
Some Comparisons between Now and
Then (cont.)
71.5
72.0
72.5
73.0
Real House Prices (1929 to 1934)
68.0
68.5
69.0
69.5
70.0
70.5
71.0
I II III IV I II III IV I II III IV I II III IV I II III IV
1929 1930 1931 1932 1933
15

180
190
200
Real House Prices (2007-2010)
Some Comparisons between Now and
Then (cont.)
120
130
140
150
160
170
I II III IV I II III IV I II III IV
2007 2008 2009
16

320
360
400
Real Stock Prices (1929-1934)
Some Comparisons between Now and
Then (cont.)
40
80
120
160
200
240
280
I II III IV I II III IV I II III IV I II III IV I II III IV
1929 1930 1931 1932 1933
17
1,400
1,500
1,600
Real Stock Prices (2007-2010)
Some Comparisons between Now and
Then (cont.)
700
800
900
1,000
1,100
1,200
1,300
I II III IV I II III IV I II III IV
2007 2008 2009
18
80
100
120
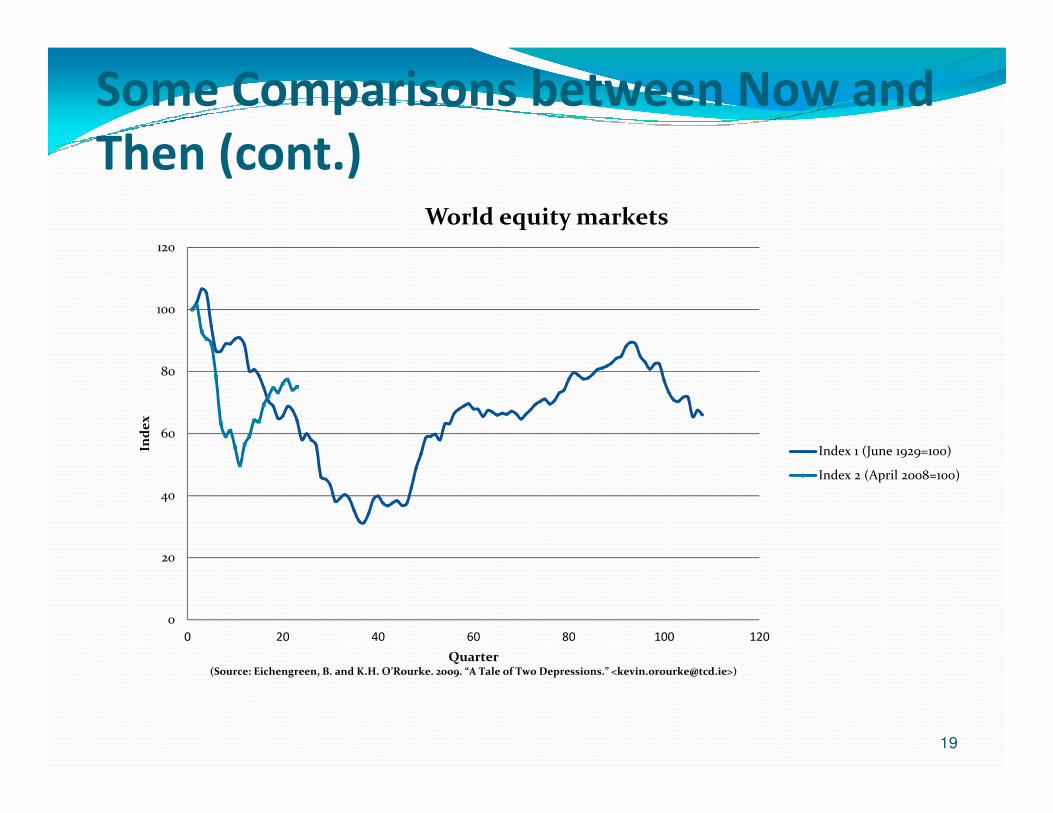
World equity markets
Some Comparisons between Now and
Then (cont.)
0
20
40
60
0 20 40 60 80 100 120
Ind
ex
Quarter(Source: Eichengreen, B. and K.H. O’Rourke. 2009. “A Tale of Two Depressions.” <[email protected]>)
Index 1 (June 1929=100)
Index 2 (April 2008=100)
19
The Banking Panics of the 1930s
�Fed tightening to stem the Wall Street boom in 1928 leads to recession August 1929 followed by Crash in October. Considerable evidence that the Crash didn’t cause the Great Depression.
� The real problem arose with a series of banking panics beginning in October 1930 and ending with the Bank Holiday in March 1933.
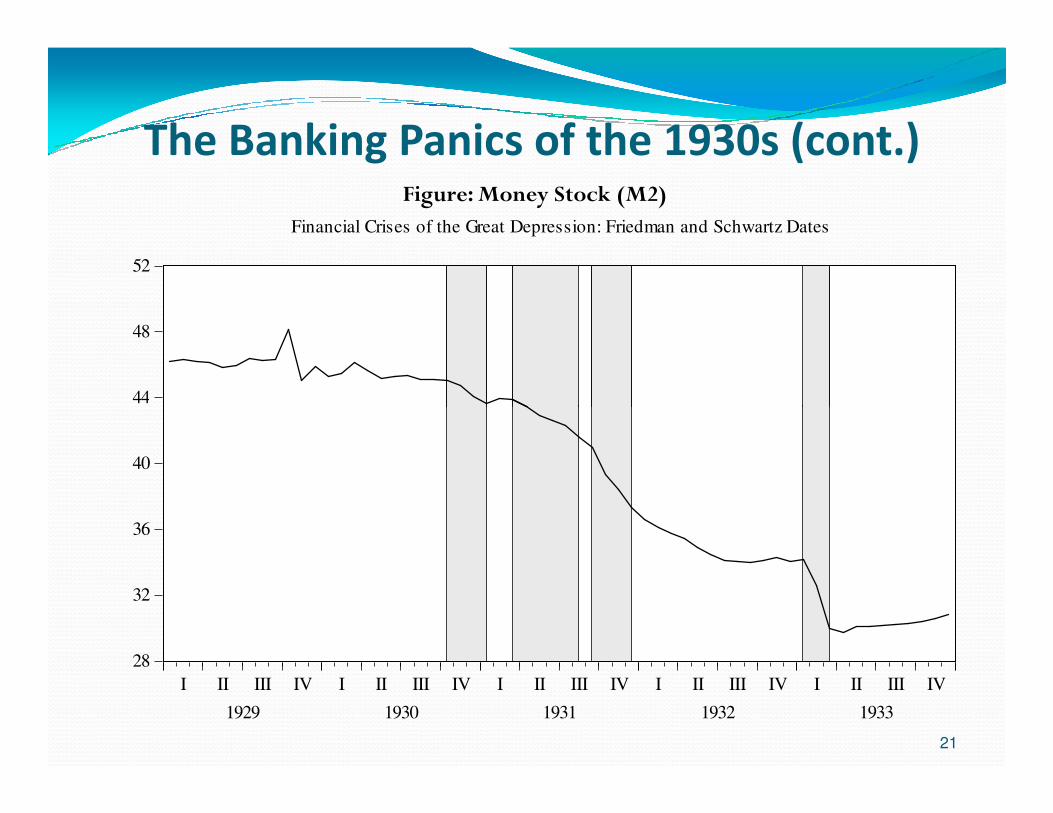
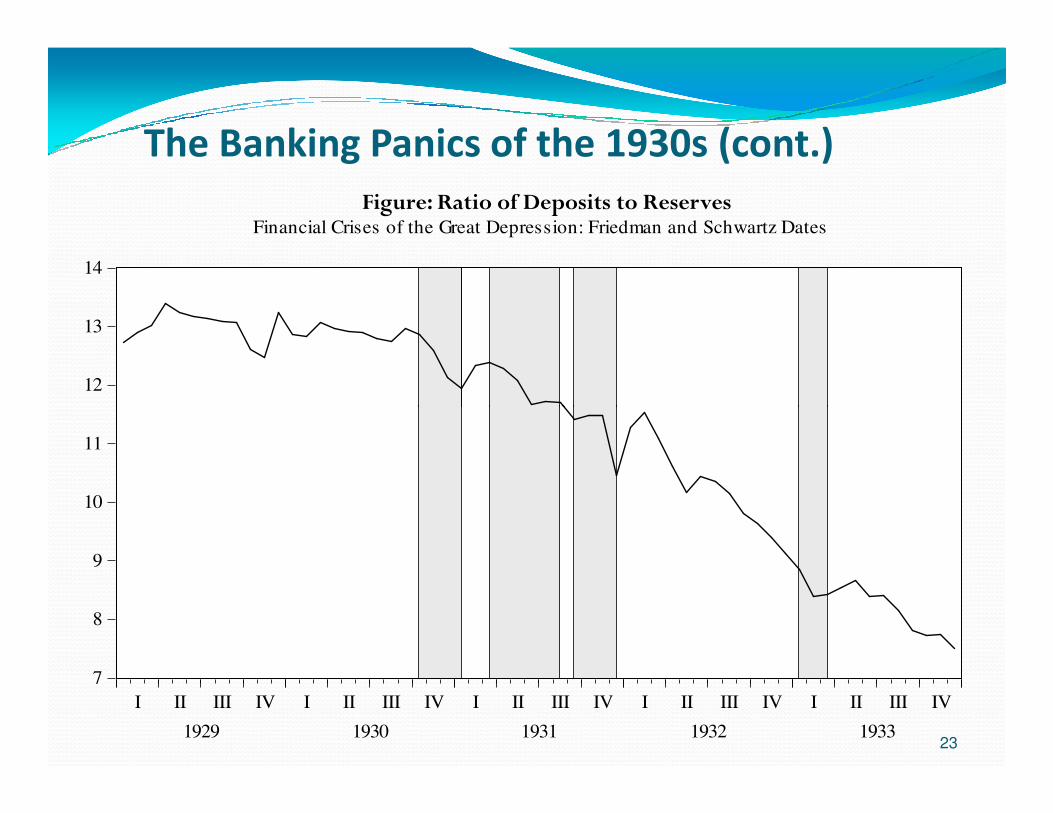
�Friedman and Schwartz posited that the panics by reducing the deposit currency and deposit reserve ratios reduced the money multiplier, and hence the money supply.
20
The Banking Panics of the 1930s (cont.)
44
48
52
Financial Crises of the Great Depression: Friedman and Schwartz Dates
Figure: Money Stock (M2)
21
28
32
36
40
44
I II III IV I II III IV I II III IV I II III IV I II III IV
1929 1930 1931 1932 1933

The Banking Panics of the 1930s (cont.)Figure: Ratio of Deposits to Currency in
Circulation
10
11
12
Financial Crises of the Great Depression: Friedman and Schwartz Dates
22
4
5
6
7
8
9
I II III IV I II III IV I II III IV I II III IV I II III IV
1929 1930 1931 1932 1933
The Banking Panics of the 1930s (cont.)
12
13
14
Financial Crises of the Great Depression: Friedman and Schwartz Dates
Figure: Ratio of Deposits to Reserves
23
7
8
9
10
11
I II III IV I II III IV I II III IV I II III IV I II III IV
1929 1930 1931 1932 1933
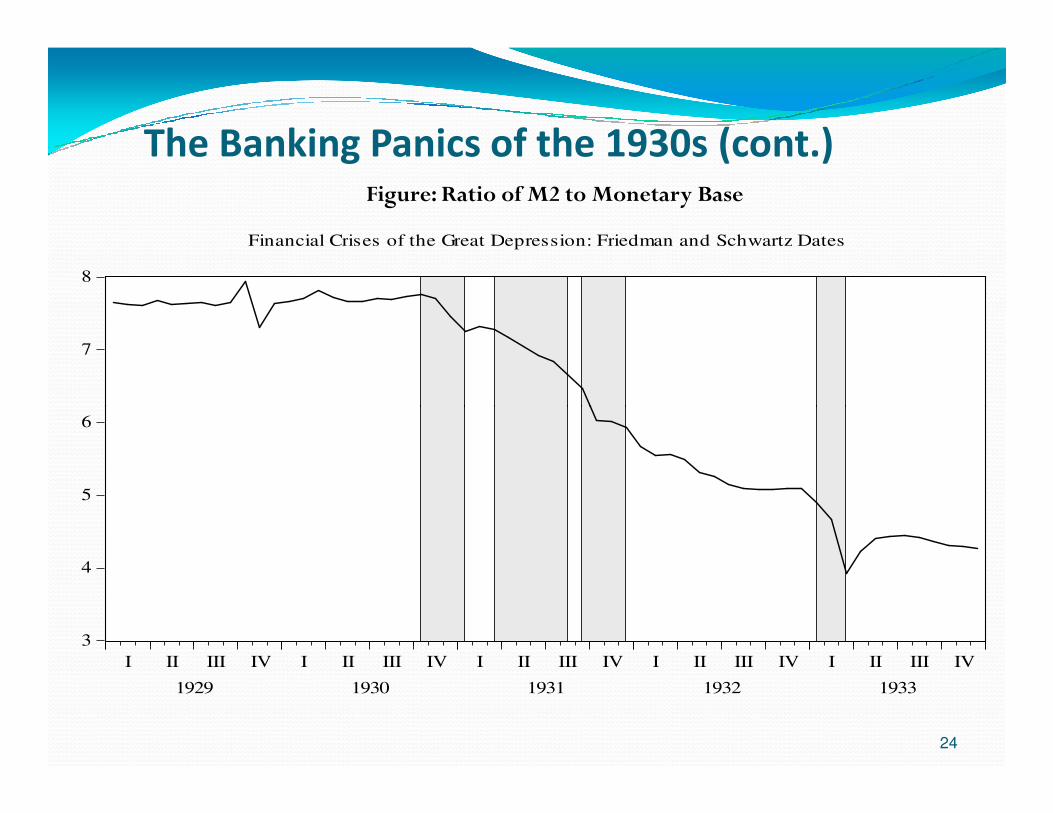
The Banking Panics of the 1930s (cont.)Figure: Ratio of M2 to Monetary Base
7
8
Financial Crises of the Great Depression: Friedman and Schwartz Dates
24
3
4
5
6
I II III IV I II III IV I II III IV I II III IV I II III IV
1929 1930 1931 1932 1933
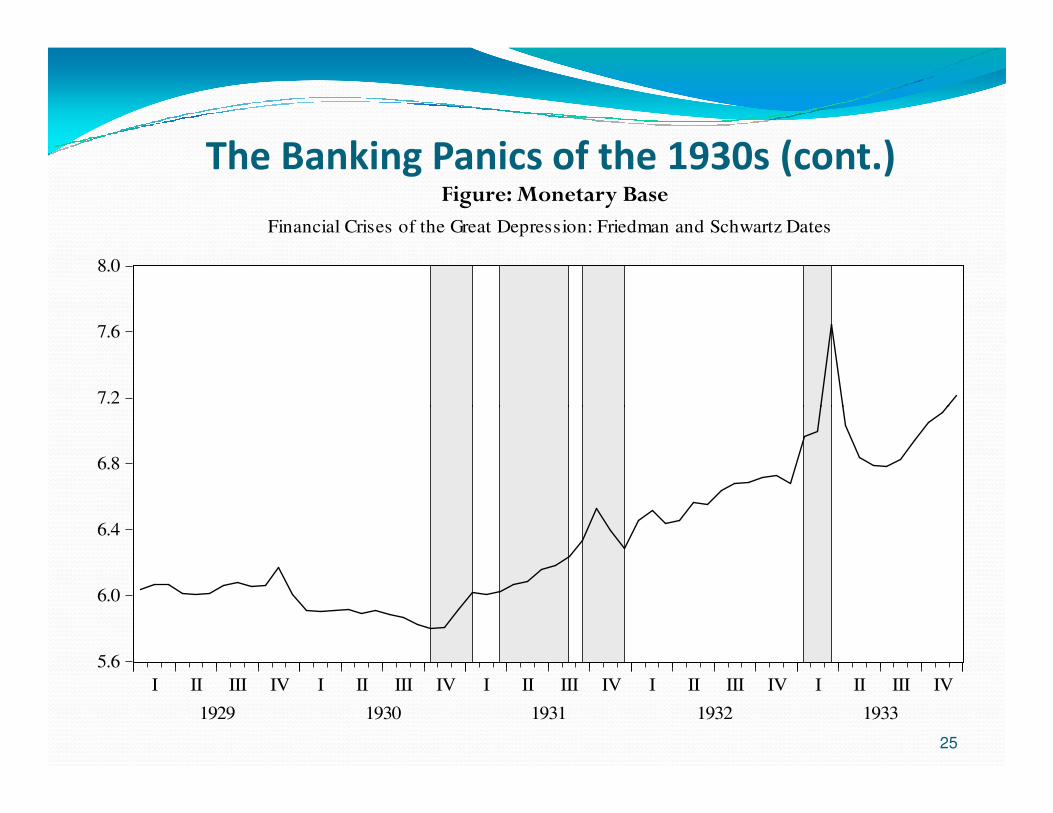
The Banking Panics of the 1930s (cont.)Figure: Monetary Base
7.2
7.6
8.0
Financial Crises of the Great Depression: Friedman and Schwartz Dates
25
5.6
6.0
6.4
6.8
7.2
I II III IV I II III IV I II III IV I II III IV I II III IV
1929 1930 1931 1932 1933
The Banking Panics of the 1930s (cont.)
� The panic reflected a ‘contagion of fear’ as the public converted deposits into currency, ie currency hoarding, staged runs on the banking system leading to massive bank suspensions – ‘a liquidity shock’.
�The collapse in money supply led to a decline in nominal spending and in the face of nominal rigidities a decline in employment and output.spending and in the face of nominal rigidities a decline in employment and output.
�The process was aggravated by banks dumping their earning assets in a fire sale and by debt deflation. This led to insolvencies of banks with initially sound balance sheets.
� Bernanke (1983) also attributed the banking panics of the 30s to creating the Great Contraction. Bank failures crippled the mechanism of financial intermediation.
�This effect can be seen in the quality spread (Baa less 10 year Treasuries)
26
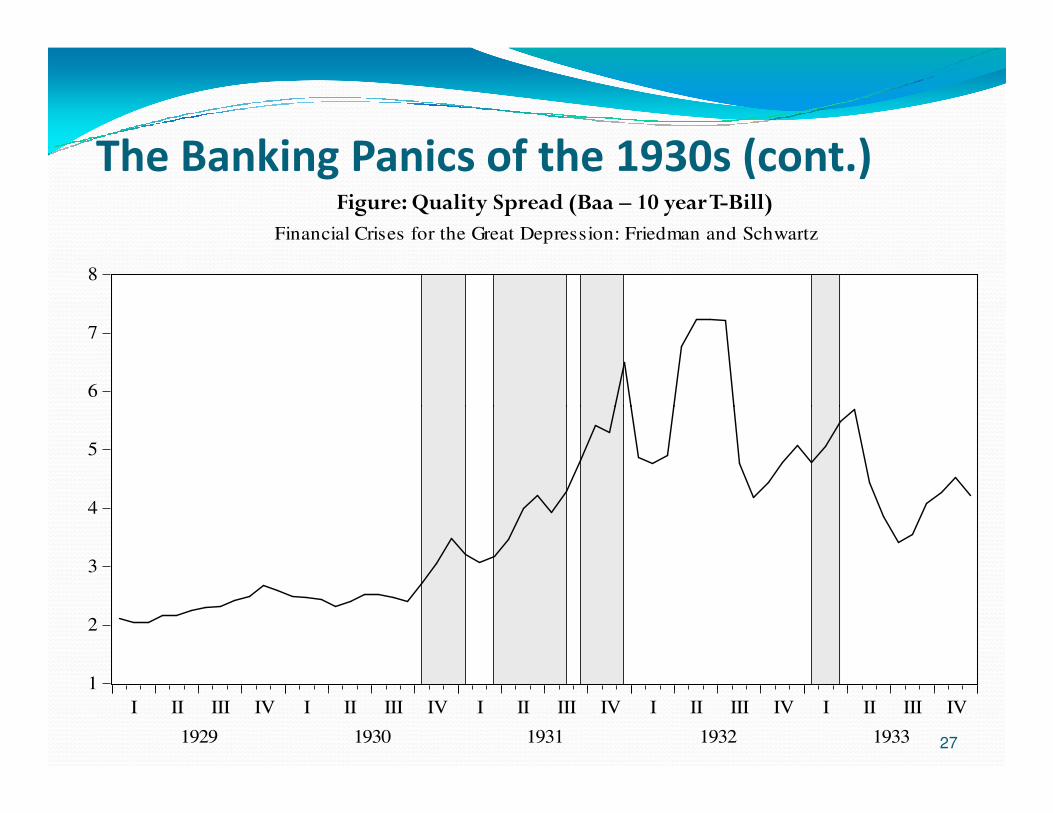
The Banking Panics of the 1930s (cont.)Figure: Quality Spread (Baa – 10 year T-Bill)
6
7
8
Financial Crises for the Great Depression: Friedman and Schwartz
27
1
2
3
4
5
I II III IV I II III IV I II III IV I II III IV I II III IV
1929 1930 1931 1932 1933
The Banking Panics of the 1930s (cont.)
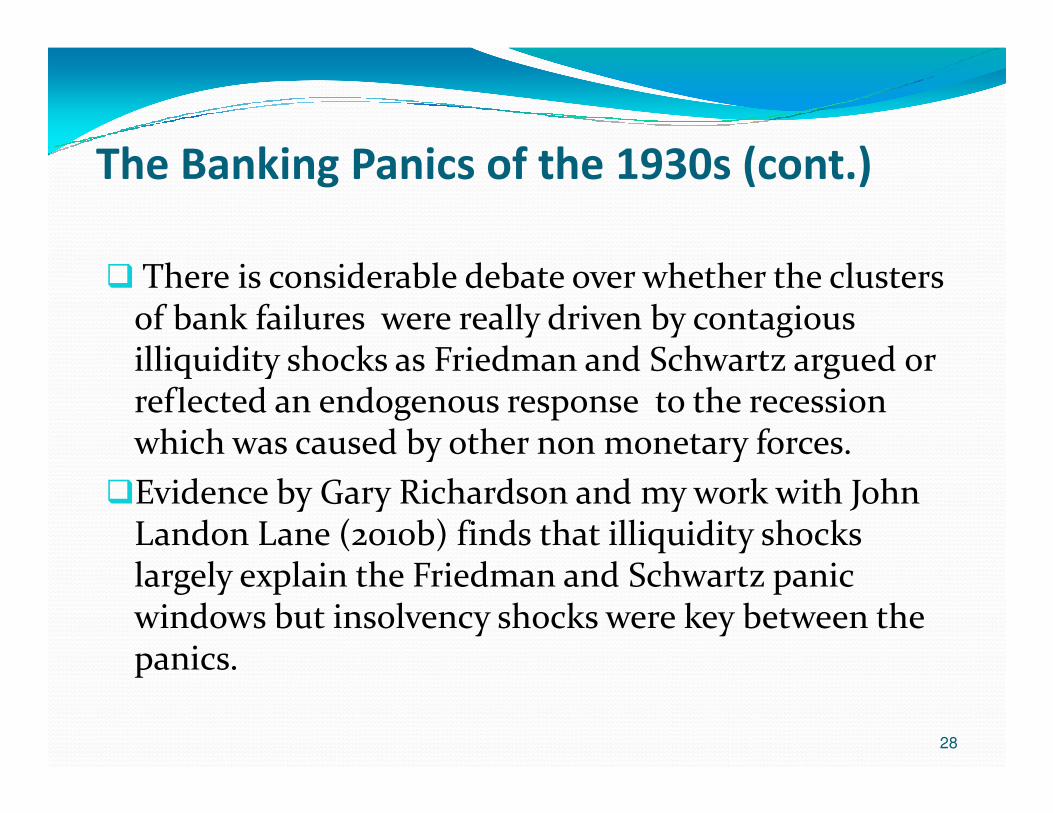
� There is considerable debate over whether the clusters of bank failures were really driven by contagious illiquidity shocks as Friedman and Schwartz argued or reflected an endogenous response to the recession reflected an endogenous response to the recession which was caused by other non monetary forces.
�Evidence by Gary Richardson and my work with John Landon Lane (2010b) finds that illiquidity shocks largely explain the Friedman and Schwartz panic windows but insolvency shocks were key between the panics.
28
Illiquidity versus Insolvency
� Bordo and Landon-Lane (2010b) conducted an econometric study with quarterly data using Gary Richardson’s data from a Federal Reserve survey on Richardson’s data from a Federal Reserve survey on bank failures due to insolvency and bank failures due to illiquidity 1929-33
29
Illiquidity versus Insolvency (cont.)� We estimate an orthogonalized VAR using the
following data
� Log (bank failures/suspensions due to illiquidity)
� Log (bank failures/suspensions due to insolvency)� Log (bank failures/suspensions due to insolvency)
� Log (total bank failures/suspensions)
� Growth rate of money supply (M2)
� Change in Unemployment rate
� Quality spread – difference between yield on Baa quality bonds and 10 year Treasury Bills
� The variables are ordered as above.
30
4.4
4.8
5.2
5.6
6.0
6.4
Total Bank Failures (Illiquidity Shock)
2.8
3.2
3.6
4.0
III IV I II III IV I II III IV I II III IV I
1929 1930 1931 1932 1933
Actual His torical Decom pos ition
31
4.4
4.8
5.2
5.6
6.0
6.4
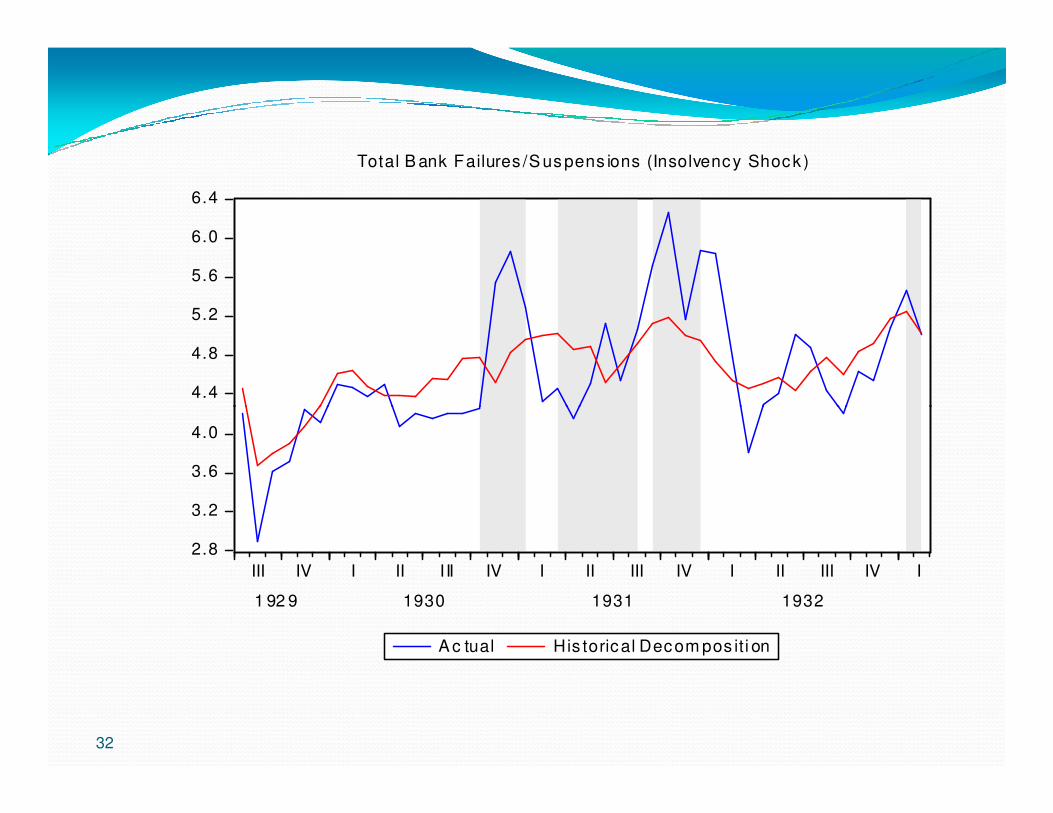
Total B ank Failures /S us pens ions (Insolvency Shock )
2.8
3.2
3.6
4.0
III IV I II I II IV I II III IV I II III IV I
1 92 9 1930 1931 1932
A c tual His torical Decom pos iti on
32
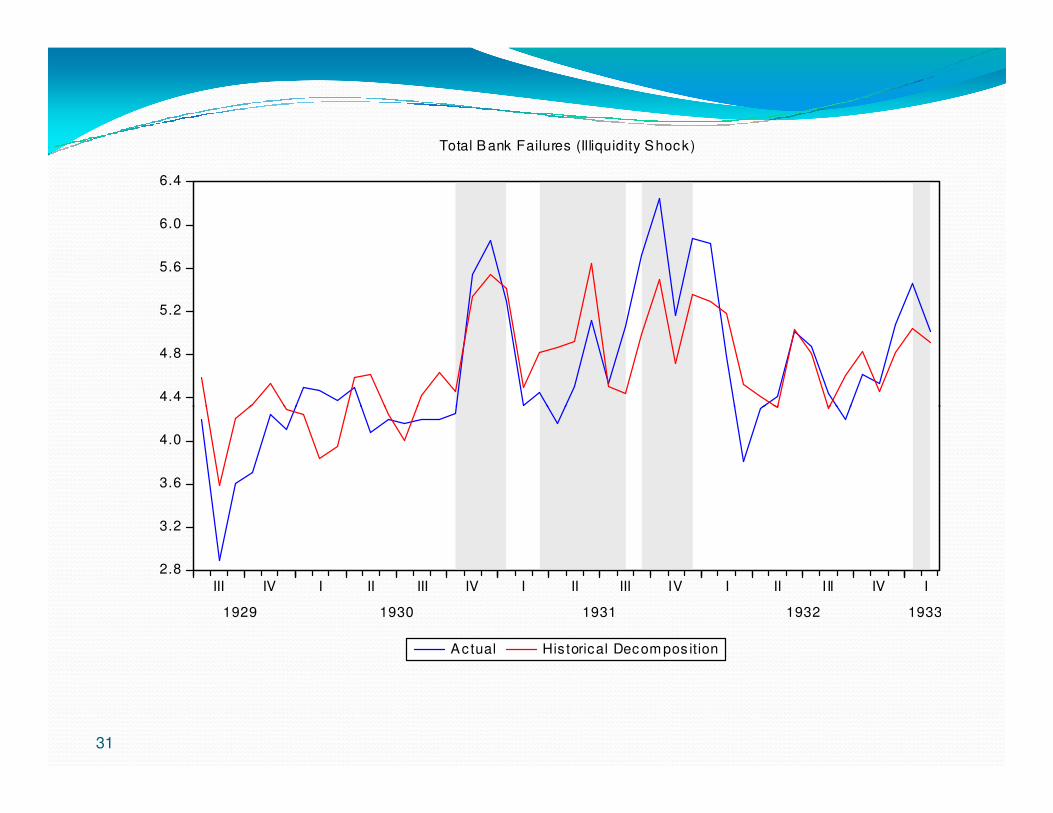
Historical Decompositions� The historical decompositions clearly point to the
illiquidity shock playing a significant role in the bank failures during the FS crisis windows.
� The most obvious case is during the first panic in the � The most obvious case is during the first panic in the fall of 1930.
� For the next 2 crises in 1931 the liquidity shock generates series that follow the actual series quite well.
� The only crisis window that the insolvency shock predicts well is the final crisis in 1933.
33
The Banking Panics of the 1930s (cont.)
�The upshot of the banking panics according to Friedman and Schwartz, Meltzer, Bernanke and Wicker is that they represented a major Fed policy failure.failure.
� The Fed which was founded in 1913 in large part to be a lender of last resort to the banking system failed in its duty.
�Expansionary open market policy could have prevented the Great Contraction.
34
The Recent Crisis
�The crisis of 2007-2008, like 29-33 started with an asset boom that bust.
�The collapse of the subprime mortgage market led to a panic in the shadow banking system which was not regulated by the Fed nor covered by the financial safety net.
�These institutions which expanded after the repeal in 1999 of �These institutions which expanded after the repeal in 1999 of the Depression era Glass Steagall Act which had separated investment banking from commercial banking, had much greater leverage than traditional banks and were much more prone to risk.
�When the crisis hit they were forced to engage in major deleveraging involving a fire sale of assets into a falling market.
35
The Recent Crisis (cont.)
�This lowered the value of their assets and those of other institutions. A similar negative feedback loop occurred in the 30s.
�Gorton ( 2010) posits that the crisis started in the repo market which had been collateralized by opaque ( market which had been collateralized by opaque ( subprime) mortgage backed securities by which investment banks and universal banks had been funded.
�The repo crisis continued through 2008 and then morphed into an investment /universal bank crisis after the failure of Lehman Brothers in September 2008.
36
The Recent Crisis (cont.)
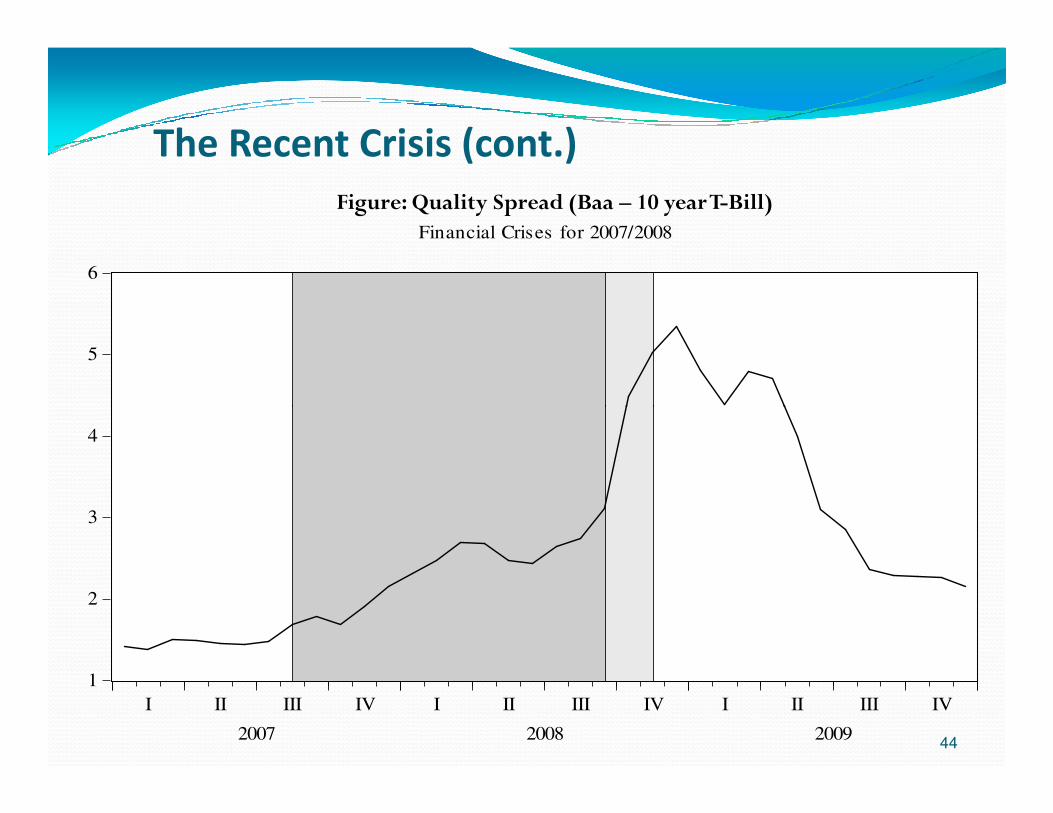
�The crisis led to a credit crunch which led to a serious recession.
�The effects of the credit crisis can be seen in the spike in the quality spread in fall 2008. It looks similar to what happened in 1931.what happened in 1931.
�However the recent crisis was not a contagious banking panic. There was no collapse in the money supply brought about by the collapse of the deposit currency ratio as in the 30s.
�M2 didn’t collapse. Indeed it rose reflecting expansionary monetary policy.
37
The Recent Crisis (cont.)
�The deposit currency ratio rose. There was no run on the commercial banks because depositors knew that their deposits were protected by federal deposit insurance which had been introduced in 1934 in reaction to the bank runs of the 1930s.the 1930s.
�The Deposit Reserve ratio declined reflecting an expansionary monetary policy induced increase in banks excess reserves rather than a scramble for liquidity as in the 30s.
�The money multiplier declined in the recent crisis reflecting a massive expansion in the monetary base reflecting the Fed’s doubling of its balance sheet in 2008.
38
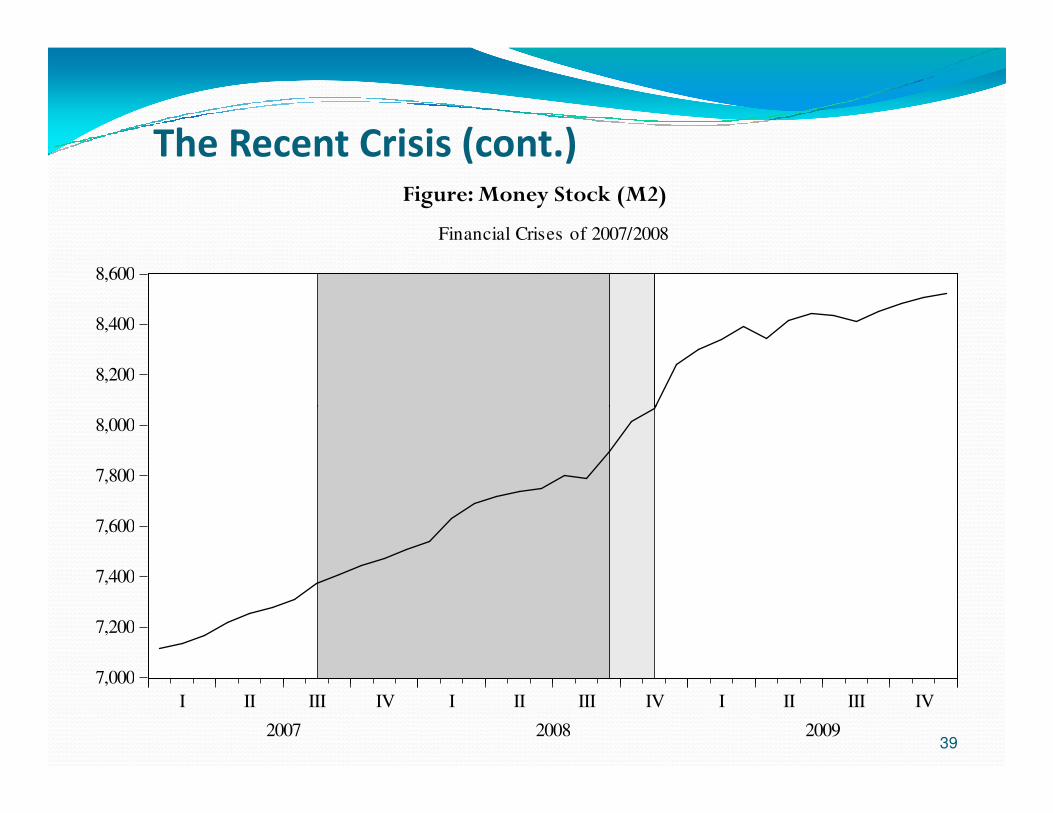
The Recent Crisis (cont.)Figure: Money Stock (M2)
8,200
8,400
8,600
Financial Crises of 2007/2008
39
7,000
7,200
7,400
7,600
7,800
8,000
I II III IV I II III IV I II III IV
2007 2008 2009
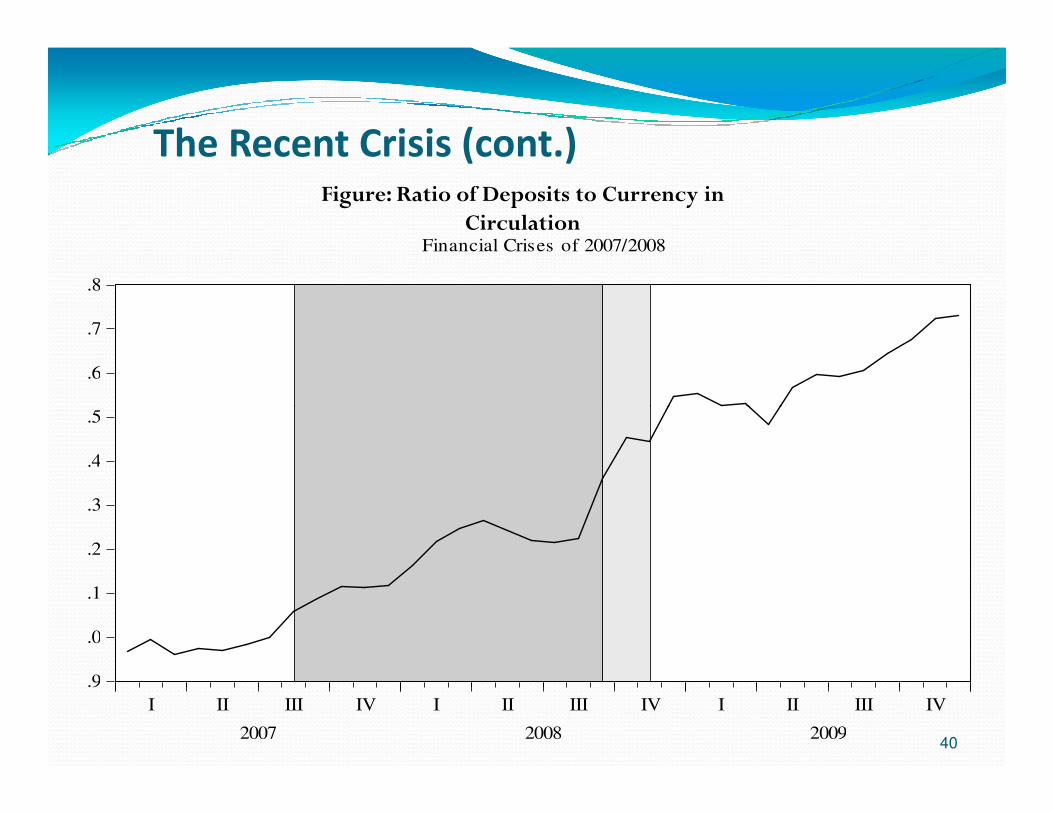
The Recent Crisis (cont.)Figure: Ratio of Deposits to Currency in
Circulation
5.5
5.6
5.7
5.8
Financial Crises of 2007/2008
40
4.9
5.0
5.1
5.2
5.3
5.4
5.5
I II III IV I II III IV I II III IV
2007 2008 2009
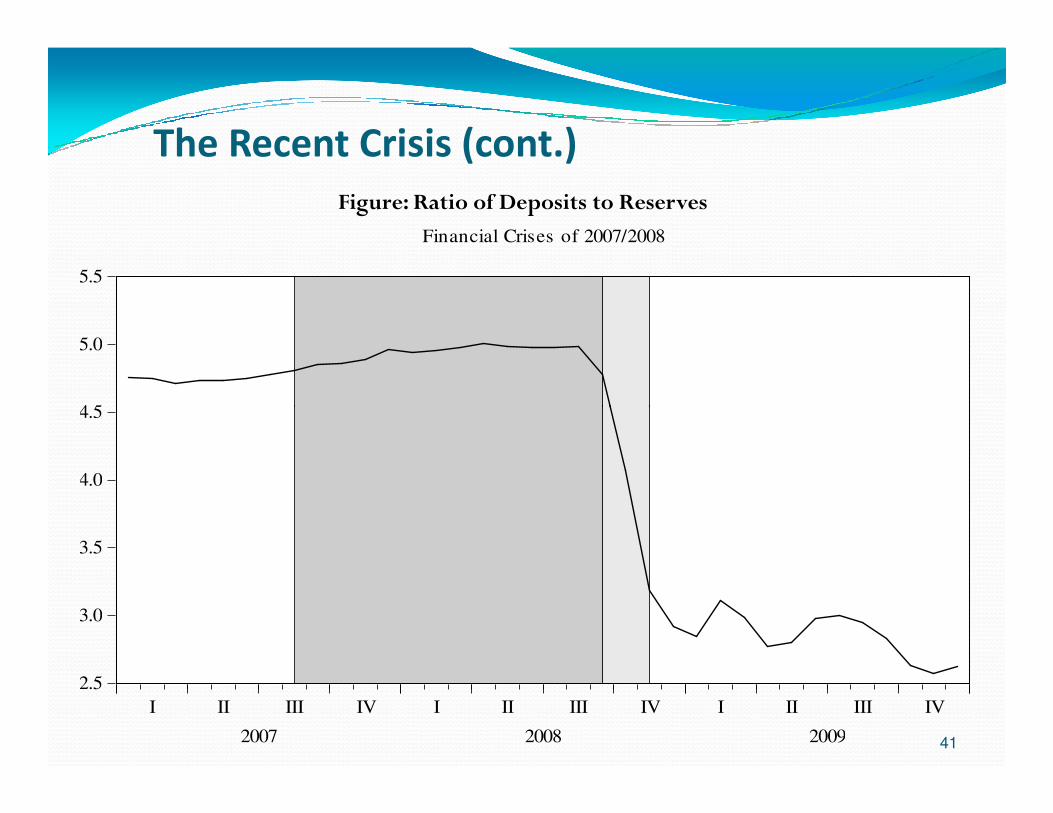
The Recent Crisis (cont.)
Figure: Ratio of Deposits to Reserves
4.5
5.0
5.5
Financial Crises of 2007/2008
41
2.5
3.0
3.5
4.0
4.5
I II III IV I II III IV I II III IV
2007 2008 2009
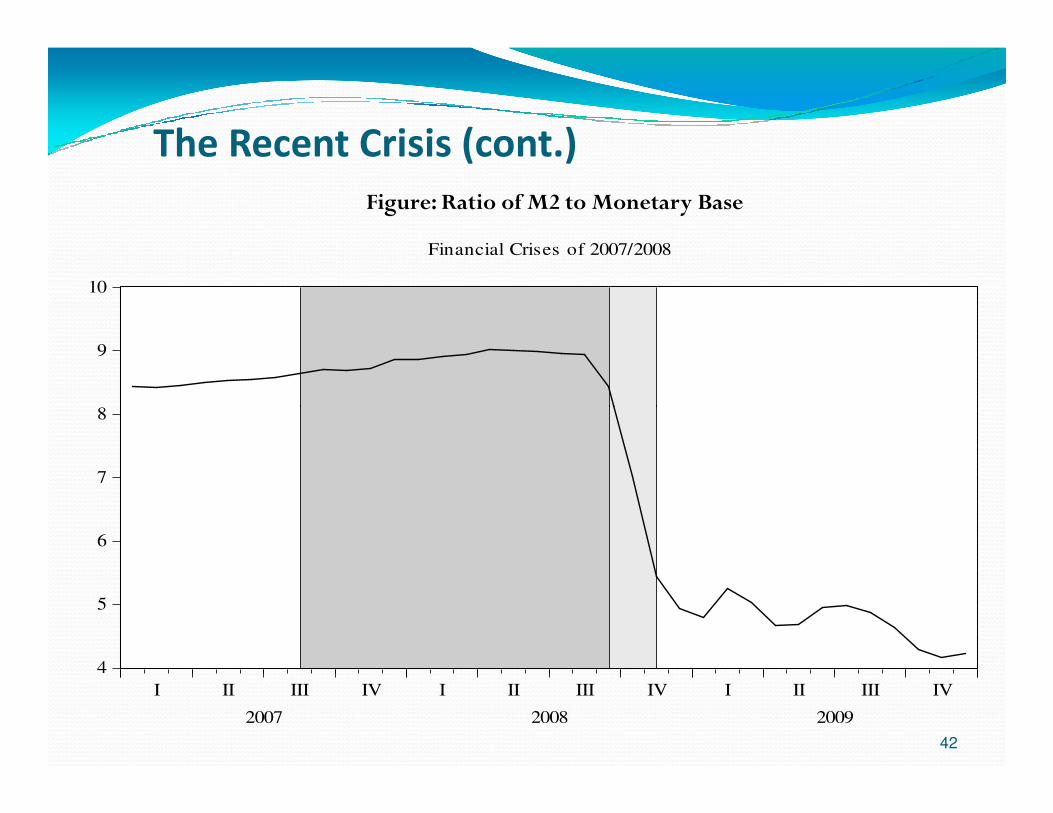
The Recent Crisis (cont.)
Figure: Ratio of M2 to Monetary Base
8
9
10
Financial Crises of 2007/2008
42
4
5
6
7
8
I II III IV I II III IV I II III IV
2007 2008 2009
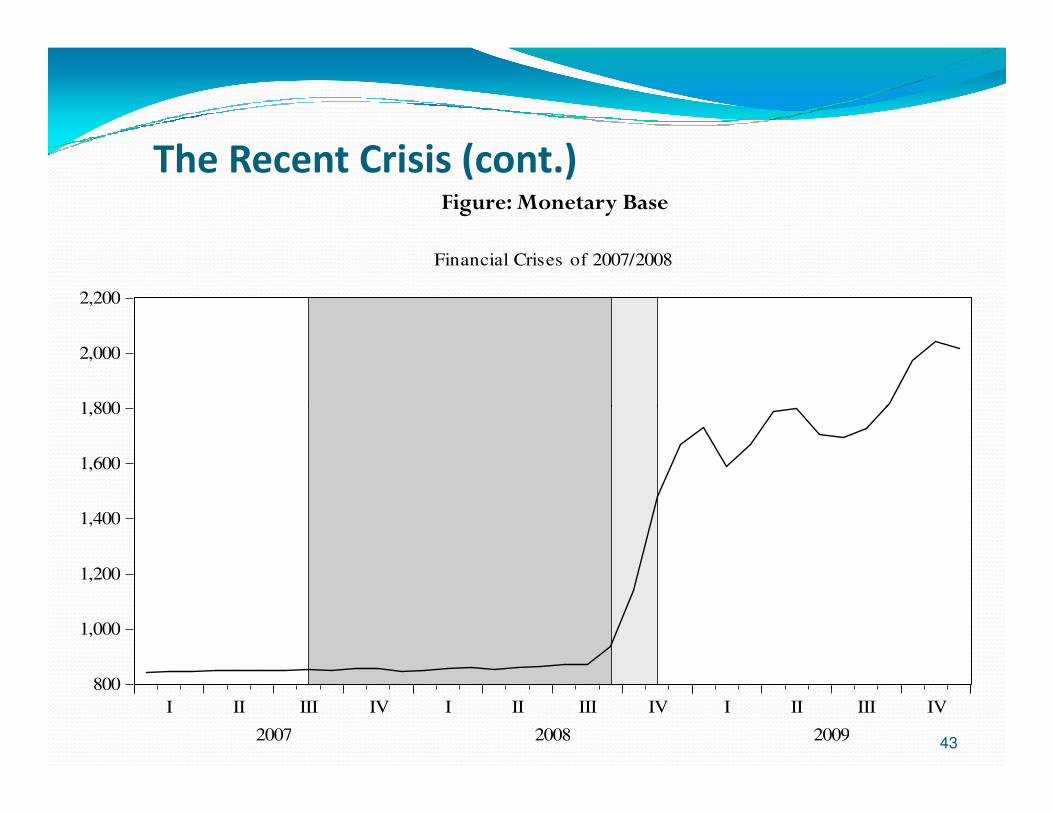
The Recent Crisis (cont.)Figure: Monetary Base
1,800
2,000
2,200
Financial Crises of 2007/2008
43
800
1,000
1,200
1,400
1,600
1,800
I II III IV I II III IV I II III IV
2007 2008 2009
The Recent Crisis (cont.)
Figure: Quality Spread (Baa – 10 year T-Bill)
5
6
Financial Crises for 2007/2008
44
1
2
3
4
I II III IV I II III IV I II III IV
2007 2008 2009
The Recent Crisis (cont.)
�Moreover although a few banks failed in the last 3 years the numbers and deposits lost were small relative to the 1930s.
�Thus the recent financial crisis was not driven by a Friedman and Schwartz banking panic.
�But there was a panic in the shadow banking system and it �But there was a panic in the shadow banking system and it was driven more by insolvency than by contagious illiquidity considerations.
�The problem stemmed from the difficulty of pricing securities backed by a pool of assets where the quality of individual components of the pool varies and unless each component is individually examined and evaluated, no accurate price of the security can be determined.
45
The Recent Crisis (cont.)
�As a result, the credit market, confronted by financial firms whose portfolios were filled with securities of uncertain value , derivatives that were so complex the art of pricing them had not been mastered, was plagued by inability to determine which firms were solvent and inability to determine which firms were solvent and which were not.
�Lenders were unwilling to extend loans when they couldn’t be sure that a borrower was credit worthy.
�This was a serious shortcoming of securitization process that was responsible for the paralysis of the credit market.
46

The Policy Response to the Crisis
�The Federal Reserve learned the Friedman and Schwartz lesson from the banking panics of the 30s of the importance of conducting expansionary open market policy to meet all demands for liquidity.
�In the recent crisis the Fed conducted highly expansionary monetary policy in the fall of 2007 and from late 2008 to the monetary policy in the fall of 2007 and from late 2008 to the present.
�Fed policy was likely too cautious in the first three quarters of 2008 seen in high real interest rates and flat monetary aggregates.
�However from the last quarter of 2008 Fed policy has been highly expansionary as they pushed the funds rate to close to zero and embarked on an aggressive policy of quantitative easing.
47

The Policy Response to the Crisis (cont.)
�Also based on Bernanke’s 1983 view that the 1930s banking collapse led to a failure of the credit allocation mechanism, the Fed, in conjunction with the Treasury, developed a plethora of extensions to its discount window, referred to by Goodfriend as credit policy, to encompass virtually every kind of collateral in an attempt to unclog the credit markets.attempt to unclog the credit markets.
�Finally another hallmark of the recent crisis which was not present in the Great Contraction is that the Fed and other US monetary authorities engaged in a series of bailouts of incipient and actual insolvent firms deemed systematically too connected to fail.
�These included Bear Stearns in March 2008, the GSEs in July and AIG in September.
48

The Policy Response to the Crisis (cont.)
�Lehman Brothers had been allowed to fail in September on the grounds that it was both insolvent and not as systemically important as the others and as was stated well after the event that the Fed didn’t have the legal authority to bail it out.
�Indeed, the deepest problem of the recent crisis was not �Indeed, the deepest problem of the recent crisis was not illiquidity as it was in the 1930s but insolvency and especially the fear of insolvencies of counterparties.
�This has echoes in the correspondent banking induced panic of November 1930.
�But very different from the 1930s, the too big to fail doctrine which had developed in the 1980s ensured that the monetary authorities would bail out insolvent large financial firms which were deemed to interconnected to fail.
49

The Policy Response to the Crisis (cont.)
�This is a dramatic departure from the original Bagehot’s Rule prescription to provide liquidity to illiquid but solvent banks.
�This new type of systemic risk raises the spectre of moral hazard and future financial crises and bailouts.
�Thus the policy response of aggressive monetary policy �Thus the policy response of aggressive monetary policy learned from the experience of the Great Depression greatly helped attenuate the impact of the financial crisis on the real economy.
�But the sources of systemic risk differed considerably between the two episodes: a contagious banking panic then, an insolvency driven counterparty risk problem now.
50

The Policy Response to the Crisis (cont.)
�The monetary authorities were slow to catch on that insolvency was the key issue.
�Once they did they bailed out institutions deemed to be too interconnected to fail. too interconnected to fail.
�This doctrine was not followed in the US in the 1930s. The insolvent Bank of United States, which was one of the largest banks in the country, was allowed to fail.
�However TBTF was a rationale for bailouts in Germany in 1931.
51

The Key Pressing Monetary Policy Issues for the
Future
�The first issue is the exit strategy, when should the Fed return from its current stance where the federal funds rate is close to zero to one consistent with long-run growth and low inflation?
�The risks facing monetary policy with respect to the exit are two fold; tightening too soon and creating a double dip two fold; tightening too soon and creating a double dip recession like 1937-38; and tightening too late leading to a run up of inflationary expectations.
�There are many examples of each type of error.
�My work with John Landon Lane (2010c) on the history of Fed exits after recessions since 1920 suggests that in the postwar the Fed usually began tightening once unemployment peaked and after inflation has resurfaced.
52

The Key Pressing Monetary Policy Issues for the
Future (cont.)
�On average tightening occurs two quarters after the peak in unemployment.
�Will that be the case today?
�It seems doubtful given that unemployment is still above 8%. Political pressure will likely ensure that the Fed doesn’t begin tightening before 2013.
�Moreover, the Fed has signaled that it will keep its policy rate low until 2013.
53

The Key Pressing Monetary Policy Issues for the
Future (cont.)
�But the lessons from the last two jobless recoveries is that the Fed kept rates too low for too long leading first to the inflation spike of 1994 and the Tequila crisis and second the housing boom in the 2000s.housing boom in the 2000s.
�Moreover to the extent the sluggish response reflects problems in the housing market, it is not clear what more monetary policy can do.
�Will history repeat itself?
54

The Key Pressing Monetary Policy Issues for the
Future (cont.)
�The second pressing issue coming from the bailouts of 2008 is that in the future the too big to fail doctrine will lead to excessive risk taking by such firms and future crises and bailouts.
�This was a major concern in the debate leading to the recent �This was a major concern in the debate leading to the recent Dodd Frank Wall Street Reform and Protection Act, passed in July 2010.
�The act attempted to address the too-big-to-fail problem by establishing a Financial Stability Oversight Council made up of members from the Federal Reserve Board, the Treasury, the Securities and Exchange Commission and a number of other financial agencies
55

The Key Pressing Monetary Policy Issues for the
Future (cont.)
�The Council was charged with identifying and responding to emerging risks throughout the financial system
�The Council would make recommendations to the Federal �The Council would make recommendations to the Federal Reserve to impose increasingly strict rules for capital and leverage and other requirements to prevent banks from becoming too large and systemically.
�It remains to be seen whether it will be effective in preventing future crises.
56