Embed Size (px)
Citation preview
HOOGOVENS USA, INC.
AND SUBSIDIARIES
AUDIT OF CONSOLIDATED FINANCIAL STATEMENTS
Years ended March 31, 2017 and 2016
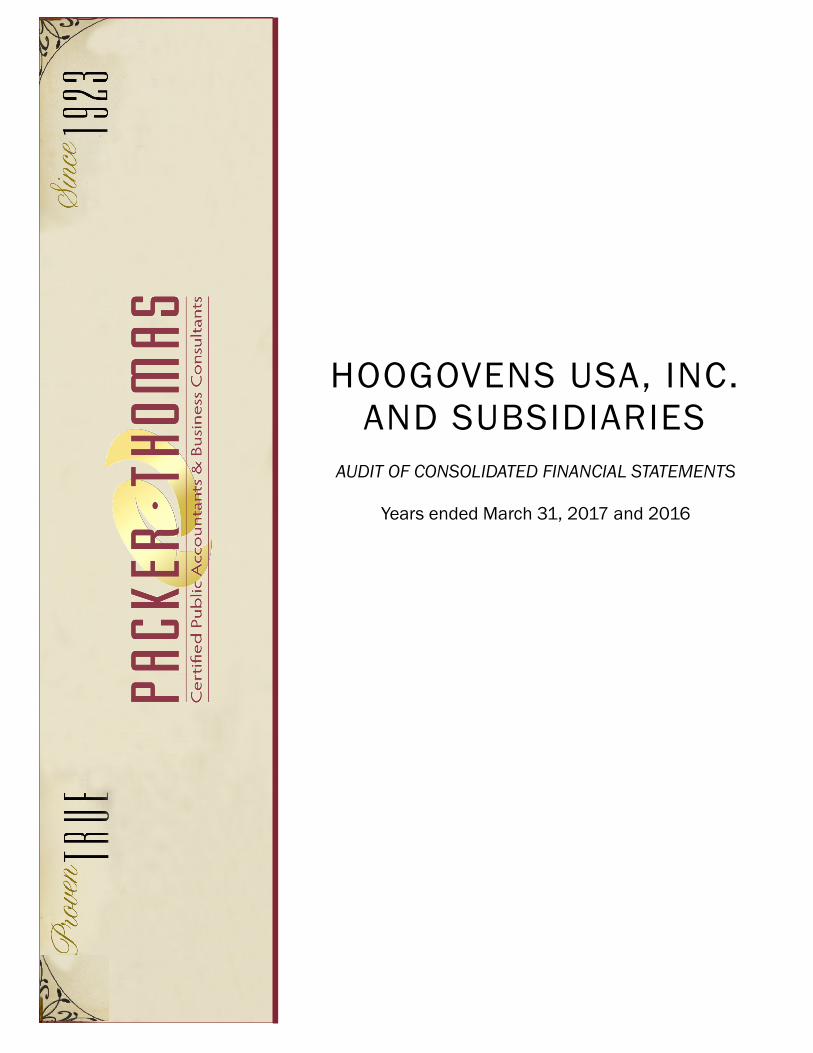
CONTENTS
REPORT OF INDEPENDENT AUDITORS 2-3
FINANCIAL STATEMENTS
Consolidated balance sheets 4
Consolidated statements of operations 5
Consolidated statements of comprehensive income 6
Consolidated statements of changes in stockholder's equity 7
Consolidated statements of cash flows 8
Notes to consolidated financial statements 9-22
SUPPLEMENTARY SCHEDULES
Consolidating balance sheets 23-26
Consolidating statements of operations 27-28

6601 Westford Place
Suite 101
Canfield, Ohio
44406
330-533-9777
1-800-943-4278
Fax: 330-533-1734
325 East Washington St
New Castle, PA
16101-4049
724-657-2880
1-800-943-4278
Fax: 724-658-1014
www.packerthomas.com
www.packerthomas.com
REPORT OF INDEPENDENT AUDITORS TO THE BOARD OF DIRECTORS OF HOOGOVENS USA, INC. AND SUBSIDIARIES WARREN, OHIO We have audited the accompanying consolidated financial statements of Hoogovens USA, Inc. and Subsidiaries, which comprise the consolidated balance sheets as of March 31, 2017 and 2016, and the related consolidated statements of operations, comprehensive income, changes in stockholders' equity, and cash flows for the years then ended, and the related notes to the financial statements. Management's Responsibility for the Financial Statements Management is responsible for the preparation and fair presentation of these consolidated financial statements in accordance with accounting principles generally accepted in the United States of America; this includes the design, implementation, and maintenance of internal control relevant to the preparation and fair presentation of consolidated financial statements that are free from material misstatement, whether due to fraud or error. Auditor's Responsibility Our responsibility is to express an opinion on these consolidated financial statements based on our audits. We conducted our audits in accordance with auditing standards generally accepted in the United States of America. Those standards require that we plan and perform the audit to obtain reasonable assurance about whether the consolidated financial statements are free from material misstatement. An audit involves performing procedures to obtain audit evidence about the amounts and disclosures in the consolidated financial statements. The procedures selected depend on the auditor's judgment, including the assessment of the risks of material misstatement of the consolidated financial statements, whether due to fraud or error. In making those risk assessments, the auditor considers internal control relevant to the entity's preparation and fair presentation of the consolidated financial statements in order to design audit procedures that are appropriate in the circumstances, but not for the purpose of expressing an opinion on the effectiveness of the entity's internal control. Accordingly, we express no such opinion. An audit also includes evaluating the appropriateness of accounting policies used and the reasonableness of significant accounting estimates made by management, as well as evaluating the overall presentation of the consolidated financial statements. We believe that the audit evidence we have obtained is sufficient and appropriate to provide a basis for our audit opinion. -2-
-3-
Opinion In our opinion, the consolidated financial statements referred to above present fairly, in all material respects, the financial position of Hoogovens USA, Inc. and Subsidiaries as of March 31, 2017 and 2016, and the results of their operations and their cash flows for the years then ended in accordance with accounting principles generally accepted in the United States of America. Report on Consolidating Information Our audits were conducted for the purpose of forming an opinion on the consolidated financial statements as a whole. The consolidating information on pages 23-28 is presented for purposes of additional analysis of the consolidated financial statements rather than to present the financial position, results of operations, and cash flows of the individual companies, and it is not a required part of the consolidated financial statements. Such information is the responsibility of management and was derived from and relates directly to the underlying accounting and other records used to prepare the consolidated financial statements. The consolidating information has been subjected to the auditing procedures applied in the audit of the consolidated financial statements and certain additional procedures, including comparing and reconciling such information directly to the underlying accounting and other records used to prepare the consolidated financial statements or to the consolidated financial statements themselves, and other additional procedures in accordance with auditing standards generally accepted in the United States of America. In our opinion, the consolidating information is fairly stated in all material respects in relation to the consolidated financial statements as a whole. New Castle, Pennsylvania July 11, 2017

Hoogovens USA, Inc. and Subsidiaries
CONSOLIDATED BALANCE SHEETS
ASSETS
2017 2016
CURRENT ASSETS
Cash 2,769,505$ 13,959,691$
Accounts receivable
Trade, less allowance for doubtful accounts of $30,616 and $0
at March 31, 2017 and 2016, respectively 9,529,561 8,941,552
Affiliated companies 2,146,573 509,721
Miscellaneous (3,254) 274,694
Total accounts receivable 11,672,880 9,725,967
Inventories
Work in process and finished goods 8,591,644 7,492,122
Raw materials and supplies 9,911,090 5,500,992
Total inventories 18,502,734 12,993,114
Note receivable from affiliated company 28,167,515 6,600,000
Prepaid expenses and other current assets 678,945 581,229
Federal income tax refundable - 202,000
Deferred federal income taxes 865,375 1,612,590
TOTAL CURRENT ASSETS 62,656,954 45,674,591
PROPERTY, PLANT AND EQUIPMENT
Land 5,151,669 5,151,669
Buildings 38,679,782 38,679,782
Machinery and equipment 214,628,547 214,047,993
Computer software 8,266,568 8,266,568
Gas well 290,613 290,613
Construction in progress 8,324,236 2,354,626
275,341,415 268,791,251
Less accumulated depreciation 251,847,230 248,827,887
NET PROPERTY, PLANT AND EQUIPMENT 23,494,185 19,963,364
OTHER ASSETS
Deferred federal income taxes 30,805,455 34,234,776
Other 110,677 110,677
TOTAL OTHER ASSETS 30,916,132 34,345,453
TOTAL ASSETS 117,067,271$ 99,983,408$
The accompanying notes are an integral part of these financial statements.
March 31,

LIABILITIES AND STOCKHOLDER'S EQUITY
2017 2016
CURRENT LIABILITIES
Bank overdraft 2,922,413$ -$
Accounts payable
Trade 5,777,143 2,989,826
Affiliated companies 15,029,015 1,520,357
Total accounts payable 20,806,158 4,510,183
Accrued vacation 937,013 902,770
Accrued income taxes 785,000 -
Other accrued liabilities and expenses 2,797,867 3,951,067
Current portion of accrued pension and postretirement benefits 3,478,834 5,522,212
TOTAL CURRENT LIABILITIES 31,727,285 14,886,232
OTHER LIABILITIES
Notes payable to affiliated company - 3,000,000
Accrued workers' compensation 570,377 518,694
Accrued pension liability 43,012,088 52,661,470
Accrued postretirement benefits 6,668,925 6,613,567
TOTAL OTHER LIABILITIES 50,251,390 62,793,731
TOTAL LIABILITIES 81,978,675 77,679,963
STOCKHOLDER'S EQUITY
Common stock, no par value; 1,000 shares authorized,
100 shares issued and outstanding 100 100
Additional paid-in capital 71,331,657 71,331,657
Accumulated earnings 4,936,848 1,476,812
Accumulated other comprehensive (loss), net of tax (41,180,009) (50,505,124)
TOTAL STOCKHOLDER'S EQUITY 35,088,596 22,303,445
TOTAL LIABILITIES AND STOCKHOLDER'S EQUITY 117,067,271$ 99,983,408$
-4-
March 31,
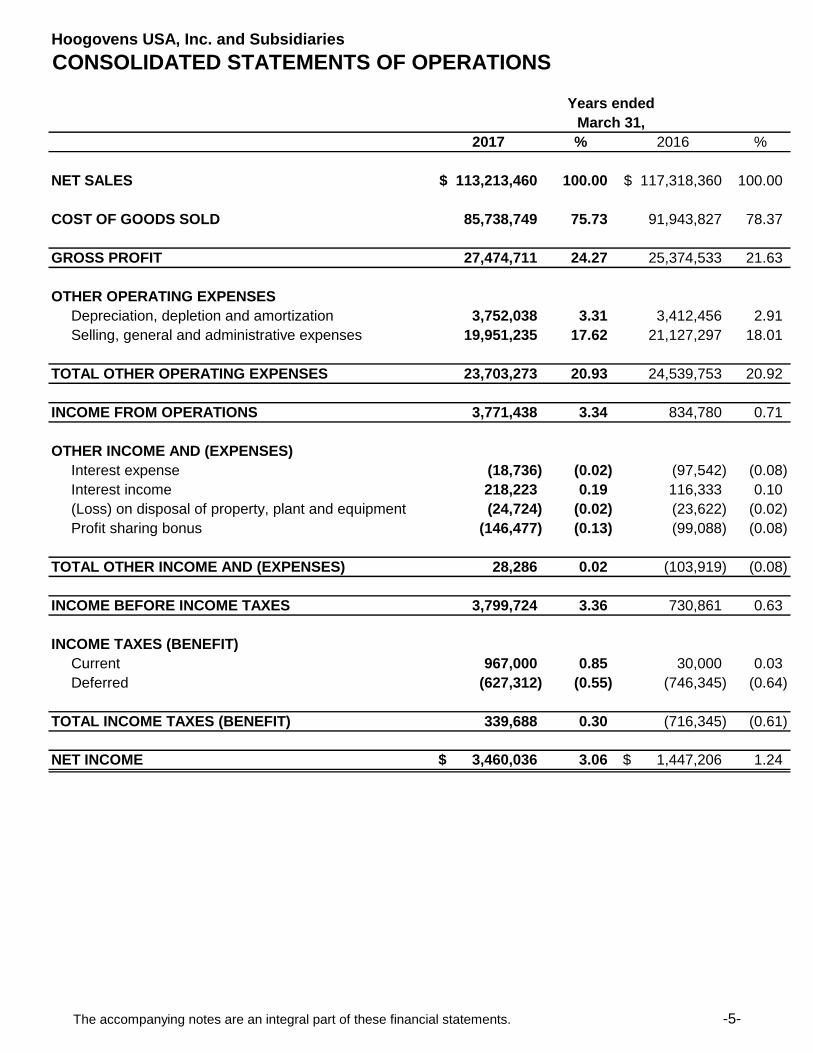
Hoogovens USA, Inc. and Subsidiaries
CONSOLIDATED STATEMENTS OF OPERATIONS
2017 % 2016 %
NET SALES 113,213,460$ 100.00 117,318,360$ 100.00
COST OF GOODS SOLD 85,738,749 75.73 91,943,827 78.37
GROSS PROFIT 27,474,711 24.27 25,374,533 21.63
OTHER OPERATING EXPENSES
Depreciation, depletion and amortization 3,752,038 3.31 3,412,456 2.91
Selling, general and administrative expenses 19,951,235 17.62 21,127,297 18.01
TOTAL OTHER OPERATING EXPENSES 23,703,273 20.93 24,539,753 20.92
INCOME FROM OPERATIONS 3,771,438 3.34 834,780 0.71
OTHER INCOME AND (EXPENSES)
Interest expense (18,736) (0.02) (97,542) (0.08)
Interest income 218,223 0.19 116,333 0.10
(Loss) on disposal of property, plant and equipment (24,724) (0.02) (23,622) (0.02)
Profit sharing bonus (146,477) (0.13) (99,088) (0.08)
TOTAL OTHER INCOME AND (EXPENSES) 28,286 0.02 (103,919) (0.08)
INCOME BEFORE INCOME TAXES 3,799,724 3.36 730,861 0.63
INCOME TAXES (BENEFIT)
Current 967,000 0.85 30,000 0.03
Deferred (627,312) (0.55) (746,345) (0.64)
TOTAL INCOME TAXES (BENEFIT) 339,688 0.30 (716,345) (0.61)
NET INCOME 3,460,036$ 3.06 1,447,206$ 1.24
Years ended
March 31,
The accompanying notes are an integral part of these financial statements. -5-
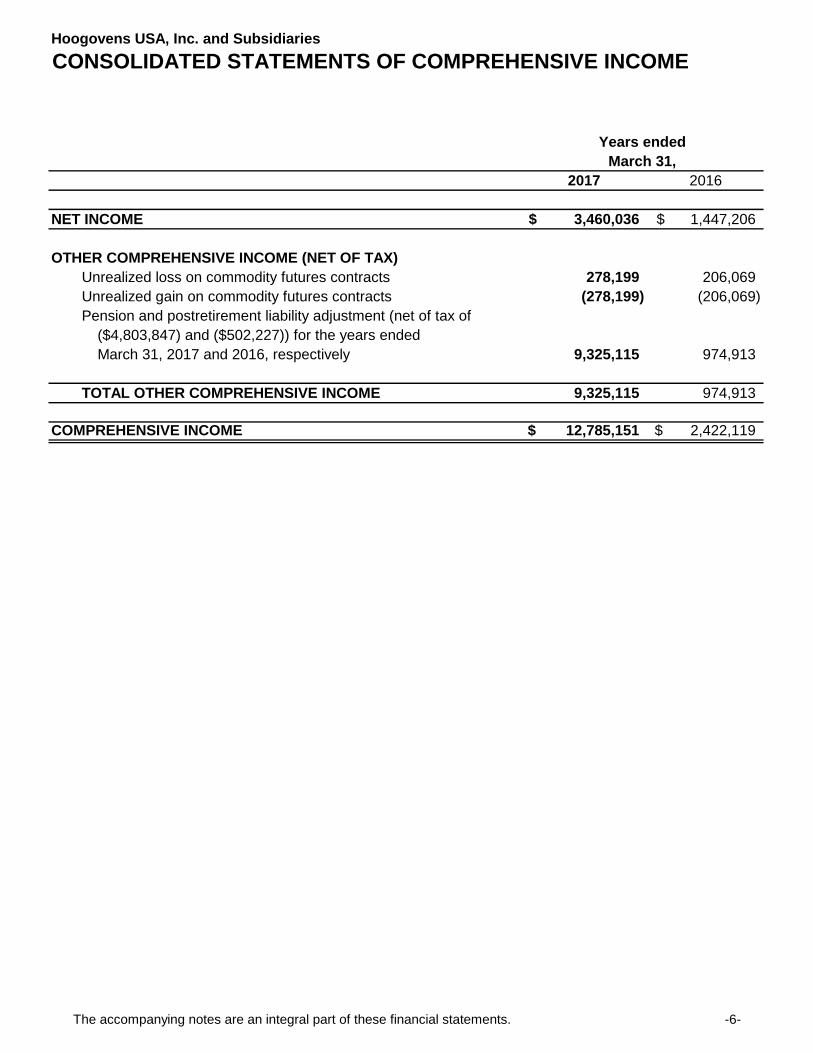
Hoogovens USA, Inc. and Subsidiaries
CONSOLIDATED STATEMENTS OF COMPREHENSIVE INCOME
Years ended
March 31,
2017 2016
NET INCOME 3,460,036$ 1,447,206$
OTHER COMPREHENSIVE INCOME (NET OF TAX)
Unrealized loss on commodity futures contracts 278,199 206,069
Unrealized gain on commodity futures contracts (278,199) (206,069)
Pension and postretirement liability adjustment (net of tax of
($4,803,847) and ($502,227)) for the years ended
March 31, 2017 and 2016, respectively 9,325,115 974,913
TOTAL OTHER COMPREHENSIVE INCOME 9,325,115 974,913
COMPREHENSIVE INCOME 12,785,151$ 2,422,119$
The accompanying notes are an integral part of these financial statements. -6-

Hoogovens USA, Inc. and Subsidiaries
CONSOLIDATED STATEMENTS OF CHANGES IN STOCKHOLDER'S EQUITY
ACCUMULATED
ADDITIONAL ACCUMULATED OTHER
COMMON PAID-IN EARNINGS COMPREHENSIVE
STOCK CAPITAL (DEFICIT) (LOSS) INCOME TOTAL
BALANCE--March 31, 2015 100$ 71,331,657$ 29,606$ (51,480,037)$ 19,881,326$
Net income - - 1,447,206 - 1,447,206
Other comprehensive income - - - 974,913 974,913
BALANCE--March 31, 2016 100 71,331,657 1,476,812 (50,505,124) 22,303,445
Net income - - 3,460,036 - 3,460,036
Other comprehensive income - - - 9,325,115 9,325,115
BALANCE-- March 31, 2017 100$ 71,331,657$ 4,936,848$ (41,180,009)$ 35,088,596$
-7-
The accompanying notes are an integral part of these financial statements.
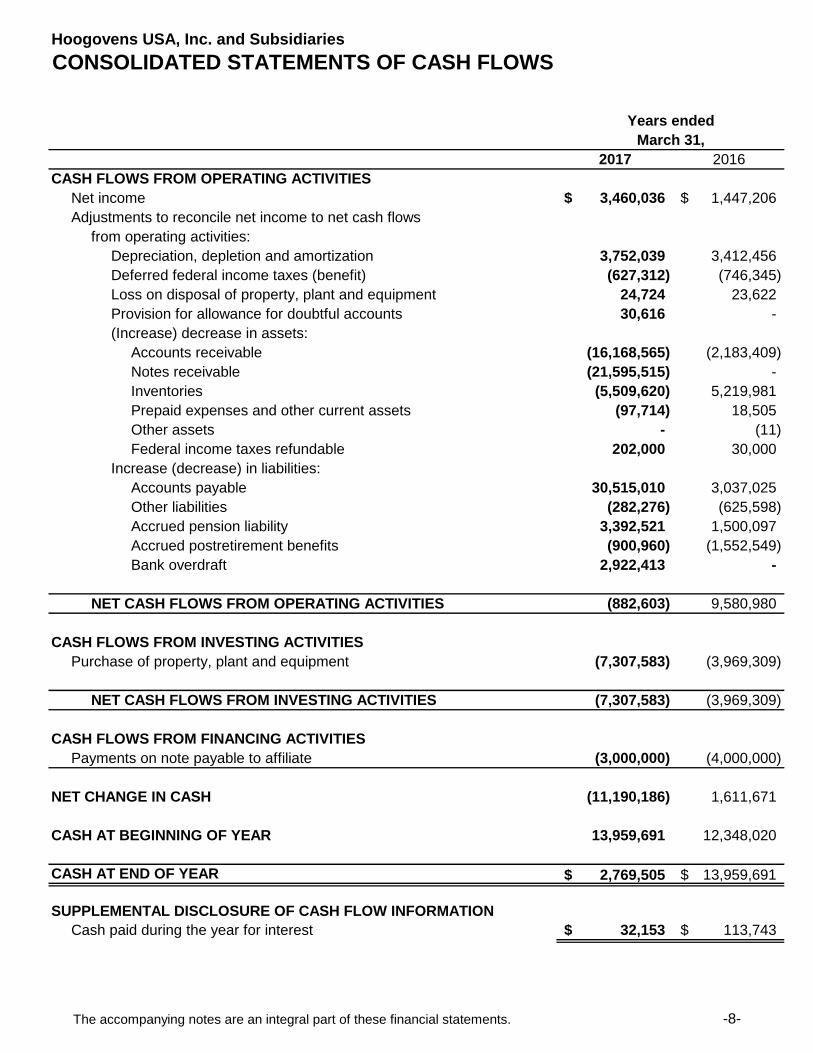
Hoogovens USA, Inc. and Subsidiaries
CONSOLIDATED STATEMENTS OF CASH FLOWS
2017 2016
CASH FLOWS FROM OPERATING ACTIVITIES
Net income 3,460,036$ 1,447,206$
Adjustments to reconcile net income to net cash flows
from operating activities:
Depreciation, depletion and amortization 3,752,039 3,412,456
Deferred federal income taxes (benefit) (627,312) (746,345)
Loss on disposal of property, plant and equipment 24,724 23,622
Provision for allowance for doubtful accounts 30,616 -
(Increase) decrease in assets:
Accounts receivable (16,168,565) (2,183,409)
Notes receivable (21,595,515) -
Inventories (5,509,620) 5,219,981
Prepaid expenses and other current assets (97,714) 18,505
Other assets - (11)
Federal income taxes refundable 202,000 30,000
Increase (decrease) in liabilities:
Accounts payable 30,515,010 3,037,025
Other liabilities (282,276) (625,598)
Accrued pension liability 3,392,521 1,500,097
Accrued postretirement benefits (900,960) (1,552,549)
Bank overdraft 2,922,413 -
NET CASH FLOWS FROM OPERATING ACTIVITIES (882,603) 9,580,980
CASH FLOWS FROM INVESTING ACTIVITIES
Purchase of property, plant and equipment (7,307,583) (3,969,309)
NET CASH FLOWS FROM INVESTING ACTIVITIES (7,307,583) (3,969,309)
CASH FLOWS FROM FINANCING ACTIVITIES
Payments on note payable to affiliate (3,000,000) (4,000,000)
NET CHANGE IN CASH (11,190,186) 1,611,671
CASH AT BEGINNING OF YEAR 13,959,691 12,348,020
CASH AT END OF YEAR 2,769,505$ 13,959,691$
SUPPLEMENTAL DISCLOSURE OF CASH FLOW INFORMATION
Cash paid during the year for interest 32,153$ 113,743$
March 31,
Years ended
The accompanying notes are an integral part of these financial statements. -8-

Hoogovens USA, Inc. and Subsidiaries
NOTES TO CONSOLIDATED FINANCIAL STATEMENTS March 31, 2017 and 2016
-9-
NOTE A – NATURE OF OPERATIONS Hoogovens USA, Inc. (“HUSA”) is a wholly-owned subsidiary of Tata Steel Limited (“Tata”). HUSA is a holding company for Thomas Steel Strip Corporation (“TSS”) which is a manufacturer of cold rolled and preplated steel products, Thomas Processing Company (“TPC”), Hille & Mueller USA, Inc. (“HMU”) which is a sales organization, and Apollo Metals, Ltd. (“AML”) which is a steel processor. All subsidiaries are wholly-owned by HUSA. HUSA was formed in 1997 through the contribution of capital stock in TSS and HMU by a predecessor to Tata. The investment values at HUSA were recorded at the historical acquisition cost recorded by the predecessor to Tata. Therefore, recorded investment values may be different from the equity values of the respective subsidiaries because certain historical purchase price allocation adjustments have not been pushed down to the respective subsidiary financial statements. TPC is a general partnership, organized in the state of Ohio, for the purpose of pickling and slitting hot rolled steel primarily for TSS. The partners of TPC are TSS and HMU. TSS and HMU are equal voting partners and share in the net income of TPC on the basis of 35.7% and 64.3%, respectively. TSS and HMU account for their investment in TPC using the equity method. AML was acquired in 1999. The acquisition was funded by a capital contribution of $5,900,000 by a predecessor to Tata and a loan of $3,000,000 from Hoogovens Aluminum Europe, Inc. (“HAE”). The loan was subsequently assumed by AML.
NOTE B – SUMMARY OF SIGNIFICANT ACCOUNTING POLICIES Basis of Consolidation The financial statements of Hoogovens USA, Inc. and Subsidiaries (the “Companies”) have been consolidated due to the common ownership discussed above. Intercompany balances and transactions were eliminated in consolidating the financial statements of the Companies. For cash management reasons and to control receipts and disbursements, the Companies maintain, along with other related but legally separate entities, a cash pool at a financial institution. The cash account is administered by Tata Steel International (Americas) Holdings, Inc., a related party. None of the funds are restricted in any way, and the funds on deposit can be freely transferred for use in the general business of the Companies. Adoption of New Accounting Pronouncement In July 2015, the FASB issued ASU 2015-11, “Inventory (Topic 330): Simplifying the Measurement of Inventory” (“ASU 2015-11”). ASU 2015-11 simplifies the measurement of inventory by requiring inventory to be measured at the lower of cost or net realizable value. The FASB defines net realizable value as the estimated selling price in the ordinary course of business, less reasonably predictable costs of completion, disposal, and transportation. Under previous guidance, an entity subsequently measures inventory at the lower of cost or market, with market defined as the replacement cost, net realizable value or net realizable value less a normal profit margin. An entity used current replacement cost provided that it was not above net realizable value (i.e. the ceiling) or below net realizable value less an approximately normal profit margin (i.e. the floor). ASU 2015-11 eliminates this analysis for entities within the scope of the guidance. ASU 2015-11 applies to entities that recognize inventory within the scope of ASU 330, except for inventory measured under the LIFO method or the retail inventory method. The Company has early adopted the amendments in ASU 2015-11, effective April 1, 2016. The adoption did not have a material impact on the financial statements.
Hoogovens USA, Inc. and Subsidiaries
NOTES TO CONSOLIDATED FINANCIAL STATEMENTS March 31, 2017 and 2016
-10-
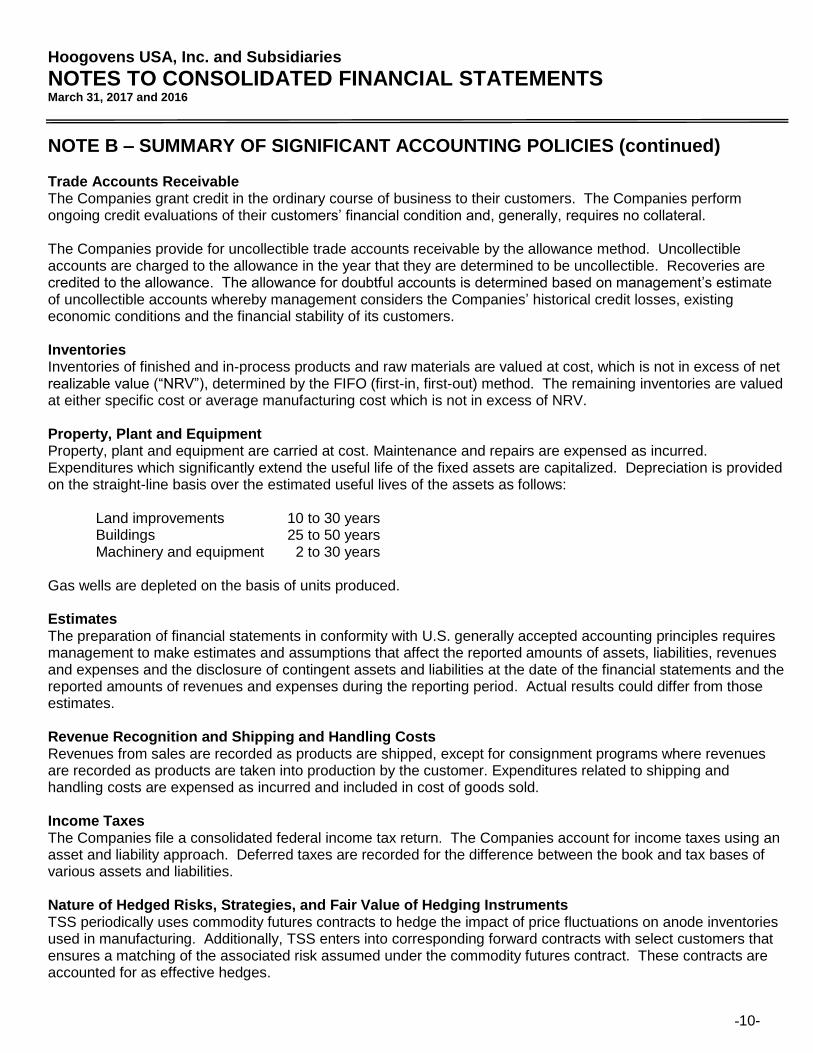
NOTE B – SUMMARY OF SIGNIFICANT ACCOUNTING POLICIES (continued) Trade Accounts Receivable The Companies grant credit in the ordinary course of business to their customers. The Companies perform ongoing credit evaluations of their customers’ financial condition and, generally, requires no collateral. The Companies provide for uncollectible trade accounts receivable by the allowance method. Uncollectible accounts are charged to the allowance in the year that they are determined to be uncollectible. Recoveries are credited to the allowance. The allowance for doubtful accounts is determined based on management’s estimate of uncollectible accounts whereby management considers the Companies’ historical credit losses, existing economic conditions and the financial stability of its customers. Inventories Inventories of finished and in-process products and raw materials are valued at cost, which is not in excess of net realizable value (“NRV”), determined by the FIFO (first-in, first-out) method. The remaining inventories are valued at either specific cost or average manufacturing cost which is not in excess of NRV. Property, Plant and Equipment Property, plant and equipment are carried at cost. Maintenance and repairs are expensed as incurred. Expenditures which significantly extend the useful life of the fixed assets are capitalized. Depreciation is provided on the straight-line basis over the estimated useful lives of the assets as follows: Land improvements 10 to 30 years Buildings 25 to 50 years Machinery and equipment 2 to 30 years Gas wells are depleted on the basis of units produced. Estimates The preparation of financial statements in conformity with U.S. generally accepted accounting principles requires management to make estimates and assumptions that affect the reported amounts of assets, liabilities, revenues and expenses and the disclosure of contingent assets and liabilities at the date of the financial statements and the reported amounts of revenues and expenses during the reporting period. Actual results could differ from those estimates. Revenue Recognition and Shipping and Handling Costs Revenues from sales are recorded as products are shipped, except for consignment programs where revenues are recorded as products are taken into production by the customer. Expenditures related to shipping and handling costs are expensed as incurred and included in cost of goods sold. Income Taxes The Companies file a consolidated federal income tax return. The Companies account for income taxes using an asset and liability approach. Deferred taxes are recorded for the difference between the book and tax bases of various assets and liabilities. Nature of Hedged Risks, Strategies, and Fair Value of Hedging Instruments TSS periodically uses commodity futures contracts to hedge the impact of price fluctuations on anode inventories used in manufacturing. Additionally, TSS enters into corresponding forward contracts with select customers that ensures a matching of the associated risk assumed under the commodity futures contract. These contracts are accounted for as effective hedges.
Hoogovens USA, Inc. and Subsidiaries
NOTES TO CONSOLIDATED FINANCIAL STATEMENTS March 31, 2017 and 2016
-11-
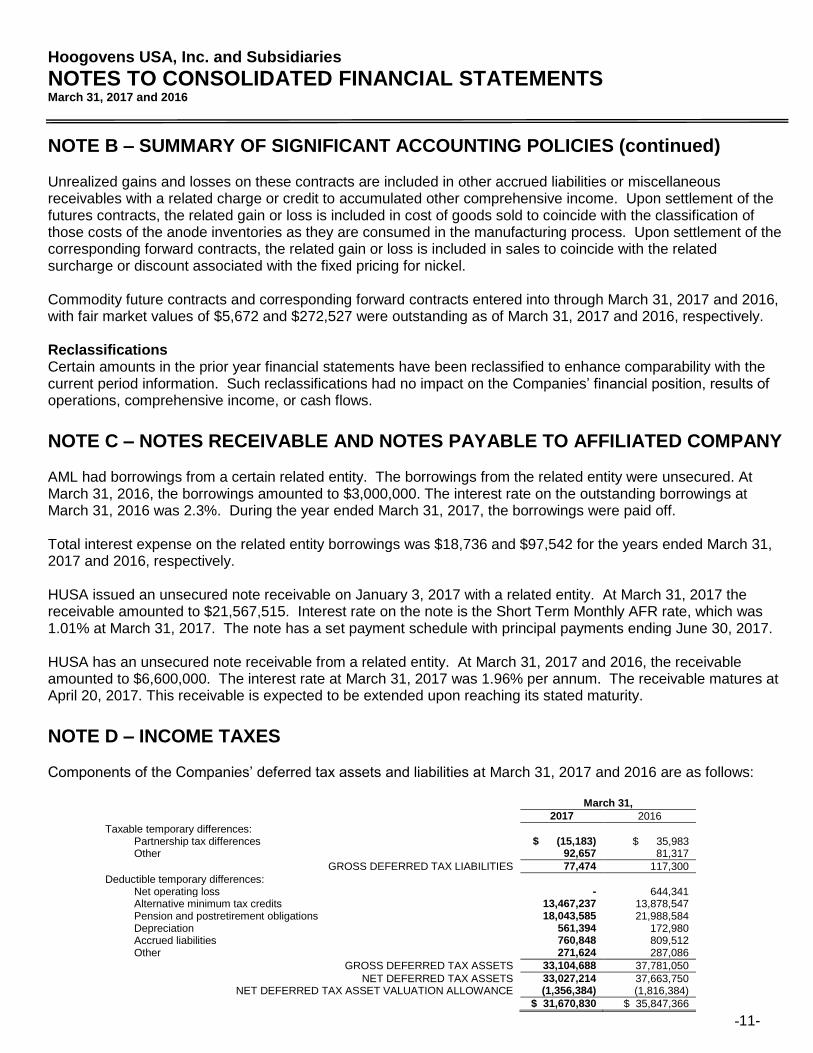
NOTE B – SUMMARY OF SIGNIFICANT ACCOUNTING POLICIES (continued) Unrealized gains and losses on these contracts are included in other accrued liabilities or miscellaneous receivables with a related charge or credit to accumulated other comprehensive income. Upon settlement of the futures contracts, the related gain or loss is included in cost of goods sold to coincide with the classification of those costs of the anode inventories as they are consumed in the manufacturing process. Upon settlement of the corresponding forward contracts, the related gain or loss is included in sales to coincide with the related surcharge or discount associated with the fixed pricing for nickel. Commodity future contracts and corresponding forward contracts entered into through March 31, 2017 and 2016, with fair market values of $5,672 and $272,527 were outstanding as of March 31, 2017 and 2016, respectively. Reclassifications Certain amounts in the prior year financial statements have been reclassified to enhance comparability with the current period information. Such reclassifications had no impact on the Companies’ financial position, results of operations, comprehensive income, or cash flows.
NOTE C – NOTES RECEIVABLE AND NOTES PAYABLE TO AFFILIATED COMPANY AML had borrowings from a certain related entity. The borrowings from the related entity were unsecured. At March 31, 2016, the borrowings amounted to $3,000,000. The interest rate on the outstanding borrowings at March 31, 2016 was 2.3%. During the year ended March 31, 2017, the borrowings were paid off. Total interest expense on the related entity borrowings was $18,736 and $97,542 for the years ended March 31, 2017 and 2016, respectively. HUSA issued an unsecured note receivable on January 3, 2017 with a related entity. At March 31, 2017 the receivable amounted to $21,567,515. Interest rate on the note is the Short Term Monthly AFR rate, which was 1.01% at March 31, 2017. The note has a set payment schedule with principal payments ending June 30, 2017. HUSA has an unsecured note receivable from a related entity. At March 31, 2017 and 2016, the receivable amounted to $6,600,000. The interest rate at March 31, 2017 was 1.96% per annum. The receivable matures at April 20, 2017. This receivable is expected to be extended upon reaching its stated maturity.
NOTE D – INCOME TAXES Components of the Companies’ deferred tax assets and liabilities at March 31, 2017 and 2016 are as follows:
March 31,
2017 2016
Taxable temporary differences: Partnership tax differences $ (15,183) $ 35,983 Other 92,657 81,317
GROSS DEFERRED TAX LIABILITIES 77,474 117,300
Deductible temporary differences: Net operating loss - 644,341 Alternative minimum tax credits 13,467,237 13,878,547 Pension and postretirement obligations 18,043,585 21,988,584 Depreciation 561,394 172,980 Accrued liabilities 760,848 809,512 Other 271,624 287,086
GROSS DEFERRED TAX ASSETS 33,104,688 37,781,050
NET DEFERRED TAX ASSETS 33,027,214 37,663,750 NET DEFERRED TAX ASSET VALUATION ALLOWANCE (1,356,384) (1,816,384)
$ 31,670,830 $ 35,847,366

Hoogovens USA, Inc. and Subsidiaries
NOTES TO CONSOLIDATED FINANCIAL STATEMENTS March 31, 2017 and 2016
-12-
NOTE D – INCOME TAXES (continued) Deferred income taxes reflect the net tax effects of temporary differences between the carrying amounts of assets and liabilities for financial reporting purposes and the amounts used for income tax purposes computed on a stand-alone basis. In evaluating the reasonableness of the valuation allowance, management assesses whether it is more likely than not that some portion, or all, of the deferred tax assets will not be realized. Ultimately, the realization of deferred tax assets is dependent upon generation of future taxable income during those periods in which temporary differences become deductible and/or credits can be utilized. To this end, management considers the level of historical taxable income, the scheduled reversal of deferred tax liabilities, tax-planning strategies and projected future taxable income. Based on these considerations, and the indefinite carry-forward availability of certain deferred tax credits (principally related to alternative minimum tax), management believes it is more likely than not that the Companies will realize $31,670,830 of the deferred tax asset, thereby reducing the allowance by $460,000 for the year ended March 31, 2017, resulting in a total valuation allowance of $1,356,384 as of March 31, 2017. The net deferred tax assets include amounts related to the pension liability adjustment, which is accounted for as a separate component of stockholder’s equity. The differences between the provision for income taxes at the U.S. statutory rate (34%) and the tax shown in the statement of operations are due to the effect of state taxes and nondeductible expenses and the valuation allowance.
NOTE E – PENSIONS AND POSTRETIREMENT PLANS TSS sponsors pension (hourly) and retirement income (salary) defined benefit pension plans. The retirement income plan was frozen by TSS as of December 31, 2007. Pension benefits are based on years of service, career average compensation and compensation during certain years immediately preceding retirement. TSS’s employees may become eligible for those benefits if they reach the normal retirement while working for TSS. TSS’s postretirement health care and life insurance plan is not funded. AML sponsors defined benefit pension plans for hourly and salary employees. Pension benefits are based on years of service and average career compensation. AML’s employees may become eligible for reduced benefits upon attaining age 55 and completing 15 years of service with AML. Normal retirement benefits are attained upon reaching age 65 and completing five years of service.

Hoogovens USA, Inc. and Subsidiaries
NOTES TO CONSOLIDATED FINANCIAL STATEMENTS March 31, 2017 and 2016
-13-
NOTE E – PENSIONS AND POSTRETIREMENT PLANS (continued) The following information pertains to these plans for the years ended March 31:
Apollo Metals, Ltd.
Pensions Thomas Steel Strip
Corporation Pensions Thomas Steel Strip
Corporation Postretirement
2017 2016 2017 2016 2017 2016 Weighted-average assumptions used to determine:
Net periodic benefit cost
Discount rate 4.10% 3.85% 4.25% 4.25% 4.10% 4.10%
Expected return on plan assets 6.50% 6.50% 6.50% 6.50% - - Rate of compensation increase (n/a for TSS retirement income plan) - - 2.00% 2.00% - -
Benefit obligations Discount rate 4.10% 4.10% 4.10% 4.10% 4.10% 4.10%
As of March 31, the following amounts were recognized in the balance sheet and in accumulated other comprehensive (loss): Pensions Postretirement Benefits
2017 2016 2017 2016
Amounts recognized in the Balance Sheet: Current liabilities $ (2,673,120) $ (4,742,912) $ (805,714) $ (779,300) Other liabilities (43,012,088) (52,661,470) (6,668,925) (6,613,567)
Total $ (45,685,208) $ (57,404,382) $ (7,474,639) $ (7,392,867)
Amounts recognized in Accumulated Other Comprehensive (Loss):
Prior service (cost) credit $ - $ (625) $ 247,641 $ 541,997 Net actuarial (loss) (52,188,917) (67,299,986) (8,433,775) (7,745,399)
Total $ (52,188,917) $ (67,300,611) $ (8,186,134) $ (7,203,402)
Pensions Postretirement Benefits
2017 2016 2017 2016
Change in accumulated benefit obligation: Beginning of year $ 145,358,164 $ 152,620,158 $ 7,392,867 $ 8,207,202 Service cost 1,201,136 1,327,101 105,121 117,607 Interest cost 5,713,871 5,904,933 288,590 300,910 Benefits paid (8,694,404) (6,407,554) (1,841,540) (1,738,582) Actuarial loss (gain) (3,963,303) (8,086,474) 1,529,601 505,730
ACCUMULATED BENEFIT OBLIGATION AT END OF YEAR
$ 139,615,464 $ 145,358,164 $ 7,474,639 $ 7,392,867
Change in plan assets: Fair value of plan assets at
beginning of year
$ 87,953,780 $ 94,500,518 $ - $ - Actual return on plan assets 10,720,106 (4,210,166) - - Employer contribution 3,950,772 5,749,902 1,841,540 1,738,582 Benefits (8,694,404) (8,086,474) (1,841,540) (1,738,582)
FAIR VALUE OF PLAN ASSETS AT END OF YEAR
$ 93,930,254 $ 87,953,780 $ - $ -
Funded status $ (45,685,208) $ (57,404,382) $ (7,474,639) $ (7,392,867) Unrecognized actuarial loss 52,188,917 67,299,986 8,433,775 7,745,399 Unrecognized prior service cost (credit) - 625 (247,641) (541,997)
NET AMOUNT RECOGNIZED $ 6,503,709 $ 9,896,229 $ 711,495 $ (189,465)

Hoogovens USA, Inc. and Subsidiaries
NOTES TO CONSOLIDATED FINANCIAL STATEMENTS March 31, 2017 and 2016
-14-
NOTE E – PENSIONS AND POSTRETIREMENT PLANS (continued) The following amounts were recognized in accumulated other comprehensive loss, net of tax, for the years ended March 31: Pensions Postretirement Benefits
2017 2016 2017 2016
Net actuarial gain (loss) $ (15,111,069) $ (2,213,646) $ (688,376) $ 239,445
Prior service (cost) credit 625 1,708 (294,356) (977,659)
Net Amount Recognized in Other Comprehensive Income (Loss)
$ (15,110,444) $ (2,211,938) $ (982,732) $ (738,214)
The assumed health care trend rates at March 31 for the postretirement plans were:
2017 2016
Health care trend rate assumed for next year 5.00% 5.50%
Rate that the cost trend rate gradually declines to 5.00% 5.00% Year that the rate reaches the rate it is assumed to remain at 2018 2018
The expected long-term return on plan assets assumption is based on a periodic review and modeling of the plans’ asset allocation and liability structure over a long-term period. Expectations of returns for each asset class are the most important of the assumptions used in the review and modeling and are based on comprehensive reviews of historical data and economic/financial market theory. The expected long-term rate of return on assets was selected from within the reasonable range of rates determined by historical real returns, net of inflation, for the asset classes covered by the investment policy and projections of inflation over the long-term period during which benefits are payable to plan participants. No future increases in pensionable earnings are assumed for participants of TSS’s salary pension plan. The annual rate of increase in future compensation is assumed to be 2% for participants in TSS’s hourly pension plan. Pensions Postretirement Benefits
2017 2016 2017 2016
Components of net periodic benefit cost:
Service cost $ 1,201,136 $ 1,327,101 $ 105,121 $ 117,607 Interest cost 5,713,871 5,904,933 288,590 300,910 Expected return on plan assets (5,673,590) (6,184,563) - - Recognized prior service cost 625 1,708 - - Amortization of unrecognized net loss - - 841,225 745,175 Amortization of prior period cost - - (294,356) (977,659) Recognized actuarial loss 6,101,251 6,200,820 - -
NET PERIODIC BENEFIT
COST (INCOME) $ 7,343,293 $ 7,249,999 $ 940,580 $ 186,033
The weighted average asset allocation by asset category for pension plans were as follows:
Thomas Steel Strip Corporation
Pension Plan
Retirement Income Plan
2017 2016 2017 2016
Equity securities 56.00% 55.00% 56.00% 55.00% Debt securities 23.00% 22.00% 23.00% 22.00% Real estate 5.00% 6.00% 5.00% 6.00% Other 16.00% 17.00% 16.00% 17.00%
Total 100.00%
100.00%
100.00% 100.00%

Hoogovens USA, Inc. and Subsidiaries
NOTES TO CONSOLIDATED FINANCIAL STATEMENTS March 31, 2017 and 2016
-15-
NOTE E – PENSIONS AND POSTRETIREMENT PLANS (continued)
Apollo Metals, Ltd.
Salaried Employees’ Pension Plan
Hourly Employees’ Pension Plan
2017 2016 2017 2016
Equity securities 61.00% 59.00% 61.00% 59.00% Debt securities 39.00% 41.00% 39.00% 41.00%
Total 100.00% 100.00%
100.00% 100.00%
The following estimated future benefit payments, which reflect expected future service, as appropriate, are expected to be paid in the years indicated:
Year ending March 31:
Amount
2017 $ 8,804,847 2018 8,851,940 2019 8,932,175 2020 9,100,855 2021 9,130,790
2021-2026 45,633,679
Financial accounting standards establish a framework for measuring fair value. That framework provides a fair value hierarchy that prioritizes the inputs to valuation techniques used to measure fair value. The hierarchy gives the highest priority to unadjusted quoted prices in active markets for identical assets or liabilities (level 1 measurements) and the lowest priority to unobservable inputs (level 3 measurements). The three levels of the fair value hierarchy are described as follows:
Level 1 fair values are based on unadjusted quoted prices in active markets for identical assets or liabilities. Level 2 fair values are based on inputs other than quoted prices within Level 1 that are observable for the asset, either directly or indirectly. Level 3 fair values are based on at least one significant unobservable input for the asset. Following is a description of the valuation methodologies used for assets measured at fair value. There have been no changes in the methodologies used at March 31, 2017 and 2016. Common stock: Valued at the closing price reported on the active market on which the individual securities are traded. Money market accounts: Valued at the net asset value (NAV) of shares held by the Plan at year end. Common/collective funds: Units held in collective investment funds are valued using the NAV of the fund. The NAV is based on the fair value of the underlying assets owned by the fund, minus its liabilities, and then divided by the number of units outstanding. The NAV of a collective investment fund is calculated based on a compilation of primarily observable market information. The number of units of the fund that are outstanding on the calculation date is derived from observable purchase and redemption activity in the fund. Accordingly, the unit value for a collective investment fund is classified within level 2 of the valuation hierarchy.
Hoogovens USA, Inc. and Subsidiaries
NOTES TO CONSOLIDATED FINANCIAL STATEMENTS March 31, 2017 and 2016
-16-
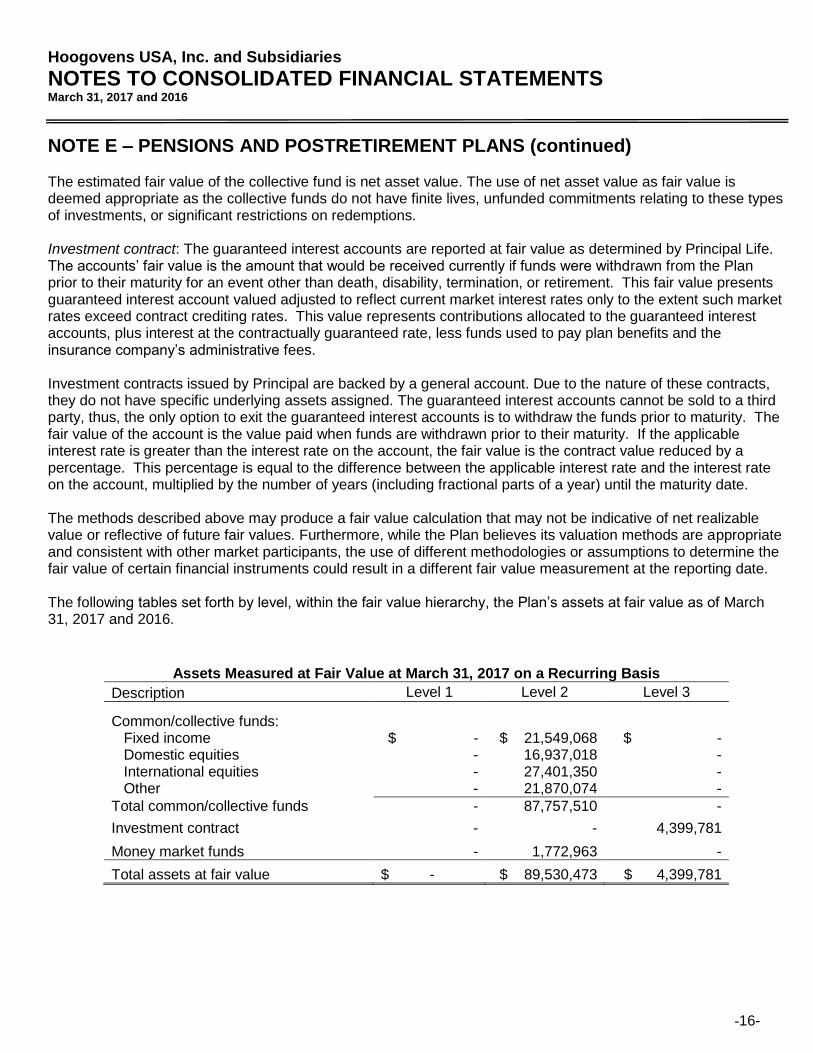
NOTE E – PENSIONS AND POSTRETIREMENT PLANS (continued) The estimated fair value of the collective fund is net asset value. The use of net asset value as fair value is deemed appropriate as the collective funds do not have finite lives, unfunded commitments relating to these types of investments, or significant restrictions on redemptions. Investment contract: The guaranteed interest accounts are reported at fair value as determined by Principal Life. The accounts’ fair value is the amount that would be received currently if funds were withdrawn from the Plan prior to their maturity for an event other than death, disability, termination, or retirement. This fair value presents guaranteed interest account valued adjusted to reflect current market interest rates only to the extent such market rates exceed contract crediting rates. This value represents contributions allocated to the guaranteed interest accounts, plus interest at the contractually guaranteed rate, less funds used to pay plan benefits and the insurance company’s administrative fees. Investment contracts issued by Principal are backed by a general account. Due to the nature of these contracts, they do not have specific underlying assets assigned. The guaranteed interest accounts cannot be sold to a third party, thus, the only option to exit the guaranteed interest accounts is to withdraw the funds prior to maturity. The fair value of the account is the value paid when funds are withdrawn prior to their maturity. If the applicable interest rate is greater than the interest rate on the account, the fair value is the contract value reduced by a percentage. This percentage is equal to the difference between the applicable interest rate and the interest rate on the account, multiplied by the number of years (including fractional parts of a year) until the maturity date. The methods described above may produce a fair value calculation that may not be indicative of net realizable value or reflective of future fair values. Furthermore, while the Plan believes its valuation methods are appropriate and consistent with other market participants, the use of different methodologies or assumptions to determine the fair value of certain financial instruments could result in a different fair value measurement at the reporting date. The following tables set forth by level, within the fair value hierarchy, the Plan’s assets at fair value as of March 31, 2017 and 2016.
Assets Measured at Fair Value at March 31, 2017 on a Recurring Basis
Description Level 1 Level 2 Level 3
Common/collective funds: Fixed income $ - $ 21,549,068 $ - Domestic equities - 16,937,018 - International equities - 27,401,350 - Other - 21,870,074 -
Total common/collective funds - 87,757,510 -
Investment contract - - 4,399,781
Money market funds - 1,772,963 -
Total assets at fair value $ - $ 89,530,473 $ 4,399,781
Hoogovens USA, Inc. and Subsidiaries
NOTES TO CONSOLIDATED FINANCIAL STATEMENTS March 31, 2017 and 2016
-17-
NOTE E – PENSIONS AND POSTRETIREMENT PLANS (continued)
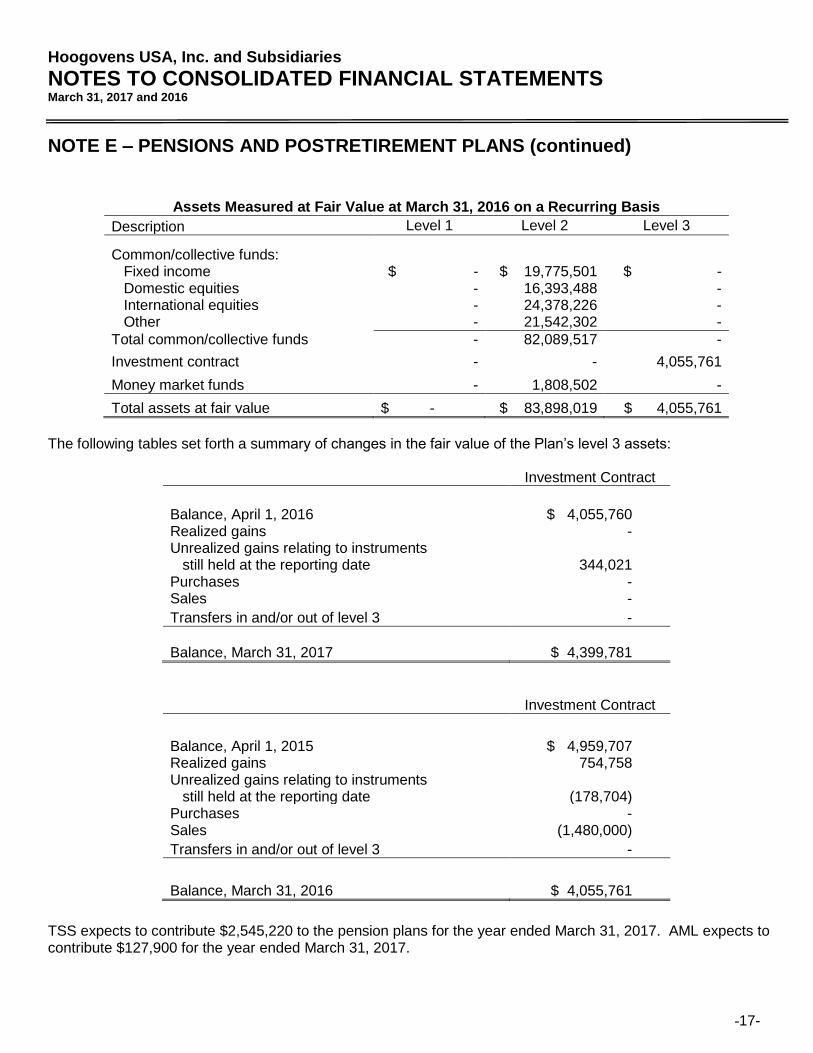
Assets Measured at Fair Value at March 31, 2016 on a Recurring Basis
Description Level 1 Level 2 Level 3
Common/collective funds: Fixed income $ - $ 19,775,501 $ - Domestic equities - 16,393,488 - International equities - 24,378,226 - Other - 21,542,302 -
Total common/collective funds - 82,089,517 -
Investment contract - - 4,055,761
Money market funds - 1,808,502 -
Total assets at fair value $ - $ 83,898,019 $ 4,055,761
The following tables set forth a summary of changes in the fair value of the Plan’s level 3 assets:
Investment Contract
Balance, April 1, 2016 $ 4,055,760 Realized gains - Unrealized gains relating to instruments still held at the reporting date 344,021 Purchases - Sales -
Transfers in and/or out of level 3 -
Balance, March 31, 2017 $ 4,399,781
Investment Contract
Balance, April 1, 2015 $ 4,959,707 Realized gains 754,758 Unrealized gains relating to instruments still held at the reporting date (178,704) Purchases - Sales (1,480,000)
Transfers in and/or out of level 3 -
Balance, March 31, 2016 $ 4,055,761
TSS expects to contribute $2,545,220 to the pension plans for the year ended March 31, 2017. AML expects to contribute $127,900 for the year ended March 31, 2017.

Hoogovens USA, Inc. and Subsidiaries
NOTES TO CONSOLIDATED FINANCIAL STATEMENTS March 31, 2017 and 2016
-18-
NOTE E – PENSIONS AND POSTRETIREMENT PLANS (continued) TSS and AML also have 401(k) defined contribution plans. Both hourly and salaried employees are eligible to participate. Total expense for these plans was $423,567 and $421,882 for the years ended March 31, 2017 and 2016, respectively. Multiemployer Pension Plans TSS and AML contribute to a multiemployer defined benefit pension plan under the terms of collective-bargaining agreements that cover certain unionized employee groups in the United States. Total pension expense charged to continuing operations for union-sponsored plans for the years ended March 31, 2017 and 2016 was $214,079 and $174,405, respectively. The risks of participating in multiemployer pension plans are different from single-employer plans. Assets contributed to a multiemployer plan by one employer may be used to provide benefits to employees of other participating employers. If a participating employer stops contributing to the plan, the unfunded obligations of the plan may be borne by the remaining participating employers. TSS’s and AML’s participation in multiemployer pension plans for the year ended March 31, 2017, is outlined in the table below. The “EIN/PN” column provides the Employee Identification Number (EIN) and the three-digit plan number (PN). The most recent Pension Protection Act (PPA) zone status available for the years ended March 31, 2017 and 2016 is for the plan year-ends as indicated below. The zone status is based on information that TSS and AML received from the plan and is certified by the plan’s actuary. Among other factors, plans in the red zone are generally less than 65 percent funded, plans in the yellow zone are between 65 percent and 80 percent funded, and plans in the green zone are at least 80 percent funded. The “FIP/RP Status Pending/Implemented” column indicates plans for which a financial improvement plan (FIP) or a rehabilitation plan (RP) is either pending or has been implemented. In addition to regular plan contributions, TSS and AML may be subject to a surcharge if the plan is in the red zone. The “Surcharge Imposed” column indicates whether a surcharge has been imposed on contributions to the plan. The last column lists the expiration dates of the collective-bargaining agreements (CBA) to which the plans are subject.
PPA Zone Status for year ended March 31,
Contributions by TSS and AML for year ended March 31,
Pension Trust Fund EIN/PN 2017 2016
FIP/RP Status
Pending/ Implemented 2017 2016 2015
Surcharge Imposed
Expiration Date of
CBA
Steelworkers Pension Trust
23-6648508 / 499
Green -12/31/2016
Green -12/31/2015
No $214,079 $174,405 $142,941 No
3/30/2017 (TSS)
5/5/2018 (AML)
Neither TSS nor AML provided more than 5 percent of total contributions to the plan for the plan years ended December 31, 2016 and 2015. In addition to regular contributions, TSS and AML could be obligated to pay additional amounts, known as a withdrawal liability, if a multiemployer pension plan has unfunded vested benefits and TSS and AML decreases or ceases participation in that plan. TSS and AML have not recognized a withdrawal liability or withdrawal liability expense related to curtailment and special termination benefits associated with withdrawal from the multiemployer plan.

Hoogovens USA, Inc. and Subsidiaries
NOTES TO CONSOLIDATED FINANCIAL STATEMENTS March 31, 2017 and 2016
-19-
NOTE F – RELATED PARTY TRANSACTIONS The Companies, through their owners, are affiliated with various entities of HUSA and the Tata Group. Total steel sales to various affiliated companies were $2,634,456 and $2,907,041 for the years ended March 31, 2017 and 2016, respectively. Total steel purchases from various affiliated companies were $29,049,535 and $32,168,756 for the years ended March 31, 2017 and 2016, respectively. Receivables from these companies totaled $2,225,242 and $509,721 at March 31, 2017 and 2016, respectively. Accounts payable to these companies totaled $4,780,370 and $1,520,357 at March 31, 2017 and 2016, respectively. Management fees charged to TSS and AML from Tata Steel Plating and Tata Steel UK Limited totaled $1,913,536 and $2,063,674 for the years ended March 31, 2017 and 2016, respectively.
NOTE G – COMMITMENTS AND CONTINGENCIES TSS is involved in several pending legal proceedings related to workers’ compensation claims. While the ultimate outcome of these lawsuits is not presently determinable, it is the opinion of management that the ultimate resolution will not have a material adverse effect on the Companies’ consolidated financial position or results of operations. In accordance with the interim status standards under the Resource Conservation and Recovery Act (RCRA), in 1998 the United States Environmental Protection Agency (USEPA) and the Ohio Environmental Protection Agency (OEPA) approved TSS’s closure plan for one USEPA Hazardous Waste No, F006 surface impoundment and three lime stabilized waste pickle liquor (LSWPL) lagoons located onsite. However, these units were never closed in accordance with the approved closure plan. In 2003, TSS submitted a modified closure plan for OEPA’s review and approval. Based upon decisions and agreements reached between OEPA and TSS, TSS prepared and submitted amended closure/post-closure plans for the F006 impoundment and LSWPL lagoons to OEPA in January, 2005. In the plans, TSS committed to complete closure activities and to commence post-closure care activities within 180 days of approval of the plans by OEPA. The closure portions of these plans were implemented during the summer of 2005. TSS forwarded final closure certification reports to the OEPA in October, 2005. In December, 2005 OEPA approved the reports and granted final certification of closure of the F006 impoundment and the LSWPL lagoons. In March 2008, TSS obtained approval to reduce its groundwater monitoring frequency from semi-annually to annually during the continued implementation of its RCRA post-closure plans. On March 6, 2008, TSS submitted modified post-closure plans to reflect OEPA’s approval of the reduced monitoring frequency. By letter dated May 22, 2008, OEPA approved TSS’ modified plans. TSS is currently fulfilling its post-closure care obligations for the F006 impoundment and the LSWPL lagoons. By letter dated August 30, 2006 from OEPA, TSS was notified of its responsibilities under the regulations at Ohio Administrative Code Section 3745-54-101 for investigating and addressing, as necessary, any hazardous waste or hazardous constituent release at or from TSS, regardless of when such releases occurred. An OEPA site inspection was conducted on January 24, 2007. By letter dated February 6, 2007, OEPA requested TSS to create a Statement of Current Conditions by identifying and evaluating solid waste management units (SWMU) and areas of concern (AOC) at the facility. TSS submitted the Statement of Current Conditions to OEPA on April 11, 2007 which identified twenty-four SWMU’s as well as two additional AOC’s. OEPA concurred with TSS’s assessment by letter dated May 7, 2007. TSS has since submitted and implemented an OEPA approved RCRA Facility Investigation (RFI) Work Plan which began in November, 2007. The RFI report recommended no further action for all SWMU’s and AOC’s pending ultimate decommissioning of the facility operations at some future time, provided one of the investigated SWMU (the on-site, capped nonhazardous waste landfill) is included in a deed
Hoogovens USA, Inc. and Subsidiaries
NOTES TO CONSOLIDATED FINANCIAL STATEMENTS March 31, 2017 and 2016
-20-
NOTE G – COMMITMENTS AND CONTINGENCIES (continued) notice restricting disturbance of the landfill’s clay cap. The OEPA concurred with the RFI Report recommendations by letter dated April 8, 2008. By letter dated June 5, 2008 from OEPA, TSS was notified of OEPA's intent to issue a Statement of Basis for Remedial Decisions. By letter dated September 23, 2008 from OEPA, TSS was notified of OEPA's issuance of a Final Declaration and Statement of Basis for Remedial Decision (the "Final Decision"). In accordance with the terms and conditions of the Final Decision, TSS submitted an Operations and Maintenance Plan for Waste Management Unit No.5 ("WMU 5") - the on-site, capped nonhazardous waste landfill - which is the only corrective action unit at TSS that has not attained "No Further Action" status. In response to OEPA comments, TSS submitted a Revised Operations and Maintenance Plan for WMU 5 on December 11, 2008. By letter dated February 18, 2009 from OEPA, TSS was notified of OEPA's approval of the Revised Operations and Maintenance Plan for WMU 5. TSS received and approved final Environmental Covenant language for WMU 5 with OEPA on October 28, 2015. TSS has received and approved a Consensual Findings and Orders ("CF&O") document from OEPA on October 8, 2015. TSS will submit a work plan within 90 days of cessation of operation of a waste management unit on the facilities. Management is unable to estimate the cost of the RFI Work Plan as of March 31, 2017.
NOTE H – PROFIT SHARING PROGRAM Pursuant to its collective bargaining agreement with the United Steel Workers of America, TSS is required to pay a profit sharing bonus equal to a specified percentage of its pretax profit before profit sharing expense to eligible hourly employees. Under this agreement, there was no profit sharing expense for the year ended March 31, 2017 and 2016. Pursuant to its collective bargaining agreement with the United Steel Workers of America, AML is required to pay a profit sharing bonus equal to a specified percentage of its pretax profit before profit sharing expense to eligible hourly employees. Under this agreement, profit sharing expense was $146,477 and $105,674 for the years ended March 31, 2017 and 2016, respectively.
NOTE I – CONCENTRATION OF RISK
The Companies maintain their cash in a financial institution which, at times, may exceed federally insured limits of $250,000. The Companies have not experienced any losses from such accounts, and management believes the Companies are not exposed to significant credit risk related to bank deposit accounts. Major Customers TSS has a concentration of sales and receivables in the battery industry. Three companies accounted for approximately 56% and 62% of TSS’s sales for the years ended March 31, 2017 and 2016, respectively. Receivables from these customers were $3,243,960 and $2,652,932 at March 31, 2017 and 2016, respectively. AML’s three largest customers accounted for approximately 67% and 65% of AML’s sales for the year ended March 31, 2017 and 2016, respectively. Receivables from these customers were $1,526,606 and $1,252,482 at March 31, 2017 and 2016, respectively. Collective Bargaining Arrangements Approximately 76% and 75% of TSS’s workforce was subject to collective bargaining agreements as of March 31, 2017 and 2016, respectively. These agreements expire in March of 2017 and have been extended pending

Hoogovens USA, Inc. and Subsidiaries
NOTES TO CONSOLIDATED FINANCIAL STATEMENTS March 31, 2017 and 2016
-21-
NOTE I – CONCENTRATION OF RISK (continued) further negotiations. Management expects an agreement to be reached and believes that an operational disruption is unlikely. As of March 31, 2017 and 2016, approximately 77% and 76%, respectively, of AML’s workforce was subject to collective bargaining agreements. None of these agreements expire within one year.
NOTE J – OPERATING LEASES TSS and AML lease certain equipment under agreements accounted for as operating leases. The following is a yearly statement of the future minimum payments under noncancellable leases at March 31, 2017:
Year ending
March 31: Amount
2018 $ 453,066 2019 313,041 2020 279,296 2021 279,296 2022
After 2022 279,296
1,117,186
$ 2,721,181
In most cases, management expects that in the normal course of business all leases will be renewed or replaced by other leases. Rental expense charged to operations totaled $706,908 and $688,712 for the years ended March 31, 2017 and 2016, respectively.
NOTE K – FAIR VALUE MEASUREMENTS
The Companies have characterized their financial instruments, based on the priority of the inputs used to value the financial instruments, into a three-level fair value hierarchy. The fair value hierarchy gives the highest priority to quoted prices in active markets for identical assets or liabilities [Level 1], and the lowest priority to unobservable inputs [Level 3]. If the inputs used to measure the investments fall within different levels of the hierarchy, the categorization is based on the lowest level input that is significant to the fair value measurement of the financial instruments. Financial instruments recorded in the balance sheet are categorized based on the inputs to valuation techniques as follows: Level 1: These are financial instruments where values are based on unadjusted quoted prices for identical sets in an active market that the Companies have the ability to access. Level 2: These are financial instruments where values are based on quoted prices in markets that are not active or model inputs that are observable either directly or indirectly for substantially the full term of the financial instruments. Level 3: These are financial instruments where values are based on prices or valuation techniques that require inputs that are both unobservable and significant to the overall fair value measurement. These inputs reflect assumptions of management about assumptions market participants would use in pricing the financial instruments.
Hoogovens USA, Inc. and Subsidiaries
NOTES TO CONSOLIDATED FINANCIAL STATEMENTS March 31, 2017 and 2016
-22-
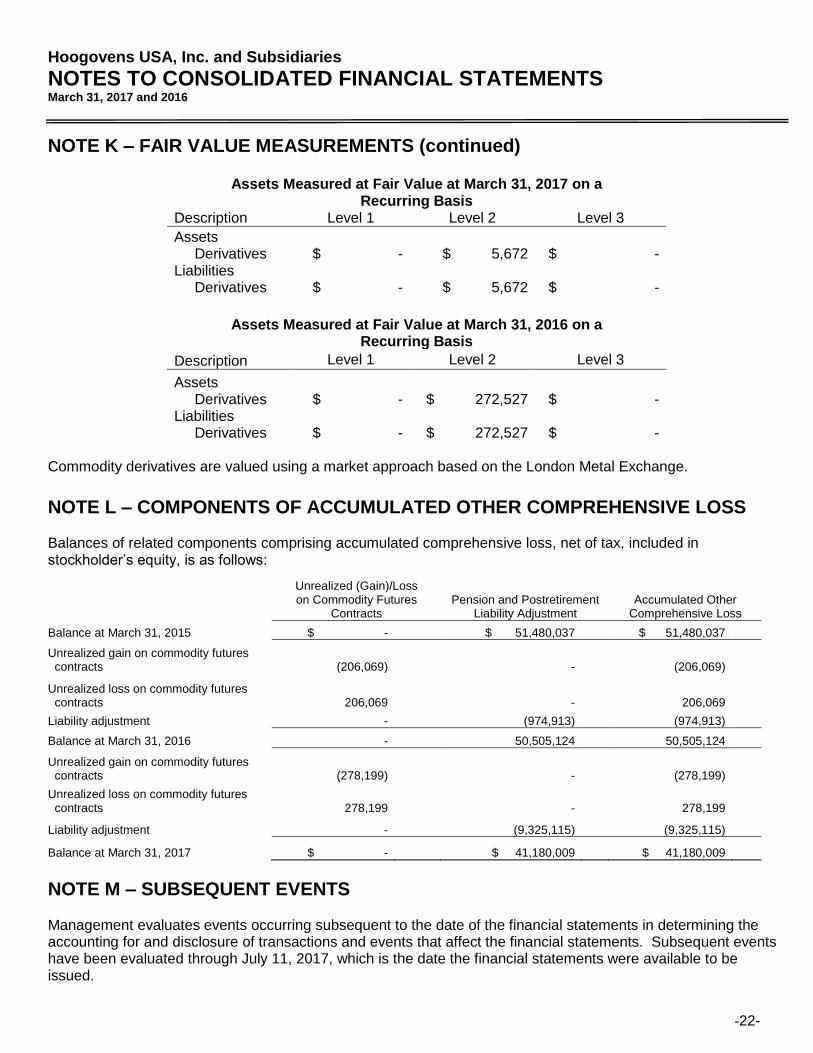
NOTE K – FAIR VALUE MEASUREMENTS (continued)
Assets Measured at Fair Value at March 31, 2017 on a Recurring Basis
Description Level 1 Level 2 Level 3
Assets Derivatives $ - $ 5,672 $ - Liabilities Derivatives $ - $ 5,672 $ -
Assets Measured at Fair Value at March 31, 2016 on a Recurring Basis
Description Level 1 Level 2 Level 3
Assets Derivatives $ - $ 272,527 $ - Liabilities Derivatives $ - $ 272,527 $ -
Commodity derivatives are valued using a market approach based on the London Metal Exchange.
NOTE L – COMPONENTS OF ACCUMULATED OTHER COMPREHENSIVE LOSS Balances of related components comprising accumulated comprehensive loss, net of tax, included in stockholder’s equity, is as follows:
NOTE M – SUBSEQUENT EVENTS
Management evaluates events occurring subsequent to the date of the financial statements in determining the accounting for and disclosure of transactions and events that affect the financial statements. Subsequent events have been evaluated through July 11, 2017, which is the date the financial statements were available to be issued.
Unrealized (Gain)/Loss on Commodity Futures
Contracts Pension and Postretirement
Liability Adjustment Accumulated Other
Comprehensive Loss
Balance at March 31, 2015 $ - $ 51,480,037 $ 51,480,037
Unrealized gain on commodity futures contracts (206,069) - (206,069)
Unrealized loss on commodity futures contracts 206,069 - 206,069
Liability adjustment - (974,913) (974,913)
Balance at March 31, 2016 - 50,505,124 50,505,124
Unrealized gain on commodity futures contracts (278,199) - (278,199)
Unrealized loss on commodity futures contracts 278,199 - 278,199
Liability adjustment - (9,325,115) (9,325,115)
Balance at March 31, 2017 $ - $ 41,180,009 $ 41,180,009

Hoogovens USA, Inc. and Subsidiaries
CONSOLIDATING BALANCE SHEETS
THOMAS THOMAS HILLE &
HOOGOVENS STEEL STRIP PROCESSING MUELLER APOLLO RECLASSIFICATIONS
USA, INC. CORP. COMPANY USA, INC. METALS, LTD. AND ELIMINATIONS CONSOLIDATED
CURRENT ASSETS
Cash 2,092,764$ -$ -$ 167,763$ 508,978$ -$ 2,769,505$
Accounts receivable
Trade, less allowance for doubtful accounts of $30,616
at March 31, 2017 - 7,298,352 71,724 408,527 1,750,958 - 9,529,561
Affiliated companies 1,765,585 36,783,738 60,463,287 5,628,476 5,568,881 (108,063,394) 2,146,573
Miscellaneous - (3,465) - - 211 - (3,254)
Total accounts receivable 1,765,585 44,078,625 60,535,011 6,037,003 7,320,050 (108,063,394) 11,672,880
Inventories:
Work in process and finished goods - 7,060,692 11,388 545,654 973,910 - 8,591,644
Raw materials and supplies - 8,613,658 17,798 - 1,279,634 - 9,911,090
Total inventories - 15,674,350 29,186 545,654 2,253,544 - 18,502,734
Note receivable from affiliated company 28,167,515 - - - - - 28,167,515
Prepaid expenses and other current assets 142,717 276,556 - - 259,672 - 678,945
Federal income tax refundable - - - - - - -
Deferred federal income taxes - 865,375 - - - - 865,375
TOTAL CURRENT ASSETS 32,168,581 60,894,906 60,564,197 6,750,420 10,342,244 (108,063,394) 62,656,954
INVESTMENTS IN SUBSIDIARIES 55,544,137 5,694,425 - 15,392,809 - (76,631,371) -
PROPERTY, PLANT AND EQUIPMENT
Land - 2,722,228 2,004,441 - 425,000 - 5,151,669
Buildings - 31,230,165 4,699,042 - 2,750,575 - 38,679,782
Machinery and equipment - 189,647,360 14,773,945 - 10,207,242 - 214,628,547
Computer software - 8,266,568 - - - - 8,266,568
Gas well - 290,613 - - - - 290,613
Construction in progress - 8,324,236 - - - - 8,324,236
- 240,481,170 21,477,428 - 13,382,817 - 275,341,415
Less accumulated depreciation - 221,225,364 19,813,186 - 10,808,680 - 251,847,230
NET PROPERTY, PLANT AND EQUIPMENT - 19,255,806 1,664,242 - 2,574,137 - 23,494,185
OTHER ASSETS
Deferred federal income taxes - 29,592,993 - 42,311 1,170,151 - 30,805,455
Other - 110,677 - - - - 110,677
TOTAL OTHER ASSETS - 29,703,670 - 42,311 1,170,151 - 30,916,132
TOTAL ASSETS 87,712,718$ 115,548,807$ 62,228,439$ 22,185,540$ 14,086,532$ (184,694,765)$ 117,067,271$
-23-
March 31, 2017

Hoogovens USA, Inc. and Subsidiaries
CONSOLIDATING BALANCE SHEETS
THOMAS THOMAS HILLE &
HOOGOVENS STEEL STRIP PROCESSING MUELLER APOLLO RECLASSIFICATIONS
USA, INC. CORP. COMPANY USA, INC. METALS, LTD. AND ELIMINATIONS CONSOLIDATED
CURRENT LIABILITIES
Bank overdraft -$ 2,841,780$ 80,633$ -$ -$ - 2,922,413$
Accounts payable
Trade - 4,960,805 67,147 51,163 698,028 - 5,777,143
Affiliated companies 21,567,515 56,955,797 40,959,383 1,815,783 1,793,931 (108,063,394) 15,029,015
Total accounts payable 21,567,515 61,916,602 41,026,530 1,866,946 2,491,959 (108,063,394) 20,806,158
-
Accrued vacation - 937,013 - - - - 937,013
Accrued income taxes 765,000 20,000 - - - - 785,000
Other accrued liabilities and expense - 2,144,032 34,042 (6,928) 626,721 - 2,797,867
Current portion of accrued pension and postretirement benefits - 3,350,934 - - 127,900 - 3,478,834
TOTAL CURRENT LIABILITIES 22,332,515 71,210,361 41,141,205 1,860,018 3,246,580 (108,063,394) 31,727,285
OTHER LIABILITIES
Accrued workers' compensation - 570,377 - - - - 570,377
Accrued pension liability - 40,541,141 - - 2,470,947 - 43,012,088
Accrued postretirement benefits - 6,668,925 - - - - 6,668,925
TOTAL OTHER LIABILITIES - 47,780,443 - - 2,470,947 - 50,251,390
TOTAL LIABILITIES 22,332,515 118,990,804 41,141,205 1,860,018 5,717,527 (108,063,394) 81,978,675
STOCKHOLDER'S EQUITY (DEFICIT) 65,380,203 (3,441,997) 21,087,234 20,325,522 8,369,005 (76,631,371) 35,088,596
TOTAL LIABILITIES AND STOCKHOLDER'S EQUITY (DEFICIT) 87,712,718$ 115,548,807$ 62,228,439$ 22,185,540$ 14,086,532$ (184,694,765)$ 117,067,271$
-24-
March 31, 2017

Hoogovens USA, Inc. and subsidiaries
CONSOLIDATING BALANCE SHEETS
THOMAS THOMAS HILLE &
HOOGOVENS STEEL STRIP PROCESSING MUELLER APOLLO RECLASSIFICATIONS
USA, INC. CORP. COMPANY USA, INC. METALS, LTD. AND ELIMINATIONS CONSOLIDATED
CURRENT ASSETS
Cash and cash equivalents 2,074,251$ 2,331,841$ 224,615$ 5,447,924$ 3,881,060$ -$ 13,959,691$
Accounts receivable
Trade, less allowance for doubtful accounts of $0
at March 31, 2016 - 7,332,669 38,370 221,884 1,348,629 - 8,941,552
Affiliated companies 798,585 33,910,526 58,016,617 - 689,349 (92,905,356) 509,721
Miscellaneous - 274,191 - - 503 - 274,694
Total accounts receivable 798,585 41,517,386 58,054,987 221,884 2,038,481 (92,905,356) 9,725,967
Inventories:
Work in process and finished goods - 6,254,352 3,019 564,099 670,652 - 7,492,122
Raw materials and supplies - 4,477,533 19,763 - 1,003,696 - 5,500,992
Total inventories - 10,731,885 22,782 564,099 1,674,348 - 12,993,114
Note receivable from affiliated company 6,600,000 - - - - - 6,600,000
Prepaid expenses and other current assets 23,759 282,793 - - 274,677 - 581,229
Federal income tax refundable 202,000 - - - - - 202,000
Deferred federal income taxes - 1,556,014 - - 56,576 - 1,612,590
TOTAL CURRENT ASSETS 9,698,595 56,419,919 58,302,384 6,233,907 7,925,142 (92,905,356) 45,674,591
INVESTMENTS IN SUBSIDIARIES 52,221,572 5,834,241 - 15,644,635 - (73,700,448) -
PROPERTY, PLANT, AND EQUIPMENT
Land - 2,722,228 2,004,441 - 425,000 - 5,151,669
Buildings - 31,230,165 4,699,042 - 2,750,575 - 38,679,782
Machinery and equipment - 189,112,924 14,773,945 - 10,161,124 - 214,047,993
Computer software - 8,266,568 - - - - 8,266,568
Gas well - 290,613 - - - - 290,613
Construction in progress - 2,354,626 - - - - 2,354,626
- 233,977,124 21,477,428 - 13,336,699 - 268,791,251
Less accumulated depreciation - 218,845,493 19,552,369 - 10,430,025 - 248,827,887
NET PROPERTY PLANT AND EQUIPMENT - 15,131,631 1,925,059 - 2,906,674 - 19,963,364
OTHER ASSETS
Deferred federal income taxes - 32,972,251 - 16,199 1,246,326 - 34,234,776
Other - 110,677 - - - - 110,677
TOTAL OTHER ASSETS - 33,082,928 - 16,199 1,246,326 - 34,345,453
TOTAL ASSETS 61,920,167$ 110,468,719$ 60,227,443$ 21,894,741$ 12,078,142$ (166,605,804)$ 99,983,408$
-25-
March 31, 2016

Hoogovens USA, Inc. and subsidiaries
CONSOLIDATING BALANCE SHEETS
THOMAS THOMAS HILLE &
HOOGOVENS STEEL STRIP PROCESSING MUELLER APOLLO RECLASSIFICATIONS
USA, INC. CORP. COMPANY USA, INC. METALS, LTD. AND ELIMINATIONS CONSOLIDATED
CURRENT LIABILITIES
Accounts payable
Trade -$ 2,193,234$ 69,553$ 18,293$ 708,746$ -$ 2,989,826$
Affiliated companies - 53,082,468 38,645,017 1,745,340 952,888 (92,905,356) 1,520,357
Total accounts payable - 55,275,702 38,714,570 1,763,633 1,661,634 (92,905,356) 4,510,183
Accrued vacation - 902,770 - - - - 902,770
Other accrued liabilities and expense - 3,014,304 33,997 4,330 898,436 - 3,951,067
Current portion of accrued pension and postretirement benefits - 5,355,812 - - 166,400 - 5,522,212
TOTAL CURRENT LIABILITIES - 64,548,588 38,748,567 1,767,963 2,726,470 (92,905,356) 14,886,232
OTHER LIABILITIES
Notes payable to affiliated company - - - - 3,000,000 - 3,000,000
Accrued workers' compensation - 518,694 - - - - 518,694
Accrued pension liability - 49,685,124 - - 2,976,346 - 52,661,470
Accrued postretirement benefits - 6,613,567 - - - - 6,613,567
TOTAL OTHER LIABILITIES - 56,817,385 - - 5,976,346 - 62,793,731
TOTAL LIABILITIES - 121,365,973 38,748,567 1,767,963 8,702,816 (92,905,356) 77,679,963
STOCKHOLDER'S EQUITY (DEFICIT) 61,920,167 (10,897,254) 21,478,876 20,126,778 3,375,326 (73,700,448) 22,303,445
TOTAL LIABILITIES AND STOCKHOLDER'S EQUITY (DEFICIT) 61,920,167$ 110,468,719$ 60,227,443$ 21,894,741$ 12,078,142$ (166,605,804)$ 99,983,408$
-26-
March 31, 2016
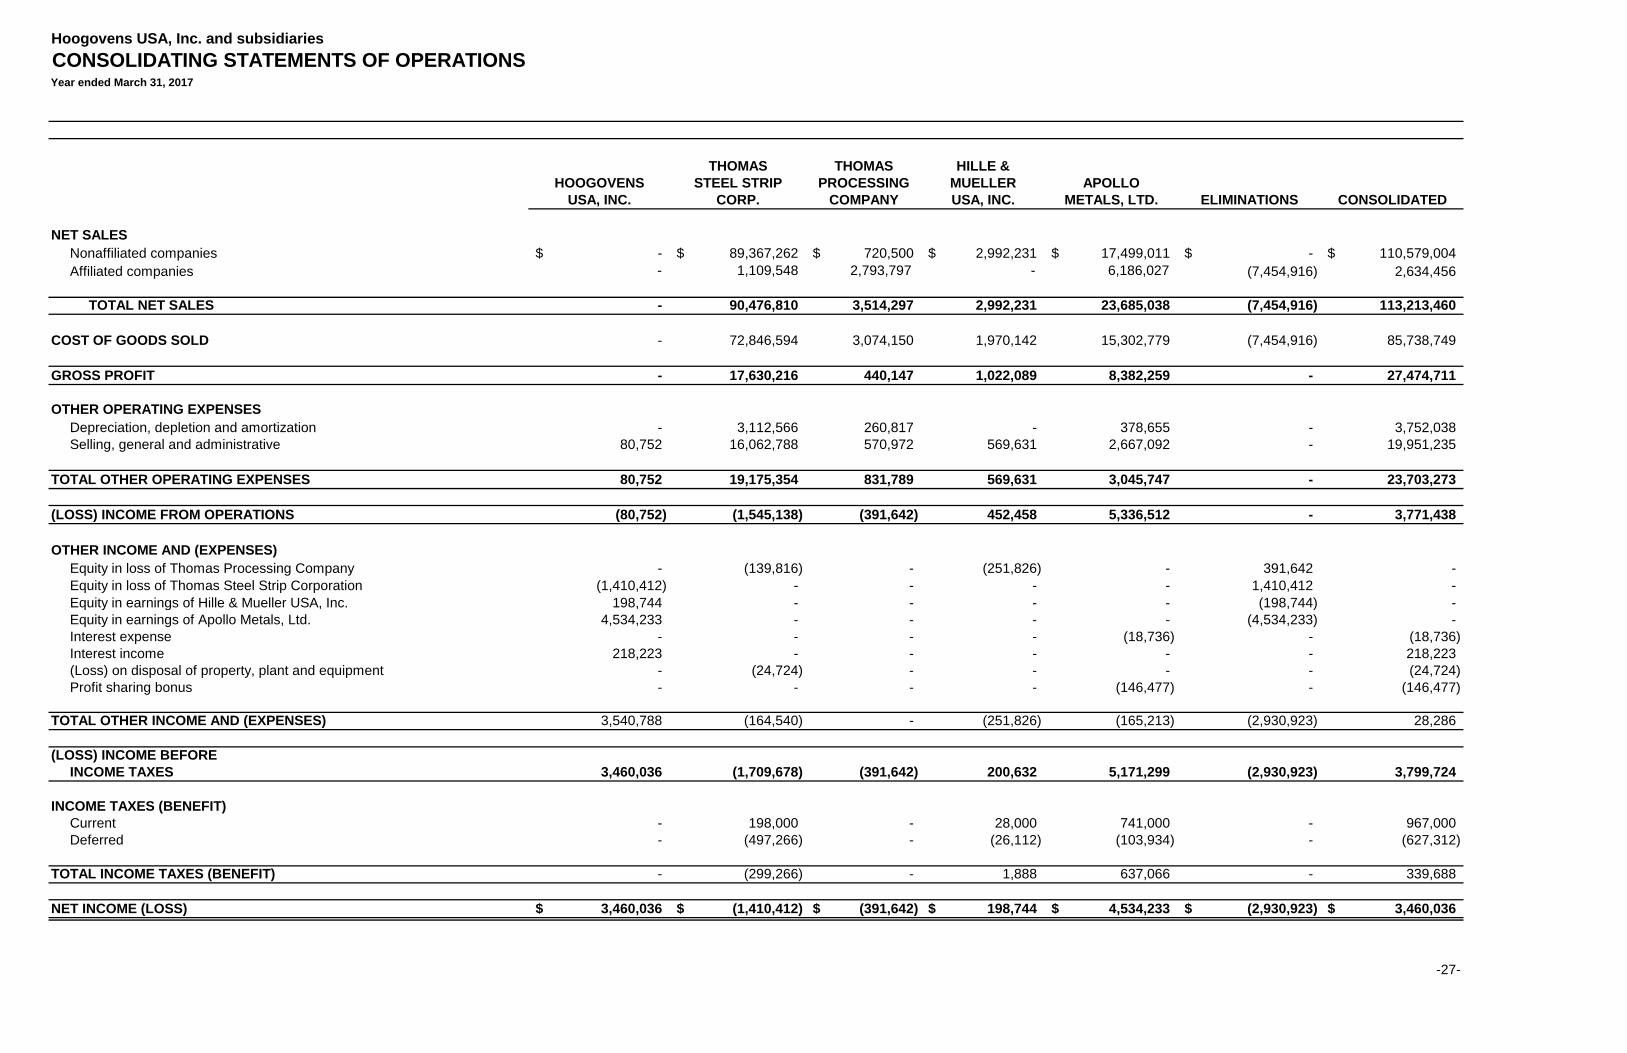
Hoogovens USA, Inc. and subsidiaries
CONSOLIDATING STATEMENTS OF OPERATIONS
THOMAS THOMAS HILLE &
HOOGOVENS STEEL STRIP PROCESSING MUELLER APOLLO
USA, INC. CORP. COMPANY USA, INC. METALS, LTD. ELIMINATIONS CONSOLIDATED
NET SALES
Nonaffiliated companies -$ 89,367,262$ 720,500$ 2,992,231$ 17,499,011$ -$ 110,579,004$
Affiliated companies - 1,109,548 2,793,797 - 6,186,027 (7,454,916) 2,634,456
TOTAL NET SALES - 90,476,810 3,514,297 2,992,231 23,685,038 (7,454,916) 113,213,460
COST OF GOODS SOLD - 72,846,594 3,074,150 1,970,142 15,302,779 (7,454,916) 85,738,749
GROSS PROFIT - 17,630,216 440,147 1,022,089 8,382,259 - 27,474,711
OTHER OPERATING EXPENSES
Depreciation, depletion and amortization - 3,112,566 260,817 - 378,655 - 3,752,038
Selling, general and administrative 80,752 16,062,788 570,972 569,631 2,667,092 - 19,951,235
TOTAL OTHER OPERATING EXPENSES 80,752 19,175,354 831,789 569,631 3,045,747 - 23,703,273
(LOSS) INCOME FROM OPERATIONS (80,752) (1,545,138) (391,642) 452,458 5,336,512 - 3,771,438
OTHER INCOME AND (EXPENSES)
Equity in loss of Thomas Processing Company - (139,816) - (251,826) - 391,642 -
Equity in loss of Thomas Steel Strip Corporation (1,410,412) - - - - 1,410,412 -
Equity in earnings of Hille & Mueller USA, Inc. 198,744 - - - - (198,744) -
Equity in earnings of Apollo Metals, Ltd. 4,534,233 - - - - (4,534,233) -
Interest expense - - - - (18,736) - (18,736)
Interest income 218,223 - - - - - 218,223
(Loss) on disposal of property, plant and equipment - (24,724) - - - - (24,724)
Profit sharing bonus - - - - (146,477) - (146,477)
TOTAL OTHER INCOME AND (EXPENSES) 3,540,788 (164,540) - (251,826) (165,213) (2,930,923) 28,286
(LOSS) INCOME BEFORE
INCOME TAXES 3,460,036 (1,709,678) (391,642) 200,632 5,171,299 (2,930,923) 3,799,724
INCOME TAXES (BENEFIT)
Current - 198,000 - 28,000 741,000 - 967,000
Deferred - (497,266) - (26,112) (103,934) - (627,312)
TOTAL INCOME TAXES (BENEFIT) - (299,266) - 1,888 637,066 - 339,688
NET INCOME (LOSS) 3,460,036$ (1,410,412)$ (391,642)$ 198,744$ 4,534,233$ (2,930,923)$ 3,460,036$
-27-
Year ended March 31, 2017

Hoogovens USA, Inc. and Subsidiaries
CONSOLIDATING STATEMENTS OF OPERATIONS
THOMAS THOMAS HILLE &
HOOGOVENS STEEL STRIP PROCESSING MUELLER APOLLO
USA, INC. CORP. COMPANY USA, INC. METALS, LTD. ELIMINATIONS CONSOLIDATED
NET SALES
Nonaffiliated companies -$ 92,510,538$ 563,223$ 3,301,933$ 18,035,625$ -$ 114,411,319$
Affiliated companies - 881,524 2,767,870 - 5,770,704 (6,513,057) 2,907,041
TOTAL NET SALES - 93,392,062 3,331,093 3,301,933 23,806,329 (6,513,057) 117,318,360
COST OF GOODS SOLD - 75,086,510 2,582,519 2,616,262 18,171,593 (6,513,057) 91,943,827
GROSS PROFIT - 18,305,552 748,574 685,671 5,634,736 - 25,374,533
OTHER OPERATING EXPENSES
Depreciation, depletion and amortization - 2,897,314 119,888 - 395,254 - 3,412,456
Selling, general and administrative 58,932 17,303,862 832,936 595,526 2,336,041 - 21,127,297
TOTAL OTHER OPERATING EXPENSES 58,932 20,201,176 952,824 595,526 2,731,295 - 24,539,753
(LOSS) INCOME FROM OPERATIONS (58,932) (1,895,624) (204,250) 90,145 2,903,441 - 834,780
OTHER INCOME AND (EXPENSES)
Equity in earnings of Thomas Processing Company - (72,917) - (131,333) - 204,250 -
Equity in earnings of Thomas Steel Strip Corporation (1,280,889) - - - - 1,280,889 -
Equity in earnings of Hille & Mueller USA, Inc. 11,400 - - - - (11,400) -
Equity in earnings of Apollo Metals, Ltd. 2,689,305 - - - - (2,689,305) -
Interest expense - - - - (97,542) - (97,542)
Interest income 116,322 11 - - - - 116,333
(Loss) on disposal of property, plant, and equipment - (23,622) - - - - (23,622)
Profit sharing bonus - 6,586 - - (105,674) - (99,088)
TOTAL OTHER INCOME AND (EXPENSES) 1,536,138 (89,942) - (131,333) (203,216) (1,215,566) (103,919)
INCOME (LOSS) BEFORE
INCOME TAXES 1,477,206 (1,985,566) (204,250) (41,188) 2,700,225 (1,215,566) 730,861
INCOME TAXES (BENEFIT)
Current 30,000 - - - - - 30,000 Deferred - (704,677) - (52,588) 10,920 - (746,345)
TOTAL INCOME TAXES (BENEFIT) 30,000 (704,677) - (52,588) 10,920 - (716,345)
NET INCOME (LOSS) 1,447,206$ (1,280,889)$ (204,250)$ 11,400$ 2,689,305$ (1,215,566)$ 1,447,206$
-28-
Year ended March 31, 2016

1-800-943-4278 www.packerthomas.com
![Index [] · · 2008-08-19Visakhapatnam Dist. (A.P.) Pin 531 163 Subsidiaries: Divis Laboratories (USA) Inc. New Jersey, USA. Divi’s Laboratories Europe AG Basel, Switzerland](https://img.pdfslide.us/doc/110x75/5ac206cd7f8b9a4e7c8dc89b/index-dist-ap-pin-531-163-subsidiaries-divis-laboratories-usa-inc-new.jpg)