Embed Size (px)
Citation preview

Hong Kong Shanghai Alliance Holdings Limited
Stock code: 1001.HK
Corporate Presentation
September 2021

2
2020/21 Achievements
Turnaround from a net loss attributable to
owners of the Company of approximately
HK$90.3 million, to a net profit
attributable to owners of the Company of
approximately HK$1.7 million
Central Park•Pudong and Central
Park•Jing’an enjoyed higher occupancy
rate and leasing price since the last
quarter of the Year
Building & Design Solutions
Business recorded satisfactory
growth despite under the impact of
COVID-19
Achieved an admirable turnaround to profits
Property Investment and Project
Management Business saw rebound
momentum, with successful
acquisition of Central Park•Huangpu
Strong order book and efficiency
enhancement for Construction
Materials Business
Record-high order book and growing
efficiency for its automated rebar processing
and assembly plant in Tsing Yi
Expanding margins for construction
products and surface critical coil distribution
in HK and China
Increasing number of hotel and shopping
mall development and upgrade projects
lead to improving business performance

Scope of Business
Portion of FY20/21 Revenue | FY19/20 Revenue(For the year ended 31 March 2021 | 2020)
Property Investment and
Project Management
A niche player and specialist
in property value
enhancement with successful
track record
Innovative renovation
Accurate market positioning
Tenant upgrade
Participated property projects
include The Point Jing’an
(disposed in March 2014),
Central Park • Putuo
(disposed in March 2017),
Park Lane (disposed in
September 2017), Central
Park • Pudong, Central Park •
Jing’an and Central Park •
Huangpu
4.6% | 4.0%
3
Construction Materials
80.1% | 80.2%
A leading processor and
distributor of infrastructure
products serving Hong Kong
and Macau’s burgeoning
construction market
Leading market share in
Hong Kong (approx. 20%-25%)
Hong Kong’s first government
approved automated rebar
prefabrication yard
Leading distributor of surface
critical steel serving China’s
automotive sector
15.1% | 11.9%
Building & Design Solutions
A distributor of world-
renowned sanitary &
kitchenware brands in
Hong Kong, Mainland China
and Macau
Architectural & Design
Centre serving the needs of
developers in the high-end
consumer market, where
purchases are influenced by
architects and designers
*
*During the Year, the management has grouped the financial result of Engineering Plastics Business segment into unallocated due to the scaling down of its operation.

Property Investment and
Project Management
Business

Shanghai Focused High-end Commercial Property Market
A niche player and specialist in property value enhancement with successful track record
The Buy-Build-Sell Business Model
Project selection Exit strategiesAsset upgrade
Shanghai focused
High demand in high-end
commercial and residential
properties
Strong potential in occupancy rate
and rental upside after
enhancement works
Precise market positioning
Innovative design and renovation
Maximization of leasable space
Proactive leasing strategy
Upgrade of tenant mix
• Rental income significantly
increased by [-]%
• Hold for investment or sell out
Hold for investment
Leasing offices
Tenant mix management
Rental income
Sell
Asset revaluation
5
Participated Projects
The Point Jing’an
(Successful disposal in March 2014)
Central Park• Putuo
(Successful disposal in March 2017)
Park Lane
(successful disposal in September 2017)
Central Park • Pudong (formerly known as
Chuang Yi Tower)
Central Park • Jing’an (formerly known as
Longyu International Plaza)
Central Park • Huangpu (formerly known as
Great Wall Financial Building)

Central Park • Pudong (100% owned)
6
Competitive Edge
Located in the Pudong New District (hub of financial services)
Benefited from the market trend of decentralization from central
business district
LEED gold for sustainable development
Synergies with the HK Land project
Business Strategies
Position as a prime office with a grand reception lobby and spacious
green surrounding
Enhance facilities and surrounding environment
Increase leasable areas through renovation of G/F space
Professional property management service

Central Park • Jing’an (Jointly owned with GIC through JV)
7
Competitive Edge
Located in Jing’an District (central commercial area)
Directly accessible to 3 metro lines
Business Strategies
Position as a prime office with modern reception lobby and façade
Renovate the public area, lift lobbies and office area to give a
completely new look
Manage the tenant mix and uplift its tenant quality
Professional property management service
Central Park • Huangpu (Jointly owned with Apollo through JV)
8
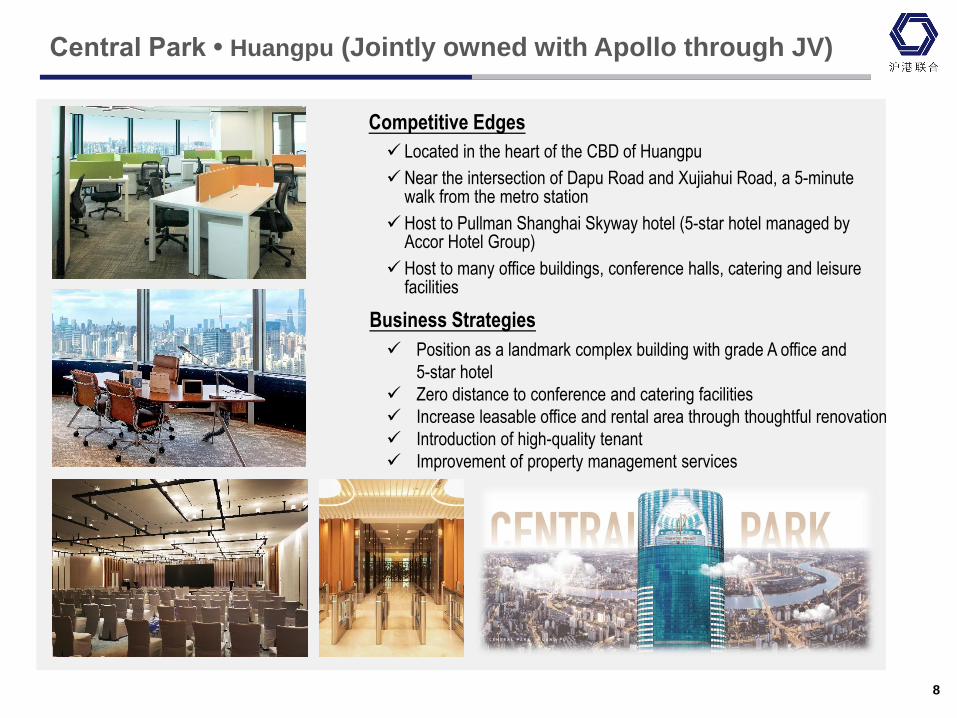
Competitive Edges
Located in the heart of the CBD of Huangpu
Near the intersection of Dapu Road and Xujiahui Road, a 5-minute walk from the metro station
Host to Pullman Shanghai Skyway hotel (5-star hotel managed by Accor Hotel Group)
Host to many office buildings, conference halls, catering and leisure facilities
Business Strategies
Position as a landmark complex building with grade A office and
5-star hotel
Zero distance to conference and catering facilities
Increase leasable office and rental area through thoughtful renovation
Introduction of high-quality tenant
Improvement of property management services

Shanghai Property Market
2021 Shanghai Office Market Overview
9
Grade A Office Market
Supply
• Although COVID-19 pandemic has delayed project completion and
delivery, a total of 7 new office projects were launched in Shanghai in
2021Q1
• In 2021Q1, Shanghai’s office market continued to show healthy signs of
rebound, with continued excellent net absorption performance and a
rapid recovery in market confidence
• 2.23 million sqm of new office supply is estimated to be launched into
the market
2021(Estimate)
2020(Estimate)
Change
New Supply (sqm) 2.23m 1.80m +23.9%
2021 Q1 Rents
QoQ% decrease
Grade-A Office Market 0.36% QoQ
Core CBDs 0.14% QoQ
Rents
• Average rent had declined slightly for Shanghai office market
• Grade-A office market followed similar trends, with average rent
decreased slightly by 0.36% QoQ in 2021Q1
• The average rent of Core CBDs edged down by a modest 0.14%,
to RMB10.81 per sqm per day
• However, the rents for some Emerging Business Districts have increased
significantly
2021Q1 2020Q1 Change
New Supply (sqm) 0.97m 0.49m +98.0%
Transaction
Volume (sqm)
3.2m 0.96m +233.3%
Average Selling
Price (RMB / sqm)
55,800 55,770 +0.05%
2021 Shanghai Residential Market Overview
Head Start for Residential Market, Commercial Potentially Follow Suit
• With residential market taking a more significant hit from the initial stage
of the pandemic, it enjoyed a sooner-than-market rebound, with
supply, transaction volume, as well as average selling price all showing
a recovery
• The “Opinions on accelerating the construction of Shanghai as an
international financial center and the integrated development of the
Yangtze River Delta” was announced
• It is expected that Shanghai would welcome more financial
corporations and firms from emerging segments, establishing their
foothold as the major financial hubSources: Savills, Knight Frank, Colliers, Jones Lang LaSalle

Growth Strategy
Identify property projects with room for asset
upgrade so as to improve occupancy rate /
rental rate / tenant mix
Provide one-stop solutions for revitalizing
under-performing commercial buildings to
valuable assets
Look for local and international quality
partners for setting up joint venture and/or
fund partnership for business expansion,
cultivating relationships and fully realising
value
Co-investment venture with Reco Wisteria Private Limited*
Date of Establishment June 2018
Effective Equity Interest 9.3%
Investment US$32,550,000
Investment Target Central Park • Jing’an
10
*An investment arm of the Minister for Finance of the Government of Singapore
Provide asset management services to
generate more benefits and income from
transaction
Joint Venture with Apollo Skyline Holding Limited
Date of Establishment November 2019
Effective Equity Interest 5.0%
Investment US$10,000,000
Investment Target Central Park • Huangpu
Strategy for long-term growth

Construction Materials Business

Value-Added Processing and Tailor-made Solutions
VSC Steel Company Limited is a leading construction steel distributor in Hong Kong
VSC Construction Steel Solutions Limited is the first government-approved automation
prefabrication yard
Regional player serving Hong Kong and Macau
Established Hong Kong’s First Automated Rebar Processing and Assembly Plant
Location :Tsing Yi, Hong Kong
with pier access
Total site
area: 30,000 square meters
Highly Automated Cut & Bend Equipment Rebar Processing
TraceabilitySafety On-time CompletionProcessing Efficiency
Competitive Edges
12

Strong Order Book Driven by Major Construction Projects
13
Cut and Bend
Tseung Kwan O - Lam Tin Tunnel Shek Wu Hui Effluent Polishing
Plant
Tin Win Stop Residential
Development
Hong Kong Airport 3rd Runway Hong Kong Airport Terminal 2 Extension
Steel Distribution
Skycity – 11 Skies Mega Complex
Water Supplies Department &
Correctional Services Department
Headquarters Building in Chai Wan
Redevelopment of
Mariners’ Club at
Tsim Sha Tsui
Hotel Development
at Cheung Sha Wan
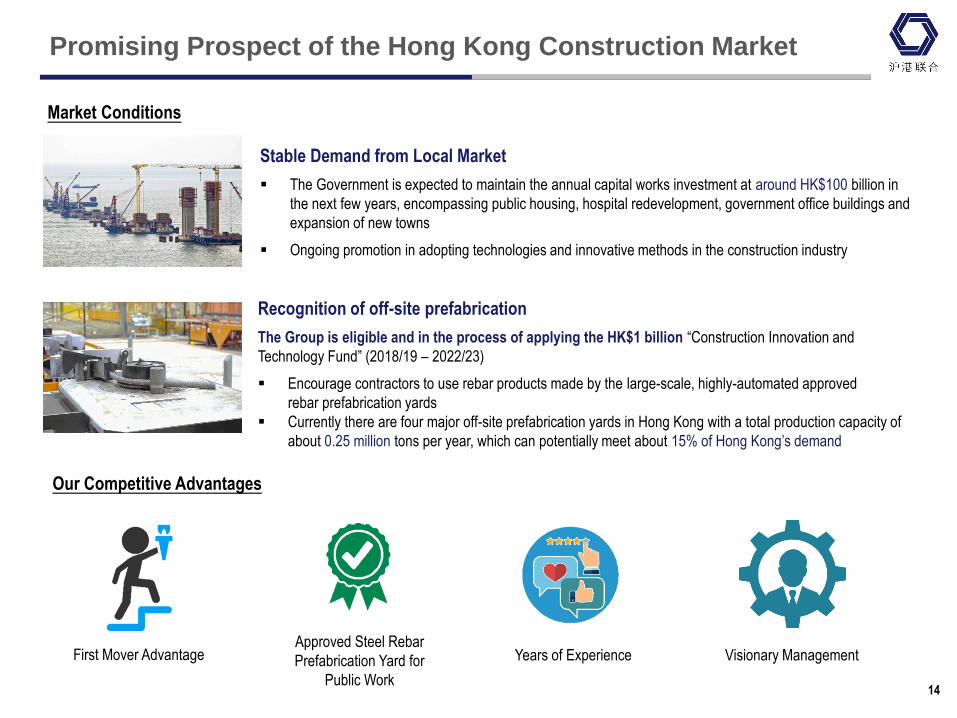
Promising Prospect of the Hong Kong Construction Market
Stable Demand from Local Market
The Government is expected to maintain the annual capital works investment at around HK$100 billion in
the next few years, encompassing public housing, hospital redevelopment, government office buildings and
expansion of new towns
Ongoing promotion in adopting technologies and innovative methods in the construction industry
Recognition of off-site prefabrication
The Group is eligible and in the process of applying the HK$1 billion “Construction Innovation and
Technology Fund” (2018/19 – 2022/23)
Encourage contractors to use rebar products made by the large-scale, highly-automated approved
rebar prefabrication yards
Currently there are four major off-site prefabrication yards in Hong Kong with a total production capacity of
about 0.25 million tons per year, which can potentially meet about 15% of Hong Kong’s demand
Market Conditions
Our Competitive Advantages
First Mover AdvantageApproved Steel Rebar
Prefabrication Yard for
Public Work
Visionary ManagementYears of Experience
14

Opportunities with Hong Kong Infrastructure Projects
Ride on the increasing demand of high-quality construction steel, expanding current businesses while consolidating its market position
Our Offer:
Huge potentials in collaborating with multinational corporations to extend the services to other countries
High-quality
steel
High processing
efficiencyHigh traceability
On-time
completion
Strong
emphasis on
safety
15
Hong Kong Government continues to invest in infrastructure projects
Harbourfront Enhancement
The Government has earmarked HK$6.5 billion for implementing a number of harbourfront development initiatives
Making Good Use of Government Land
The Government has taken forward multiple projects under the "single site, multiple use" initiative
Railway Development
Tuen Ma Line is completed and in operation
The Government will progressively implement the new railway projects
In the next few years, the annual capital works expenditure is expected to reach HK$100 billion on average, and the annual total construction output will increase to around HK$300 billion

BSC – Coil Processing
Early Vendor Involvement
(EVI)
Product Design
Product Testing
Inventory Planning
Value Analysis/
Value Engineering (VA/VE)
Processing
Logistics
Inventory Management
Cost & Efficiency
Steel Mills BSC Automotive End Users
Services
Coil Slitting
Cut-to-length Stamping
Development Plan
1
2
3
Geographical expansion – expanding presence in
Shanghai, Liaoning, Shandong, Jiangsu, Guangdong,
Hubei and Henan
Margin expansion – walk away from customers that
have low profit margin or high collection risk in order to
further boost profitability
Management by local – promoting employee stock
ownership plan to senior management in order to
promote efficient management with local expertise
16

Building & Design
Solutions Business

Building & Design Solutions
Extensive client network of the Group’s construction materials and
property businesses brings synergies and accelerates the
development of the Building & Design Solutions Business
Rising market perception of better quality of life, along with
growing emphasis on daily hygiene as a result of COVID-19
Experienced team delivering technical and design services as well
as installation
Software solutions that simplify design and layout efforts for
customers
Brands Represented End-users
Distributor with Value-added Services Distribution Channels
Building & Design Solutions for Sanitary & Kitchenware
Wholesale to sub-dealers
Directly supply to projects
including our
property renovation
Architectural & Design Centre
for retail business and
renovation
1
2
3
Architectural & Design Centre
catering to architects & designers
Product testing
Mock displays
Space for architects &
designers
Software solutions
Establish & manage showrooms
with sub-dealers
Credit payment terms
Property developers
Architects and
designers
Hotels
Interior design
companies
Healthcare and
elderly care
18

New Product Line with Expanding Geographical Coverage
Re-entering Macau Market with TOTO
Entered Macau market with one-stop solutions along with efficient on-site technical support & instant spare parts replacement
Key projects reference and project pipelines include:
New Product Line Catering General Residential Market
Durban is a Germany brand with various OEM possibilities on sanitary-wares, fittings & accessories
Durban is developed for design-oriented customers who look for tailor-made or unique solutions
Aim to offer a complementary product portfolio
Expected contribution of around 3 to 5% of total turnover
19
Projects in Hong Kong
Hong Kong International Airport T1, T2
extension and Runway 3
Hong Kong Sanatorium &
Hospital New Building
Hong Kong Convention & Exhibition
Centre RenovationAIRSIDE, Kai Tak
Central Plaza Renovation 239 Century Hotel Project
Hopewell Center II Island Shangri-la Hotel Renovation
Harbour City Renovation Four Season Hotel Renovation
2 Murray Road Office Development Intercontinental Hotel Renovation
The Quayside Two Taikoo Place Project
Kimpton Hotel The Rosewood Hotel Project
Projects in Macau
Seac Pai Van ResidentialMacau City of Dream
Renovation
City of Dream Phase 2 Galaxy Phase 3 HOH
Galaxy Phase 3C Parisian Hotel 2.3 Bay
W Hotel Macau Nuwa Hotel
Iconic Hotel Macau

Financial Overview

Group Financial Summary
21
For the year ended 31 March
Financial highlights (HK$m) FY20/21 FY19/20 Change
Revenue 2,073.6 2,325.0 -10.8%
Gross profit 253.0 241.6 +4.7%
Operating profit / (loss) 96.0 4.8 +1,895.0%
Profit / (loss) attributable to
owners of the Company1.7 (90.3) Negative to Positive
Basic earnings / (loss) per
ordinary share (HK cent(s))0.26 (14.08) Negative to Positive
Profitability ratios
Gross profit margin 12.2% 10.4% +1.8 p.p.
Operating profit margin 4.6% 0.2% +4.4 p.p.
Net profit / (loss) margin 0.2% (3.8%) +4.0 p.p.
The turnaround is mainly
attributable to the
improvement in
performance of the
Construction Materials
Business, with its profit
before income tax grew
by approximately
396.6% year-on-year

Revenue Analysis
Total revenue
80.1%(80.2%)
15.1%(11.9%)
4.6%(4.0%)
Construction Materials Building & Design Solutions
Property Investment andProject Management
Unallocated
0.2%
(3.9%)
FY20/21 (FY19/20)
Total:
HK$2,073.6 million
(HK$2,325.0 million)
Total revenue by business segment
22
1,864.81,660.8
275.9
313.9
93.5
94.1
90.8
4.9
FY19/20 FY20/21
Construction Materials Building & Design Solutions
Property Investment andProject Management
Unallocated
2,073.6
2,325.0
HK$m

Gross Profit Analysis
23
Gross profit and gross profit margin
HK$m
241.6253.0
10.4%
12.2%
125
175
225
275
325
375
FY19/20 FY20/21
Even though revenue recorded a slight decrease, gross profit for the year rose by 4.7%, mainly attributable to the tightened control on
operating costs, as well as the improvement in operational efficiency and inventories procurement strategy. As a result, gross profit
margin increased from approximately 10.4% to approximately 12.2%.

Net Profit and Key Analysis
24
Net profit/(loss) and dividends Key expenses as % to revenue
HK$m FY20/21 FY19/20 Change
Selling and
distribution
expenses
15.7
(0.8%)
11.8
(0.5%)+0.3 p.p.
General and
administrative
expenses
140.7
(6.8%)
217.8
(9.4%)-2.6 p.p.
Net finance costs62.9
(3.0%)
78.4
(3.4%)-0.4 p.p.
HK$m FY20/21 FY19/20 Change
Profit / (loss)
attributable to
owners of the
Company
1.7 (90.3)Negative
to Positive
Basic earnings /
(loss) per ordinary
share (HK cent(s))0.26 (14.08)
Negative
to Positive
Proposed special
dividend per
ordinary share
(HK cent(s))
1.00 n/a n/a
Dividend payout
ratio383.3% n/a n/a
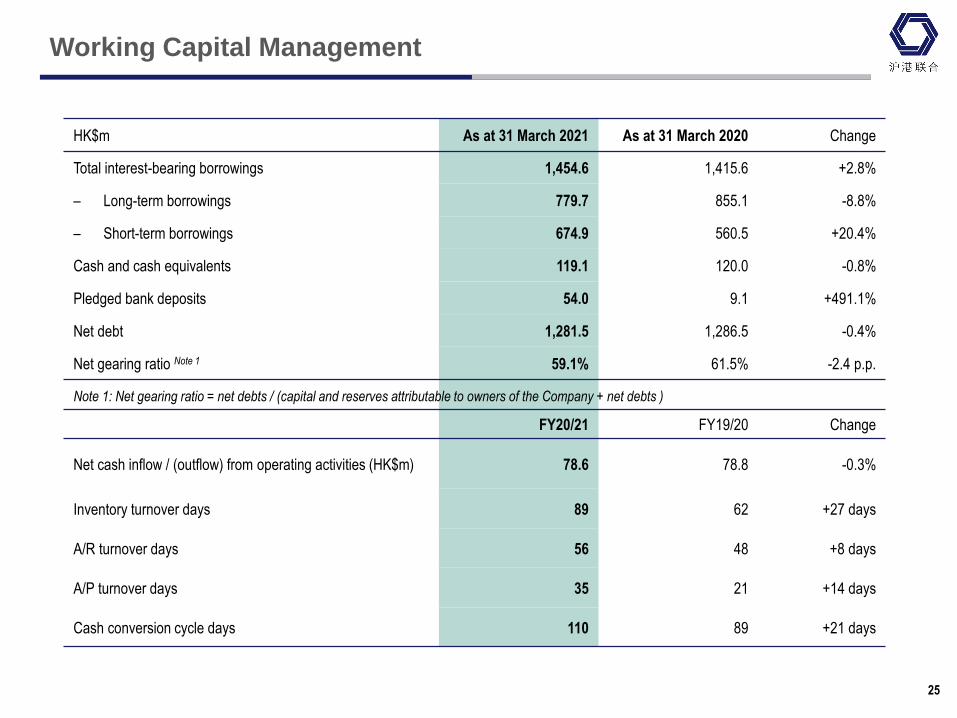
Working Capital Management
25
HK$m As at 31 March 2021 As at 31 March 2020 Change
Total interest-bearing borrowings 1,454.6 1,415.6 +2.8%
– Long-term borrowings 779.7 855.1 -8.8%
– Short-term borrowings 674.9 560.5 +20.4%
Cash and cash equivalents 119.1 120.0 -0.8%
Pledged bank deposits 54.0 9.1 +491.1%
Net debt 1,281.5 1,286.5 -0.4%
Net gearing ratio Note 1 59.1% 61.5% -2.4 p.p.
FY20/21 FY19/20 Change
Net cash inflow / (outflow) from operating activities (HK$m) 78.6 78.8 -0.3%
Inventory turnover days 89 62 +27 days
A/R turnover days 56 48 +8 days
A/P turnover days 35 21 +14 days
Cash conversion cycle days 110 89 +21 days
Note 1: Net gearing ratio = net debts / (capital and reserves attributable to owners of the Company + net debts )

Capital Allocation Philosophy
26
2
Priority
Acquisition Opportunities Identify potential projects that have strong potential on occupancy and rental upside improvement after
enhancement works
Identify Building & Design Solutions competitors that allow us to expand our geographic coverage and
diversify our brand and product offer
Identify competitors with funds and brands with international appeal but under financial distress
3 Capital Expenditure Automated rebar processing and assembly plant in Tsing Yi and increase its capability to meet the
strong growth in market demand (internal or bank funding)
Existing property upgrade to enhance the properties’ values, occupancy rates and average rent (internal
or bank funding)
4 Dividend Thoughtful consideration of dividend policy as means to return capital to shareholders
5 Share Buyback
1 Ensure Sufficient Working Capital for Normal Business Operations

Appendix

Corporate Milestones
28
■ Launched Building &
Design Solutions
Business and
became the
distributor of TOTO
Japan sanitary ware
products in HK
■Obtained
distribution
rights to TOTO
products in
Hubei Province
■ Jointly acquired
investment
property “The
Point Jing An”
in Shanghai
■ Listed on the
Main Board of the
Hong Kong Stock
Exchange,
stock code:
1001.HK
■ Founded as an
importer of
construction steel
■Disposal of the joint
investment property “The
Point Jing An” in Shanghai
■ Acquired the deluxe
serviced complex
apartment “Park Lane” in
Shanghai through
investment in a fund
■ Partnership with NatSteel to
establish an automated
rebar processing and
assembly plant in Tsing Yi
■ Launched Hong Kong's
first automated rebar
processing and
assembly plant
■Completed acquisition
of Central Park •
Pudong in Shanghai
■Opened the largest
TOTO Flagship
Architectural & Design
Centre in HK
■ Acquired the remaining
33.3% stake of Shanghai
Bao Shun Chang from
Baosteel Group (HKSHA
100% ownership)
■ Acquired 2nd investment
property “Central Park •
Putuo” in Shanghai
2016
2017
■ Successful disposal
of Central Park •
Putuo and Park Lane
1961
2008
2013
2014
2011
1994
1997
2018
■Completed the
formation of a co-
investment venture
with an investment
arm of the Minister for
Finance of the
Government of
Singapore (“GIC JV”)
■Completed the
acquisition of Central
Park • Jing’an through
GIC JV
2019
■Completed the
ramp-up of Central
Park • Jing’an, with
the project beginning
to generate profit for
the Group
■Completed the
acquisition of
Central Park •
Huangpu through
Apollo JV
2020
■Completed the
formation of a co-
investment venture
with Apollo
(“Apollo JV”)

Shareholding Structure
29
Mr. Andrew Yao (Chairman)
& Associates
44.2%
Public Shareholders
55.8%
No. of issued shares (as of 31 August 2021): 641,232,315 shares

Consolidated Income Statement
30
For the Year ended 31 March
HK$’000 2021 2020
Revenue 2,073,632 2,325,031
Cost of sales (1,820,613) (2,083,428)
Gross profit 253,019 241,603
Selling and distribution expenses (15,728) (11,803)
(Impairment loss) on / reversal of financial
assets - net(293) 3,020
General and administrative expenses (140,703) (217,810)
Other gains / (losses) – net 8,067 (10,110)
Net fair value loss on investment properties (8,362) (88)
Operating profit 96,000 4,812
Finance income 1,110 1,216
Finance costs (64,024) (79,616)
Share of results of investments
accounted for using the equity method(19,724) (12,947)
Profit / (loss) before income tax 13,362 (86,535)
Income tax expense (9,539) (1,616)
Profit / (loss) for the year 3,823 (88,151)
Profit / (loss) attributable to:
- Owners of the Company 1,673 (90,309)
- Non-controlling interests 2,150 2,158
Basic earnings / (loss) per ordinary share (HK cent(s)) 0.26 (14.08)
Proposed special dividend per ordinary share (HK cent(s)) 1.00 --
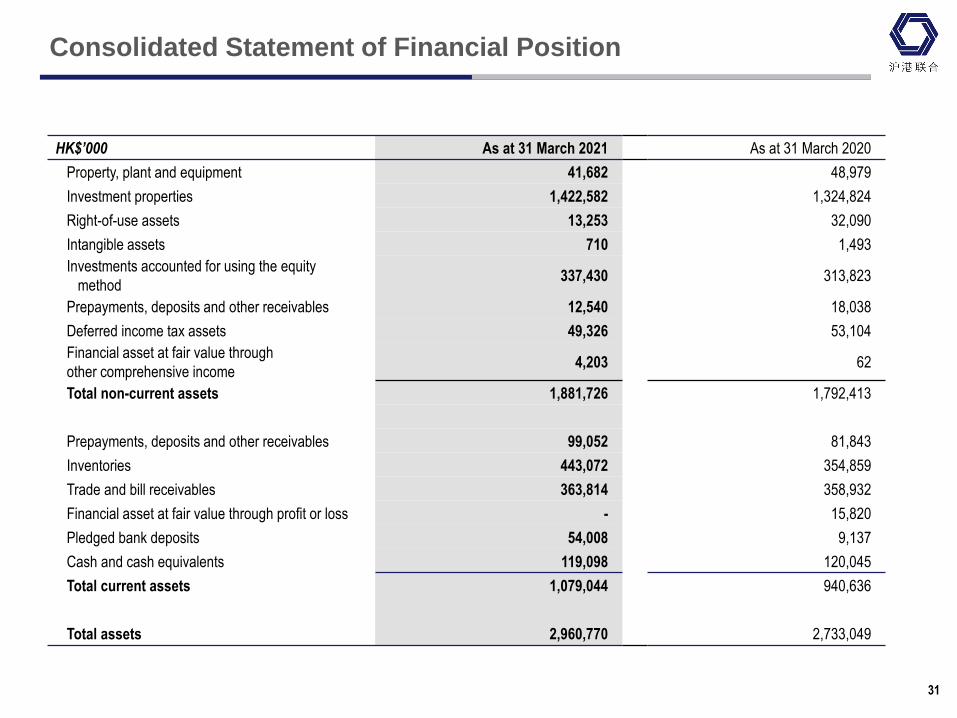
Consolidated Statement of Financial Position
31
HK$’000 As at 31 March 2021 As at 31 March 2020
Property, plant and equipment 41,682 48,979
Investment properties 1,422,582 1,324,824
Right-of-use assets 13,253 32,090
Intangible assets 710 1,493
Investments accounted for using the equity
method337,430 313,823
Prepayments, deposits and other receivables 12,540 18,038
Deferred income tax assets 49,326 53,104
Financial asset at fair value through
other comprehensive income4,203 62
Total non-current assets 1,881,726 1,792,413
Prepayments, deposits and other receivables 99,052 81,843
Inventories 443,072 354,859
Trade and bill receivables 363,814 358,932
Financial asset at fair value through profit or loss - 15,820
Pledged bank deposits 54,008 9,137
Cash and cash equivalents 119,098 120,045
Total current assets 1,079,044 940,636
Total assets 2,960,770 2,733,049

Consolidated Statement of Financial Position (cont.)
32
HK$’000 As at 31 March 2021 As at 31 March 2020
Trade and bill payables 245,354 166,929
Receipts in advance and deferred revenue 53,537 57,258
Accrued liabilities and other payables 39,220 37,183
Provisions 35,298 4,025
Derivative financial instruments 1,084 -
Current income tax liabilities 11,380 7,371
Borrowings 674,893 560,555
Lease liabilities 4,528 23,693
Total current liabilities 1,065,294 857,014
Accrued liabilities and other payables 11,147 11,144
Deferred income tax liabilities 94,081 89,541
Borrowings 779,749 855,083
Lease liabilities 1,991 3,499
Total non-current liabilities 886,968 959,267
Net assets 1,008,508 916,768
Equity
Equity attributable to owners of the Company
Share capital 64,123 64,123
Reserves 823,598 741,722
887,721 805,845
Non-controlling interests 120,787 110,923
Total equity 1,008,508 916,768

Thank You
DISCLAIMER
This document is confidential and may not be reproduced, redistributed or passed on, directly or indirectly, to any other person, or published, in
whole or in part, for any purpose without prior written approval from Hong Kong Shanghai Alliance Holdings Limited (“HKSHA”).
HKSHA and its subsidiaries (collectively the “Group”) make no representation or warranty (express or implied) as to the accuracy, reliability or
completeness of this document. The Group and its respective directors, employees, advisors, agents and consultants shall have no liability
(including liability to any person by reason of negligence or negligent misstatement) for any statements, opinions, information or matters
(expressed or implied) arising out of, or contained in or derived from, or for any omissions from this document, except liability under statute that
cannot be excluded.
This document may contain forward looking statements concerning the Group. Forward looking statements are not statements of historical fact
and actual events and results may differ materially from those described in the forward looking statements as a result of a variety of risk,
uncertainties, and other factors. Forward looking statements are based on management’s beliefs, opinions and estimates as of the dates the
forward looking statements are made and no obligation is assumed to update forward looking statements if these beliefs, opinions and estimates
should change or to reflect other future developments.
No representation or warranty (expressed or implied) is made by the Group or any of its respective directors, employees, advisors, agents or
consultants that any forecast, projections, intentions, expectations or plans set out in this document will be achieved, either totally or partially, or
that any particular rate of return will be achieved.
This document is not:
(I) an offer of securities for sale in Hong Kong or elsewhere; or
(II) an invitation to enter into an agreement to acquire, dispose of, subscribe for or underwrite securities; or related to the issue of any securities.


![[XLS] · Web viewInstrument list Symbol Code Description Exchange 00001:xhkg Cheung Kong (Holdings) Ltd Hong Kong Stock Exchange 00002:xhkg CLP Holdings Ltd Hong Kong Stock Exchange](https://img.pdfslide.us/doc/110x75/5aa315bc7f8b9a80378dd404/xls-viewinstrument-list-symbol-code-description-exchange-00001xhkg-cheung-kong.jpg)