Embed Size (px)
Citation preview
Hong Kong Non-Deal Roadshow Hong Kong, 4 March 2016
16 International Business Park
Content
CIT FY2015 Results
Executive Summary
Financial Summary
Real Estate Highlights
Financial & Capital Management Highlights
Singapore Industrial Real Estate - Sector Overview
Appendix
2
CIT FY2015 ResultsCambridge Industrial Trust
FY2015 Results Overview
4
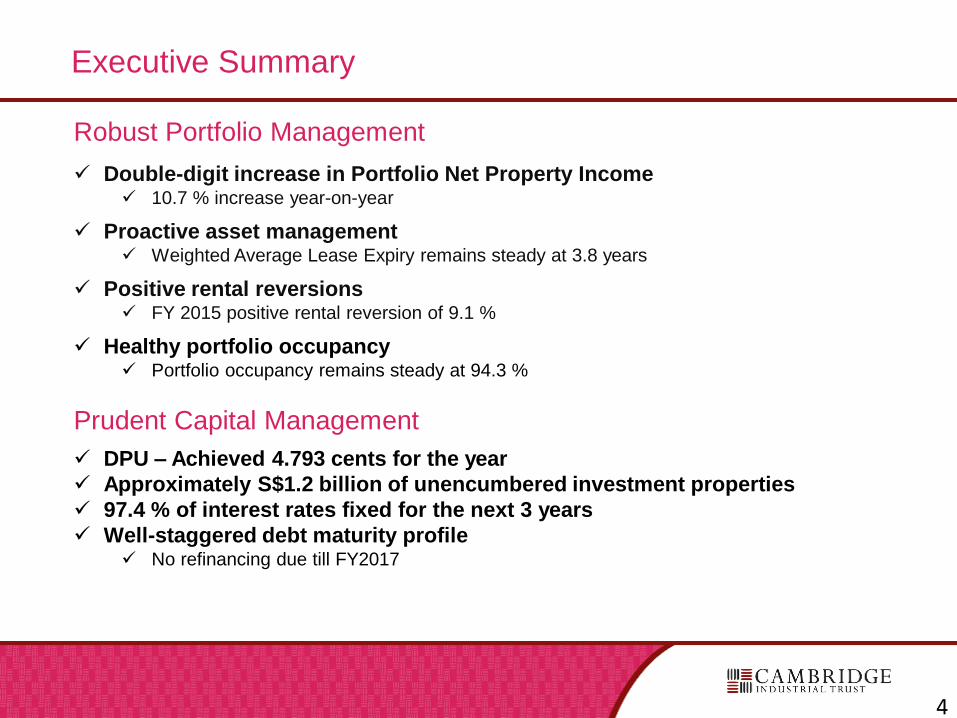
Executive Summary
Robust Portfolio Management
Double-digit increase in Portfolio Net Property Income 10.7 % increase year-on-year
Proactive asset management Weighted Average Lease Expiry remains steady at 3.8 years
Positive rental reversions FY 2015 positive rental reversion of 9.1 %
Healthy portfolio occupancy Portfolio occupancy remains steady at 94.3 %
Prudent Capital Management
DPU – Achieved 4.793 cents for the year
Approximately S$1.2 billion of unencumbered investment properties
97.4 % of interest rates fixed for the next 3 years
Well-staggered debt maturity profile No refinancing due till FY2017
4
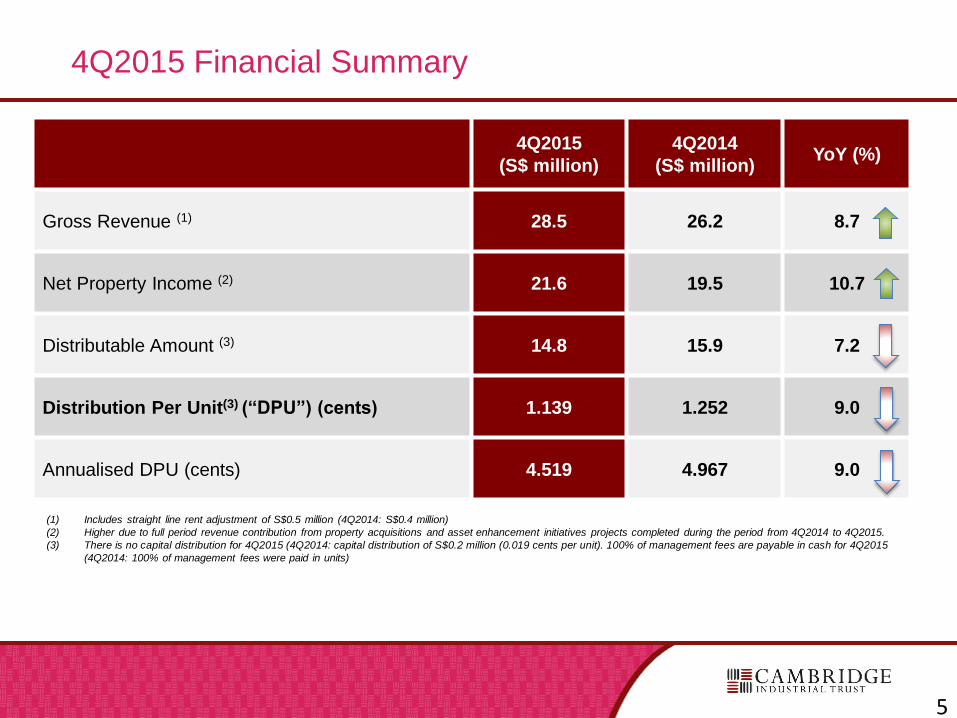
4Q2015 Financial Summary
4Q2015
(S$ million)
4Q2014
(S$ million)YoY (%)
Gross Revenue (1) 28.5 26.2 8.7
Net Property Income (2) 21.6 19.5 10.7
Distributable Amount (3) 14.8 15.9 7.2
Distribution Per Unit(3) (“DPU”) (cents) 1.139 1.252 9.0
Annualised DPU (cents) 4.519 4.967 9.0
(1) Includes straight line rent adjustment of S$0.5 million (4Q2014: S$0.4 million)
(2) Higher due to full period revenue contribution from property acquisitions and asset enhancement initiatives projects completed during the period from 4Q2014 to 4Q2015.
(3) There is no capital distribution for 4Q2015 (4Q2014: capital distribution of S$0.2 million (0.019 cents per unit). 100% of management fees are payable in cash for 4Q2015
(4Q2014: 100% of management fees were paid in units)
5
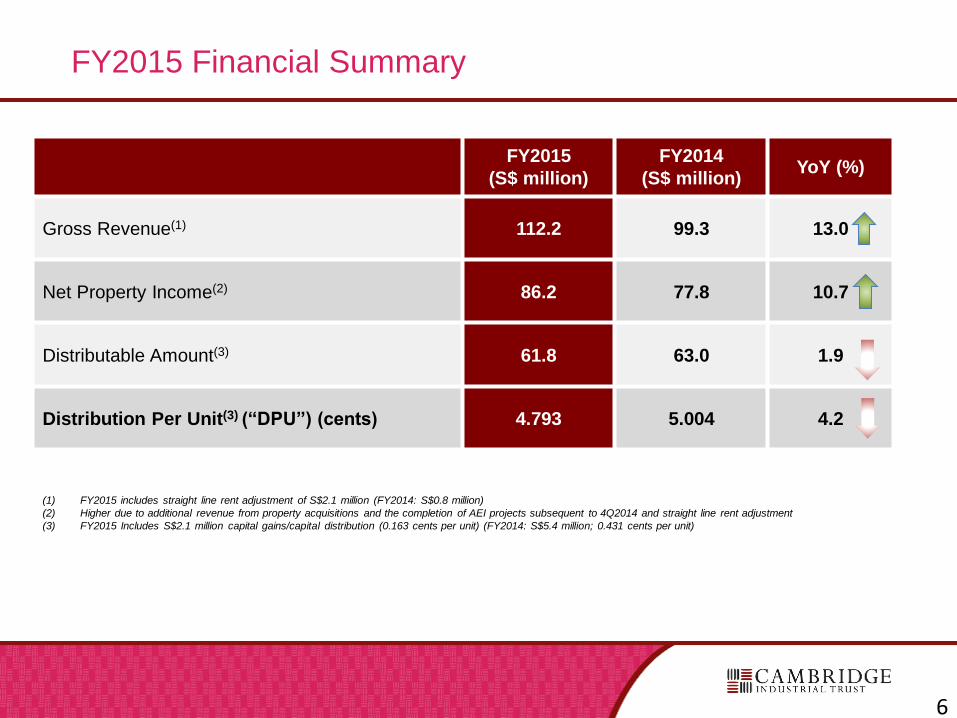
FY2015 Financial Summary
FY2015
(S$ million)
FY2014
(S$ million)YoY (%)
Gross Revenue(1) 112.2 99.3 13.0
Net Property Income(2) 86.2 77.8 10.7
Distributable Amount(3) 61.8 63.0 1.9
Distribution Per Unit(3) (“DPU”) (cents) 4.793 5.004 4.2
(1) FY2015 includes straight line rent adjustment of S$2.1 million (FY2014: S$0.8 million)
(2) Higher due to additional revenue from property acquisitions and the completion of AEI projects subsequent to 4Q2014 and straight line rent adjustment
(3) FY2015 Includes S$2.1 million capital gains/capital distribution (0.163 cents per unit) (FY2014: S$5.4 million; 0.431 cents per unit)
6
7
Real Estate Highlights
3 Pioneer Sector 3
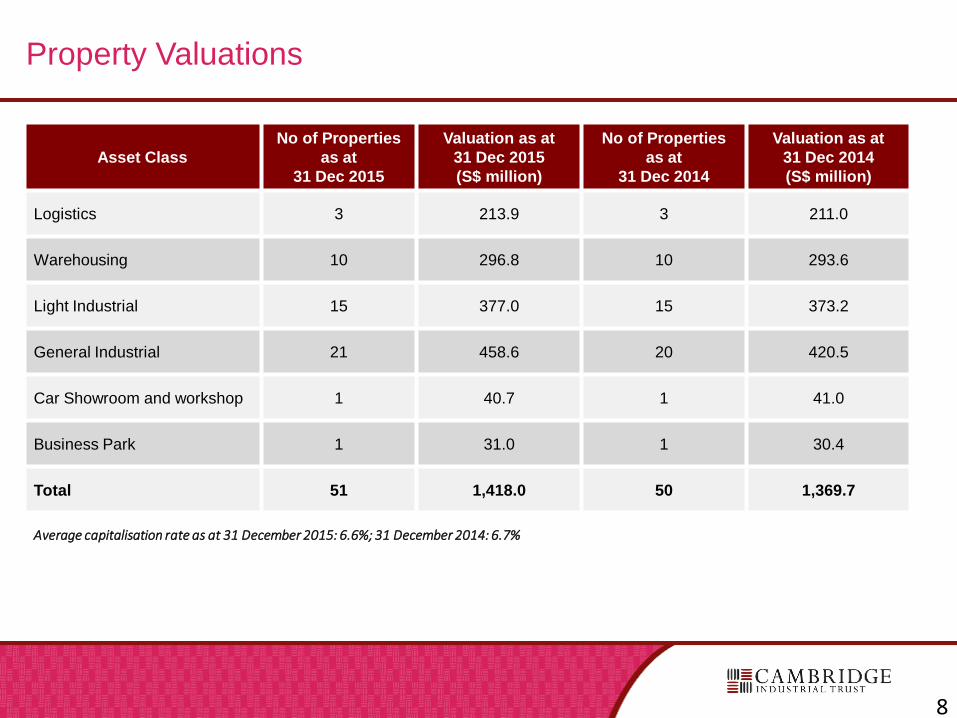
Property Valuations
Asset Class
No of Properties
as at
31 Dec 2015
Valuation as at
31 Dec 2015
(S$ million)
No of Properties
as at
31 Dec 2014
Valuation as at
31 Dec 2014
(S$ million)
Logistics 3 213.9 3 211.0
Warehousing 10 296.8 10 293.6
Light Industrial 15 377.0 15 373.2
General Industrial 21 458.6 20 420.5
Car Showroom and workshop 1 40.7 1 41.0
Business Park 1 31.0 1 30.4
Total 51 1,418.0 50 1,369.7
Average capitalisation rate as at 31 December 2015: 6.6%; 31 December 2014: 6.7%
8
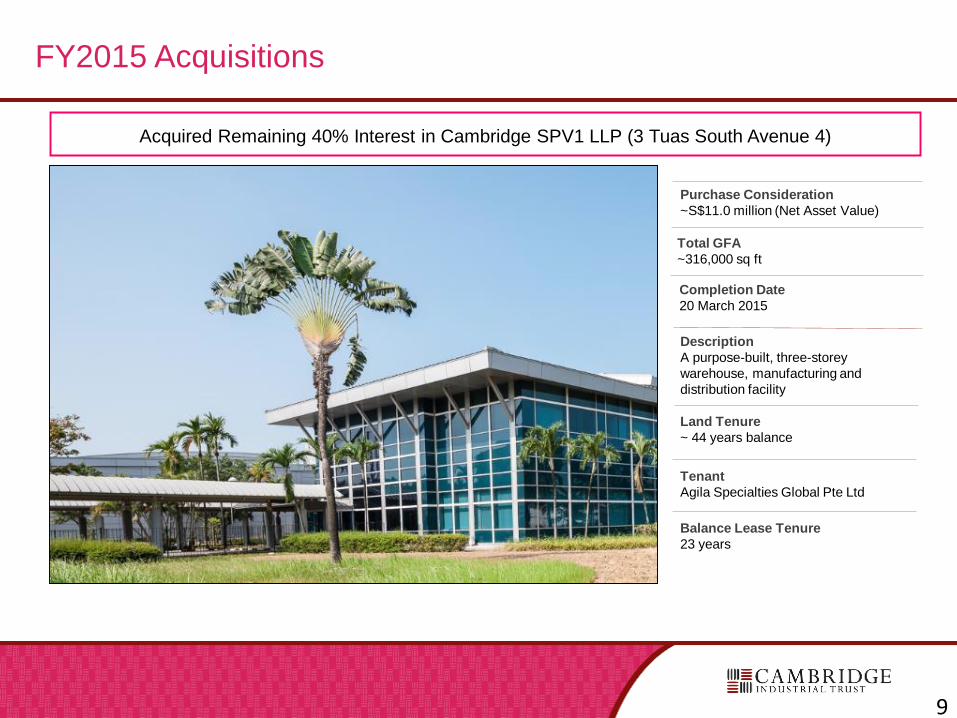
Description
A purpose-built, three-storey
warehouse, manufacturing and
distribution facility
Total GFA
~316,000 sq ft
Purchase Consideration
~S$11.0 million (Net Asset Value)
Tenant
Agila Specialties Global Pte Ltd
Completion Date
20 March 2015
FY2015 Acquisitions
Acquired Remaining 40% Interest in Cambridge SPV1 LLP (3 Tuas South Avenue 4)
Land Tenure
~ 44 years balance
Balance Lease Tenure
23 years
9
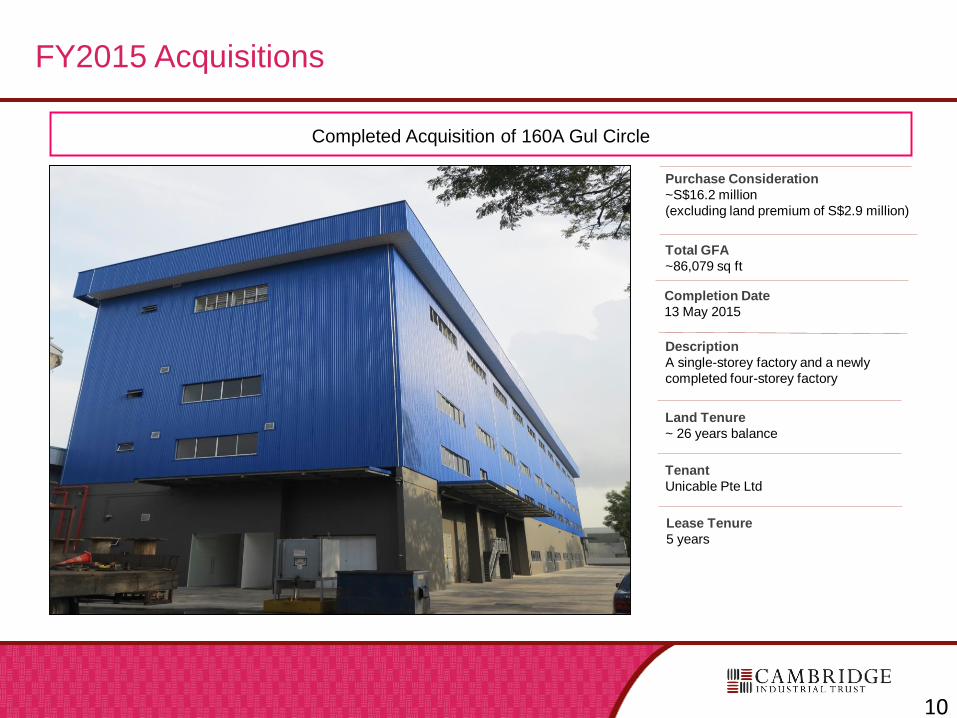
Description
A single-storey factory and a newly
completed four-storey factory
Total GFA
~86,079 sq ft
Purchase Consideration
~S$16.2 million
(excluding land premium of S$2.9 million)
Tenant
Unicable Pte Ltd
Completion Date
13 May 2015
Completed Acquisition of 160A Gul Circle
Land Tenure
~ 26 years balance
Lease Tenure
5 years
FY2015 Acquisitions
10
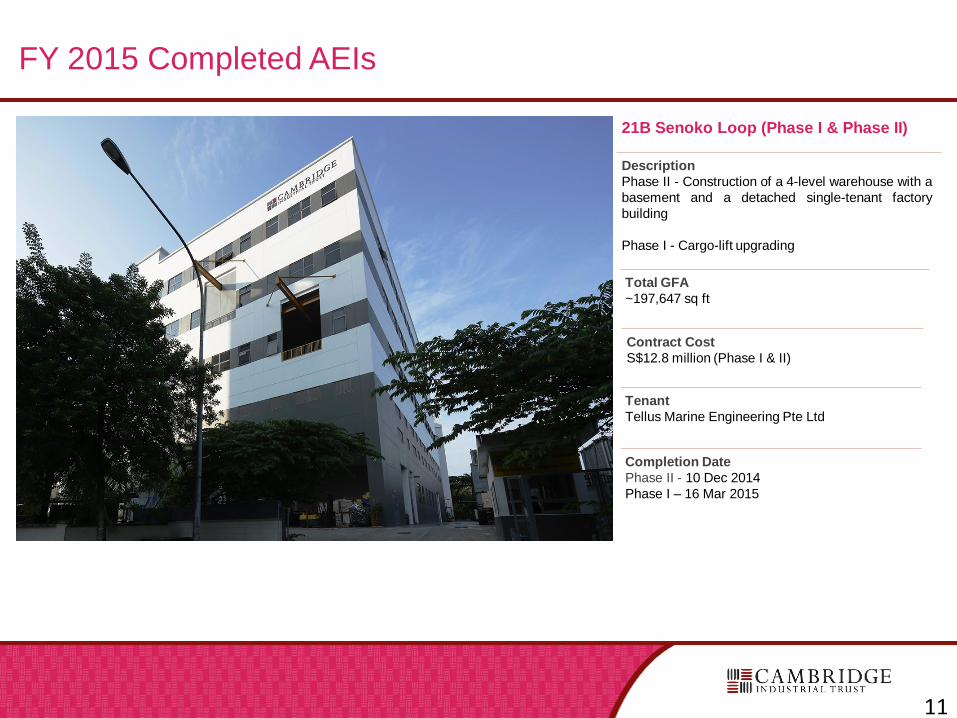
21B Senoko Loop (Phase I & Phase II)
Description
Phase II - Construction of a 4-level warehouse with a
basement and a detached single-tenant factory
building
Phase I - Cargo-lift upgrading
Total GFA
~197,647 sq ft
Contract Cost
S$12.8 million (Phase I & II)
Tenant
Tellus Marine Engineering Pte Ltd
Completion Date
Phase II - 10 Dec 2014
Phase I – 16 Mar 2015
FY 2015 Completed AEIs
11
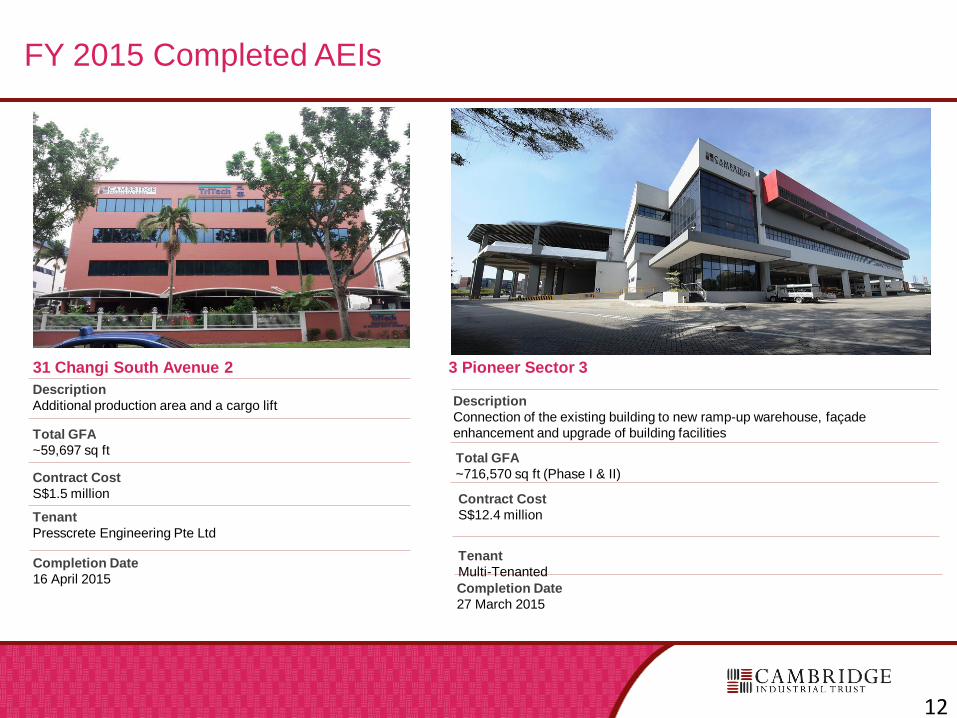
31 Changi South Avenue 2
Description
Additional production area and a cargo lift
Total GFA
~59,697 sq ft
Contract Cost
S$1.5 million
Tenant
Presscrete Engineering Pte Ltd
Completion Date
16 April 2015
FY 2015 Completed AEIs
3 Pioneer Sector 3
Description
Connection of the existing building to new ramp-up warehouse, façade
enhancement and upgrade of building facilities
Total GFA
~716,570 sq ft (Phase I & II)
Contract Cost
S$12.4 million
Completion Date
27 March 2015
Tenant
Multi-Tenanted
12
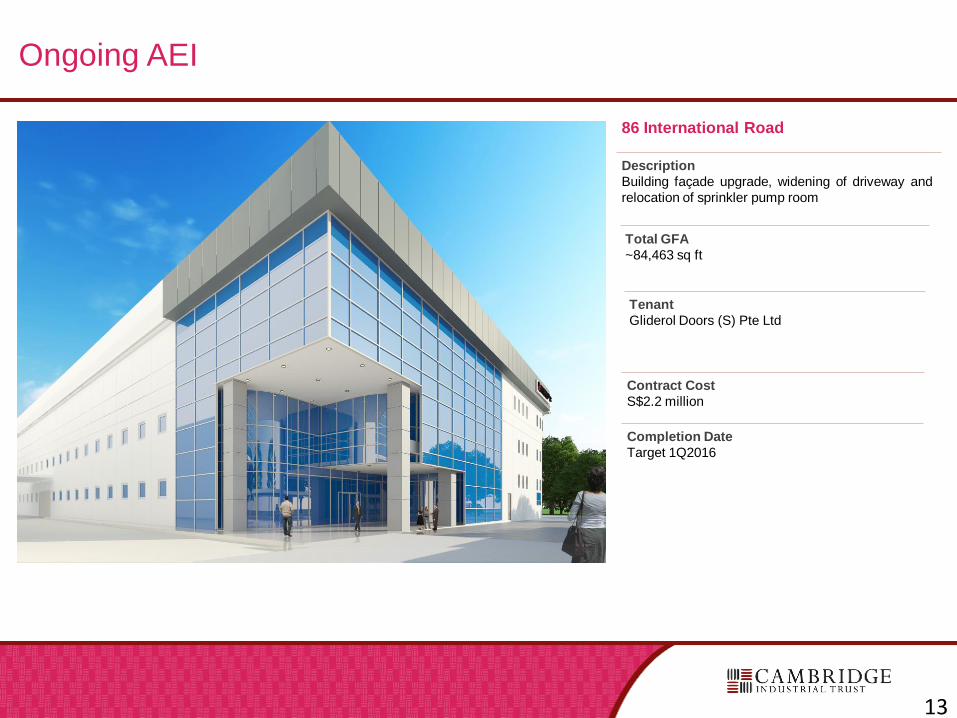
86 International Road
Description
Building façade upgrade, widening of driveway and
relocation of sprinkler pump room
Total GFA
~84,463 sq ft
Contract Cost
S$2.2 million
Tenant
Gliderol Doors (S) Pte Ltd
Completion Date
Target 1Q2016
Ongoing AEI
13
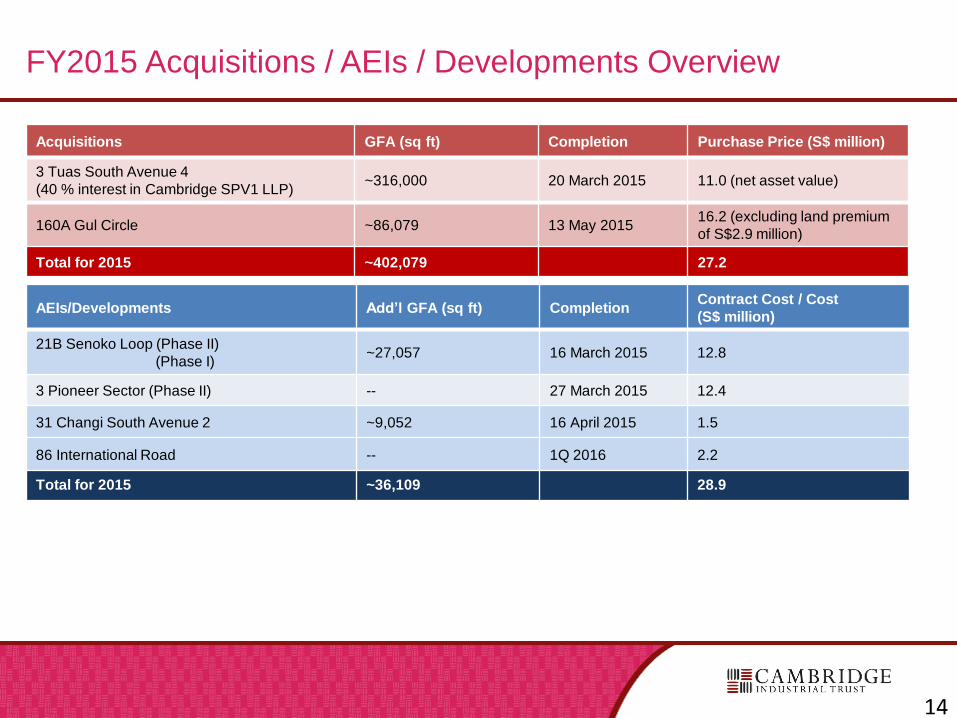
FY2015 Acquisitions / AEIs / Developments Overview
Acquisitions GFA (sq ft) Completion Purchase Price (S$ million)
3 Tuas South Avenue 4
(40 % interest in Cambridge SPV1 LLP)~316,000 20 March 2015 11.0 (net asset value)
160A Gul Circle ~86,079 13 May 201516.2 (excluding land premium
of S$2.9 million)
Total for 2015 ~402,079 27.2
AEIs/Developments Add’l GFA (sq ft) CompletionContract Cost / Cost
(S$ million)
21B Senoko Loop (Phase II)
(Phase I)~27,057 16 March 2015 12.8
3 Pioneer Sector (Phase II) -- 27 March 2015 12.4
31 Changi South Avenue 2 ~9,052 16 April 2015 1.5
86 International Road -- 1Q 2016 2.2
Total for 2015 ~36,109 28.9
14
Financial and Capital Management Highlights
511/513 Yishun Industrial Park A
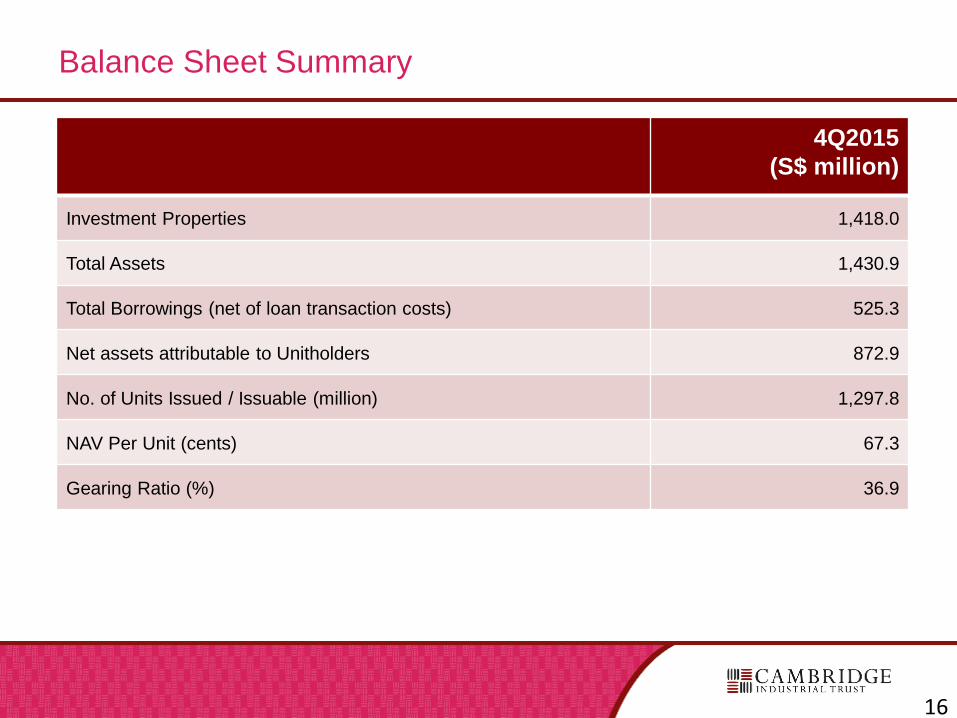
Balance Sheet Summary
4Q2015
(S$ million)
Investment Properties 1,418.0
Total Assets 1,430.9
Total Borrowings (net of loan transaction costs) 525.3
Net assets attributable to Unitholders 872.9
No. of Units Issued / Issuable (million) 1,297.8
NAV Per Unit (cents) 67.3
Gearing Ratio (%) 36.9
16
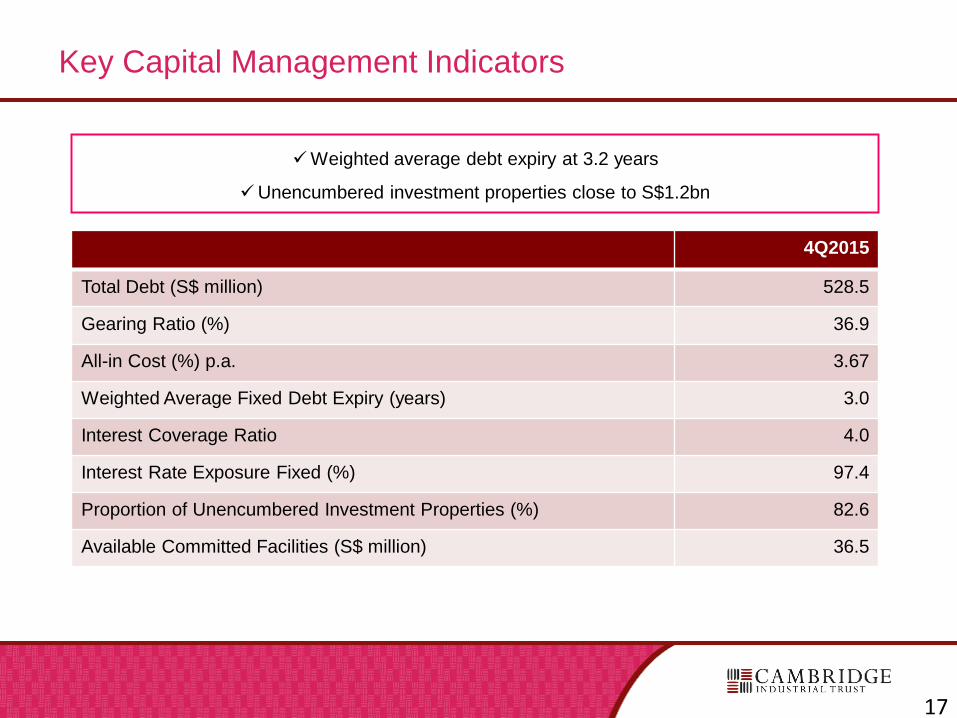
Key Capital Management Indicators
Weighted average debt expiry at 3.2 years
Unencumbered investment properties close to S$1.2bn
4Q2015
Total Debt (S$ million) 528.5
Gearing Ratio (%) 36.9
All-in Cost (%) p.a. 3.67
Weighted Average Fixed Debt Expiry (years) 3.0
Interest Coverage Ratio 4.0
Interest Rate Exposure Fixed (%) 97.4
Proportion of Unencumbered Investment Properties (%) 82.6
Available Committed Facilities (S$ million) 36.5
17
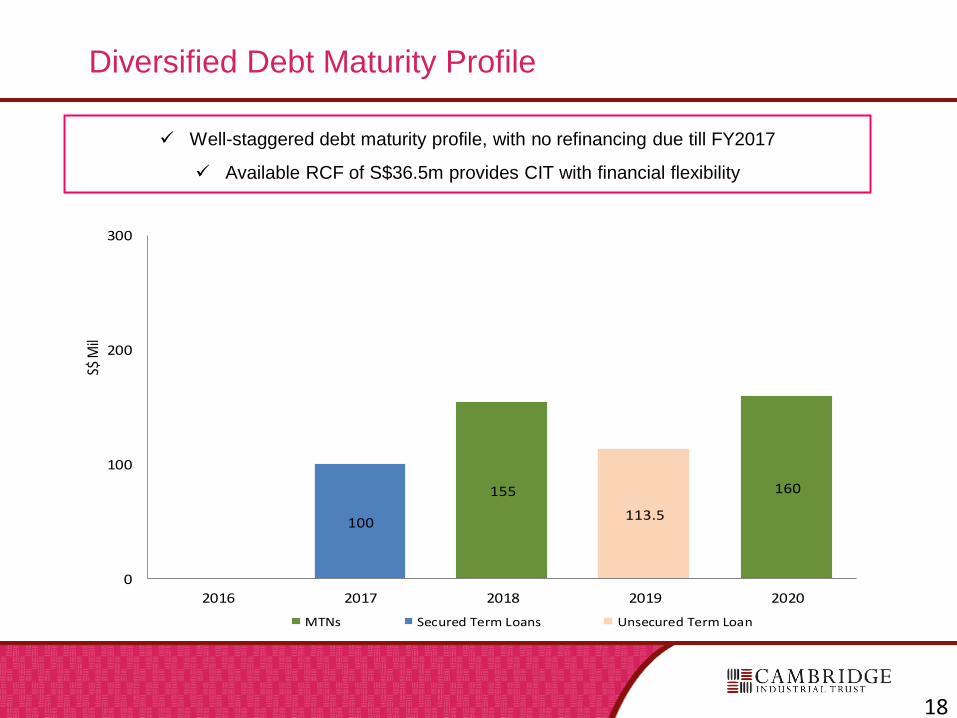
Diversified Debt Maturity Profile
Well-staggered debt maturity profile, with no refinancing due till FY2017
Available RCF of S$36.5m provides CIT with financial flexibility
155 160
100113.5
0
100
200
300
2016 2017 2018 2019 2020
S$ M
il
MTNs Secured Term Loans Unsecured Term Loan
18
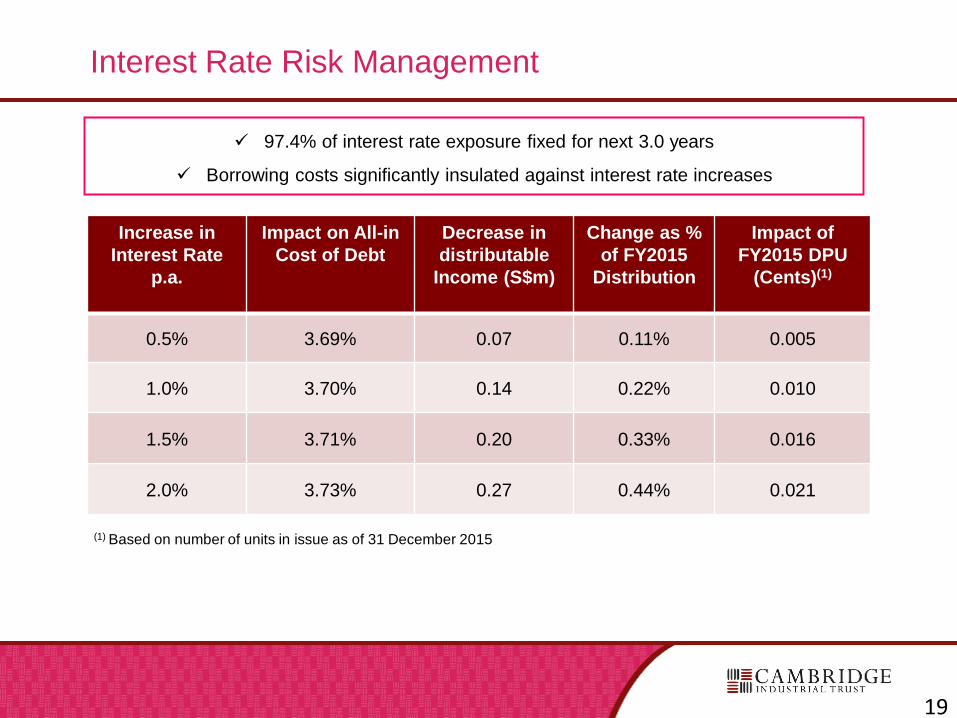
Interest Rate Risk Management
Increase in
Interest Rate
p.a.
Impact on All-in
Cost of Debt
Decrease in
distributable
Income (S$m)
Change as %
of FY2015
Distribution
Impact of
FY2015 DPU
(Cents)(1)
0.5% 3.69% 0.07 0.11% 0.005
1.0% 3.70% 0.14 0.22% 0.010
1.5% 3.71% 0.20 0.33% 0.016
2.0% 3.73% 0.27 0.44% 0.021
97.4% of interest rate exposure fixed for next 3.0 years
Borrowing costs significantly insulated against interest rate increases
(1) Based on number of units in issue as of 31 December 2015
19
FY2015 Capital Management Activities Summary
• In January, completed a S$55m secondary issuance of MTN Series 003. The issuance was 1.4x
subscribed and institutional investors took 99% of the issuance.
• In May, S&P assigned “BBB-“ investment grade rating on CIT’s MTN programme and all its
outstanding MTN series.
• In May, priced S$130 million 5-year MTN @ 3.95%. Issuance was more than 2x subscribed and
institutional investors took 91% of the issuance.
• In June, completed the refinancing of the S$250m Club Loan Facility, using the using proceeds
from MTN and a new unsecured bilateral loan facility.
• In November, CITM is recognised as the Highly Commended Winner for Best Financing Solution at
the Adam Smith Asia Awards 2015, organised by Treasury Today Asia
• FY2015 average DRP take-up rate was 24 %, reflecting continued support from Unitholders.
20
Singapore Industrial Real Estate
Sector Overview
Macro-Economic Outlook
22
Economic Performance in 2015
Singapore economy grew modestly by 2.1% in 2015
Inflation declined 0.5%
Global economy was buoyed by stronger-than-expected economic
growth in the US.
On the other hand, Eurozone’s economy remained lacklustre together
with a slowdown in China’s economy.
Economic Outlook for 2016
MTI expects Singapore’s economy to grow by 1.0% to 3.0%
Economic growth is expected to come from domestically-oriented sectors
such as business services sector
Inflation is expected to stay between -0.5% to 0.5%
Subdued global economic conditions and prolonged weakness in commodity
prices are expected to continue to weigh on the manufacturing sectorSource: DTZ Consulting and Research, February 2016
23
Factory Property Market
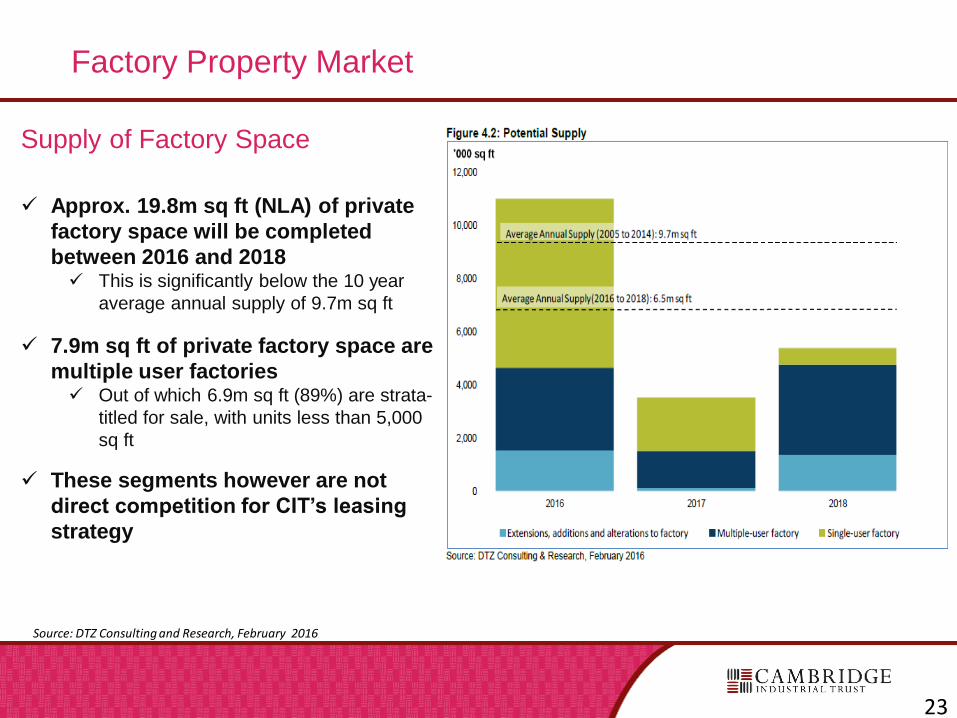
Supply of Factory Space
Approx. 19.8m sq ft (NLA) of private
factory space will be completed
between 2016 and 2018 This is significantly below the 10 year
average annual supply of 9.7m sq ft
7.9m sq ft of private factory space are
multiple user factories Out of which 6.9m sq ft (89%) are strata-
titled for sale, with units less than 5,000
sq ft
These segments however are not
direct competition for CIT’s leasing
strategy
Source: DTZ Consulting and Research, February 2016
24
Warehouse Property Market
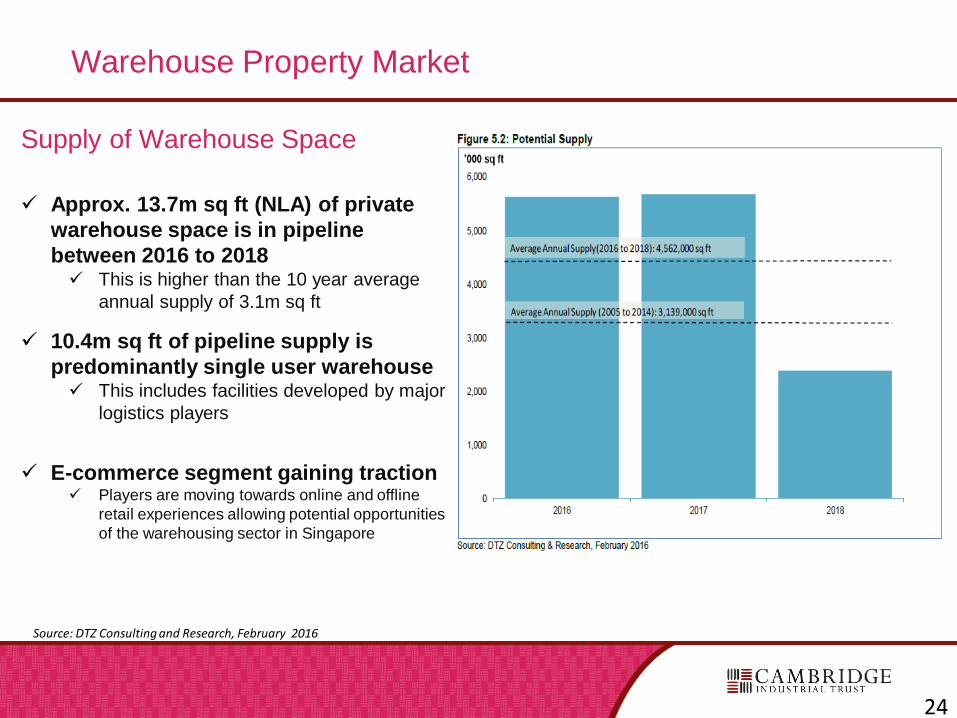
Supply of Warehouse Space
Approx. 13.7m sq ft (NLA) of private
warehouse space is in pipeline
between 2016 to 2018 This is higher than the 10 year average
annual supply of 3.1m sq ft
10.4m sq ft of pipeline supply is
predominantly single user warehouse This includes facilities developed by major
logistics players
E-commerce segment gaining traction Players are moving towards online and offline
retail experiences allowing potential opportunities
of the warehousing sector in Singapore
Source: DTZ Consulting and Research, February 2016
25
Appendix
3 Pioneer Sector 3
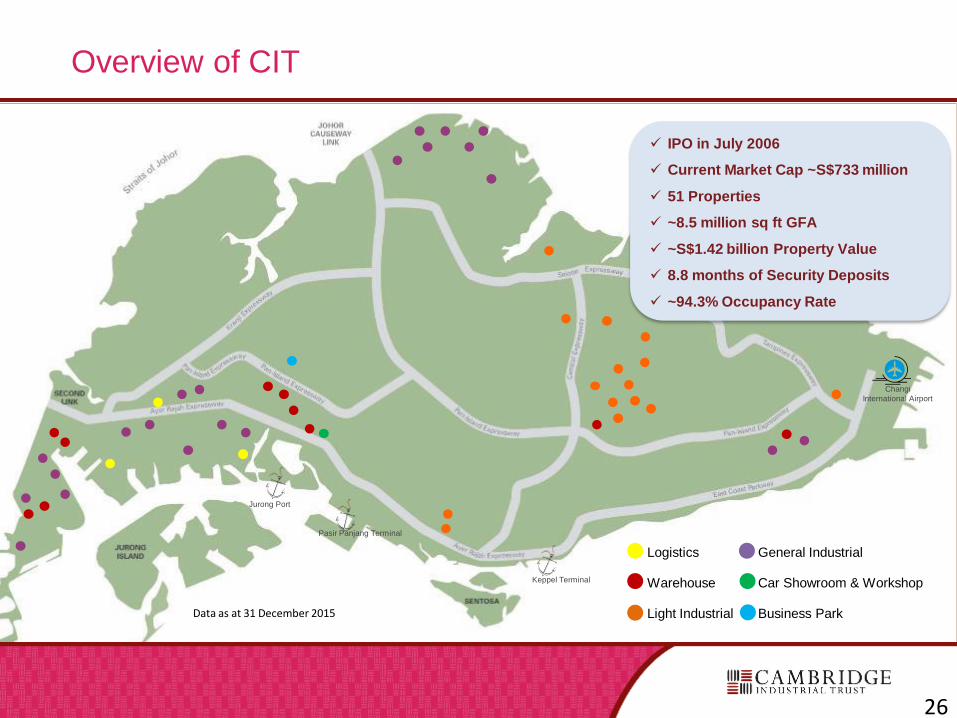
Logistics General Industrial
Warehouse Car Showroom & Workshop
Light Industrial Business Park
Overview of CIT
Jurong Port
Pasir Panjang Terminal
Keppel Terminal
Changi
International Airport
Data as at 31 December 2015
IPO in July 2006
Current Market Cap ~S$733 million
51 Properties
~8.5 million sq ft GFA
~S$1.42 billion Property Value
8.8 months of Security Deposits
~94.3% Occupancy Rate
26
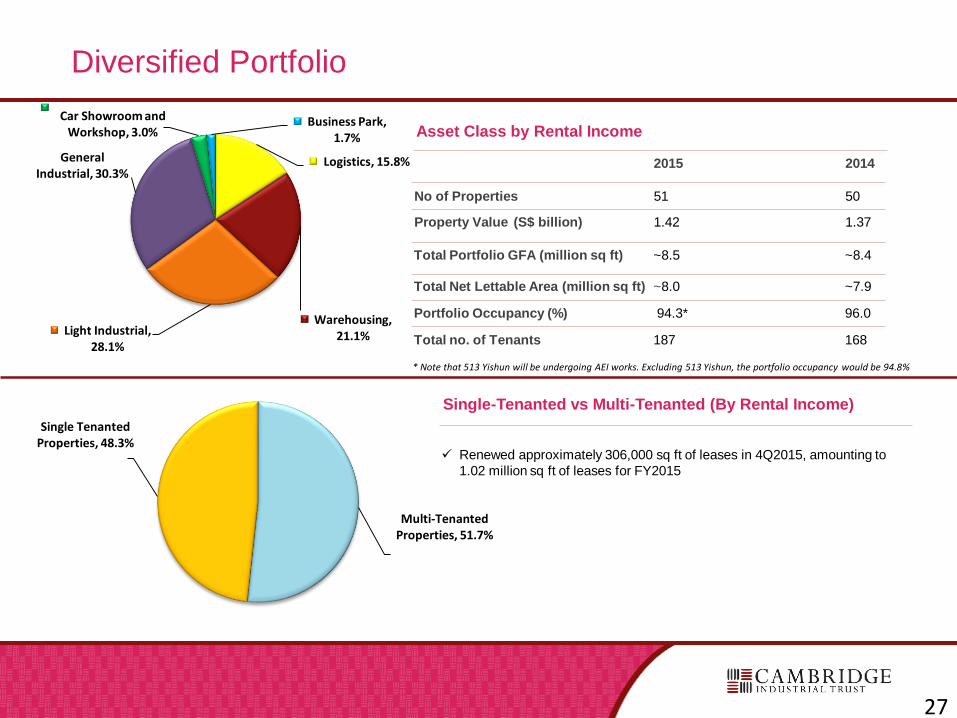
Diversified Portfolio
Asset Class by Rental Income
No of Properties 51 50
Property Value (S$ billion) 1.42 1.37
Total Portfolio GFA (million sq ft) ~8.5 ~8.4
Total Net Lettable Area (million sq ft) ~8.0 ~7.9
Portfolio Occupancy (%) 94.3* 96.0
Total no. of Tenants 187 168
Single-Tenanted vs Multi-Tenanted (By Rental Income)
Renewed approximately 306,000 sq ft of leases in 4Q2015, amounting to
1.02 million sq ft of leases for FY2015
2015 2014Logistics, 15.8%
Warehousing, 21.1%Light Industrial,
28.1%
General Industrial, 30.3%
Car Showroom and Workshop, 3.0%
Business Park, 1.7%
Multi-Tenanted Properties, 51.7%
Single Tenanted Properties, 48.3%
* Note that 513 Yishun will be undergoing AEI works. Excluding 513 Yishun, the portfolio occupancy would be 94.8%
27
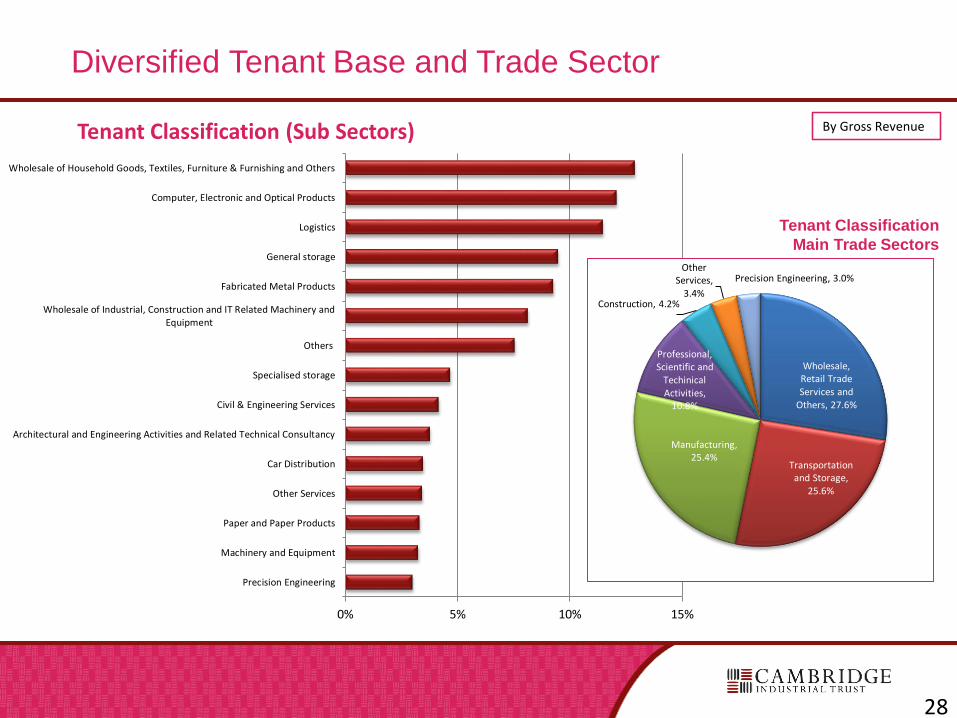
Diversified Tenant Base and Trade Sector
Tenant Classification
Main Trade Sectors
Wholesale of Household Goods, Textiles, Furniture & Furnishing and Others
Computer, Electronic and Optical Products
Logistics
General storage
Fabricated Metal Products
Wholesale of Industrial, Construction and IT Related Machinery andEquipment
Others
Specialised storage
Civil & Engineering Services
Architectural and Engineering Activities and Related Technical Consultancy
Car Distribution
Other Services
Paper and Paper Products
Machinery and Equipment
Precision Engineering
0% 5% 10% 15%
Tenant Classification (Sub Sectors)
Wholesale, Retail Trade Services and
Others, 27.6%
Transportation and Storage,
25.6%
Manufacturing, 25.4%
Professional, Scientific and
Techinical Activities,
10.8%
Construction, 4.2%
Other Services,
3.4%
Precision Engineering, 3.0%
28
By Gross Revenue
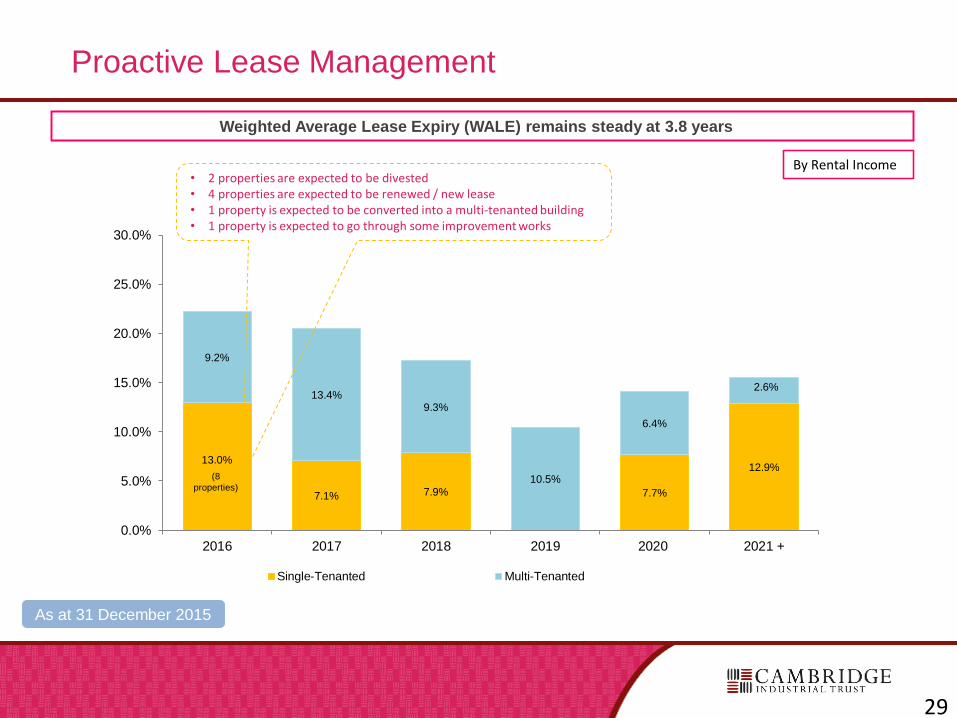
Proactive Lease Management
As at 31 December 2015
Weighted Average Lease Expiry (WALE) remains steady at 3.8 years
29
By Rental Income
13.0%
7.1% 7.9% 7.7%
12.9%
9.2%
13.4%9.3%
10.5%
6.4%
2.6%
0.0%
5.0%
10.0%
15.0%
20.0%
25.0%
30.0%
2016 2017 2018 2019 2020 2021 +
Single-Tenanted Multi-Tenanted
(8
properties)
• 2 properties are expected to be divested• 4 properties are expected to be renewed / new lease • 1 property is expected to be converted into a multi-tenanted building• 1 property is expected to go through some improvement works
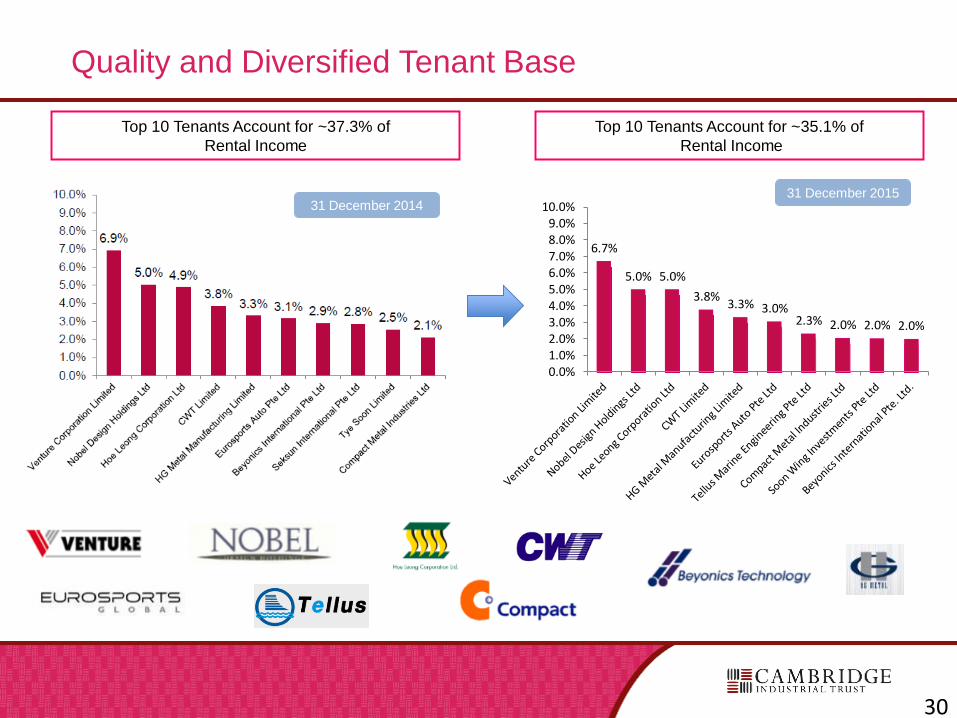
Quality and Diversified Tenant Base
Top 10 Tenants Account for ~35.1% of
Rental Income
Top 10 Tenants Account for ~37.3% of
Rental Income
31 December 2015
6.7%
5.0% 5.0%
3.8%3.3% 3.0%
2.3% 2.0% 2.0% 2.0%
0.0%1.0%2.0%3.0%4.0%5.0%6.0%7.0%8.0%9.0%
10.0%
30
31 December 2014
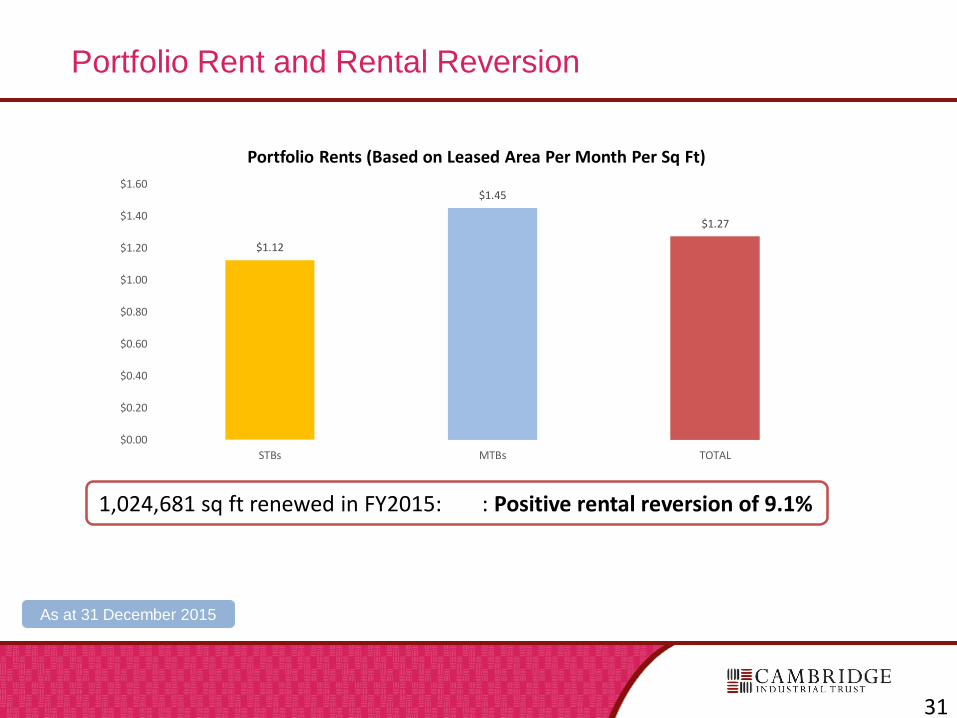
Portfolio Rent and Rental Reversion
31
1,024,681 sq ft renewed in FY2015: : Positive rental reversion of 9.1%
$1.12
$1.45
$1.27
$0.00
$0.20
$0.40
$0.60
$0.80
$1.00
$1.20
$1.40
$1.60
STBs MTBs TOTAL
Portfolio Rents (Based on Leased Area Per Month Per Sq Ft)
As at 31 December 2015
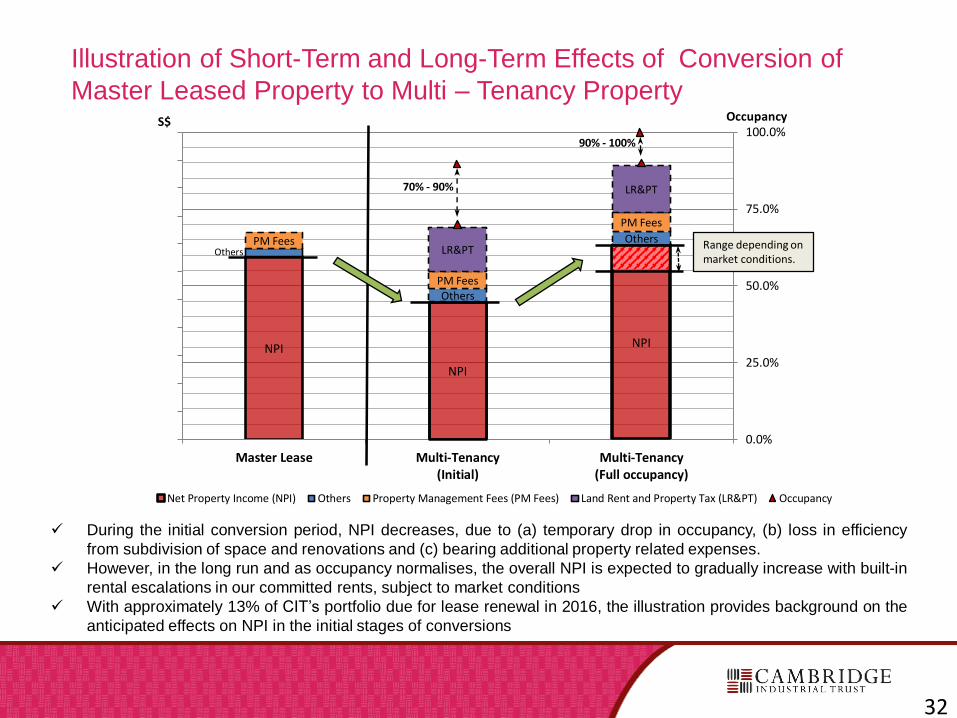
Illustration of Short-Term and Long-Term Effects of Conversion of
Master Leased Property to Multi – Tenancy Property
During the initial conversion period, NPI decreases, due to (a) temporary drop in occupancy, (b) loss in efficiency
from subdivision of space and renovations and (c) bearing additional property related expenses.
However, in the long run and as occupancy normalises, the overall NPI is expected to gradually increase with built-in
rental escalations in our committed rents, subject to market conditions
With approximately 13% of CIT’s portfolio due for lease renewal in 2016, the illustration provides background on the
anticipated effects on NPI in the initial stages of conversions
32
NPI
NPI
NPI
Others
Others
OthersPM Fees
PM Fees
PM Fees
LR&PT
LR&PT
0.0%
25.0%
50.0%
75.0%
100.0%
Master Lease Multi-Tenancy(Initial)
Multi-Tenancy(Full occupancy)
OccupancyS$
Net Property Income (NPI) Others Property Management Fees (PM Fees) Land Rent and Property Tax (LR&PT) Occupancy
Range depending on market conditions.
70% - 90%
90% - 100%
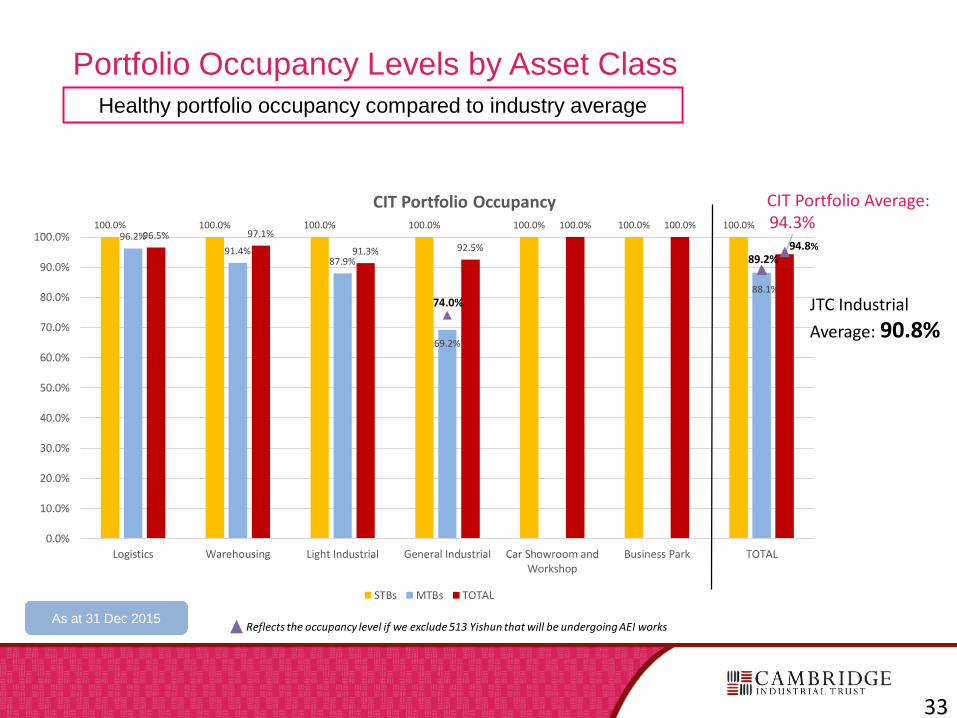
Portfolio Occupancy Levels by Asset Class
Healthy portfolio occupancy compared to industry average
As at 31 Dec 2015Reflects the occupancy level if we exclude 513 Yishun that will be undergoing AEI works
100.0% 100.0% 100.0% 100.0% 100.0% 100.0% 100.0%96.2%
91.4%87.9%
69.2%
88.1%
96.5% 97.1%
91.3% 92.5%
100.0% 100.0% 94.3%
74.0%
89.2%
0.0%
10.0%
20.0%
30.0%
40.0%
50.0%
60.0%
70.0%
80.0%
90.0%
100.0%
Logistics Warehousing Light Industrial General Industrial Car Showroom andWorkshop
Business Park TOTAL
CIT Portfolio Occupancy
STBs MTBs TOTAL
94.8%
CIT Portfolio Average:
JTC Industrial
Average: 90.8%
33
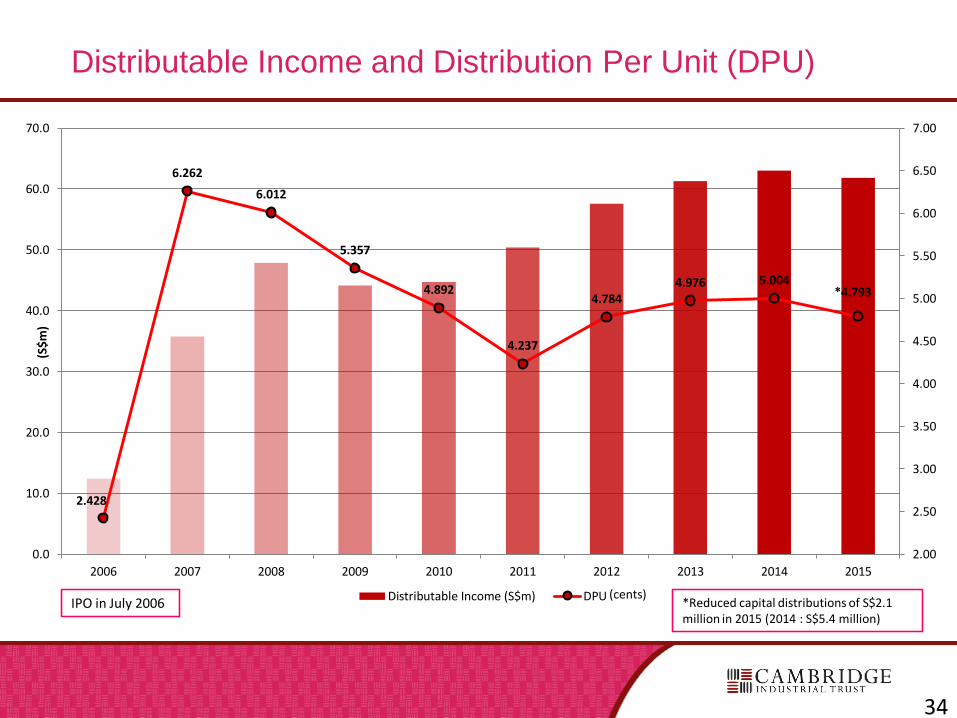
Distributable Income and Distribution Per Unit (DPU)
34
IPO in July 2006
2.428
6.262
6.012
5.357
4.892
4.237
4.7844.976 5.004
2.00
2.50
3.00
3.50
4.00
4.50
5.00
5.50
6.00
6.50
7.00
0.0
10.0
20.0
30.0
40.0
50.0
60.0
70.0
2006 2007 2008 2009 2010 2011 2012 2013 2014 2015
(S$
m)
Distributable Income (S$m) DPU
*4.793
*Reduced capital distributions of S$2.1 million in 2015 (2014 : S$5.4 million)
(cents)
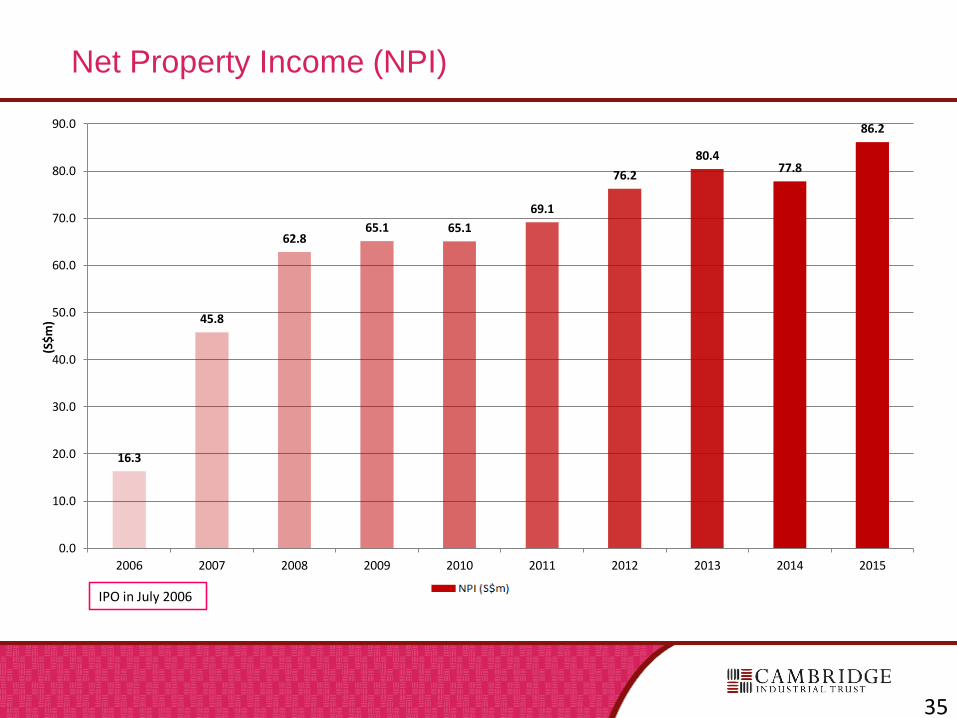
Net Property Income (NPI)
35
IPO in July 2006
16.3
45.8
62.865.1 65.1
69.1
76.2
80.477.8
86.2
0.0
10.0
20.0
30.0
40.0
50.0
60.0
70.0
80.0
90.0
2006 2007 2008 2009 2010 2011 2012 2013 2014 2015
(S$
m)
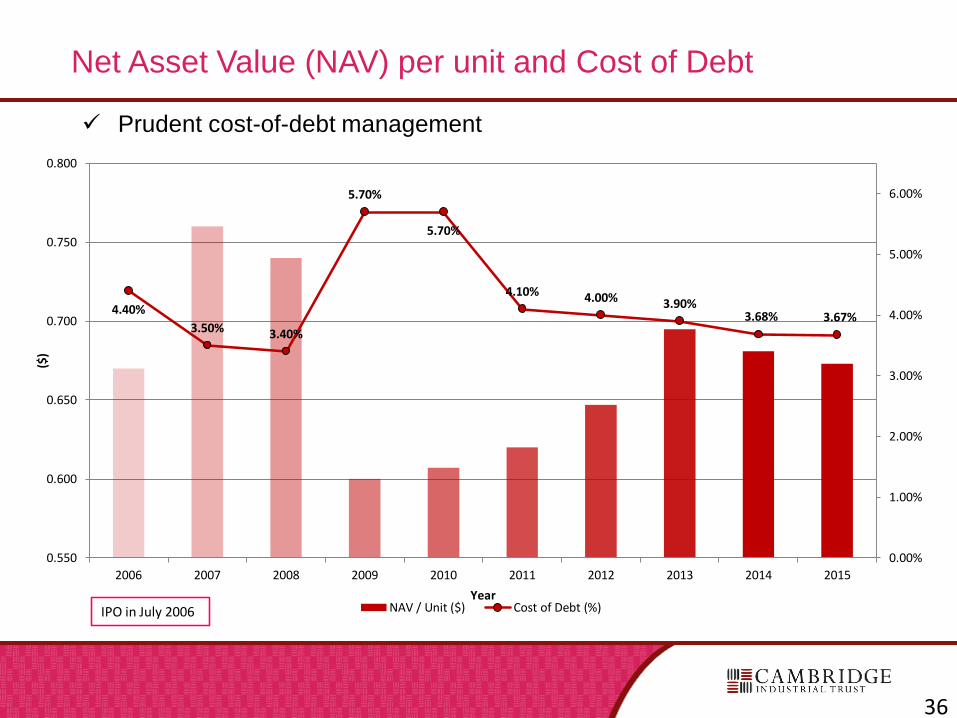
Net Asset Value (NAV) per unit and Cost of Debt
Prudent cost-of-debt management
36
4.40%
3.50% 3.40%
5.70%
5.70%
4.10% 4.00% 3.90%3.68% 3.67%
0.00%
1.00%
2.00%
3.00%
4.00%
5.00%
6.00%
0.550
0.600
0.650
0.700
0.750
0.800
2006 2007 2008 2009 2010 2011 2012 2013 2014 2015
($)
YearNAV / Unit ($) Cost of Debt (%)IPO in July 2006
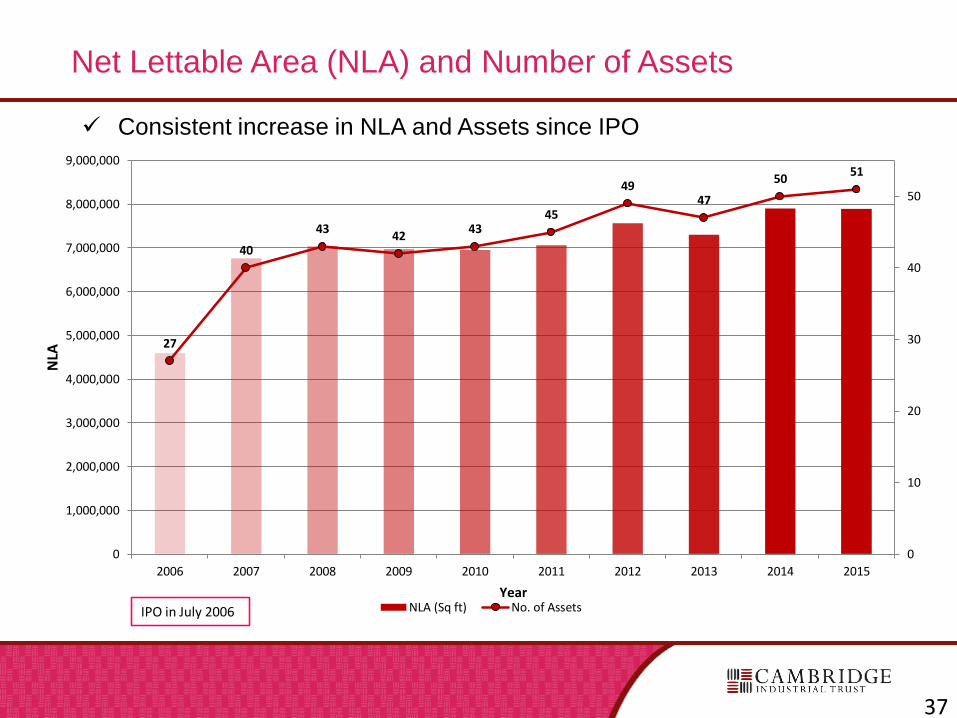
Net Lettable Area (NLA) and Number of Assets
Consistent increase in NLA and Assets since IPO
37
27
40
4342
4345
4947
5051
0
10
20
30
40
50
0
1,000,000
2,000,000
3,000,000
4,000,000
5,000,000
6,000,000
7,000,000
8,000,000
9,000,000
2006 2007 2008 2009 2010 2011 2012 2013 2014 2015
NLA
YearNLA (Sq ft) No. of AssetsIPO in July 2006
Important Notice
This material shall be read in conjunction with CIT’s results announcements for the financial period ended 31 December 2015.
The value of units in CIT (“Units”) and the income derived from them may fall as well as rise. Units are not investments or deposits in, or
liabilities or obligations of, Cambridge Industrial Trust Management Limited ("Manager"), RBC Investor Services Trust Singapore Limited
(in its capacity as trustee of CIT) ("Trustee"), or any of their respective related corporations and affiliates (including but not limited to
National Australia Bank Limited, nabInvest Capital Partners Pty Ltd, or other members of the National Australia Bank group) and their
affiliates (individually and collectively "Affiliates"). An investment in Units is subject to equity investment risk, including the possible
delays in repayment and loss of income or the principal amount invested. Neither CIT, the Manager, the Trustee nor any of the Affiliates
guarantees the repayment of any principal amount invested, the performance of CIT, any particular rate of return from investing in CIT, or
any taxation consequences of an investment in CIT. Any indication of CIT performance returns is historical and cannot be relied on as an
indicator of future performance.
Investors have no right to request that the Manager redeem or purchase their Units while the Units are listed. It is intended that investors
may only deal in their Units through trading on Singapore Exchange Securities Trading Limited (the “SGX-ST”). Listing of the Units on
the SGX-ST does not guarantee a liquid market for the Units.
This presentation may contain forward-looking statements that involve assumptions, risks and uncertainties. Actual future performance,
outcomes and results may differ materially from those expressed in forward-looking statements as a result of a number of risks,
uncertainties and assumptions. Representative examples of these factors include (without limitation) general industry and economic
conditions, interest rate trends, cost of capital and capital availability, competition from similar developments, shifts in expected levels of
occupancy or property rental income, changes in operating expenses (including employee wages, benefits and training costs),
governmental and public policy changes and the continued availability of financing in amounts and on terms necessary to support future
CIT business. You are cautioned not to place undue reliance on these forward-looking statements, which are based on the Manager’s
current view of future events.
This presentation is for informational purposes only and does not have regard to your specific investment objectives, financial situation or
your particular needs. Any information contained in this presentation is not to be construed as investment or financial advice, and does
not constitute an offer or an invitation to invest in CIT or any investment or product of or to subscribe to any services offered by the
Manager, the Trustee or any of the Affiliates.
38
Further Information
Ms. Elena Arabadjieva
Cambridge Industrial Trust Management Limited
61 Robinson Road, #12-01 Tel: (65) 6222 3339
Robinson Centre Fax: (65) 6827 9339
Singapore 068893 [email protected]
39