Embed Size (px)
Citation preview

UNITED STATES SECURITIES AND EXCHANGE COMMISSION
WASHINGTON, D.C. 20549
Form 10-K
x ANNUAL REPORT PURSUANT TO SECTION 13 OR 15(d) OF THE SECURITIES EXCHANGE ACT OF 1934
For the fiscal year ended December 31, 2015 OR
o TRANSITION REPORT PURSUANT TO SECTION 13 OR 15(d) OF THE SECURITIES EXCHANGE ACT OF 1934
For the transition period from to Commission file number 1-8974
Honeywell International Inc.
(Exact name of registrant as specified in its charter)
Registrant’s telephone number, including area code (973) 455-2000
Securities registered pursuant to Section 12(b) of the Act:
Securities registered pursuant to Section 12(g) of the Act: None
Indicate by check mark if the Registrant is a well-known seasoned issuer, as defined in Rule 405 of the Securities Act.
Yes x No o
Indicate by check mark if the Registrant is not required to file reports pursuant to Section 13 or Section 15(d) of the Exchange Act. Yes o No x
Indicate by check mark whether the Registrant (1) has filed all reports required to be filed by Section 13 or 15(d) of the Securities Exchange Act of 1934 during the preceding 12 months (or for such shorter period that the Registrant was required to file such reports), and (2) has been subject to such filing requirements for the past 90 days. Yes x No o
Indicate by check mark whether the Registrant has submitted electronically and posted on its corporate Website, if any, every Interactive Data File required to be submitted and posted pursuant to Rule 405 of Regulation S-T (§ 232.405 of this
Section 1: 10-K
Delaware 22-2640650 (State or other jurisdiction of
incorporation or organization) (I.R.S. Employer
Identification No.) 115 Tabor Road
Morris Plains, New Jersey 07950 (Address of principal executive offices) (Zip Code)
Title of Each Class Name of Each Exchange
on Which Registered Common Stock, par value $1 per share* New York Stock Exchange 9 / % Debentures due June 1, 2016 New York Stock Exchange
* The common stock is also listed on the London Stock Exchange.
1 2
chapter) during the preceding 12 months (or for such shorter period that the registrant was required to submit and post such files). Yes x No o
Indicate by check mark if disclosure of delinquent filers pursuant to Item 405 of Regulation S-K is not contained herein, and will not be contained, to the best of Registrant’s knowledge, in definitive proxy or information statements incorporated by reference in Part III of this Form 10-K or any amendment to this Form 10-K. o
Indicate by check mark whether the Registrant is a large accelerated filer, an accelerated filer, a non-accelerated filer, or a smaller reporting company. See definition of “accelerated filer,” “large accelerated filer,” and “smaller reporting company” in Rule 12b-2 of the Exchange Act. (Check One):
Large accelerated filer x Accelerated filer o Non-accelerated filer o Smaller reporting company o
Indicate by check mark whether the Registrant is a shell company (as defined in Rule 12b-2 of the Act). Yes o No x
The aggregate market value of the voting stock held by nonaffiliates of the Registrant was approximately $80.9 billion at June 30, 2015.
There were 769,322,910 shares of Common Stock outstanding at January 29, 2016.
Documents Incorporated by Reference
Part III: Proxy Statement for Annual Meeting of Shareowners to be held April 25, 2016.

TABLE OF CONTENTS
Item PagePart I 1. Business 1
Executive Officers of the Registrant 5 1A. Risk Factors 6 1B. Unresolved Staff Comments 11 2. Properties 11 3. Legal Proceedings 11 4. Mine Safety Disclosures 11
Part II. 5. Market for Registrant’s Common Equity, Related Stockholder Matters and Issuer Purchases of Equity Securities
12
6. Selected Financial Data 14 7. Management’s Discussion and Analysis of Financial Condition and Results of Operations 15 7A. Quantitative and Qualitative Disclosures About Market Risks 31 8. Financial Statements and Supplementary Data 32 9. Changes in and Disagreements with Accountants on Accounting and Financial Disclosure 83 9A. Controls and Procedures 83 9B. Other Information 83
Part III. 10. Directors and Executive Officers of the Registrant 84 11. Executive Compensation 84 12. Security Ownership of Certain Beneficial Owners and Management and Related Stockholder
Matters
85 13. Certain Relationships and Related Transactions 85 14. Principal Accounting Fees and Services 85
Part IV. 15. Exhibits and Financial Statement Schedules 85 Signatures 86

PART I.
Item 1. Business
Honeywell International Inc. (Honeywell or the Company) is a diversified technology and manufacturing company, serving customers worldwide with aerospace products and services, turbochargers, control, sensing and security technologies for buildings, homes and industry, specialty chemicals, electronic and advanced materials, process technology for refining and petrochemicals, and energy efficient products and solutions for homes, business and transportation. Honeywell was incorporated in Delaware in 1985.
Our Annual Report on Form 10-K, Quarterly Reports on Form 10-Q, Current Reports on Form 8-K and any amendments to those reports, are available free of charge on our website (www.honeywell.com) under the heading Investor Relations (see SEC Filings & Reports) immediately after they are filed with, or furnished to, the Securities and Exchange Commission (SEC). In addition, in this Form 10-K, the Company incorporates by reference certain information from parts of its Proxy Statement for the 2016 Annual Meeting of Stockholders, which we expect to file with the SEC on or about March 10, 2016, and which will also be available free of charge on our website.
Major Businesses
We globally manage our business operations through three operating segments: Aerospace, Automation and Control Solutions (ACS), and Performance Materials and Technologies (PMT). Financial information related to our operating segments is included in Note 21 Segment Financial Data of Notes to Financial Statements.
The major products/services, customers/uses and key competitors of each of our operating segments are:
Aerospace
Aerospace is a leading global supplier of aircraft engines, integrated avionics, systems and service solutions, and related products and services for aircraft manufacturers, airlines, aircraft operators, military services, and defense and space contractors. Aerospace is also a leading manufacturer of turbochargers to improve the performance and efficiency of passenger cars and commercial vehicles. Aerospace products and services include auxiliary power units, propulsion engines, environmental control systems, connectivity, electric power systems, engine controls, flight safety, communications, navigation, radar and surveillance systems, aircraft lighting, management and technical services, logistics services, advanced systems and instruments, aircraft wheels and brakes, repair and overhaul services, turbochargers and thermal systems. Aerospace sells its products to original equipment manufacturers (OEMs) in the air transport, regional, business and general aviation aircraft, and automotive and truck manufacturers segments, and provides spare parts and repair and maintenance services (principally to aircraft operators) for the aftermarket.
Automation and Control Solutions
ACS is a leading global provider of products, software and technologies for environmental and energy solutions; sensors, switches and controls for sensing and productivity solutions; security and fire safety products; industrial safety products; and building solutions and services for homes, commercial buildings and industrial facilities. ACS products and services include controls and displays for heating, cooling, indoor air quality, ventilation, humidification, combustion, lighting and home automation; advanced software applications for home/building control and optimization; sensors, switches, control systems and instruments for measuring pressure, air flow, temperature and electrical current; products, services and solutions for measurement, regulation, control and metering of gases and electricity; metering and communications systems for water utilities and industries; security, fire and gas detection; personal protection equipment; access control; video surveillance; remote patient monitoring systems; software and products for high performance data collection including rugged
1
mobile computers and printers, bar code scanners and voice technologies; and installation, maintenance and upgrades of systems that keep buildings safe, comfortable and productive.
Performance Materials and Technologies
PMT is a global leader in developing and manufacturing advanced materials, process technologies and automation solutions. UOP provides process technology, products, including catalysts and adsorbents, equipment and consulting services to efficiently produce gasoline, diesel, jet fuel, petrochemicals and renewable fuels for the petroleum refining, gas processing, petrochemical, and other industries. Process Solutions is a pioneer in automation control, instrumentation, services and advanced software for the oil and gas, refining, pulp and paper, industrial power generation, chemicals and petrochemicals, biofuels, life sciences, and metals, minerals and mining industries. Advanced Materials manufactures a wide variety of high-performance products, including fluorocarbons, hydrofluoroolefins, caprolactam, resins, ammonium sulfate fertilizer, phenol, specialty films, waxes, additives, advanced fibers, customized research chemicals and intermediates, and electronic materials and chemicals.
Competition
We are subject to competition in substantially all product and service areas. Some of our key competitors are:
Our businesses compete on a variety of factors, such as price, quality, reliability, delivery, customer service, performance, applied technology, product innovation and product recognition. Brand identity, service to customers and quality are important competitive factors for our products and services, and there is considerable price competition. Other competitive factors include breadth of product line, research and development efforts and technical and managerial capability. While our competitive position varies among our products and services, we believe we are a significant competitor in each of our major product and service classes. Many of our competitors have substantial financial resources and significant technological capabilities. In addition, some of our products compete with the captive component divisions of OEMs.
Aerospace Sales
Our sales to aerospace customers were 39%, 39%, and 40% of our total sales in 2015, 2014 and 2013. Our sales to commercial aerospace OEMs were 8%, 6%, and 7% of our total sales in 2015, 2014 and 2013. In addition, our sales to commercial aftermarket customers of aerospace products and services were 12%, 11%, and 11% of our total sales in 2015, 2014 and 2013.
U.S. Government Sales
Sales to the U.S. Government (principally by Aerospace), acting through its various departments and agencies and through prime contractors, amounted to $3,743 million, $3,693 million and $3,856 million in 2015, 2014 and 2013, which included sales to the U.S. Department of Defense, as a prime contractor and subcontractor, of $2,680 million, $2,792 million and $3,066 million in 2015, 2014 and 2013. U.S. defense spending decreased in 2015 compared to 2014. We do not expect our overall operating results to be significantly affected by any proposed changes in 2016 federal defense spending due principally to the varied mix of the government programs which impact us (OEMs’ production, engineering development programs, aftermarket spares and repairs and overhaul programs), increases in direct foreign defense and space market sales, as well as our diversified commercial businesses.
2
• Aerospace: Borg-Warner (automotive), Garmin, General Electric, Rockwell Collins, Thales and United Technologies
• ACS: 3M, Johnson Controls, Schneider, Siemens and Zebra-Motorola
• PMT: Albemarle, BASF, Dow, Dupont, Emerson and Sinopec

Backlog
Our total backlog at December 31, 2015 and 2014 was $18,183 million and $18,313 million. We anticipate that approximately $11,601 million of the 2015 backlog will be filled in 2016. We believe that backlog is not necessarily a reliable indicator of our future sales because a substantial portion of the orders constituting this backlog may be canceled at the customer’s option.
International Operations
We are engaged in manufacturing, sales, service and research and development globally. U.S. exports and non-U.S. manufactured products are significant to our operations. U.S. exports comprised 14% of our total sales in each of 2015, 2014 and 2013. Non-U.S. manufactured products and services, mainly in Europe and Asia, were 39% of our total sales in 2015, and 41% in 2014 and 2013.
Raw Materials
The principal raw materials used in our operations are generally readily available. Although we occasionally experience disruption in raw materials supply, we experienced no significant problems in the purchase of key raw materials or commodities in 2015. We are not dependent on any one supplier for a material amount of our raw materials, except related to R240 (a key component in foam blowing agents), a raw material used in PMT.
The costs of certain key raw materials, including cumene, natural gas, R240, sulfur, fluorspar, ethylene and perchloroethylene in PMT and nickel, steel, titanium and other metals in Aerospace, are expected to continue to fluctuate. We will continue to attempt to offset raw material cost increases with formula or long-term supply agreements, price increases and hedging activities where feasible. We do not presently anticipate that a shortage of raw materials will cause any material adverse impacts during 2016.
Patents, Trademarks, Licenses and Distribution Rights
Our segments are not dependent upon any single patent or related group of patents, or any licenses or distribution rights. In our judgment, our intellectual property rights are adequate for the conduct of our business. We believe that, in the aggregate, the rights under our patents, trademarks and licenses are generally important to our operations, but we do not consider any individual patent, trademark or any licensing or distribution rights related to a specific process or product to be of material importance in relation to our total business.
Research and Development
The Company’s principal research and development activities are in the U.S., India, Europe and China. Research and development (R&D) expense totaled $1,856 million, $1,892 million and $1,804 million in 2015, 2014 and 2013. R&D expense was 5% of sales in 2015, 2014 and 2013. Customer-sponsored (principally by the U.S. Government) R&D activities amounted to an additional $998 million, $1,034 million and $969 million in 2015, 2014 and 2013.
Environment
We are subject to various federal, state, local and foreign government requirements regarding protection of human health and the environment. We believe that, as a general matter, our policies, practices and procedures are properly designed to prevent unreasonable risk of environmental damage, and of resulting financial liability, in connection with our business. Some risk of environmental
3
Manufactured Products and Systems and Performance of Services
Year Ended December 31, 2015
Aerospace ACS PMT
(% of Total Sales) U.S. Exports 22 % 3 % 20 % Non-U.S. 29 % 48 % 40 %

damage is, however, inherent in some of our operations and products, as it is with other companies engaged in similar businesses.
We are and have been engaged in the handling, manufacture, use and disposal of many substances classified as hazardous by one or more regulatory agencies. We believe that, as a general matter, our policies, practices and procedures are properly designed to prevent unreasonable risk of environmental damage and personal injury, and that our handling, manufacture, use and disposal of these substances are in accord with environmental and safety laws and regulations. It is also possible that future knowledge or other developments, such as improved capability to detect substances in the environment or increasingly strict environmental laws and standards and enforcement policies, could bring into question our current or past handling, manufacture, use or disposal of these substances.
Among other environmental requirements, we are subject to the federal Superfund and similar state and foreign laws and regulations, under which we have been designated as a potentially responsible party that may be liable for cleanup costs associated with current and former operating sites and various hazardous waste sites, some of which are on the U.S. Environmental Protection Agency’s National Priority List. Although there is a possibility that a responsible party might have to bear more than its proportional share of the cleanup costs if it is unable to obtain appropriate contribution from other responsible parties, to date we have not had to bear significantly more than our proportional share in multi-party situations taken as a whole.
We do not believe that existing or pending climate change legislation, regulation, or international treaties or accords are reasonably likely to have a material effect in the foreseeable future on the Company’s business or markets that it serves, nor on its results of operations, capital expenditures or financial position. We will continue to monitor emerging developments in this area.
Employees
We have approximately 129,000 employees at December 31, 2015, of whom approximately 49,000 are located in the United States.
4

Executive Officers of the Registrant
The executive officers of Honeywell, listed as follows, are elected annually by the Board of Directors. There are no family relationships among them.
5
Name, Age, Date First Elected an
Executive Officer Business ExperienceDavid M. Cote, 63
2002(a) Chairman of the Board and Chief Executive Officer since July 2002.
Darius Adamczyk, 50 2014
President and Chief Executive Officer Performance Materials and Technologies since April 2014. President of Honeywell Process Solutions from April 2012 to April 2014. President of Honeywell Scanning & Mobility from July 2008 to April 2012.
Katherine L. Adams, 51 2009
Senior Vice President and General Counsel since April 2009.
Roger Fradin, 62 2004
Vice Chairman since April 2014. President and Chief Executive Officer Automation and Control Solutions from January 2004 to April 2014.
Alexandre Ismail, 50 2009
President and Chief Executive Officer Automation and Control Solutions since April 2014. President Energy, Safety and Security from May 2013 to April 2014. President and Chief Executive Officer Transportation Systems from April 2009 to May 2013.
Mark R. James, 54 2007
Senior Vice President Human Resources, Procurement and Communications since November 2007.
Andreas C. Kramvis, 63 2008
Vice Chairman since April 2014. President and Chief Executive Officer Performance Materials and Technologies from March 2008 to April 2014.
Timothy O. Mahoney, 59 2009
President and Chief Executive Officer Aerospace since September 2009.
Krishna Mikkilineni, 56 2010
Senior Vice President Engineering, Operations and Information Technology since April 2013. Senior Vice President Engineering and Operations from April 2010 to April 2013 and President Honeywell Technology Solutions from January 2009 to April 2013.
Thomas A. Szlosek, 52 2014
Senior Vice President and Chief Financial Officer since April 2014. Vice President of Corporate Finance from April 2013 to April 2014. Chief Financial Officer of Automation and Control Solutions from February 2007 to April 2013.
(a) Also a Director.

Item 1A. Risk Factors
Cautionary Statement about Forward-Looking Statements
We describe many of the trends and other factors that drive our business and future results in Item 7. Management’s Discussion and Analysis of Financial Condition, Results of Operations and in other parts of this report (including this Item 1A). Such discussions contain forward-looking statements within the meaning of Section 21E of the Securities Exchange Act of 1934.
Forward-looking statements are those that address activities, events or developments that management intends, expects, projects, believes or anticipates will or may occur in the future. They are based on management’s assumptions and assessments in light of past experience and trends, current economic and industry conditions, expected future developments and other relevant factors. They are not guarantees of future performance, and actual results, developments and business decisions may differ significantly from those envisaged by our forward-looking statements. We do not undertake to update or revise any of our forward-looking statements. Our forward-looking statements are also subject to risks and uncertainties that can affect our performance in both the near-and long-term. These forward-looking statements should be considered in light of the information included in this Form 10-K, including, in particular, the factors discussed below. These factors may be revised or supplemented in subsequent reports on Forms 10-Q and 8-K.
Risk Factors
Our business, operating results, cash flows and financial condition are subject to the principal risks and uncertainties set forth below, any one of which could cause our actual results to vary materially from recent results or from our anticipated future results.
Macroeconomic and Industry Risks
Industry and economic conditions may adversely affect the markets and operating conditions of our customers, which in turn can affect demand for our products and services and our results of operations.
6
• Aerospace—Operating results of Aerospace are directly tied to cyclical industry and economic conditions, as well as changes in customer buying patterns of aftermarket parts, supplier stability, factory transitions and capacity constraints. The operating results of our Commercial Original Equipment and Commercial Aftermarket business units may be adversely affected by downturns in the global demand for air travel which impacts new aircraft production or the delay or cancellation of new aircraft orders, delays in launch schedules for new aircraft, the retirement of aircraft and global flying hours, which impact business and general aviation aircraft utilization rates. Operating results in our Defense and Space Systems business unit may be affected by the mix of U.S. and foreign government appropriations for defense and space programs. Operating results in our Transportation Systems business unit may be affected by the level of production and demand for automobiles and trucks equipped with turbochargers, regulatory changes regarding automobile and truck emissions and fuel economy, consumer demand and spending for automotive aftermarket products and delays in launch schedules for new automobile and truck platforms.
• ACS—Operating results may be adversely impacted by downturns in the level of global residential and commercial construction (including retrofits and upgrades), capital spending and operating expenditures on building and process automation, industrial plant capacity utilization and expansion, and inventory levels in distribution channels.
• PMT—Operating results may be adversely impacted by downturns in the capacity utilization for chemical, industrial, refining, petrochemical and semiconductor plants, our customers’ availability of capital for refinery construction and expansion, raw material demand and supply volatility, and our ability to maximize our facilities’ production capacity and minimize downtime. In particular, the volatility in oil and natural gas prices have and will continue to impact our customers’ operating levels and capital spending and thus demand for our products and

An increasing percentage of our sales and operations is in non-U.S. jurisdictions and is subject to the economic, political, regulatory, foreign exchange and other risks of international operations.
Our international operations, including U.S. exports, represent more than half of the Company’s sales. Risks related to international operations include exchange control regulations, wage and price controls, antitrust regulations, employment regulations, foreign investment laws, import, export and other trade restrictions (such as embargoes), violations by our employees of anti-corruption laws (despite our efforts to mitigate these risks), changes in regulations regarding transactions with state-owned enterprises, nationalization of private enterprises, acts of terrorism, and our ability to hire and maintain qualified staff and maintain the safety of our employees in these regions. Instability and uncertainties arising from the global geopolitical environment and the cost of compliance with increasingly complex and often conflicting regulations worldwide can impair our flexibility in modifying product, marketing, pricing or other strategies for growing our businesses, as well as our ability to improve productivity and maintain acceptable operating margins.
Operating outside of the United States also exposes us to foreign exchange risk, which we monitor and seek to reduce through hedging activities. However, foreign exchange hedging activities bear a financial cost and may not always be available to us or successful in eliminating such volatility. Finally, we generate significant amounts of cash outside of the United States that is invested with financial and non-financial counterparties. While we employ comprehensive controls regarding global cash management to guard against cash or investment loss and to ensure our ability to fund our operations and commitments, a material disruption to the counterparties with whom we transact business could expose Honeywell to financial loss.
Risks related to our defined benefit pension plans may adversely impact our results of operations and cash flow.
Significant changes in actual investment return on pension assets, discount rates, and other factors could adversely affect our results of operations and require cash pension contributions in future periods. Changes in discount rates and actual asset returns different than our anticipated asset returns can result in significant non-cash actuarial gains or losses which we record in the fourth quarter of each fiscal year, and, if applicable, in any quarter in which an interim re-measurement is triggered. With regard to cash pension contributions, funding requirements for our pension plans are largely dependent upon interest rates, actual investment returns on pension assets and the impact of legislative or regulatory changes related to pension funding obligations.
Operational Risks
Raw material price fluctuations, the ability of key suppliers to meet quality and delivery requirements, or catastrophic events can increase the cost of our products and services, impact our ability to meet commitments to customers and cause us to incur significant liabilities.
The cost of raw materials is a key element in the cost of our products, particularly in PMT (cumene, fluorspar, R240, natural gas, perchloroethylene, sulfur and ethylene) and Aerospace (nickel, steel, titanium and other metals). Our inability to offset material price inflation through increased prices to customers, formula or long-term fixed price contracts with suppliers, productivity actions or through commodity hedges could adversely affect our results of operations.
Many major components, product equipment items and raw materials, particularly in Aerospace, are procured or subcontracted on a single or sole-source basis. Although we maintain a qualification and performance surveillance process and we believe that sources of supply for raw materials and components are generally adequate, it is difficult to predict what effects shortages or price increases may have in the future. Our ability to manage inventory and meet delivery requirements may be
7
services. Pricing of certain chemical products are driven by raw materials that are correlated to the price of oil, hence revenue could be significantly impacted by volatility in the price of oil.

constrained by our suppliers’ inability to scale production and adjust delivery of long-lead time products during times of volatile demand. Our inability to fill our supply needs would jeopardize our ability to fulfill obligations under commercial and government contracts, which could, in turn, result in reduced sales and profits, contract penalties or terminations, and damage to customer relationships.
We may be unable to successfully execute or effectively integrate acquisitions, and divestitures may not occur as planned.
We regularly review our portfolio of businesses and pursue growth through acquisitions and seek to divest non-core businesses. We may not be able to complete transactions on favorable terms, on a timely basis or at all. In addition, our results of operations and cash flows may be adversely impacted by (i) the failure of acquired businesses to meet or exceed expected returns, (ii) the failure to integrate multiple acquired businesses into Honeywell simultaneously and on schedule and/or to achieve expected synergies, (iii) the inability to dispose of non-core assets and businesses on satisfactory terms and conditions, and (iv) the discovery of unanticipated liabilities or other problems in acquired businesses for which we lack contractual protections, insurance or indemnities or, with regard to divested businesses, claims by purchasers to whom we have provided contractual indemnification.
Our future growth is largely dependent upon our ability to develop new technologies and introduce new products that achieve market acceptance in increasingly competitive markets with acceptable margins.
Our future growth rate depends upon a number of factors, including our ability to (i) identify emerging technological trends in our target end-markets, (ii) develop and maintain competitive products and defend our market share against an ever-expanding number of competitors including many new and non- traditional competitors, (iii) enhance our products by adding innovative features that differentiate our products from those of our competitors and prevent commoditization of our products, (iv) develop, manufacture and bring compelling new products to market quickly and cost-effectively, and (v) attract, develop and retain individuals with the requisite technical expertise and understanding of customers’ needs to develop new technologies and introduce new products.
The failure of our technologies or products to gain market acceptance due to more attractive offerings by our competitors could significantly reduce our revenues and adversely affect our competitive standing and prospects.
Failure to increase productivity through sustainable operational improvements, as well as an inability to successfully execute repositioning projects, may reduce our profitability or adversely impact our businesses.
Our profitability and margin growth are dependent upon our ability to drive sustainable improvements. In addition, we seek productivity and cost savings benefits through repositioning actions and projects, such as consolidation of manufacturing facilities, transitions to cost-competitive regions and product line rationalizations. Risks associated with these actions include delays in execution of the planned initiatives, additional unexpected costs and adverse effects on employee morale. We may not realize the full operational or financial benefits we expect, the recognition of these benefits may be delayed and these actions may potentially disrupt our operations.
As a supplier of military and other equipment to the U.S. Government, we are subject to unusual risks, such as the right of the U.S. Government to terminate contracts for convenience and to conduct audits and investigations of our operations and performance.
U.S. Government contracts are subject to termination by the government, either for the convenience of the government or for our failure to perform consistent with the terms of the applicable contract. Our contracts with the U.S. Government are also subject to government audits that may recommend downward price adjustments and other changes. When appropriate and prudent, we have made adjustments and paid voluntary refunds in the past and may do so in the future.
8

We are also subject to government investigations of business practices and compliance with government procurement regulations. If, as a result of any such investigation or other government investigations (including violations of certain environmental, employment or export laws), Honeywell or one of its businesses were found to have violated applicable law, it could be suspended from bidding on or receiving awards of new government contracts, suspended from contract performance pending the completion of legal proceedings and/or have its export privileges suspended.
Our operations and the prior operations of predecessor companies expose us to the risk of material environmental liabilities.
Mainly because of past operations and operations of predecessor companies, we are subject to potentially material liabilities related to the remediation of environmental hazards and to claims of personal injuries or property damages that may be caused by hazardous substance releases and exposures. We continue to incur remedial response and voluntary clean-up costs for site contamination and are a party to lawsuits and claims associated with environmental and safety matters, including past production of products containing hazardous substances. Additional lawsuits, claims and costs involving environmental matters are likely to continue to arise in the future. Various federal, state, local and foreign governments regulate the discharge of materials into the environment and can impose substantial fines and criminal sanctions for violations, and require installation of costly equipment or operational changes to limit emissions and/or decrease the likelihood of accidental hazardous substance releases. In addition, changes in laws, regulations and enforcement of policies, the discovery of previously unknown contamination or new technology or information related to individual sites, the establishment of stricter state or federal toxicity standards with respect to certain contaminants, or the imposition of new clean-up requirements or remedial techniques could require us to incur additional costs in the future that would have a negative effect on our financial condition or results of operations.
Cybersecurity incidents could disrupt business operations, result in the loss of critical and confidential information, and adversely impact our reputation and results of operations.
Global cybersecurity threats and incidents can range from uncoordinated individual attempts to gain unauthorized access to information technology (IT) systems to sophisticated and targeted measures known as advanced persistent threats, directed at the Company, its products, its customers and/or its third party service providers including cloud providers. Our customers, including the U.S. government, are increasingly requiring cybersecurity protections and mandating cybersecurity standards in our products and we may incur additional costs to comply with such demands. While we have experienced, and expect to continue to experience, these types of threats and incidents, none of them to date have been material to the Company. We seek to deploy comprehensive measures to deter, prevent, detect, respond and mitigate these threats (including access controls, data encryption, vulnerability assessments, product software designs which we believe are less susceptible to cyber attacks, continuous monitoring of our IT networks and systems and maintenance of backup and protective systems. Despite these efforts, cybersecurity incidents, depending on their nature and scope, could potentially result in the misappropriation, destruction, corruption or unavailability of critical data and confidential or proprietary information (our own or that of third parties) and the disruption of business operations. Cybersecurity incidents aimed at the software imbedded in our products could lead to third party claims that our product failures have caused a similar range of damages to our customers, and this risk is enhanced by the increasingly connected nature of our products. The potential consequences of a material cybersecurity incident include reputational damage, litigation with third parties, fines levied by the Federal Trade Commission, diminution in the value of our investment in research, development and engineering, and increased cybersecurity protection and remediation costs, which in turn could adversely affect our competitiveness and results of operations.
9

Legal and Regulatory Risks
Our U.S. and non-U.S. tax liabilities are dependent, in part, upon the distribution of income among various jurisdictions in which we operate.
Our future results of operations could be adversely affected by changes in the effective tax rate as a result of a change in the mix of earnings in countries with differing statutory tax rates, changes in tax laws, regulations and judicial rulings (or changes in the interpretation thereof), changes in generally accepted accounting principles, changes in the valuation of deferred tax assets and liabilities, changes in the amount of earnings permanently reinvested offshore, the results of audits and examinations of previously filed tax returns and continuing assessments of our tax exposures and various other governmental enforcement initiatives. Our tax expense includes estimates of tax reserves and reflects other estimates and assumptions, including assessments of future earnings of the Company which could impact the valuation of our deferred tax assets. Changes in tax laws or regulations, including multi- jurisdictional changes enacted in response to the guidelines provided by the Organization for Economic Co-operation and Development (OECD) to address base erosion and profit shifting, will increase tax uncertainty and may adversely impact our provision for income taxes.
Changes in legislation or government regulations or policies can have a significant impact on our results of operations.
The sales and margins of each of our segments are directly impacted by government regulations including safety, performance and product certification regulations. Within Aerospace, the operating results of Commercial Original Equipment and Commercial Aftermarket may be impacted by, among other things, mandates of the Federal Aviation Administration and other similar international regulatory bodies requiring the installation of equipment on aircraft. Our Defense and Space business unit may be affected by changes in government procurement regulations, while emissions, fuel economy and energy efficiency standards for motor vehicles can impact Transportation Systems. Within ACS, the demand for and cost of providing products, services and solutions can be impacted by fire, security, safety, health care, environmental and energy efficiency standards and regulations. PMT’s results of operations can be affected by environmental, safety and energy efficiency standards and regulations. Growth in all our businesses within emerging markets may be adversely impacted by the inability to acquire and retain qualified employees where local employment law mandates may be restrictive.
We cannot predict with certainty the outcome of litigation matters, government proceedings and other contingencies and uncertainties.
We are subject to a number of lawsuits, investigations and disputes (some of which involve substantial amounts claimed) arising out of the conduct of our business, including matters relating to commercial transactions, government contracts, product liability (including asbestos), prior acquisitions and divestitures, employment, employee benefits plans, intellectual property, antitrust, import and export matters and environmental, health and safety matters. Our potential liabilities are subject to change over time due to new developments, changes in settlement strategy or the impact of evidentiary requirements, and we may become subject to or be required to pay damage awards or settlements that could have a material adverse effect on our results of operations, cash flows and financial condition. While we maintain insurance for certain risks, the amount of our insurance coverage may not be adequate to cover the total amount of all insured claims and liabilities. The incurrence of significant liabilities for which there is no or insufficient insurance coverage could adversely affect our results of operations, cash flows, liquidity and financial condition.
10

Item 1B. Unresolved Staff Comments
Not applicable.
Item 2. Properties
We have approximately 1,328 locations, of which 319 are plants. Our properties and equipment are in good operating condition and are adequate for our present needs. We do not anticipate difficulty in renewing existing leases as they expire or in finding alternative facilities.
Item 3. Legal Proceedings
We are subject to a number of lawsuits, investigations and claims (some of which involve substantial amounts) arising out of the conduct of our business. See a discussion of environmental, asbestos and other litigation matters in Note 19 Commitments and Contingencies of Notes to Financial Statements.
Item 4. Mine Safety Disclosures
Not applicable.
11

Part II.
Item 5. Market for Registrant’s Common Equity, Related Stockholder Matters and Issuer Purchases of Equity Securities
Honeywell’s common stock is listed on the New York Stock Exchange. Market and dividend information for Honeywell’s common stock is included in Note 24 Unaudited Quarterly Financial Information of Notes to Financial Statements.
The number of record holders of our common stock at December 31, 2015 was 53,230.
Honeywell purchased 1,724,212 shares of its common stock, par value $1 per share, in the quarter ending December 31, 2015. Under the Company’s previously reported $5 billion share repurchase program, $2.2 billion remained available as of December 31, 2015 for additional share repurchases. Honeywell presently expects to repurchase outstanding shares from time to time to generally offset the dilutive impact of employee stock based compensation plans, including option exercises, restricted unit vesting and matching contributions under our savings plans. The amount and timing of future repurchases may vary depending on market conditions and the level of our operating, financing and other investing activities.
The following table summarizes Honeywell’s purchase of its common stock for the three months ended December 31, 2015:
12
Issuer Purchases of Equity Securities
Period
Total Number of
Shares Purchased
Average Price Paid per Share
Total Number of Shares
Purchased as Part of Publicly
Announced Plans
or Programs
Approximate Dollar Value of Shares that
May Yet be Purchased Under Plans or
Programs (Dollars in millions)
October 2015 1,567,882 $ 93.89 1,567,882 $ 2,207 December 2015 156,330 $ 98.02 156,330 $ 2,192

Performance Graph
The following graph compares the five-year cumulative total return on our common stock to the total returns on the Standard & Poor’s (S&P) 500 Stock Index and a composite of S&P’s Industrial Conglomerates and Aerospace and Defense indices, on a 65%/35% weighted basis (the Composite Index). The weighting of the components of the Composite Index are based on our segments’ relative contribution to total segment profit. The selection of the Industrial Conglomerates component of the Composite Index reflects the diverse and distinct range of non-aerospace businesses conducted by Honeywell. The annual changes for the five-year period shown in the graph are based on the assumption that $100 had been invested in Honeywell stock and each index on December 31, 2010 and that all dividends were reinvested.
COMPARISON OF CUMULATIVE FIVE YEAR TOTAL RETURN
13

HONEYWELL INTERNATIONAL INC.
This selected financial data should be read in conjunction with Honeywell’s Consolidated Financial Statements and related Notes included elsewhere in this Annual Report as well as the section of this Annual Report titled Item 7. Management’s Discussion and Analysis of Financial Condition and Results of Operations.
Item 6. Selected Financial Data
14
Years Ended December 31,2015 2014 2013 2012 2011
(Dollars in millions, except per share amounts) Results of Operations Net sales $ 38,581 $ 40,306 $ 39,055 $ 37,665 $ 36,529 Amounts attributable to Honeywell:
Income from continuing operations less net income attributable to the noncontrolling interest 4,768 4,239 3,924 2,926 1,858
Income from discontinued operations(1) — — — — 209
Net income attributable to Honeywell 4,768 4,239 3,924 2,926 2,067 Earnings Per Common Share Basic:
Income from continuing operations 6.11 5.40 4.99 3.74 2.38 Income from discontinued operations — — — — 0.27
Net income attributable to Honeywell 6.11 5.40 4.99 3.74 2.65 Assuming dilution:
Income from continuing operations 6.04 5.33 4.92 3.69 2.35 Income from discontinued operations — — — — 0.26
Net income attributable to Honeywell 6.04 5.33 4.92 3.69 2.61 Dividends per share 2.15 1.87 1.68 1.53 1.37 Financial Position at Year-End Property, plant and equipment-net 5,789 5,383 5,278 5,001 4,804 Total assets 49,316 45,451 45,435 41,853 39,808 Short-term debt 6,514 2,637 2,028 1,101 674 Long-term debt 5,554 6,046 6,801 6,395 6,881 Total debt 12,068 8,683 8,829 7,496 7,555 Redeemable noncontrolling interest 290 219 167 150 — Shareowners’ equity 18,418 17,784 17,579 13,065 10,902
(1) For the year ended December 31, 2011, income from discontinued operations included a $178 million, net of tax gain, resulting from the sale of the Consumer Products Group business.

Item 7. Management’s Discussion and Analysis of Financial Condition and Results of Operations
(Dollars in millions, except per share amounts)
The following Management’s Discussion and Analysis of Financial Condition and Results of Operations (MD&A) is intended to help the reader understand the results of operations and financial condition of Honeywell International Inc. and its consolidated subsidiaries (Honeywell or the Company) for the three years ended December 31, 2015. All references to Notes relate to Notes to Financial Statements in Item 8. Financial Statements and Supplementary Data.
EXECUTIVE SUMMARY
In 2015, Honeywell successfully navigated a challenging macro-economic climate by combining strategic growth in our diverse portfolio and our well-known cost discipline with a marked acceleration of our capital deployment strategy. Earnings per share of common stock–assuming dilution, grew 13% to $6.04 per share in 2015 and net income attributable to Honeywell grew 12% to $4,768 million. Our balanced long-term focus on enhancing shareowner value resulted in segment margin expansion of 220 basis points versus 2014 without sacrificing seed planting intended to ensure future growth, including maintaining R&D spending at 5% of sales, new product introductions aligned with global macroeconomic trends in energy, safety and security and productivity, $216 million of repositioning investments to improve our operations and increased investment in High Growth Regions. Honeywell Operating System (HOS) Gold and Honeywell User Experience (HUE) initiatives intensified throughout the company, driving productivity through sustainable improvements to our factories, footprints and supply chain.
In 2015 we deployed capital of over $10 billion, including the following:
CONSOLIDATED RESULTS OF OPERATIONS
Net Sales
15
• Mergers and Acquisitions—we deployed over $5 billion during 2015, acquiring businesses that will be integrated into each of our three operating segments. These acquisitions all share a technology focus and increase our existing deep alignment with enduring macro trends such as energy efficiency, clean energy generation, safety and security, urbanization and customer productivity.
• Dividend—after a 15% dividend rate increase in 2014, we again increased our annual dividend rate by 15% in 2015, as we seek to grow the dividend faster than earnings.
• Share Repurchases—we continue to opportunistically repurchase our shares with the goal of generally keeping share count flat and seeking to offset the dilutive impact of employee stock based compensation plans. In 2015, we repurchased 18.8 million shares for $1.9 billion.
• Capital Investment in Facilities—we invested over $1 billion in high return capital expenditures, focused on revenue growth projects such as our Solstice low global-warming potential refrigerant products for the automotive industry and catalyst products in UOP.
2015 2014 2013
Net sales $ 38,581 $ 40,306 $ 39,055 % change compared with prior period (4 )% 3 %

The change in net sales is attributable to the following:
A discussion of net sales by segment can be found in the Review of Business Segments section of this MD&A. The foreign currency translation impact is principally driven by the weakening of the Euro and Canadian Dollar against the U.S. Dollar.
Cost of Products and Services Sold
Cost of products and services sold decreased in 2015 compared with 2014 principally due to a decrease in direct and indirect material costs of approximately $1,460 million (driven primarily by the favorable impact of foreign currency translation, productivity, lower raw materials pass-through pricing and the absence of the Friction Materials business, partially offset by higher sales volume), a decrease in labor costs of approximately $450 million and higher pension income of approximately $230 million.
Gross margin percentage increased in 2015 compared with 2014 principally due to higher gross margin in all of our business segments (approximately 2.0 percentage point impact collectively) and increased pension income allocated to cost of products and services sold (approximately 0.5 percentage point impact).
Cost of products and services sold increased in 2014 compared with 2013 principally due to an increase in direct material and labor costs of approximately $645 million (driven by higher sales volume and acquisitions, net of divestitures) and an increase in pension and other postretirement benefit expense of approximately $35 million, partially offset by a decrease in repositioning and other charges of approximately $40 million.
Gross margin percentage increased in 2014 compared with 2013 principally due to higher gross margin in all of our business segments (approximately 0.7 percentage point impact collectively) and lower repositioning and other charges (approximately 0.1 percentage point impact), partially offset by higher pension and other postretirement benefit expense (approximately 0.1 percentage point impact).
Selling, General and Administrative Expenses
Selling, general and administrative expenses (SG&A) decreased in 2015 compared with 2014 primarily driven by the favorable impact from foreign currency translation, increased pension income, decreased indirect costs and benefits from repositioning, partially offset by increased labor costs (primarily merit increases and investment for growth).
SG&A increased in 2014 compared with 2013 primarily driven by an increase in labor costs (primarily acquisitions, incentive compensation, merit increases and investment for growth) and an increase in pension and other postretirement benefit expense, partially offset by a decrease in repositioning charges.
16
2015 Versus
2014
2014 Versus
2013
Volume 1% 3% Price (1)% — Acquisitions/Divestitures (1)% 1% Foreign Currency Translation (4)% — Other 1% (1)%
(4)% 3%
2015 2014 2013
Cost of products and services sold $ 26,747 $ 28,957 $ 28,364 % change compared with prior period (8 )% 2 % Gross Margin percentage 30.7 % 28.2 % 27.4 %
2015 2014 2013
Selling, general and administrative expense $ 5,006 $ 5,518 $ 5,190 % of sales 13.0 % 13.7 % 13.3 %

Tax Expense
For discussion of changes in the effective tax rate, see Note 5 Income Taxes in the Notes to Financial Statements.
The effective tax rates for 2015, 2014 and 2013 are lower than the U.S. statutory rate of 35% primarily due to lower tax rates on non-U.S. earnings, the vast majority of which we intend to permanently reinvest outside the United States.
The Company currently expects the effective tax rate for 2016 to be approximately 26.5%. The effective tax rate can vary from quarter to quarter due to unusual or infrequently occurring items, the resolution of income tax audits, changes in tax laws or other items such as pension mark-to-market adjustments.
Net Income Attributable to Honeywell
Earnings per share of common stock–assuming dilution increased in 2015 compared with 2014 primarily driven by increased segment profit in each of our business segments and lower pension and other postretirement expense, partially offset by increased tax expense and lower other income (principally due to the absence of a realized gain related to the prior year sale of marketable equity securities).
Earnings per share of common stock–assuming dilution increased in 2014 compared with 2013 primarily due to increased segment profit in each of our business segments and lower repositioning and other charges, partially offset by higher pension and other postretirement expense and increased tax expense.
BUSINESS OVERVIEW
Our consolidated results are principally impacted by:
Our 2016 areas of focus are supported by the Honeywell Enablers, including HOS Gold, are generally applicable to each of our operating segments and include:
17
2015 2014 2013
Tax expense $ 1,739 $ 1,489 $ 1,450 Effective tax rate 26.4 % 25.6 % 26.8 %
2015 2014 2013
Net income attributable to Honeywell $ 4,768 $ 4,239 $ 3,924 Earnings per share of common stock–assuming dilution $ 6.04 $ 5.33 $ 4.92
• Change in global economic growth rates and industry conditions and demand in our key end markets;
• Overall sales mix, in particular the mix of Aerospace original equipment and aftermarket sales and the mix of ACS products, distribution and services sales;
• The impact of fluctuations in foreign currency exchange rates (in particular the Euro), relative to the U.S. Dollar;
• The extent to which cost savings from productivity actions are able to offset or exceed the impact of material and non-material inflation; and
• The impact of the pension discount rate and asset returns on pension expense, including mark-to-market adjustments, and funding requirements.
• Driving profitable growth through R&D, technological excellence and optimized manufacturing capability to deliver innovative products that customers value;
• Expanding margins by maintaining and improving the Company’s cost structure through manufacturing and administrative process improvements, repositioning, and other actions, which will drive productivity and enhance the flexibility of the business as it works to proactively respond to changes in end market demand;

Review of Business Segments
18
• Driving strong cash flow conversion through effective working capital management which will enable the Company to deploy capital for strategic acquisitions, capital expenditures and returning cash to shareholders;
• Driving organic growth through expansion of our localized footprint in high growth regions, including China, India, Eastern Europe, the Middle East and Latin America;
• Executing disciplined, rigorous M&A and integration processes to deliver inorganic growth through previously announced acquisitions while also identifying appropriate acquisitions to further deploy our capital effectively;
• Aligning and prioritizing capital expenditures for long-term growth, while considering short-term demand volatility;
• Actively monitoring trends in the oil and gas industry end markets, principally the demand from midstream and downstream customers for products and services provided by Process Solutions and UOP;
• Monitoring both suppliers and customers for signs of liquidity constraints, limiting exposure to any resultjing inability to meet delivery commitments or pay amounts due, and identifying alternate sources of supply as necessary;
• Proactively managing raw material costs through formula and long-term supply agreements and hedging activities, where feasible and prudent; and
• Controlling corporate and other non-operating costs, including costs incurred for asbestos and environmental matters, pension and other post-retirement expenses and tax expense.
Years Ended December 31, % Change2015
Versus 2014
2014 Versus
20132015 2014 2013Aerospace Sales
Commercial Original Equipment $ 2,905 $ 2,607 $ 2,651 11 % (2 )% Commercial Aftermarket 4,656 4,578 4,459 2 % 3 % Defense and Space 4,715 4,754 4,870 (1 )% (2 )% Transportation Systems 2,961 3,659 3,755 (19 )% (3 )%
Total Aerospace Sales 15,237 15,598 15,735 Automation and Control Solutions Sales
Energy Safety & Security 9,544 9,738 8,756 (2 )% 11 % Building Solutions & Distribution 4,565 4,749 4,709 (4 )% 1 %
Total Automation and Control Solutions Sales 14,109 14,487 13,465 Performance Materials and Technologies Sales
UOP 2,976 3,195 2,962 (7 )% 8 % Process Solutions 2,749 3,122 3,091 (12 )% 1 % Advanced Materials 3,510 3,904 3,802 (10 )% 3 %
Total Performance Materials and Technologies Sales 9,235 10,221 9,855
Net Sales $ 38,581 $ 40,306 $ 39,055

Aerospace
2015 compared with 2014
Aerospace sales decreased primarily due to the unfavorable impact from foreign currency translation and the Friction Materials divestiture, partially offset by an increase in organic sales, as discussed below, and a decrease in incentives predominantly to air transport and regional aviation original equipment manufacturers (OEM Incentives).
Aerospace segment profit increased primarily due to an 8% increase in operational segment profit and a 6% favorable impact of acquisitions, divestitures and other (predominantly the absence of higher prior year OEM Incentives), as discussed above, partially offset by a 4% unfavorable impact of foreign currency translation. The increase in operational segment profit is primarily driven by productivity, net of inflation, and favorable pricing, partially offset by continued investments for growth. Cost of products and services sold decreased primarily due to the favorable impact of foreign currency translation, the Friction Materials divestiture, and productivity, net of inflation, partially offset by continued investments for growth.
2014 compared with 2013
Aerospace sales decreased primarily due to the Friction Materials divestiture and an increase in OEM incentives, partially offset by an increase in organic sales, as discussed below.
19
2015 2014 Change 2013 Change
Net sales $ 15,237 $ 15,598 (2 )% $ 15,735 (1 )% Cost of products and services sold 11,068 11,699 11,889 Selling, general and administrative expenses 643 712 705 Other 308 272 271
Segment profit $ 3,218 $ 2,915 10 % $ 2,870 2 %
Factors Contributing to Year-Over-Year Change
2015 vs. 2014 2014 vs. 2013
SalesSegment
Profit SalesSegment
Profit
Organic growth/ Operational segment profit 2 % 8 % 2 % 8 % Foreign currency translation (3 )% (4 )% — — Acquisitions, divestitures and other, net (1 )% 6 % (3 )% (6 )%
Total % Change (2 )% 10 % (1 )% 2 %
• Commercial Original Equipment sales increased by 11% (increased 5% organic) primarily driven by a decrease in OEM Incentives and higher business and general aviation engine shipments.
• Commercial Aftermarket sales increased by 2% (increased 2% organic) primarily driven by higher repair and overhaul activities, partially offset by lower retrofits, modifications and upgrades for business and general aviation customers.
• Defense and Space sales decreased by 1% (flat organic) primarily due to lower U.S. government revenue, partially offset by growth in international programs.
• Transportation Systems sales decreased by 19% (increased 3% organic) primarily due to the unfavorable impact from foreign currency translation and the Friction Materials divestiture, partially offset by continued growth from new platform launches and higher global turbo gas penetration.
• Commercial Original Equipment sales decreased by 2% (increased by 3% organic) primarily due to an increase in OEM Incentives to air transport and regional original equipment manufacturers (OEMs), partially offset by higher air transport volumes, consistent with the OEMs’ higher production rates, and business and general aviation engine shipments.
• Commercial Aftermarket sales increased by 3% driven primarily by higher sales of spare parts to air transport and regional customers, partially offset by a decline in retrofits, modifications and

Aerospace segment profit increased primarily due to an 8% increase in operational segment profit, partially offset by a 6% unfavorable impact from acquisitions, divestitures and other (predominantly higher OEM Incentives and the absence of a prior year royalty gain), as discussed above. The increase in operational segment profit is driven primarily by favorable price and productivity, net of inflation. Cost of products and services sold decreased primarily due to the factors discussed above (excluding price).
Automation and Control Solutions
2015 compared with 2014
ACS sales decreased primarily due to the unfavorable impact of foreign currency translation, partially offset by organic sales growth and growth from acquisitions, net of divestitures.
ACS segment profit increased due to an increase in operational segment profit and acquisitions, net of divestitures partially offset by the unfavorable impact of foreign currency translation. The increase in operational segment profit is primarily due to the positive impact of price and productivity net of inflation and higher organic sales volumes partially offset by continued investments for growth. Cost of products and services decreased primarily due to the favorable impact of foreign currency translation and productivity partially offset by higher organic sales volume and inflation.
20
upgrades and lower repair and overhaul activities for our business and general aviation customers.
• Defense and Space sales decreased by 2% primarily due to lower U.S. government services revenue and the absence of a prior year royalty gain, partially offset by growth in international programs.
• Transportation Systems sales decreased by 3% (increased by 5% organic) primarily due to the Friction Materials divestiture, partially offset by continued growth from new platform launches, higher global turbo gas penetration and increased commercial vehicle demand in Europe.
2015 2014 Change 2013 Change
Net sales $ 14,109 $ 14,487 (3 )% $ 13,465 8 % Cost of products and services sold 9,133 9,447 8,872 Selling, general and administrative expenses 2,373 2,584 2,358 Other 290 256 252
Segment profit $ 2,313 $ 2,200 5 % $ 1,983 11 %
Factors Contributing to Year-Over-Year Change
2015 vs. 2014 2014 vs. 2013
SalesSegment
Profit SalesSegment
Profit
Organic growth/ Operational segment profit 2 % 9 % 4 % 9 % Foreign currency translation (6 )% (5 )% (1 )% (1 )% Acquisitions and divestitures, net 1 % 1 % 5 % 3 %
Total % Change (3 )% 5 % 8 % 11 %
• Sales in Energy, Safety & Security decreased by 2% (increased by 2% organic) principally due to the unfavorable impact of foreign currency translation partially offset by organic sales growth and acquisitions, net of divestitures. Organic sales growth was primarily due to increased sales volumes, most significantly in Security and Fire across all regions, as well as Sensing & Productivity Solutions.
• Sales in Building Solutions & Distribution decreased by 4% (increased by 2% organic) principally due to the unfavorable impact of foreign currency translation. Organic sales growth was primarily due to increased sales volume in Americas Distribution partially offset by softness in the project installation and U.S. energy retrofit businesses, which is expected to continue.

2014 compared with 2013
ACS sales increased primarily due to growth from acquisitions, net of divestitures and organic sales growth, partially offset by the unfavorable impact of foreign currency translation.
ACS segment profit increased due to an increase in operational segment profit and acquisitions, net of divestitures, partially offset by the unfavorable impact of foreign currency translation. The increase in operational segment profit is primarily the result of higher sales volumes as discussed above, and the positive impact of price and productivity, net of inflation partially offset by continued investment for growth. Cost of products and services sold increased primarily due to higher sales volume, acquisitions, net of divestitures and inflation, partially offset by productivity and the favorable impact of foreign currency translation.
Performance Materials and Technologies
2015 compared with 2014
Performance Materials and Technologies (PMT) sales decreased due to a decrease in organic sales volumes and the unfavorable impact of foreign currency translation.
21
• Sales in Energy, Safety & Security increased by 11% (4% organic) principally due to (i) acquisitions, net of divestitures, (ii) higher global sales volumes in our Environmental & Energy Solutions business driven by strong U.S. residential market conditions and new product introductions, (iii) increases in sales volumes in our Security and Fire and Industrial Safety businesses driven by organic growth in all regions and (iv) increases in sales volumes in our Sensing & Productivity Solutions business in the second half of 2014.
• Sales in Building Solutions & Distribution increased by 1% (2% organic) principally due to increased sales volumes in our Americas Distribution business partially offset by softness in the U.S. energy retrofit business. Building Solutions backlog increased in 2014.
2015 2014 Change 2013 Change
Net sales $ 9,235 $ 10,221 (10 )% $ 9,855 4 % Cost of products and services sold 6,262 7,221 6,974 Selling, general and administrative expenses 902 1,049 1,025 Other 136 134 131
Segment profit $ 1,935 $ 1,817 6 % $ 1,725 5 %
Factors Contributing to Year-Over-Year Change
2015 vs. 2014 2014 vs. 2013
SalesSegment
Profit SalesSegment
Profit
Organic growth/ Operational segment profit (6 )% 10 % 5 % 6 % Foreign currency translation (4 )% (4 )% (1 )% (1 )%
Total % Change (10 )% 6 % 4 % 5 %
• UOP sales decreased 7% (decreased 6% organic) driven primarily by lower gas processing revenues due to a significant slowdown in customer projects, which is expected to continue, and decreased equipment, engineering and licensing revenues partially offset by increased catalyst revenues.
• Process Solutions sales decreased 12% (decreased 3% organic) driven primarily by the unfavorable impact of foreign currency translation and lower volumes primarily due to weakness in projects and field products, which is expected to moderate during 2016.
• Advanced Materials sales decreased 10% (decreased 7% organic) primarily driven by lower raw material pass-through pricing and unplanned plant outages in Resins and Chemicals partially offset by increased volumes in Fluorine Products. We anticipate volatility in raw materials pass-through pricing to continue in 2016 primarily in Resins and Chemicals where sales fluctuate with the market price of certain raw materials, which are correlated to the price of oil.

PMT segment profit increased due to an increase in operational segment profit partially offset by the unfavorable impact of foreign currency translation. The increase in operational segment profit is primarily due to price and productivity net of inflation partially offset by lower organic sales volumes and continued investments for growth. Cost of products and services sold decreased primarily due to the favorable impacts of inflation, foreign currency translation, lower organic sales volumes and productivity, partially offset by continued investments for growth.
2014 compared with 2013
PMT sales increased due to an increase in organic sales partially offset by the unfavorable impact of foreign currency translation.
PMT segment profit increased due to an increase in operational segment profit partially offset by the unfavorable impact of foreign currency translation. The increase in operational segment profit is primarily due to higher sales volumes, as discussed above, and productivity, net of inflation partially offset by unfavorable Advanced Materials pricing, continued investment for growth and unfavorable foreign currency translation. Cost of products and services sold increased primarily due to higher volume and continued investment for growth partially offset by productivity, net of inflation and the favorable impact of foreign currency translation.
Repositioning Charges
See Note 3 Repositioning and Other Charges of Notes to Financial Statements for a discussion of our repositioning actions and related charges incurred in 2015, 2014 and 2013. These repositioning actions are expected to generate incremental pretax savings of $175 million to $200 million in 2016 compared with 2015 principally from planned workforce reductions. Cash spending related to our repositioning actions was $118 million, $161 million and $160 million in 2015, 2014 and 2013, and was funded through operating cash flows. In 2016, we expect cash spending for repositioning actions to be approximately $175 million and to be funded through operating cash flows.
22
• UOP sales increased by 8% driven primarily by higher catalyst and gas processing volumes partially offset by lower equipment and service revenues in the first nine months. Catalyst sales decreased in the fourth quarter due to the timing of shipments as well as stronger volume growth in the fourth quarter of 2013 as compared to 2014 which was partially offset by increased licensing revenues.
• Sales in our Process Solutions business increased by 1% (4% organic) driven primarily by volume growth in advanced solutions software and services and field products partially offset by unfavorable foreign currency translation, predominately in the fourth quarter. Project and service orders and backlog increased in 2014.
• Advanced Materials sales increased by 3% primarily driven by increased volume in Fluorine Products and Resins and Chemicals, partially offset by unfavorable pricing most significantly in Fluorine Products and lower raw materials pass-through pricing in Resins and Chemicals. We anticipate lower raw materials pass-through pricing to continue in 2015 primarily in Resins and Chemicals where sales fluctuate with the market price of certain raw materials, which are correlated to the price of oil.

LIQUIDITY AND CAPITAL RESOURCES
The Company continues to manage its businesses to maximize operating cash flows as the primary source of liquidity. In addition to our available cash and operating cash flows, additional sources of liquidity include committed credit lines, short-term debt from the commercial paper market, long-term borrowings, and access to the public debt and equity markets. We continue to balance our cash and financing uses through investment in our existing core businesses, acquisition activity, share repurchases and dividends.
Cash Flow Summary
Our cash flows from operating, investing and financing activities, as reflected in the Consolidated Statement of Cash Flows, are summarized as follows:
2015 compared with 2014
Cash provided by operating activities increased by $430 million primarily due to a $489 million favorable impact from working capital and a $382 million increase in net income before the non-cash pension mark-to-market adjustment, partially offset by (i) a $175 million decrease in customer advances and deferred income, (ii) $151 million in OEM incentives and (iii) increased cash tax payments of $50 million.
Cash used for investing activities increased by $4,638 million primarily due to an increase in cash paid for acquisitions of $5,224 million, most significantly the Elster Division of Melrose Industries plc (Elster), and a decrease in proceeds of $159 million, primarily from the Friction Materials divestiture, partially offset by a net $659 million decrease in investments, primarily short-term marketable securities.
Cash provided by financing activities increased by $2,374 million primarily due to an increase in the net proceeds from debt issuances of $3,648 million, partially offset by an increase in net repurchases of common stock of $1,039 million and an increase in cash dividends paid of $216 million.
2014 compared with 2013
Cash provided by operating activities increased by $689 million primarily due to (i) a $508 million increase of net income before the non-cash pension mark-to-market adjustment, (ii) reduced net payments for repositioning and other charges of $233 million primarily due to the collection of a $130 million asbestos receivable due from one of our insurance carriers and lower asbestos related payments of $98 million, (iii) reduced cash contributions to our pension and other postretirement plans of $131 million and (iv) lower cash tax payments of approximately $129 million, partially offset by a $93 million unfavorable impact from working capital primarily driven by higher inventory to support sales growth.
Cash used for investing activities decreased by $83 million primarily due to a decrease in cash paid for acquisitions of $1,129 million most significantly Intermec and RAE Systems, Inc. in 2013 and an increase in proceeds from the sales of businesses of $157 million (most significantly Friction Materials), partially offset by (i) a net $688 million increase in investments primarily short-term marketable securities, (ii) an increase of approximately $371 million in settlement payments of foreign currency exchange contracts used as economic hedges on certain non-functional currency
23
Years Ended December 31,2015 2014 2013
Cash provided by (used for): Operating activities $ 5,454 $ 5,024 $ 4,335 Investing activities (6,514 ) (1,876 ) (1,959 ) Financing activities 102 (2,272 ) (433 ) Effect of exchange rate changes on cash (546 ) (339 ) (155 )
Net increase in cash and cash equivalents $ (1,504 ) $ 537 $ 1,788
denominated monetary assets and liabilities and (iii) a $147 million increase in expenditures for property, plant and equipment.
Cash used for financing activities increased by $1,839 million primarily due to a decrease in the net proceeds from debt issuances of $1,589 million, an increase in cash dividends paid of $157 million and lower net proceeds from the issuance of common stock of $33 million.
Liquidity
Each of our businesses is focused on implementing strategies to increase operating cash flows through revenue growth, margin expansion and improved working capital turnover. Considering the current economic environment in which each of the businesses operate and their business plans and strategies, including the focus on growth, cost reduction and productivity initiatives, we believe that cash balances and operating cash flow will continue to be our principal source of liquidity. In addition to the available cash and operating cash flows, additional sources of liquidity include committed credit lines, short-term debt from the commercial paper markets, long-term borrowings, and access to the public debt and equity markets. At December 31, 2015, a substantial portion of the Company’s cash and cash equivalents were held by foreign subsidiaries. If the amounts held outside of the U.S. were to be repatriated, under current law, they would be subject to U.S. federal income taxes, less applicable foreign tax credits. However, our intent is to permanently reinvest the vast majority of these funds outside of the U.S. It is not practicable to estimate the amount of tax that might be payable if some or all of such earnings were to be repatriated, and the amount of foreign tax credits that would be available to reduce or eliminate the resulting U.S. income tax liability.
We monitor the third-party depository institutions that hold our cash and cash equivalents on a daily basis. Our emphasis is primarily safety of principal and secondarily maximizing yield of those funds. We diversify our cash and cash equivalents among counterparties to minimize exposure to any one of these entities.
A source of liquidity is our ability to issue short-term debt in the commercial paper market. Commercial paper notes are sold at a discount and have a maturity of not more than 365 days from date of issuance. Borrowings under the commercial paper program are available for general corporate purposes as well as for financing acquisitions. The weighted average interest rate on short-term borrowings and commercial paper outstanding at December 31, 2015 and 2014 was 0.26% and 0.60%.
Our ability to access the commercial paper market, and the related cost of these borrowings, is affected by the strength of our credit rating and market conditions. Our credit ratings are periodically reviewed by the major independent debt-rating agencies. As of December 31, 2015, Standard and Poor’s (S&P), Fitch, and Moody’s have ratings on our long-term debt of A, A and A2 and short-term debt of A-1, F1 and P1. S&P, Fitch and Moody’s have Honeywell’s rating outlook as “stable.” To date, the Company has not experienced any limitations in our ability to access these sources of liquidity.
We also have a current shelf registration statement filed with the Securities and Exchange Commission under which we may issue additional debt securities, common stock and preferred stock that may be offered in one or more offerings on terms to be determined at the time of the offering. Net proceeds of any offering would be used for general corporate purposes, including repayment of existing indebtedness, share repurchases, capital expenditures and acquisitions.
During 2015, the Company entered into credit agreements with a syndicate of banks. See Note 12 Long-term Debt and Credit Agreements of Notes to Financial Statements for further discussion on the credit agreements.
During 2015, the Company repurchased $1,884 million of outstanding shares to offset the dilutive impact of employee stock based compensation plans, including option exercises, restricted unit vesting and matching contributions under our savings plans. In December 2013, the Board of Directors authorized the repurchase of up to a total of $5 billion of Honeywell common stock, $2.2 billion remained available as of December 31, 2015 for additional share repurchases. Honeywell presently expects to repurchase outstanding shares from time to time to offset the dilutive impact of employee stock based compensation plans, including future option exercises, restricted unit vesting and matching contributions under our savings plans.
24

In addition to our normal operating cash requirements, our principal future cash requirements will be to fund capital expenditures, dividends, strategic acquisitions, share repurchases, employee benefit obligations, environmental remediation costs, asbestos claims, severance and exit costs related to repositioning actions and debt repayments.
Specifically, we expect our primary cash requirements in 2016 to be as follows:
We continuously assess the relative strength of each business in our portfolio as to strategic fit, market position, profit and cash flow contribution in order to upgrade our combined portfolio and identify business units that will most benefit from increased investment. We identify acquisition candidates that will further our strategic plan and strengthen our existing core businesses. We also identify businesses that do not fit into our long-term strategic plan based on their market position, relative profitability or growth potential. These businesses are considered for potential divestiture, restructuring or other repositioning actions subject to regulatory constraints. In 2015 and 2014, we realized $1 million and $160 million in cash proceeds from sales of non-strategic businesses.
Based on past performance and current expectations, we believe that our operating cash flows will be sufficient to meet our future operating cash needs. Our available cash, committed credit lines, access to the public debt and equity markets, provide additional sources of short-term and long-term liquidity to fund current operations, debt maturities, and future investment opportunities.
25
• Capital expenditures—we expect to spend approximately $1.1 billion for capital expenditures in 2016 primarily for growth, production and capacity expansion, cost reduction, maintenance, and replacement.
• Share repurchases—under the Company’s share repurchase program, $2.2 billion is available as of December 31, 2015 for additional share repurchases. Honeywell presently expects to repurchase outstanding shares from time to time to generally offset the dilutive impact of employee stock-based compensation plans, including option exercises, restricted unit vesting and matching contributions under our savings plans. The amount and timing of future repurchases may vary depending on market conditions and our level of operating, financing and other investing activities.
• Dividends—we increased our dividend rate by 15% to $.5950 per share of common stock effective with the fourth quarter 2015 dividend. The Company intends to continue to pay quarterly dividends in 2016.
• Asbestos claims—we expect our cash spending for asbestos claims and our cash receipts for related insurance recoveries to be approximately $295 million and $25 million in 2016.
• Pension contributions—in 2016, we are not required to make contributions to our U.S. pension plans. We plan to make contributions of cash and/or marketable securities of approximately $160 million ($106 million of marketable securities were contributed in January 2016) to our non-U.S. plans to satisfy regulatory funding standards. The timing and amount of contributions to both our U.S. and non-U.S. plans may be impacted by a number of factors, including the funded status of the plans.
• Repositioning actions—we expect that cash spending for severance and other exit costs necessary to execute repositioning actions will approximate $175 million in 2016.
• Environmental remediation costs—we expect to spend approximately $250 million in 2016 for remedial response and voluntary clean-up costs.
• Acquisitions—we acquired the remaining 30 percent noncontrolling interest in UOP Russell LLC for approximately $240 million in January 2016. In addition, in February 2016 we acquired COM DEV International for an aggregate purchase price of approximately $330 million and entered into a definitive agreement to acquire Xtralis International Holdings Limited for an aggregate purchase price of approximately $480 million.

Contractual Obligations and Probable Liability Payments
Following is a summary of our significant contractual obligations and probable liability payments at December 31, 2015:
Environmental Matters
Accruals for environmental matters deemed probable and reasonably estimable were $194 million, $268 million and $272 million in 2015, 2014 and 2013. In addition, in 2015 and 2014 we incurred operating costs for ongoing businesses of approximately $90 million and $88 million relating to compliance with environmental regulations.
Spending related to known environmental matters was $273 million, $321 million and $304 million in 2015, 2014 and 2013 and is estimated to be approximately $250 million in 2016. We expect to fund expenditures for these environmental matters from operating cash flow. The timing of cash expenditures depends on a numbers of factors, including the timing of litigation and settlements of remediation liability, personal injury and property damage claims, regulatory approval of cleanup projects, execution timeframe of projects, remedial techniques to be utilized and agreement with other parties.
See Note 19 Commitments and Contingencies of Notes to Financial Statements for further discussion of our environmental matters.
Financial Instruments
The following table illustrates the potential change in fair value for interest rate sensitive instruments based on a hypothetical immediate one percentage point increase in interest rates across all maturities and the potential change in fair value for foreign exchange rate sensitive instruments
26
Total(6)
Payments by Period
Thereafter20162017- 2018
2019- 2020
Long-term debt, including capitalized leases(1) $ 6,131 $ 577 $ 1,400 $ 904 $ 3,250 Interest payments on long-term debt, including
capitalized leases 3,047 290 494 344 1,919 Minimum operating lease payments 1,201 316 421 191 273 Purchase obligations(2) 1,980 962 623 392 3 Estimated environmental liability
payments(3) 518 253 190 55 20 Asbestos related liability payments(4) 1,543 292 775 382 94 Asbestos insurance recoveries(5) (449 ) (23 ) (110 ) (103 ) (213 )
$ 13,971 $ 2,667 $ 3,793 $ 2,165 $ 5,346
(1) Assumes all long-term debt is outstanding until scheduled maturity.
(2) Purchase obligations are entered into with various vendors in the normal course of business and are consistent with our expected requirements.
(3) The payment amounts in the table only reflect the environmental liabilities which are probable and reasonably estimable as of December 31, 2015.
(4) These amounts are estimates of asbestos related cash payments for NARCO and Bendix based on our asbestos related liabilities which are probable and reasonably estimable as of December 31, 2015. See Asbestos Matters in Note 19 Commitments and Contingencies of Notes to Financial Statements for additional information.
(5) These amounts represent our insurance recoveries that are deemed probable for asbestos related liabilities as of December 31, 2015. See Asbestos Matters in Note 19 Commitments and Contingencies of Notes to Financial Statements for additional information.
(6) The table excludes tax liability payments, including those for unrecognized tax benefits. See Note 5 Income Taxes of Notes to Financial Statements for additional information.

based on a 10% weakening of the U.S. Dollar versus local currency exchange rates across all maturities at December 31, 2015 and 2014.
See Note 14 Financial Instruments and Fair Value Measures of Notes to Financial Statements for further discussion on the agreements.
CRITICAL ACCOUNTING POLICIES
The preparation of our consolidated financial statements in accordance with generally accepted accounting principles is based on the selection and application of accounting policies that require us to make significant estimates and assumptions about the effects of matters that are inherently uncertain. We consider the accounting policies discussed below to be critical to the understanding of our financial statements. Actual results could differ from our estimates and assumptions, and any such differences could be material to our consolidated financial statements.
Contingent Liabilities—We are subject to a number of lawsuits, investigations and claims (some of which involve substantial dollar amounts) that arise out of the conduct of our global business operations or those of previously owned entities, including matters relating to commercial transactions, government contracts, product liability (including asbestos), prior acquisitions and divestitures, employee benefit plans, intellectual property, and environmental, health and safety matters. We continually assess the likelihood of any adverse judgments or outcomes to our contingencies, as well as potential amounts or ranges of probable losses, and recognize a liability, if any, for these contingencies based on a careful analysis of each matter with the assistance of outside legal counsel and, if applicable, other experts. Such analysis includes making judgments concerning matters such as the costs associated with environmental matters, the outcome of negotiations, the number and cost of pending and future asbestos claims, and the impact of evidentiary requirements. Because most contingencies are resolved over long periods of time, liabilities may change in the future due to new developments (including new discovery of facts, changes in legislation and outcomes of similar cases through the judicial system), changes in assumptions or changes in our settlement strategy. See Note 19 Commitments and Contingencies of Notes to Financial Statements for a discussion of
27
Face or Notional Amount
Carrying Value(1)
Fair Value(1)
Estimated Increase
(Decrease) in Fair
Value(2)December 31, 2015 Interest Rate Sensitive Instruments
Long-term debt (including current maturities) $ 6,131 $ (6,131 ) $ (6,721 ) $ (407 ) Interest rate swap agreements 1,100 92 92 (59 )
Foreign Exchange Rate Sensitive Instruments Foreign currency exchange contracts(3) 10,538 11 11 (153 )
December 31, 2014 Interest Rate Sensitive Instruments
Long-term debt (including current maturities) $ 6,985 $ (6,985 ) $ (7,817 ) $ (478 ) Interest rate swap agreements 1,100 93 93 (69 )
Foreign Exchange Rate Sensitive Instruments Foreign currency exchange contracts(3) 7,291 10 10 86
(1) Asset or (liability).
(2) A hypothetical immediate one percentage point decrease in interest rates across all maturities and a potential change in fair value of foreign exchange rate sensitive instruments based on a 10% strengthening of the U.S. dollar versus local currency exchange rates across all maturities will result in a change in fair value equal to the inverse of the amount disclosed in the table.
(3) Changes in the fair value of foreign currency exchange contracts are offset by changes in the fair value or cash flows of underlying hedged foreign currency transactions.

management’s judgment applied in the recognition and measurement of our environmental and asbestos liabilities which represent our most significant contingencies.
Asbestos Related Contingencies and Insurance Recoveries—Honeywell’s involvement in asbestos related personal injury actions relates to two predecessor companies. Regarding North American Refractories Company (NARCO) asbestos related claims, we accrued for pending claims based on terms and conditions in agreements with NARCO, its former parent company, and certain asbestos claimants, and an estimate of the unsettled claims pending as of the time NARCO filed for bankruptcy protection. We also accrued for the estimated value of future NARCO asbestos related claims expected to be asserted against the NARCO Trust through 2018. In light of the inherent uncertainties in making long term projections and in connection with the initial operation of a 524(g) trust, as well as the stay of all NARCO asbestos claims from January 2002 through the effective date of the NARCO Trust on April 30, 2013, we do not believe that we have a reasonable basis for estimating NARCO asbestos claims beyond 2018. Regarding Bendix asbestos related claims, we accrued for the estimated value of pending claims using average resolution values for the previous five years. We also accrued for the estimated value of future anticipated claims related to Bendix for the next five years based on historic claims filing experience and dismissal rates, disease classifications, and average resolution values in the tort system for the previous five years. In light of the uncertainties inherent in making long-term projections, as well as certain factors unique to friction product asbestos claims, we do not believe that we have a reasonable basis for estimating asbestos claims beyond the next five years.
In connection with the recognition of liabilities for asbestos related matters, we record asbestos related insurance recoveries that are deemed probable. In assessing the probability of insurance recovery, we make judgments concerning insurance coverage that we believe are reasonable and consistent with our historical dealings and our knowledge of any pertinent solvency issues surrounding insurers. While the substantial majority of our insurance carriers are solvent, some of our individual carriers are insolvent, which has been considered in our analysis of probable recoveries. Projecting future events is subject to various uncertainties that could cause the insurance recovery on asbestos related liabilities to be higher or lower than that projected and recorded. Given the inherent uncertainty in making future projections, we reevaluate our projections concerning our probable insurance recoveries in light of any changes to the projected liability, our recovery experience or other relevant factors that may impact future insurance recoveries.
See Note 19 Commitments and Contingencies of Notes to Financial Statements for a discussion of management’s judgments applied in the recognition and measurement of our asbestos-related liabilities and related insurance recoveries.
Defined Benefit Pension Plans—We sponsor both funded and unfunded U.S. and non-U.S. defined benefit pension plans. For financial reporting purposes, net periodic pension (income) expense is calculated annually based upon a number of actuarial assumptions, including a discount rate for plan obligations and an expected long-term rate of return on plan assets. Changes in the discount rate and expected long-term rate of return on plan assets could materially affect the annual pension (income) expense amount. Annual pension (income) expense is comprised of a potential mark-to-market adjustment (MTM Adjustment) and service and interest cost, assumed return on plan assets and prior service amortization (Pension Ongoing (Income) Expense).
The key assumptions used in developing our 2015, 2014 and 2013 net periodic pension (income) expense for our U.S. plans included the following:
The MTM Adjustment represents the recognition of net actuarial gains or losses in excess of the corridor. Net actuarial gains and losses occur when the actual experience differs from any of the
28
2015 2014 2013
Discount rate 4.08 % 4.89 % 4.06 % Assets:
Expected rate of return 7.75 % 7.75 % 7.75 % Actual rate of return 2 % 8 % 23 % Actual 10 year average annual compounded rate of return 7 % 8 % 8 %

various assumptions used to value our pension plans or when assumptions change. The primary factors contributing to actuarial gains and losses are changes in the discount rate used to value pension obligations as of the measurement date each year and the difference between expected and actual returns on plan assets. The mark-to-market accounting method results in the potential for volatile and difficult to forecast MTM Adjustments. MTM charges were $67 million, $249 million and $51 million in 2015, 2014 and 2013.
We determine the expected long-term rate of return on plan assets utilizing historical plan asset returns over varying long-term periods combined with our expectations of future market conditions and asset mix considerations (see Note 20 Pension and Other Postretirement Benefits of Notes to Financial Statements for details on the actual various asset classes and targeted asset allocation percentages for our pension plans). We plan to continue to use an expected rate of return on plan assets of 7.75% for 2016 as this is a long-term rate based on historical plan asset returns over varying long term periods combined with our expectations of future market conditions and the asset mix of the plan’s investments.
The discount rate reflects the market rate on December 31 (measurement date) for high-quality fixed-income investments with maturities corresponding to our benefit obligations and is subject to change each year. The discount rate can be volatile from year to year as it is determined based upon prevailing interest rates as of the measurement date. We will use a 4.46% discount rate as of December 31, 2015, reflecting the increase in the market interest rate environment since the prior year-end.
In addition to the potential for MTM Adjustments, changes in our expected rate of return on plan assets and discount rate resulting from economic events also affects future pension ongoing (income) expense. The following table highlights the sensitivity of our U.S. pension obligations and ongoing (income) expense to changes in these assumptions, assuming all other assumptions remain constant. These estimates exclude any potential MTM Adjustment:
Pension ongoing income for all of our pension plans is expected to be approximately $580 million in 2016 compared with pension ongoing income of $430 million in 2015. The expected increase is primarily due to lower service and interest costs resulting mainly from the change in our discount rate methodology as described in Note 20 Pension and Other Postretirement Benefits of Notes to Financial Statements and the plan amendment in the fourth quarter of 2015 to freeze final average compensation in our U.S. pension plans as of December 31, 2015 partially offset by the impact of lower asset returns in 2015. Also, if required, an MTM Adjustment will be recorded in the fourth quarter of 2016 in accordance with our pension accounting method as previously described. It is difficult to reliably forecast or predict whether there will be a MTM Adjustment in 2016, and if one is required what the magnitude of such adjustment will be. MTM Adjustments are primarily driven by events and circumstances beyond the control of the Company such as changes in interest rates and the performance of the financial markets.
Long-Lived Assets (including Tangible and Finite-Lived Intangible Assets)—The determination of useful lives (for depreciation/amortization purposes) and whether or not tangible and intangible assets are impaired involves the use of accounting estimates and assumptions, changes in which could materially impact our financial condition or operating performance if actual results differ from such estimates and assumptions. We evaluate the recoverability of the carrying amount of our long-lived assets whenever events or changes in circumstances indicate that the carrying amount of a long-lived asset group may not be fully recoverable. The principal factors in considering when to perform an impairment review are as follows:
29
Change in AssumptionImpact on 2016
Pension Ongoing Expense Impact on PBO
0.25 percentage point decrease in discount rate Decrease $19 million Increase $490 million 0.25 percentage point increase in discount rate Increase $17 million Decrease $470 million 0.25 percentage point decrease in expected rate of return on
assets Increase $40 million — 0.25 percentage point increase in expected rate of return on
assets Decrease $40 million —

Once it is determined that an impairment review is necessary, recoverability of assets is measured by comparing the carrying amount of the asset grouping to the estimated future undiscounted cash flows. If the carrying amount exceeds the estimated future undiscounted cash flows, the asset grouping is considered to be impaired. The impairment is then measured as the difference between the carrying amount of the asset grouping and its fair value. We endeavor to utilize the best information available to measure fair value, which is usually either market prices (if available), level 1 or level 2 of the fair value hierarchy, or an estimate of the future discounted cash flow, level 3 of the fair value hierarchy. The key estimates in our discounted cash flow analysis include expected industry growth rates, our assumptions as to volume, selling prices and costs, and the discount rate selected.
Goodwill and Indefinite-Lived Intangible Assets Impairment Testing—In testing goodwill and indefinite-lived intangible assets, the fair value is estimated utilizing a discounted cash flow approach utilizing cash flow forecasts in our five year strategic and annual operating plans adjusted for terminal value assumptions. These impairment tests involve the use of accounting estimates and assumptions, changes in which could materially impact our financial condition or operating performance if actual results differ from such estimates and assumptions. To address this uncertainty we perform sensitivity analysis on key estimates and assumptions.
Income Taxes—On a recurring basis, we assess the need for a valuation allowance against our deferred tax assets by considering all available positive and negative evidence, such as past operating results, projections of future taxable income, enacted tax law changes and the feasibility and impact of tax planning initiatives. Our projections of future taxable income include a number of estimates and assumptions regarding our volume, pricing and costs, as well as the timing and amount of reversals of taxable temporary differences.
Sales Recognition on Long-Term Contracts—In 2015, we recognized approximately 14% of our total net sales using the percentage-of-completion method for long-term contracts. These long-term contracts are measured on the cost-to-cost basis for engineering-type contracts and the units-of-delivery basis for production-type contracts. Accounting for these contracts involves management judgment in estimating total contract revenue and cost. Contract revenues are largely determined by negotiated contract prices and quantities, modified by our assumptions regarding contract options, change orders, incentive and award provisions associated with technical performance and price adjustment clauses (such as inflation or index-based clauses). Contract costs are incurred over a period of time, which can be several years, and the estimation of these costs requires management judgment. Cost estimates are largely based on negotiated or estimated purchase contract terms, historical performance trends and other economic projections. Significant factors that influence these estimates include inflationary trends, technical and schedule risk, internal and subcontractor performance trends, business volume assumptions, asset utilization, and anticipated labor agreements. Revenue and cost estimates are regularly monitored and revised based on changes in circumstances. Anticipated losses on long-term contracts are recognized when such losses become evident. We maintain financial controls over the customer qualification, contract pricing and estimation processes to reduce the risk of contract losses.
30
• Significant under-performance (i.e., declines in sales, earnings or cash flows) of a business or product line in relation to expectations;
• Annual operating plans or five-year strategic plans that indicate an unfavorable trend in operating performance of a business or product line;
• Significant negative industry or economic trends; or
• Significant changes or planned changes in our use of the assets.

OTHER MATTERS
Litigation
See Note 19 Commitments and Contingencies of Notes to Financial Statements for a discussion of environmental, asbestos and other litigation matters.
Recent Accounting Pronouncements
See Note 1 Summary of Significant Accounting Policies of Notes to Financial Statements for a discussion of recent accounting pronouncements.
Item 7A. Quantitative and Qualitative Disclosures About Market Risks
Information relating to market risks is included in Item 7. Management’s Discussion and Analysis of Financial Condition and Results of Operations under the caption “Financial Instruments”.
31
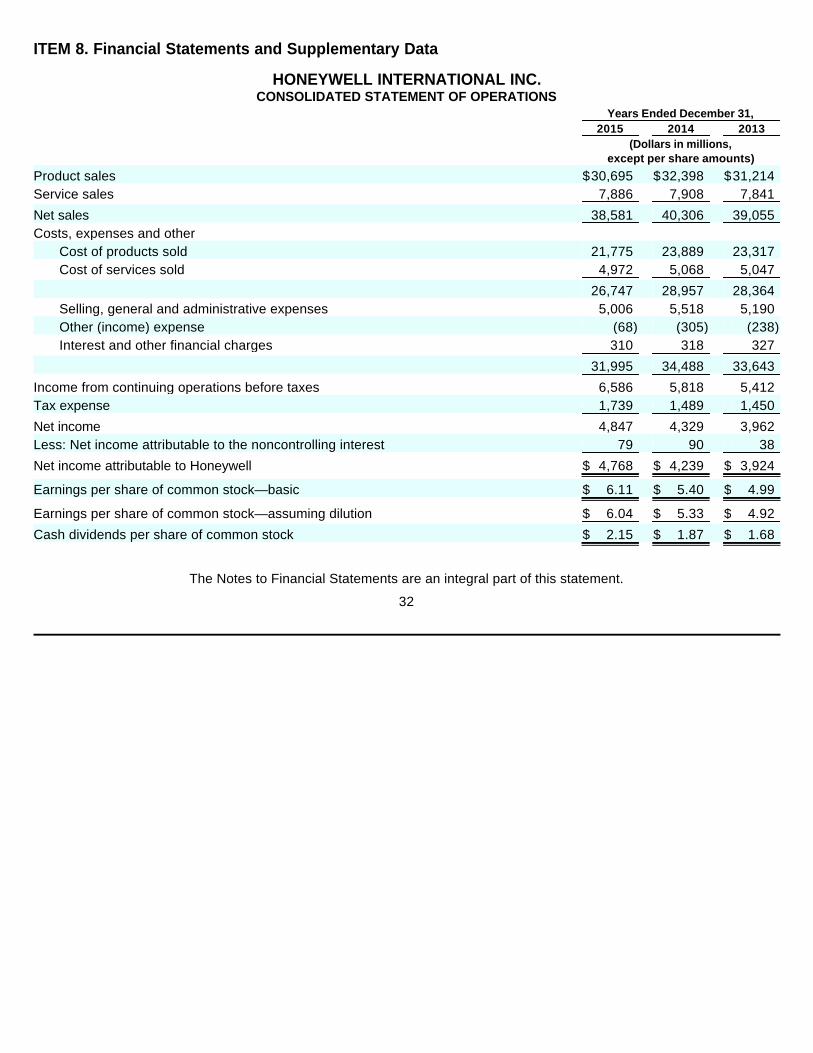
ITEM 8. Financial Statements and Supplementary Data
HONEYWELL INTERNATIONAL INC. CONSOLIDATED STATEMENT OF OPERATIONS
The Notes to Financial Statements are an integral part of this statement.
32
Years Ended December 31,2015 2014 2013
(Dollars in millions,
except per share amounts) Product sales $ 30,695 $ 32,398 $ 31,214 Service sales 7,886 7,908 7,841
Net sales 38,581 40,306 39,055 Costs, expenses and other
Cost of products sold 21,775 23,889 23,317 Cost of services sold 4,972 5,068 5,047
26,747 28,957 28,364 Selling, general and administrative expenses 5,006 5,518 5,190 Other (income) expense (68 ) (305 ) (238 ) Interest and other financial charges 310 318 327
31,995 34,488 33,643
Income from continuing operations before taxes 6,586 5,818 5,412 Tax expense 1,739 1,489 1,450
Net income 4,847 4,329 3,962 Less: Net income attributable to the noncontrolling interest 79 90 38
Net income attributable to Honeywell $ 4,768 $ 4,239 $ 3,924
Earnings per share of common stock—basic $ 6.11 $ 5.40 $ 4.99
Earnings per share of common stock—assuming dilution $ 6.04 $ 5.33 $ 4.92
Cash dividends per share of common stock $ 2.15 $ 1.87 $ 1.68

HONEYWELL INTERNATIONAL INC.
CONSOLIDATED STATEMENT OF COMPREHENSIVE INCOME
The Notes to Financial Statements are an integral part of this statement.
33
Years Ended December 31,2015 2014 2013
(Dollars in millions) Net income $ 4,847 $ 4,329 $ 3,962 Other comprehensive income (loss), net of tax
Foreign exchange translation adjustment (1,152 ) (1,044 ) (52 ) Actuarial gains (losses) (464 ) (1,411 ) 2,064 Prior service credit 446 73 99 Prior service cost (credit) recognized during year (13 ) (2 ) 5 Actuarial losses recognized during year 72 202 61 Transition obligation recognized during year — 1 2 Settlements and curtailments 2 — (26 ) Foreign exchange translation and other 41 54 (2 )
Pensions and other postretirement benefit adjustments 84 (1,083 ) 2,203 Unrealized gains for the period — 15 140 Less: reclassification adjustment for gains included in net income — 185 127
Changes in fair value of available for sale investments — (170 ) 13 Effective portion of cash flow hedges recognized in other comprehensive income 91 20 (30 ) Less: reclassification adjustment for gains (losses) included in net income 99 — (23 )
Changes in fair value of effective cash flow hedges (8 ) 20 (7 ) Other comprehensive income (loss), net of tax (1,076 ) (2,277 ) 2,157 Comprehensive income 3,771 2,052 6,119
Less: Comprehensive income attributable to the noncontrolling interest 73 87 36
Comprehensive income attributable to Honeywell $ 3,698 $ 1,965 $ 6,083

HONEYWELL INTERNATIONAL INC.
CONSOLIDATED BALANCE SHEET
The Notes to Financial Statements are an integral part of this statement.
34
December 31,2015 2014
(Dollars in millions) ASSETS Current assets:
Cash and cash equivalents $ 5,455 $ 6,959 Accounts, notes and other receivables 8,075 7,960 Inventories 4,420 4,405 Deferred income taxes — 722 Investments and other current assets 2,103 2,145
Total current assets 20,053 22,191 Investments and long-term receivables 517 465 Property, plant and equipment—net 5,789 5,383 Goodwill 15,895 12,788 Other intangible assets—net 4,577 2,208 Insurance recoveries for asbestos related liabilities 426 454 Deferred income taxes 283 404 Other assets 1,776 1,558
Total assets $ 49,316 $ 45,451 LIABILITIES Current liabilities:
Accounts payable $ 5,580 $ 5,365 Commercial paper and other short-term borrowings 5,937 1,698 Current maturities of long-term debt 577 939 Accrued liabilities 6,277 6,771
Total current liabilities 18,371 14,773 Long-term debt 5,554 6,046 Deferred income taxes 558 236 Postretirement benefit obligations other than pensions 526 911 Asbestos related liabilities 1,251 1,200 Other liabilities 4,348 4,282 Redeemable noncontrolling interest 290 219 SHAREOWNERS’ EQUITY Capital—common stock issued 958 958
—additional paid-in capital 5,377 5,038 Common stock held in treasury, at cost (11,664 ) (9,995 ) Accumulated other comprehensive income (loss) (2,535 ) (1,459 ) Retained earnings 26,147 23,115
Total Honeywell shareowners’ equity 18,283 17,657 Noncontrolling interest 135 127
Total shareowners’ equity 18,418 17,784
Total liabilities, redeemable noncontrolling interest and shareowners’ equity $ 49,316 $ 45,451

HONEYWELL INTERNATIONAL INC.
CONSOLIDATED STATEMENT OF CASH FLOWS Years Ended December 31,2015 2014 2013
(Dollars in millions) Cash flows from operating activities:
Net income $ 4,847 $ 4,329 $ 3,962 Less: Net income attributable to the noncontrolling interest 79 90 38
Net income attributable to Honeywell 4,768 4,239 3,924 Adjustments to reconcile net income attributable to Honeywell to net cash provided by operating
activities: Depreciation 672 667 670 Amortization 211 257 319 Loss on sale of non-strategic businesses and assets 1 11 20 Gain on sale of available for sale investments — (221 ) (195 ) Repositioning and other charges 546 598 663 Net payments for repositioning and other charges (537 ) (530 ) (763 ) Pension and other postretirement (income) expense (323 ) 44 (19 ) Pension and other postretirement benefit payments (122 ) (167 ) (298 ) Stock compensation expense 175 187 170 Deferred income taxes 315 132 262 Excess tax benefits from share based payment arrangements (81 ) (102 ) (132 ) Other (8 ) (327 ) 308 Changes in assets and liabilities, net of the effects of acquisitions and divestitures:
Accounts, notes and other receivables 211 (172 ) (365 ) Inventories 230 (200 ) 41 Other current assets 80 120 (421 ) Accounts payable (17 ) 307 352 Accrued liabilities (667 ) 181 (201 )
Net cash provided by operating activities 5,454 5,024 4,335 Cash flows from investing activities:
Expenditures for property, plant and equipment (1,073 ) (1,094 ) (947 ) Proceeds from disposals of property, plant and equipment 15 18 15 Increase in investments (6,714 ) (4,074 ) (1,220 ) Decrease in investments 6,587 3,288 1,122 Cash paid for acquisitions, net of cash acquired (5,228 ) (4 ) (1,133 ) Proceeds from sales of businesses, net of fees paid 1 160 3 Other (102 ) (170 ) 201
Net cash used for investing activities (6,514 ) (1,876 ) (1,959 ) Cash flows from financing activities:
Net increase in commercial paper and other short-term borrowings 4,265 309 930 Proceeds from issuance of common stock 186 265 447 Proceeds from issuance of long-term debt 60 97 1,063 Payments of long-term debt (880 ) (609 ) (607 ) Excess tax benefits from share based payment arrangements 81 102 132 Repurchases of common stock (1,884 ) (924 ) (1,073 ) Cash dividends paid (1,726 ) (1,510 ) (1,353 ) Other — (2 ) 28
Net cash provided by (used for) financing activities 102 (2,272 ) (433 ) Effect of foreign exchange rate changes on cash and cash equivalents (546 ) (339 ) (155 ) Net (decrease) increase in cash and cash equivalents (1,504 ) 537 1,788 Cash and cash equivalents at beginning of period 6,959 6,422 4,634
Cash and cash equivalents at end of period $ 5,455 $ 6,959 $ 6,422

The Notes to Financial Statements are an integral part of this statement.
35

HONEYWELL INTERNATIONAL INC.
CONSOLIDATED STATEMENT OF SHAREOWNERS’ EQUITY
The Notes to Financial Statements are an integral part of this statement.
36
Years Ended December 31,2015 2014 2013
Shares $ Shares $ Shares $
(in millions) Common stock, par value 957.6 958 957.6 958 957.6 958 Additional paid-in capital Beginning balance 5,038 4,682 4,358
Issued for employee savings and option plans 164 175 155 Stock-based compensation expense 175 187 170 Other owner changes — (6 ) (1 )
Ending balance 5,377 5,038 4,682 Treasury stock Beginning balance (175.4 ) (9,995 ) (173.8 ) (9,374 ) (174.8 ) (8,801 )
Reacquired stock or repurchases of common stock (18.8 ) (1,884 ) (10.0 ) (924 ) (13.5 ) (1,073 ) Issued for employee savings and option plans 6.7 215 8.4 303 14.5 500 Other owner changes 0.3 — — — — —
Ending balance (187.2 ) (11,664 ) (175.4 ) (9,995 ) (173.8 ) (9,374 ) Retained earnings Beginning balance 23,115 20,383 17,799
Net income attributable to Honeywell 4,768 4,239 3,924 Dividends on common stock (1,686 ) (1,478 ) (1,329 ) Redemption value adjustment (50 ) (29 ) (11 )
Ending balance 26,147 23,115 20,383 Accumulated other comprehensive income (loss) Beginning balance (1,459 ) 818 (1,339 )
Foreign exchange translation adjustment (1,152 ) (1,044 ) (52 ) Pensions and other postretirement benefit adjustments 84 (1,083 ) 2,203 Changes in fair value of available for sale investments — (170 ) 13 Changes in fair value of effective cash flow hedges (8 ) 20 (7 )
Ending balance (2,535 ) (1,459 ) 818 Noncontrolling interest Beginning balance 127 112 90
Acquisitions 3 — — Interest sold (bought) — (7 ) — Net income attributable to noncontrolling interest 35 40 9 Foreign exchange translation adjustment (6 ) (3 ) (2 ) Dividends paid (26 ) (17 ) (16 ) Contributions from noncontrolling interest holders — 5 28 Other owner changes 2 (3 ) 3
Ending balance 135 127 112
Total shareowners’ equity 770.4 18,418 782.2 17,784 783.8 17,579

HONEYWELL INTERNATIONAL INC. NOTES TO FINANCIAL STATEMENTS
(Dollars in millions, except per share amounts)
Note 1. Summary of Significant Accounting Policies
Accounting Principles—The financial statements and accompanying notes are prepared in accordance with accounting principles generally accepted in the United States of America. The following is a description of Honeywell’s significant accounting policies.
Principles of Consolidation—The consolidated financial statements include the accounts of Honeywell International Inc. and all of its subsidiaries and entities in which a controlling interest is maintained. Our consolidation policy requires equity investments that we exercise significant influence over but do not control the investee and are not the primary beneficiary of the investee’s activities to be accounted for using the equity method. Investments through which we are not able to exercise significant influence over the investee and which we do not have readily determinable fair values are accounted for under the cost method. All intercompany transactions and balances are eliminated in consolidation.
Redeemable noncontrolling interest is considered to be temporary equity and is therefore reported outside of permanent equity on the Consolidated Balance Sheet at the greater of the initial carrying amount adjusted for the noncontrolling interest’s share of net income (loss) or its redemption value.
Property, Plant and Equipment—Property, plant and equipment are recorded at cost, including any asset retirement obligations, less accumulated depreciation. For financial reporting, the straight-line method of depreciation is used over the estimated useful lives of 10 to 50 years for buildings and improvements and 2 to 16 years for machinery and equipment. Recognition of the fair value of obligations associated with the retirement of tangible long-lived assets is required when there is a legal obligation to incur such costs. Upon initial recognition of a liability, the cost is capitalized as part of the related long-lived asset and depreciated over the corresponding asset’s useful life.
Goodwill and Indefinite-Lived Intangible Assets—Goodwill and indefinite-lived intangible assets are subject to impairment testing annually as of March 31, or whenever events or changes in circumstances indicate that the carrying amount may not be fully recoverable. This testing compares carrying values to fair values and, when appropriate, the carrying value of these assets is reduced to fair value. We completed our annual goodwill impairment test as of March 31, 2015 and determined that there was no impairment as of that date.
Other Intangible Assets with Determinable Lives—Other intangible assets with determinable lives consist of customer lists, technology, patents and trademarks and other intangibles and are amortized over their estimated useful lives, ranging from 2 to 24 years.
Sales Recognition—Product and service sales are recognized when persuasive evidence of an arrangement exists, product delivery has occurred or services have been rendered, pricing is fixed or determinable, and collection is reasonably assured. Service sales, principally representing repair, maintenance and engineering activities are recognized over the contractual period or as services are rendered. Sales under long-term contracts are recorded on a percentage-of-completion method measured on the cost-to-cost basis for engineering-type contracts and the units-of-delivery basis for production-type contracts. Provisions for anticipated losses on long-term contracts are recorded in full when such losses become evident. Revenues from contracts with multiple element arrangements are recognized as each element is earned based on the relative fair value of each element provided the delivered elements have value to customers on a standalone basis. Amounts allocated to each element are based on its objectively determined fair value, such as the sales price for the product or service when it is sold separately or competitor prices for similar products or services.
Environmental—We accrue costs related to environmental matters when it is probable that we have incurred a liability related to a contaminated site and the amount can be reasonably estimated. For additional information, see Note 19 Commitments and Contingencies.
Asbestos Related Contingencies and Insurance Recoveries—We recognize a liability for any asbestos related contingency that is probable of occurrence and reasonably estimable. In connection
37

HONEYWELL INTERNATIONAL INC. NOTES TO FINANCIAL STATEMENTS—(Continued)
(Dollars in millions, except per share amounts)
with the recognition of liabilities for asbestos related matters, we record asbestos related insurance recoveries that are deemed probable. For additional information, see Note 19 Commitments and Contingencies.
Aerospace Sales Incentives—We provide sales incentives to commercial aircraft manufacturers and airlines in connection with their selection of our aircraft equipment, predominately wheel and braking system hardware, avionics, and auxiliary power units, for installation on commercial aircraft. These incentives consist of free or deeply discounted products, credits for future purchases of product and upfront cash payments. These costs are recognized in the period incurred as cost of products sold or as a reduction to sales, as appropriate.
Research and Development—Research and development costs for company-sponsored research and development projects are expensed as incurred. Such costs are principally included in cost of products sold and were $1,856 million, $1,892 million and $1,804 million in 2015, 2014 and 2013.
Stock-Based Compensation Plans—The principal awards issued under our stock-based compensation plans, which are described in Note 18 Stock-Based Compensation Plans, are non-qualified stock options and restricted stock units. The cost for such awards is measured at the grant date based on the fair value of the award. The value of the portion of the award that is ultimately expected to vest is recognized as expense over the requisite service periods (generally the vesting period of the equity award) and is included in selling, general and administrative expenses. Forfeitures are estimated at the time of grant to recognize expense for those awards that are expected to vest and are based on our historical forfeiture rates.
Pension Benefits—We recognize net actuarial gains or losses in excess of 10% of the greater of the fair value of plan assets or the plans’ projected benefit obligation (the corridor) annually in the fourth quarter each year (MTM Adjustment), and, if applicable, in any quarter in which an interim remeasurement is triggered. The remaining components of pension (income) expense, primarily service and interest costs and assumed return on plan assets, are recognized on a quarterly basis (Pension ongoing (income) expense).
Foreign Currency Translation—Assets and liabilities of subsidiaries operating outside the United States with a functional currency other than U.S. Dollars are translated into U.S. Dollars using year-end exchange rates. Sales, costs and expenses are translated at the average exchange rates in effect during the year. Foreign currency translation gains and losses are included as a component of accumulated other comprehensive income (loss). For subsidiaries operating in highly inflationary environments, inventories and property, plant and equipment, including related expenses, are remeasured at the exchange rate in effect on the date the assets were acquired, while monetary assets and liabilities are remeasured at year-end exchange rates. Remeasurement adjustments for these subsidiaries are included in earnings.
Derivative Financial Instruments—We minimize our risks from interest and foreign currency exchange rate fluctuations through our normal operating and financing activities and, when deemed appropriate through the use of derivative financial instruments. Derivative financial instruments are used to manage risk and are not used for trading or other speculative purposes and we do not use leveraged derivative financial instruments. Derivative financial instruments that qualify for hedge accounting must be designated and effective as a hedge of the identified risk exposure at the inception of the contract. Accordingly, changes in fair value of the derivative contract must be highly correlated with changes in fair value of the underlying hedged item at inception of the hedge and over the life of the hedge contract.
All derivatives are recorded on the balance sheet as assets or liabilities and measured at fair value. For derivatives designated as hedges of the fair value of assets or liabilities, the changes in fair values of both the derivatives and the hedged items are recorded in current earnings. For derivatives
38

HONEYWELL INTERNATIONAL INC. NOTES TO FINANCIAL STATEMENTS—(Continued)
(Dollars in millions, except per share amounts)
designated as cash flow hedges, the effective portion of the changes in fair value of the derivatives are recorded in accumulated other comprehensive income (loss) and subsequently recognized in earnings when the hedged items impact earnings. Cash flows of such derivative financial instruments are classified consistent with the underlying hedged item.
Income Taxes—Significant judgment is required in evaluating tax positions. We establish additional reserves for income taxes when, despite the belief that tax positions are fully supportable, there remain certain positions that do not meet the minimum recognition threshold. The approach for evaluating certain and uncertain tax positions is defined by the authoritative guidance which determines when a tax position is more likely than not to be sustained upon examination by the applicable taxing authority. In the normal course of business, the Company and its subsidiaries are examined by various federal, state and foreign tax authorities. We regularly assess the potential outcomes of these examinations and any future examinations for the current or prior years in determining the adequacy of our provision for income taxes. We continually assess the likelihood and amount of potential adjustments and adjust the income tax provision, the current tax liability and deferred taxes in the period in which the facts that give rise to a change in estimate become known.
Earnings Per Share—Basic earnings per share is based on the weighted average number of common shares outstanding. Diluted earnings per share is based on the weighted average number of common shares outstanding and all dilutive potential common shares outstanding.
Reclassifications—Certain prior year amounts have been reclassified to conform to the current year presentation.
Recent Accounting Pronouncements—We consider the applicability and impact of all Accounting Standards Updates (ASUs). ASUs not listed below were assessed and determined to be either not applicable or are expected to have minimal impact on our consolidated financial position or results of operations.
In November 2015, the Financial Accounting Standards Board (FASB) issued guidance to simplify the presentation of deferred income taxes by permitting classification of all deferred tax assets and liabilities as noncurrent on the consolidated balance sheet. The Company has elected to early adopt the guidance on a prospective basis effective with the consolidated balance sheet as of December 31, 2015. This is a change from the Company’s historical presentation whereby certain deferred tax assets and liabilities were classified as current and the remainder were classified as non-current. Adoption of the guidance resulted in a reclassification of $662 million from current assets and $32 million from current liabilities within the consolidated balance sheet as of December 31, 2015.
In May 2014, the FASB issued guidance on revenue from contracts with customers that will supersede most current revenue recognition guidance, including industry-specific guidance. The underlying principle is that an entity will recognize revenue to depict the transfer of goods or services to customers at an amount that the entity expects to be entitled to in exchange for those goods or services. The guidance provides a five-step analysis of transactions to determine when and how revenue is recognized. Other major provisions include capitalization of certain contract costs, consideration of time value of money in the transaction price, and allowing estimates of variable consideration to be recognized before contingencies are resolved in certain circumstances. The guidance also requires enhanced disclosures regarding the nature, amount, timing and uncertainty of revenue and cash flows arising from an entity’s contracts with customers. The effective date was deferred for one year to the interim and annual periods beginning on or after December 15, 2017. Early adoption is permitted as of the original effective date–interim and annual periods beginning on or after December 15, 2016. The guidance permits the use of either a retrospective or cumulative effect transition method. We have not yet selected a transition method and are currently evaluating the impact of the amended guidance on our consolidated financial position, results of operations and related disclosures.
39
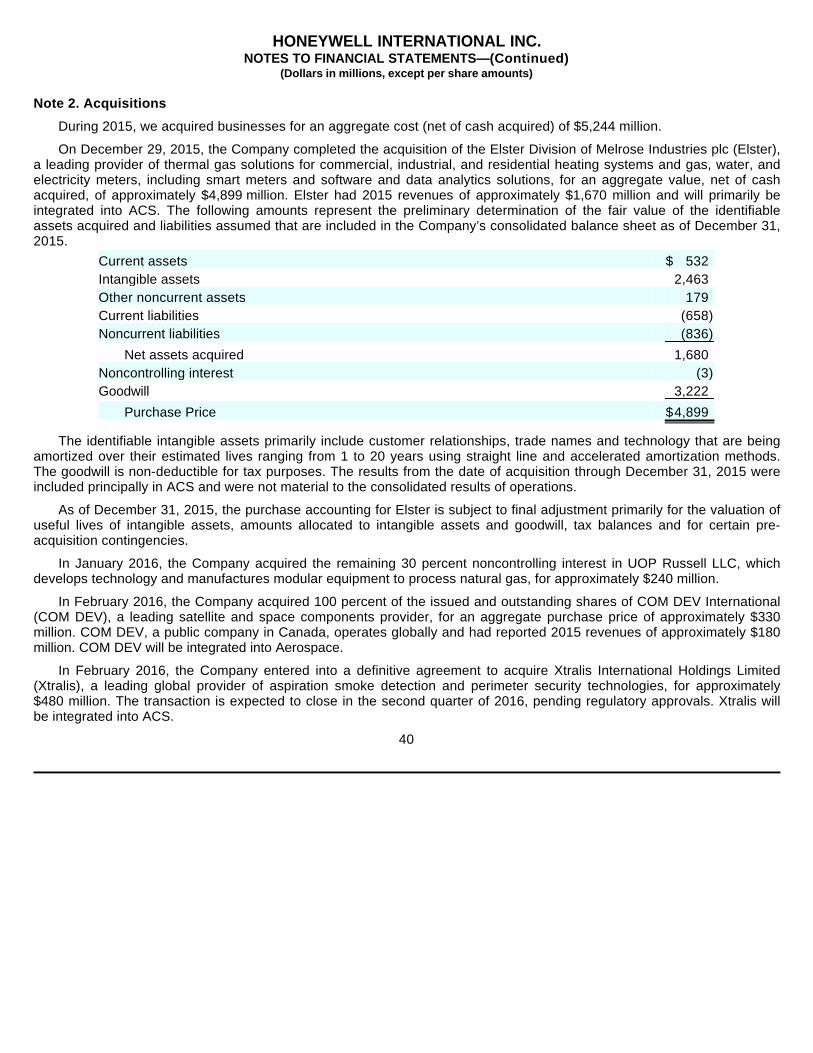
HONEYWELL INTERNATIONAL INC. NOTES TO FINANCIAL STATEMENTS—(Continued)
(Dollars in millions, except per share amounts)
Note 2. Acquisitions
During 2015, we acquired businesses for an aggregate cost (net of cash acquired) of $5,244 million.
On December 29, 2015, the Company completed the acquisition of the Elster Division of Melrose Industries plc (Elster), a leading provider of thermal gas solutions for commercial, industrial, and residential heating systems and gas, water, and electricity meters, including smart meters and software and data analytics solutions, for an aggregate value, net of cash acquired, of approximately $4,899 million. Elster had 2015 revenues of approximately $1,670 million and will primarily be integrated into ACS. The following amounts represent the preliminary determination of the fair value of the identifiable assets acquired and liabilities assumed that are included in the Company’s consolidated balance sheet as of December 31, 2015.
The identifiable intangible assets primarily include customer relationships, trade names and technology that are being amortized over their estimated lives ranging from 1 to 20 years using straight line and accelerated amortization methods. The goodwill is non-deductible for tax purposes. The results from the date of acquisition through December 31, 2015 were included principally in ACS and were not material to the consolidated results of operations.
As of December 31, 2015, the purchase accounting for Elster is subject to final adjustment primarily for the valuation of useful lives of intangible assets, amounts allocated to intangible assets and goodwill, tax balances and for certain pre-acquisition contingencies.
In January 2016, the Company acquired the remaining 30 percent noncontrolling interest in UOP Russell LLC, which develops technology and manufactures modular equipment to process natural gas, for approximately $240 million.
In February 2016, the Company acquired 100 percent of the issued and outstanding shares of COM DEV International (COM DEV), a leading satellite and space components provider, for an aggregate purchase price of approximately $330 million. COM DEV, a public company in Canada, operates globally and had reported 2015 revenues of approximately $180 million. COM DEV will be integrated into Aerospace.
In February 2016, the Company entered into a definitive agreement to acquire Xtralis International Holdings Limited (Xtralis), a leading global provider of aspiration smoke detection and perimeter security technologies, for approximately $480 million. The transaction is expected to close in the second quarter of 2016, pending regulatory approvals. Xtralis will be integrated into ACS.
40
Current assets $ 532 Intangible assets 2,463 Other noncurrent assets 179 Current liabilities (658 ) Noncurrent liabilities (836 )
Net assets acquired 1,680 Noncontrolling interest (3 ) Goodwill 3,222
Purchase Price $ 4,899

HONEYWELL INTERNATIONAL INC. NOTES TO FINANCIAL STATEMENTS—(Continued)
(Dollars in millions, except per share amounts)
Note 3. Repositioning and Other Charges
A summary of repositioning and other charges follows:
The following table summarizes the pretax distribution of total net repositioning and other charges by income statement classification:
The following table summarizes the pretax impact of total net repositioning and other charges by segment:
In 2015, we recognized repositioning charges totaling $216 million including severance costs of $197 million related to workforce reductions of 6,405 manufacturing and administrative positions across all of our segments. The workforce reductions were primarily related to cost savings actions taken in connection with our productivity and ongoing functional transformation initiatives. Also, $53 million of previously established accruals, primarily for severance, mainly in Aerospace and ACS, were returned to income in 2015 due principally to higher attrition than anticipated in prior severance programs resulting in lower required severance payments, and changes in scope of previously announced repositioning actions.
In 2014, we recognized repositioning charges totaling $184 million including severance costs of $156 million related to workforce reductions of 2,975 manufacturing and administrative positions across all of our segments. The workforce reductions were primarily related to cost savings actions taken in connection with our productivity and ongoing functional transformation initiatives, factory transitions in ACS and Aerospace to more cost-effective locations, and site consolidations and organizational realignments of businesses in ACS and PMT. Also, $38 million of previously established accruals, primarily for severance, mainly in Aerospace and ACS, were returned to income in 2014 due principally
41
Years Ended December 31,
2015 2014 2013
Severance $ 197 $ 156 $ 186 Asset impairments 13 12 23 Exit costs 6 16 22 Reserve adjustments (53 ) (38 ) (30 )
Total net repositioning charge 163 146 201
Asbestos related litigation charges, net of insurance 189 182 181 Probable and reasonably estimable environmental liabilities 194 268 272 Other — 2 9
Total net repositioning and other charges $ 546 $ 598 $ 663
Years Ended December 31,
2015 2014 2013
Cost of products and services sold $ 483 $ 525 $ 566 Selling, general and administrative expenses 63 73 97
$ 546 $ 598 $ 663
Years Ended December 31,
2015 2014 2013
Aerospace $ 211 $ 193 $ 235 Automation and Control Solutions 77 80 68 Performance Materials and Technologies 40 33 56 Corporate 218 292 304
$ 546 $ 598 $ 663

HONEYWELL INTERNATIONAL INC. NOTES TO FINANCIAL STATEMENTS—(Continued)
(Dollars in millions, except per share amounts)
to the change in scope of a previously announced repositioning action and higher attrition than anticipated in prior severance programs resulting in lower required severance payments.
In 2013, we recognized repositioning charges totaling $231 million including severance costs of $186 million related to workforce reductions of 3,081 manufacturing and administrative positions across all of our segments. The workforce reductions were primarily related to cost savings actions taken in connection with our productivity and ongoing functional transformation initiatives, achieving acquisition-related synergies in ACS, outsourcing of non-core components in Aerospace, the shutdown of a manufacturing facility in PMT, and factory transitions in ACS to more cost-effective locations. Also, $30 million of previously established accruals, primarily for severance, in ACS and PMT, were returned to income in 2013 due to changes in the scope of previously announced repositioning actions, lower than expected costs in completing the exit of a product line and higher attrition than anticipated in prior severance programs resulting in lower required severance payments.
The following table summarizes the status of our total repositioning reserves:
Certain repositioning projects in Aerospace, ACS and PMT in 2015, 2014 and 2013 included exit or disposal activities, the costs related to which will be recognized in future periods when the actual liability is incurred. Such exit and disposal costs were not significant.
42
Severance Costs
Asset Impairments
Exit Costs Total
Balance at December 31, 2012 $ 276 $ — $ 47 $ 323
2013 charges 186 23 22 231 2013 usage—cash (139 ) — (21 ) (160 ) 2013 usage—noncash — (23 ) — (23 ) Adjustments (27 ) — (3 ) (30 ) Foreign currency translation 6 — — 6
Balance at December 31, 2013 302 — 45 347
2014 charges 156 12 16 184 2014 usage—cash (135 ) — (26 ) (161 ) 2014 usage—noncash — (12 ) — (12 ) Adjustments (33 ) — (5 ) (38 ) Foreign currency translation (5 ) — — (5 )
Balance at December 31, 2014 285 — 30 315
2015 charges 197 13 6 216 2015 usage—cash (109 ) — (9 ) (118 ) 2015 usage—noncash — (13 ) — (13 ) Acquisitions 16 — — 16 Adjustments (49 ) — (4 ) (53 ) Foreign currency translation (11 ) — (2 ) (13 )
Balance at December 31, 2015 $ 329 $ — $ 21 $ 350

HONEYWELL INTERNATIONAL INC. NOTES TO FINANCIAL STATEMENTS—(Continued)
(Dollars in millions, except per share amounts)
Note 4. Other (income) expense
Note 5. Income Taxes
Income from continuing operations before taxes
Tax expense (benefit)
43
Years Ended December 31,2015 2014 2013
Equity (income) loss of affiliated companies $ (30 ) $ (36 ) $ (36 ) Gain on sale of available for sale investments — (221 ) (195 ) Loss on sale of non-strategic businesses and assets 1 11 20 Interest income (104 ) (102 ) (69 ) Foreign exchange 43 34 34 Other, net 22 9 8
$ (68 ) $ (305 ) $ (238 )
Years Ended December 31,2015 2014 2013
U.S. $ 3,361 $ 3,340 $ 3,002 Non-U.S. 3,225 2,478 2,410
$ 6,586 $ 5,818 $ 5,412
Years Ended December 31,2015 2014 2013
Tax expense (benefit) consists of Current: U.S. Federal $ 786 $ 746 $ 663 U.S. State 78 39 97 Non-U.S. 560 572 428
$ 1,424 $ 1,357 $ 1,188 Deferred: U.S. Federal $ 196 $ 114 $ 160 U.S. State 49 63 72 Non-U.S. 70 (45 ) 30
315 132 262
$ 1,739 $ 1,489 $ 1,450

HONEYWELL INTERNATIONAL INC. NOTES TO FINANCIAL STATEMENTS—(Continued)
(Dollars in millions, except per share amounts)
The effective tax rate increased by 0.8 percentage points in 2015 compared to 2014. The increase was primarily attributable to decreased tax benefits from the resolution of tax audits, partially offset by increased tax benefits from manufacturing incentives, the impact of more income in jurisdictions with lower tax rates and fewer reserves. The Company’s non-U.S. effective tax rate for 2015 was 19.5%, a decrease of approximately 1.8 percentage points compared to 2014. The year-over-year decrease in the non-U.S. effective tax rate was primarily attributable to higher earnings in lower tax rate jurisdictions coupled with lower expense related to reserves in various jurisdictions, partially offset by an increase from the tax impact of restructuring and dispositions. The effective tax rate was lower than the U.S. federal statutory rate of 35% primarily due to overall non-U.S. earnings taxed at lower rates.
The effective tax rate decreased by 1.2 percentage points in 2014 compared to 2013. The decrease was primarily attributable to lower tax expense from the resolution of audits, partially offset by the impact of more income in jurisdictions with higher tax rates and additional reserves. The Company’s non-U.S. effective tax rate for 2014 was 21.3%, an increase of approximately 2.3 percentage points compared to 2013. The increase in the non-U.S. effective tax rate was primarily attributable to additional reserves and the impact of more income in jurisdictions with higher tax rates, partially offset by the tax impact of dispositions. The effective tax rate was lower than the U.S. federal statutory rate of 35% primarily due to overall non-U.S. earnings taxed at lower rates.
44
Years Ended December 31,2015 2014 2013
The U.S. federal statutory income tax rate is reconciled to our effective income tax rate as follows:
U.S. federal statutory income tax rate 35.0 % 35.0 % 35.0 % Taxes on non-U.S. earnings below U.S. tax rate(1) (8.0 ) (7.0 ) (7.2 ) U.S. state income taxes(1) 1.2 1.2 1.8 Manufacturing incentives (1.5 ) (1.0 ) (0.9 ) ESOP dividend tax benefit (0.4 ) (0.4 ) (0.5 ) Tax credits (1.0 ) (1.0 ) (1.8 ) Reserves for tax contingencies 0.7 (0.2 ) 0.6 All other items—net 0.4 (1.0 ) (0.2 )
26.4 % 25.6 % 26.8 %
(1) Net of changes in valuation allowance

HONEYWELL INTERNATIONAL INC. NOTES TO FINANCIAL STATEMENTS—(Continued)
(Dollars in millions, except per share amounts)
Deferred tax assets (liabilities)
The tax effects of temporary differences and tax carryforwards which give rise to future income tax benefits and payables are as follows:
As described in Note 1 Summary of Significant Accounting Policies, the Company has presented deferred income taxes as noncurrent as of December 31, 2015.
The change in deferred tax balance was primarily attributable to deferred tax liabilities for intangible assets that were recorded in connection with the acquisition of Elster. Our gross deferred tax asset includes $1,049 million related to non-U.S. operations comprised principally of deductible temporary differences and net operating loss, capital loss and tax credit carryforwards (mainly in Canada, France, Luxembourg and the United Kingdom). We maintain a valuation allowance of $587 million against a portion of the non-U.S. gross deferred tax assets. The change in the valuation allowance resulted in an increase of $114 million, decrease of $10 million and increase of $49 million to income tax expense in 2015, 2014 and 2013. In the event we determine that we will not be able to realize our net deferred tax assets in the future, we will reduce such amounts through an increase to income tax expense in the period such determination is made. Conversely, if we determine that we will be able to realize net deferred tax assets in excess of the carrying amounts, we will decrease the recorded valuation allowance through a reduction to income tax expense in the period that such determination is made.
As of December 31, 2015, our net operating loss, capital loss and tax credit carryforwards were as follows:
45
Deferred tax assets:December 31,
2015 2014
Pension $ 500 $ 573 Postretirement benefits other than pensions 292 441 Asbestos and environmental 473 477 Employee compensation and benefits 387 387 Other accruals and reserves 626 672 Net operating and capital losses 620 639 Tax credit carryforwards 198 199
Gross deferred tax assets 3,096 3,388 Valuation allowance (589 ) (560 ) Total deferred tax assets $ 2,507 $ 2,828
Deferred tax liabilities: Property, plant and equipment $ (661 ) $ (612 ) Intangibles (1,797 ) (1,060 ) Other asset basis differences (293 ) (286 ) Other (31 ) (7 )
Total deferred tax liabilities (2,782 ) (1,965 ) Net deferred tax (liability) asset $ (275 ) $ 863
JurisdictionExpiration
Period
Net Operating and Capital Loss Carryforwards
Tax Credit Carryforwards
U.S. Federal 2032 $ 2 $ 45 U.S. State 2034 1,315 25 Non-U.S. 2035 517 131 Non-U.S. Indefinite 2,339 —
$ 4,173 $ 201

HONEYWELL INTERNATIONAL INC. NOTES TO FINANCIAL STATEMENTS—(Continued)
(Dollars in millions, except per share amounts)
Many jurisdictions impose limitations on the timing and utilization of net operating loss and tax credit carryforwards. In those instances whereby there is an expected permanent limitation on the utilization of the net operating loss or tax credit carryforward the deferred tax asset and amount of the carryforward have been reduced.
U.S. federal income taxes have not been provided on undistributed earnings of the vast majority of our international subsidiaries as it is our intention to reinvest these earnings into the respective subsidiaries. At December 31, 2015 Honeywell has not provided for U.S. federal income and non-U.S. withholding taxes on approximately $16.6 billion of such earnings of our non-U.S. operations. It is not practicable to estimate the amount of tax that might be payable if some or all of such earnings were to be repatriated, and the amount of foreign tax credits that would be available to reduce or eliminate the resulting U.S. income tax liability.
As of December 31, 2015, 2014, and 2013 there were $765 million, $659 million and $729 million of unrecognized tax benefits that if recognized would be recorded as a component of income tax expense.
Generally, our unrecognized tax benefits are related to tax years that remain subject to examination by the relevant tax authorities. The following table summarizes these open tax years by major jurisdiction as of December 31, 2015:
Based on the outcome of these examinations, or as a result of the expiration of statute of limitations for specific jurisdictions, it is reasonably possible that certain unrecognized tax benefits for tax positions taken on previously filed tax returns will materially change from those recorded as
46
2015 2014 2013Change in unrecognized tax benefits:
Balance at beginning of year $ 659 $ 729 $ 722 Gross increases related to current period tax positions 56 65 41 Gross increases related to prior periods tax positions 175 204 118 Gross decreases related to prior periods tax positions (72 ) (277 ) (21 ) Decrease related to resolutions of audits with tax authorities (11 ) (32 ) (92 ) Expiration of the statute of limitations for the assessment of taxes (13 ) (10 ) (30 ) Foreign currency translation (29 ) (20 ) (9 )
Balance at end of year $ 765 $ 659 $ 729
Jurisdiction
Open Tax Years Based on Originally Filed Returns
Examination in progress
Examination not yet initiated
U.S. Federal 2010 – 2012 2013 – 2015 U.S. State 2008 – 2014 2011 – 2015 United Kingdom N/A 2013 – 2015 Canada(1) 2010 – 2013 2014 – 2015 Germany(1) 2008 – 2012 2013 – 2015 France 2012 – 2014 2005 – 2011, 2015 Netherlands 2009 2011 – 2015 Australia N/A 2010 – 2015 China 2003 – 2014 2015 India 1999 – 2013 2014 – 2015 Italy 2008 – 2012 2014 – 2015
(1) Includes provincial or similar local jurisdictions, as applicable.
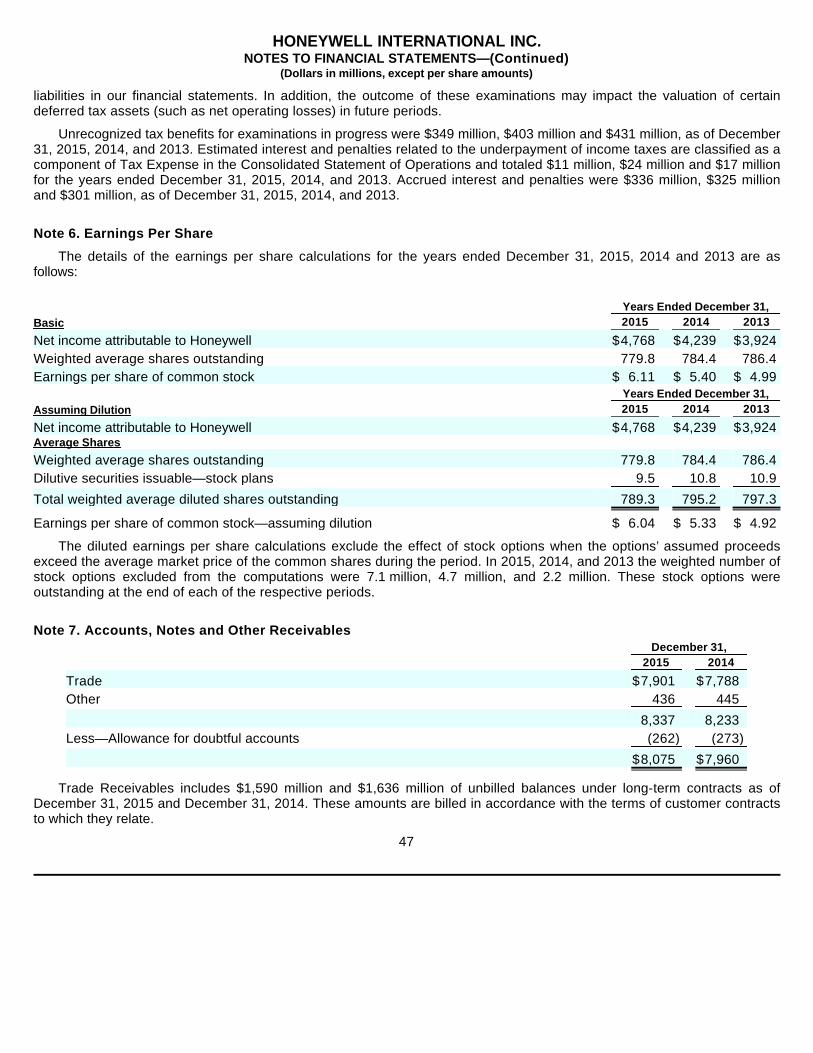
HONEYWELL INTERNATIONAL INC. NOTES TO FINANCIAL STATEMENTS—(Continued)
(Dollars in millions, except per share amounts)
liabilities in our financial statements. In addition, the outcome of these examinations may impact the valuation of certain deferred tax assets (such as net operating losses) in future periods.
Unrecognized tax benefits for examinations in progress were $349 million, $403 million and $431 million, as of December 31, 2015, 2014, and 2013. Estimated interest and penalties related to the underpayment of income taxes are classified as a component of Tax Expense in the Consolidated Statement of Operations and totaled $11 million, $24 million and $17 million for the years ended December 31, 2015, 2014, and 2013. Accrued interest and penalties were $336 million, $325 million and $301 million, as of December 31, 2015, 2014, and 2013.
Note 6. Earnings Per Share
The details of the earnings per share calculations for the years ended December 31, 2015, 2014 and 2013 are as follows:
The diluted earnings per share calculations exclude the effect of stock options when the options’ assumed proceeds exceed the average market price of the common shares during the period. In 2015, 2014, and 2013 the weighted number of stock options excluded from the computations were 7.1 million, 4.7 million, and 2.2 million. These stock options were outstanding at the end of each of the respective periods.
Note 7. Accounts, Notes and Other Receivables
Trade Receivables includes $1,590 million and $1,636 million of unbilled balances under long-term contracts as of December 31, 2015 and December 31, 2014. These amounts are billed in accordance with the terms of customer contracts to which they relate.
47
BasicYears Ended December 31,2015 2014 2013
Net income attributable to Honeywell $ 4,768 $ 4,239 $ 3,924 Weighted average shares outstanding 779.8 784.4 786.4 Earnings per share of common stock $ 6.11 $ 5.40 $ 4.99
Assuming DilutionYears Ended December 31,2015 2014 2013
Net income attributable to Honeywell $ 4,768 $ 4,239 $ 3,924 Average Shares Weighted average shares outstanding 779.8 784.4 786.4 Dilutive securities issuable—stock plans 9.5 10.8 10.9
Total weighted average diluted shares outstanding 789.3 795.2 797.3
Earnings per share of common stock—assuming dilution $ 6.04 $ 5.33 $ 4.92
December 31,2015 2014
Trade $ 7,901 $ 7,788 Other 436 445
8,337 8,233 Less—Allowance for doubtful accounts (262 ) (273 )
$ 8,075 $ 7,960

HONEYWELL INTERNATIONAL INC. NOTES TO FINANCIAL STATEMENTS—(Continued)
(Dollars in millions, except per share amounts)
Note 8. Inventories
Inventories valued at LIFO amounted to $399 million and $434 million at December 31, 2015 and 2014. Had such LIFO inventories been valued at current costs, their carrying values would have been approximately $116 million and $168 million higher at December 31, 2015 and 2014.
Note 9. Property, Plant and Equipment—Net
Depreciation expense was $672 million, $667 million and $670 million in 2015, 2014 and 2013.
Note 10. Goodwill and Other Intangible Assets—Net
The change in the carrying amount of goodwill for the years ended December 31, 2015 and 2014 by segment is as follows:
48
December 31,2015 2014
Raw materials $ 1,120 $ 1,124 Work in process 826 815 Finished products 2,590 2,634
4,536 4,573 Reduction to LIFO cost basis (116 ) (168 )
$ 4,420 $ 4,405
December 31,2015 2014
Land and improvements $ 367 $ 343 Machinery and equipment 10,505 10,313 Buildings and improvements 3,188 3,119 Construction in progress 848 727
14,908 14,502 Less—Accumulated depreciation (9,119 ) (9,119 )
$ 5,789 $ 5,383
December 31, 2014
Acquisitions/ Divestitures
Currency Translation Adjustment
December 31, 2015
Aerospace $ 2,258 $ 49 $ (11 ) $ 2,296 Automation and Control Solutions 7,824 2,980 (216 ) 10,588 Performance Materials and Technologies 2,706 370 (65 ) 3,011
$ 12,788 $ 3,399 $ (292 ) $ 15,895

HONEYWELL INTERNATIONAL INC. NOTES TO FINANCIAL STATEMENTS—(Continued)
(Dollars in millions, except per share amounts)
Other intangible assets are comprised of:
Intangible assets amortization expense was $211 million, $257 million, and $319 million in 2015, 2014, 2013. Estimated intangible asset amortization expense for each of the next five years approximates $336 million in 2016, $357 million in 2017, $356 million in 2018, $342 million in 2019, and $302 million in 2020.
Note 11. Accrued Liabilities
49
December 31, 2015 December 31, 2014Gross
Carrying Amount
Accumulated Amortization
Net Carrying Amount
Gross Carrying Amount
Accumulated Amortization
Net Carrying Amount
Determinable life intangibles: Patents and technology $ 1,688 $ (1,061 ) $ 627 $ 1,400 $ (1,005 ) $ 395 Customer relationships 3,558 (942 ) 2,616 1,867 (857 ) 1,010 Trademarks 230 (131 ) 99 191 (125 ) 66 Other 323 (264 ) 59 291 (260 ) 31
5,799 (2,398 ) 3,401 3,749 (2,247 ) 1,502 Indefinite life intangibles:
Trademarks 1,176 — 1,176 706 — 706
$ 6,975 $ (2,398 ) $ 4,577 $ 4,455 $ (2,247 ) $ 2,208
December 31,2015 2014
Customer advances and deferred income $ 1,863 $ 2,094 Compensation, benefit and other employee related 1,460 1,476 Asbestos related liabilities 292 352 Repositioning 335 284 Product warranties and performance guarantees 355 332 Environmental costs 253 278 Income taxes 201 261 Accrued interest 97 101 Other taxes (payroll, sales, VAT etc.) 266 243 Insurance 205 264 Other (primarily operating expenses) 950 1,086
$ 6,277 $ 6,771

HONEYWELL INTERNATIONAL INC. NOTES TO FINANCIAL STATEMENTS—(Continued)
(Dollars in millions, except per share amounts)
Note 12. Long-term Debt and Credit Agreements
The schedule of principal payments on long-term debt is as follows:
On July 10, 2015, the Company entered into a $4 billion Amended and Restated Five Year Credit Agreement (Credit Agreement) with a syndicate of banks. Commitments under the Credit Agreement can be increased pursuant to the terms of the Credit Agreement to an aggregate amount not to exceed $4.5 billion. The Credit Agreement amends and restates the previous $4 billion five year credit agreement with substantially the same material terms and conditions. A full description of the Credit Agreement can be found in the Company’s Current Report on Form 8-K, dated July 10, 2015.
On September 30, 2015, the Company entered into a $3 billion 364-Day Credit Agreement (364-Day Credit Agreement) with a syndicate of banks. The 364-Day Credit Agreement is maintained for general corporate purposes including the Elster acquisition. A full description of the 364-Day Credit Agreement can be found in the Company’s Current Report on Form 8-K, dated October 1, 2015.
50
December 31,2015 2014
Floating rate notes due 2015 $ — $ 700 5.40% notes due 2016 400 400 5.30% notes due 2017 400 400 5.30% notes due 2018 900 900 5.00% notes due 2019 900 900 4.25% notes due 2021 800 800 3.35% notes due 2023 300 300 5.70% notes due 2036 550 550 5.70% notes due 2037 600 600 5.375% notes due 2041 600 600 Industrial development bond obligations, floating rate maturing at various dates
through 2037 30 30 6.625% debentures due 2028 216 216 9.065% debentures due 2033 51 51 Other (including capitalized leases and debt issuance costs), 0.6%-9.5%
maturing at various dates through 2023 384 538
6,131 6,985 Less: current portion (577 ) (939 )
$ 5,554 $ 6,046
December 31, 2015
2016 $ 577 2017 490 2018 910 2019 902 2020 2 Thereafter 3,250
6,131 Less-current portion (577 )
$ 5,554

HONEYWELL INTERNATIONAL INC. NOTES TO FINANCIAL STATEMENTS—(Continued)
(Dollars in millions, except per share amounts)
Note 13. Lease Commitments
Future minimum lease payments under operating leases having initial or remaining noncancellable lease terms in excess of one year are as follows:
Rent expense was $390 million, $420 million and $404 million in 2015, 2014 and 2013.
Note 14. Financial Instruments and Fair Value Measures
Credit and Market Risk—Financial instruments, including derivatives, expose us to counterparty credit risk for nonperformance and to market risk related to changes in interest and currency exchange rates and commodity prices. We manage our exposure to counterparty credit risk through specific minimum credit standards, diversification of counterparties, and procedures to monitor concentrations of credit risk. Our counterparties in derivative transactions are substantial investment and commercial banks with significant experience using such derivative instruments. We monitor the impact of market risk on the fair value and cash flows of our derivative and other financial instruments considering reasonably possible changes in interest rates and currency exchange rates and restrict the use of derivative financial instruments to hedging activities.
We continually monitor the creditworthiness of our customers to which we grant credit terms in the normal course of business. The terms and conditions of our credit sales are designed to mitigate or eliminate concentrations of credit risk with any single customer. Our sales are not materially dependent on a single customer or a small group of customers.
Foreign Currency Risk Management—We conduct our business on a multinational basis in a wide variety of foreign currencies. Our exposure to market risk for changes in foreign currency exchange rates arises from international financing activities between subsidiaries, foreign currency denominated monetary assets and liabilities and transactions arising from international trade. Our primary objective is to preserve the U.S. Dollar value of foreign currency denominated cash flows and earnings. We attempt to hedge currency exposures with natural offsets to the fullest extent possible and, once these opportunities have been exhausted, through foreign currency exchange forward and option contracts with third parties.
We hedge monetary assets and liabilities denominated in non-functional currencies. Prior to conversion into U.S. dollars, these assets and liabilities are remeasured at spot exchange rates in effect on the balance sheet date. The effects of changes in spot rates are recognized in earnings and included in Other (Income) Expense. We partially hedge forecasted sales and purchases, which predominantly occur in the next twelve months and are denominated in non-functional currencies, with currency forward contracts. Changes in the forecasted non-functional currency cash flows due to movements in exchange rates are substantially offset by changes in the fair value of the currency forward contracts designated as hedges. Market value gains and losses on these contracts are recognized in earnings when the hedged transaction is recognized. Open foreign currency exchange forward contracts mature predominantly in the next twelve months. At December 31, 2015 and 2014, we had contracts with notional amounts of $10,538 million and $7,291 million to exchange foreign
51
At December 31, 2015
2016 $ 316 2017 249 2018 172 2019 114 2020 77 Thereafter 273
$ 1,201

HONEYWELL INTERNATIONAL INC. NOTES TO FINANCIAL STATEMENTS—(Continued)
(Dollars in millions, except per share amounts)
currencies, principally the U.S. Dollar, Euro, British Pound, Chinese Renminbi, Indian Rupee, Mexican Peso, Canadian Dollar, U.A.E. Dirham and Singapore Dollar.
We have also designated foreign currency debt as hedges against portions of our net investment in foreign operations during the year ended December 31, 2015. Gains or losses on the effective portion of the foreign currency debt designated as a net investment hedge are recorded in the same manner as foreign currency translation adjustments. The Company did not have ineffectiveness related to net investment hedges during the year ended December 31, 2015.
Interest Rate Risk Management—We use a combination of financial instruments, including long-term, medium-term and short-term financing, variable-rate commercial paper, and interest rate swaps to manage the interest rate mix of our total debt portfolio and related overall cost of borrowing. At December 31, 2015 and 2014, interest rate swap agreements designated as fair value hedges effectively changed $1,100 million of fixed rate debt at rate of 4.00 to LIBOR based floating rate debt. Our interest rate swaps mature at various dates through 2023.
Fair Value of Financial Instruments—The FASB’s accounting guidance defines fair value as the price that would be received to sell an asset or paid to transfer a liability in an orderly transaction between market participants at the measurement date (exit price).
Financial and nonfinancial assets and liabilities are classified in their entirety based on the lowest level of input that is significant to the fair value measurement. The following table sets forth the Company’s financial assets and liabilities that were accounted for at fair value on a recurring basis as of December 31, 2015 and 2014:
The foreign currency exchange contracts and interest rate swap agreements are valued using broker quotations, or market transactions in either the listed or over-the-counter markets. As such, these derivative instruments are classified within level 2. The Company also holds investments in commercial paper, certificates of deposits, and time deposits that are designated as available for sale and are valued using published prices based off observable market data. As such, these investments are classified within level 2.
The carrying value of cash and cash equivalents, trade accounts and notes receivables, payables, commercial paper and short-term borrowings contained in the Consolidated Balance Sheet approximates fair value. The following table sets forth the Company’s financial assets and liabilities that were not carried at fair value:
The Company determined the fair value of the long-term receivables by discounting based upon the terms of the receivable and counterparty details including credit quality. As such, the fair value of these receivables is considered level 2. The Company determined the fair value of the long-term debt
52
December 31,2015 2014
Assets: Foreign currency exchange contracts $ 28 $ 20 Available for sale investments 1,501 1,479 Interest rate swap agreements 92 93
Liabilities: Foreign currency exchange contracts $ 17 $ 10
December 31, 2015 December 31, 2014Carrying
ValueFair
ValueCarrying
ValueFair
ValueAssets
Long-term receivables $ 292 $ 283 $ 297 $ 293 Liabilities
Long-term debt and related current maturities $ 6,131 $ 6,721 $ 6,985 $ 7,817

HONEYWELL INTERNATIONAL INC. NOTES TO FINANCIAL STATEMENTS—(Continued)
(Dollars in millions, except per share amounts)
and related current maturities utilizing transactions in the listed markets for identical or similar liabilities. As such, the fair value of the long-term debt and related current maturities is considered level 2 as well.
Interest rate swap agreements are designated as hedge relationships with gains or losses on the derivative recognized in Interest and other financial charges offsetting the gains and losses on the underlying debt being hedged. Losses on interest rate swap agreements recognized in earnings were $2 million in the year ended December 31, 2015. Gains on interest rate swap agreements recognized in earnings were $38 million in the year ended 2014. Gains and losses are fully offset by losses and gains on the underlying debt being hedged.
We also economically hedge our exposure to changes in foreign exchange rates principally with forward contracts. These contracts are marked-to-market with the resulting gains and losses recognized in earnings offsetting the gains and losses on the non-functional currency denominated monetary assets and liabilities being hedged. We recognized $86 million and $181 million of expense, in other (income) expense for the years ended December 31, 2015 and 2014. See Note 4 Other (Income) Expense for further details of the net impact of these economic foreign currency hedges.
Note 15. Other Liabilities
Note 16. Capital Stock
We are authorized to issue up to 2,000,000,000 shares of common stock, with a par value of $1. Common shareowners are entitled to receive such dividends as may be declared by the Board, are entitled to one vote per share, and are entitled, in the event of liquidation, to share ratably in all the assets of Honeywell which are available for distribution to the common shareowners. Common shareowners do not have preemptive or conversion rights. Shares of common stock issued and outstanding or held in the treasury are not liable to further calls or assessments. There are no restrictions on us relative to dividends or the repurchase or redemption of common stock.
In December 2013 the Board of Directors authorized the repurchase of up to $5 billion of Honeywell common stock, $2.2 billion and $4.1 billion remained available as of December 31, 2015 and December 31, 2014 for additional share repurchases.
We purchased approximately 18.8 million and 10.0 million shares of our common stock in 2015 and 2014, for $1,884 million and $924 million.
We are authorized to issue up to 40,000,000 shares of preferred stock, without par value, and can determine the number of shares of each series, and the rights, preferences and limitations of each series. At December 31, 2015, there was no preferred stock outstanding.
53
Years Ended December 31,
2015 2014
Pension and other employee related $ 2,461 $ 2,497 Income taxes 1,009 764 Environmental 265 313 Insurance 257 253 Asset retirement obligations 65 67 Deferred income 99 93 Other 192 295
$ 4,348 $ 4,282

HONEYWELL INTERNATIONAL INC. NOTES TO FINANCIAL STATEMENTS—(Continued)
(Dollars in millions, except per share amounts)
Note 17. Accumulated Other Comprehensive Income (Loss)
The changes in accumulated other comprehensive income (loss) are provided in the tables below. Comprehensive income (loss) attributable to noncontrolling interest consisted predominantly of net income.
Components of Accumulated Other Comprehensive Income (Loss)
54
Pretax Tax After TaxYear Ended December 31, 2015 Foreign exchange translation adjustment $ (1,152 ) $ — $ (1,152 ) Pensions and other postretirement benefit adjustments 129 (45 ) 84 Changes in fair value of effective cash flow hedges (11 ) 3 (8 )
$ (1,034 ) $ (42 ) $ (1,076 ) Year Ended December 31, 2014 Foreign exchange translation adjustment $ (1,044 ) $ — $ (1,044 ) Pensions and other postretirement benefit adjustments (1,707 ) 624 (1,083 ) Changes in fair value of available for sale investments (246 ) 76 (170 ) Changes in fair value of effective cash flow hedges 24 (4 ) 20
$ (2,973 ) $ 696 $ (2,277 ) Year Ended December 31, 2013 Foreign exchange translation adjustment $ (52 ) $ — $ (52 ) Pensions and other postretirement benefit adjustments 3,514 (1,311 ) 2,203 Changes in fair value of available for sale investments 30 (17 ) 13 Changes in fair value of effective cash flow hedges (14 ) 7 (7 )
$ 3,478 $ (1,321 ) $ 2,157
December 31,2015 2014
Cumulative foreign exchange translation adjustment $ (1,892 ) $ (740 ) Pensions and other postretirement benefit adjustments (644 ) (728 ) Fair value of available for sale investments — — Fair value of effective cash flow hedges 1 9
$ (2,535 ) $ (1,459 )

HONEYWELL INTERNATIONAL INC. NOTES TO FINANCIAL STATEMENTS—(Continued)
(Dollars in millions, except per share amounts)
Changes in Accumulated Other Comprehensive Income by Component
Reclassifications Out of Accumulated Other Comprehensive Income
55
Foreign Exchange
Translation Adjustment
Pension and Other
Postretirement Adjustments
Changes in Fair Value of
Available for Sale
Investments
Changes in Fair Value of
Effective Cash Flow
Hedges Total
Balance at December 31, 2013 $ 304 $ 355 $ 170 $ (11 ) $ 818 Other comprehensive income (loss) before
reclassifications (1,044 ) (1,284 ) 15 20 (2,293 ) Amounts reclassified from accumulated other
comprehensive income — 201 (185 ) — 16 Net current period other comprehensive
income (loss) (1,044 ) (1,083 ) (170 ) 20 (2,277 ) Balance at December 31, 2014 $ (740 ) $ (728 ) $ — $ 9 $ (1,459 )
Other comprehensive income (loss) before reclassifications (1,152 ) 23 — 91 (1,038 )
Amounts reclassified from accumulated other comprehensive income — 61 — (99 ) (38 ) Net current period other comprehensive
income (loss) (1,152 ) 84 — (8 ) (1,076 ) Balance at December 31, 2015 $ (1,892 ) $ (644 ) $ — $ 1 $ (2,535 )
Year Ended December 31, 2015 Affected Line in the Consolidated Statement of Operations
Product Sales
Cost of Products
Sold
Cost of Services
Sold
Selling, General and
Administrative Expenses
Other (Income) Expense Total
Amortization of Pension and Other Postretirement Items:
Actuarial losses recognized $ — $ 78 $ 16 $ 17 $ — $ 111 Prior service (credit) recognized — (14 ) (3 ) (3 ) — (20 ) Settlements and curtailments — 2 — — — 2
Losses (gains) on cash flow hedges (17 ) (73 ) (17 ) (2 ) — (109 ) Total before tax $ (17 ) $ (7 ) $ (4 ) $ 12 $ — $ (16 )
Tax expense (benefit) (22 ) Total reclassifications for the period, net of tax $ (38 )

HONEYWELL INTERNATIONAL INC. NOTES TO FINANCIAL STATEMENTS—(Continued)
(Dollars in millions, except per share amounts)
Note 18. Stock-Based Compensation Plans
Under the terms of the 2011 Stock Incentive Plan of Honeywell International Inc. and its Affiliates (2011 Plan) there were 14,050,760 shares of Honeywell common stock available for future grants at December 31, 2015. Additionally, the 2006 Stock Plan for Non-Employee Directors of Honeywell International Inc. (2006 Directors Plan) expires on April 24, 2016 and it is expected that no future grants will be made under the 2006 Directors Plan prior to expiration. In 2016, the Company is seeking shareowner approval of a new employee stock plan and non-employee director plan and, upon approval, no additional grants will be permitted under the 2011 Plan or the 2006 Directors Plan.
Stock Options—The exercise price, term and other conditions applicable to each option granted under our stock plans are generally determined by the Management Development and Compensation Committee of the Board. The exercise price of stock options is set on the grant date and may not be less than the fair market value per share of our stock on that date. The fair value is recognized as an expense over the employee’s requisite service period (generally the vesting period of the award). Options generally vest over a four-year period and expire after ten years.
The fair value of each option award is estimated on the date of grant using the Black-Scholes option-pricing model. Expected volatility is based on implied volatilities from traded options on our common stock and historical volatility of our common stock. We used a Monte Carlo simulation model to derive an expected term which represents an estimate of the time options are expected to remain outstanding. Such model uses historical data to estimate option exercise activity and post-vest termination behavior. The risk-free rate for periods within the contractual life of the option is based on the U.S. treasury yield curve in effect at the time of grant.
Compensation cost on a pre-tax basis related to stock options recognized in selling, general and administrative expenses in 2015, 2014 and 2013 was $78 million, $85 million and $70 million. The associated future income tax benefit recognized in 2015, 2014 and 2013 was $26 million, $31 million and $24 million.
56
Year Ended December 31, 2014 Affected Line in the Consolidated Statement of Operations
Product Sales
Cost of Products
Sold
Cost of Services
Sold
Selling, General and
Administrative Expenses
Other (Income) Expense Total
Amortization of Pension and Other Postretirement Items:
Actuarial losses recognized $ — $ 199 $ 38 $ 42 $ — $ 279 Prior service (credit) recognized — (1 ) — — — (1 ) Transition obligation recognized — 2 — — — 2
Losses (gains) on cash flow hedges (5 ) — — 5 — — Unrealized gains on available for sale
investments — — — — (221 ) (221 ) Total before tax $ (5 ) $ 200 $ 38 $ 47 $ (221 ) $ 59
Tax expense (benefit) (43 ) Total reclassifications for the period, net of tax $ 16

HONEYWELL INTERNATIONAL INC. NOTES TO FINANCIAL STATEMENTS—(Continued)
(Dollars in millions, except per share amounts)
The following table sets forth fair value per share information, including related weighted-average assumptions, used to determine compensation cost:
The following table summarizes information about stock option activity for the three years ended December 31, 2015:
57
Years Ended December 31,2015 2014 2013
Weighted average fair value per share of options granted during the year(1) $ 17.21 $ 16.35 $ 11.85
Assumptions: Expected annual dividend yield 1.98 % 2.05 % 2.55 % Expected volatility 21.55 % 23.06 % 24.73 % Risk-free rate of return 1.61 % 1.48 % 0.91 % Expected option term (years) 5.0 5.0 5.5
(1) Estimated on date of grant using Black-Scholes option-pricing model.
Number of Options
Weighted Average Exercise
Price
Outstanding at December 31, 2012 35,569,021 $ 47.13 Granted 6,041,422 69.89 Exercised (10,329,611 ) 41.91 Lapsed or canceled (616,995 ) 53.84
Outstanding at December 31, 2013 30,663,837 53.27 Granted 5,823,706 93.95 Exercised (5,697,263 ) 47.47 Lapsed or canceled (1,294,668 ) 67.70
Outstanding at December 31, 2014 29,495,612 61.80 Granted 5,967,256 103.87 Exercised (4,190,298 ) 53.40 Lapsed or canceled (703,132 ) 84.31
Outstanding at December 31, 2015 30,569,438 $ 70.76
Vested and expected to vest at December 31, 2015(1) 28,852,696 $ 68.96
Exercisable at December 31, 2015 17,202,377 $ 55.11
(1) Represents the sum of vested options of 17.2 million and expected to vest options of 11.7 million. Expected to vest options are derived by applying the pre-vesting forfeiture rate assumption to total outstanding unvested options of 13.6 million.
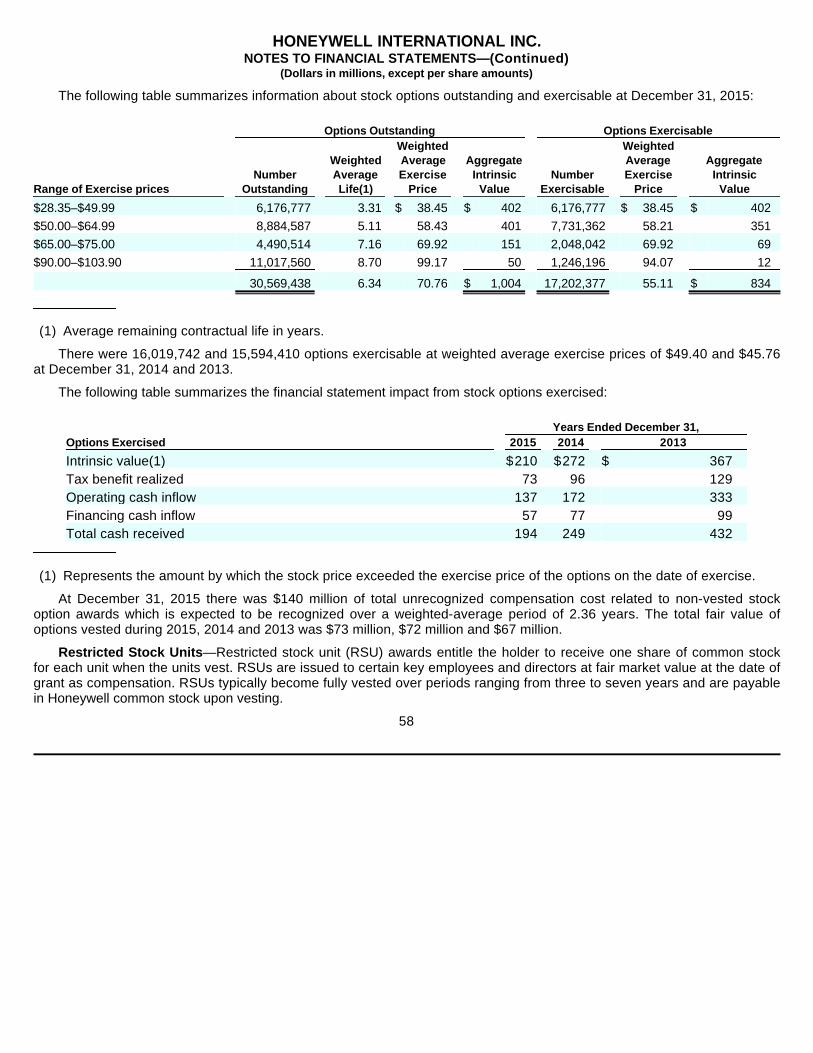
HONEYWELL INTERNATIONAL INC. NOTES TO FINANCIAL STATEMENTS—(Continued)
(Dollars in millions, except per share amounts)
The following table summarizes information about stock options outstanding and exercisable at December 31, 2015:
There were 16,019,742 and 15,594,410 options exercisable at weighted average exercise prices of $49.40 and $45.76 at December 31, 2014 and 2013.
The following table summarizes the financial statement impact from stock options exercised:
At December 31, 2015 there was $140 million of total unrecognized compensation cost related to non-vested stock option awards which is expected to be recognized over a weighted-average period of 2.36 years. The total fair value of options vested during 2015, 2014 and 2013 was $73 million, $72 million and $67 million.
Restricted Stock Units—Restricted stock unit (RSU) awards entitle the holder to receive one share of common stock for each unit when the units vest. RSUs are issued to certain key employees and directors at fair market value at the date of grant as compensation. RSUs typically become fully vested over periods ranging from three to seven years and are payable in Honeywell common stock upon vesting.
58
Range of Exercise prices
Options Outstanding Options Exercisable
Number Outstanding
Weighted Average Life(1)
Weighted Average Exercise
Price
Aggregate Intrinsic
ValueNumber
Exercisable
Weighted Average Exercise
Price
Aggregate Intrinsic
Value
$28.35–$49.99 6,176,777 3.31 $ 38.45 $ 402 6,176,777 $ 38.45 $ 402 $50.00–$64.99 8,884,587 5.11 58.43 401 7,731,362 58.21 351 $65.00–$75.00 4,490,514 7.16 69.92 151 2,048,042 69.92 69 $90.00–$103.90 11,017,560 8.70 99.17 50 1,246,196 94.07 12
30,569,438 6.34 70.76 $ 1,004 17,202,377 55.11 $ 834
(1) Average remaining contractual life in years.
Options ExercisedYears Ended December 31,
2015 2014 2013
Intrinsic value(1) $ 210 $ 272 $ 367 Tax benefit realized 73 96 129 Operating cash inflow 137 172 333 Financing cash inflow 57 77 99 Total cash received 194 249 432
(1) Represents the amount by which the stock price exceeded the exercise price of the options on the date of exercise.

HONEYWELL INTERNATIONAL INC. NOTES TO FINANCIAL STATEMENTS—(Continued)
(Dollars in millions, except per share amounts)
The following table summarizes information about RSU activity for the three years ended December 31, 2015:
As of December 31, 2015, there was approximately $185 million of total unrecognized compensation cost related to non-vested RSUs granted under our stock plans which is expected to be recognized over a weighted-average period of 3.37 years.
The following table summarizes information about income statement impact from RSUs for the three years ended December 31, 2015:
Note 19. Commitments and Contingencies
Environmental Matters
We are subject to various federal, state, local and foreign government requirements relating to the protection of the environment. We believe that, as a general matter, our policies, practices and procedures are properly designed to prevent unreasonable risk of environmental damage and personal injury and that our handling, manufacture, use and disposal of hazardous substances are in accordance with environmental and safety laws and regulations. However, mainly because of past operations and operations of predecessor companies, we, like other companies engaged in similar businesses, have incurred remedial response and voluntary cleanup costs for site contamination and are a party to lawsuits and claims associated with environmental and safety matters, including past production of products containing hazardous substances. Additional lawsuits, claims and costs involving environmental matters are likely to continue to arise in the future.
With respect to environmental matters involving site contamination, we continually conduct studies, individually or jointly with other potentially responsible parties, to determine the feasibility of various remedial techniques. It is our policy to record appropriate liabilities for environmental matters when remedial efforts or damage claim payments are probable and the costs can be reasonably estimated. Such liabilities are based on our best estimate of the undiscounted future costs required to complete the remedial work. The recorded liabilities are adjusted periodically as remediation efforts
59
Number of Restricted Stock Units
Weighted Average
Grant Date Fair Value Per Share
Non-vested at December 31, 2012 8,095,739 $ 49.91 Granted 1,904,504 75.73 Vested (2,995,553 ) 42.17 Forfeited (312,470 ) 56.58
Non-vested at December 31, 2013 6,692,220 60.04 Granted 1,455,209 94.88 Vested (1,787,894 ) 53.63 Forfeited (460,341 ) 63.54
Non-vested at December 31, 2014 5,899,194 70.32 Granted 1,190,406 103.04 Vested (1,681,342 ) 56.38 Forfeited (426,670 ) 77.73
Non-vested at December 31, 2015 4,981,588 $ 82.18
Years Ended December 31,2015 2014 2013
Compensation expense $ 97 $ 102 $ 100 Future income tax benefit recognized 29 37 35

HONEYWELL INTERNATIONAL INC. NOTES TO FINANCIAL STATEMENTS—(Continued)
(Dollars in millions, except per share amounts)
progress or as additional technical, regulatory or legal information becomes available. Given the uncertainties regarding the status of laws, regulations, enforcement policies, the impact of other potentially responsible parties, technology and information related to individual sites, we do not believe it is possible to develop an estimate of the range of reasonably possible environmental loss in excess of our recorded liabilities. We expect to fund expenditures for these matters from operating cash flow. The timing of cash expenditures depends on a number of factors, including the timing of remedial investigations and feasibility studies, the timing of litigation and settlements of remediation liability, personal injury and property damage claims, regulatory approval of cleanup projects, remedial techniques to be utilized and agreements with other parties.
The following table summarizes information concerning our recorded liabilities for environmental costs:
Environmental liabilities are included in the following balance sheet accounts:
We do not currently possess sufficient information to reasonably estimate the amounts of environmental liabilities to be recorded upon future completion of studies, litigation or settlements, and neither the timing nor the amount of the ultimate costs associated with environmental matters can be determined although they could be material to our consolidated results of operations and operating cash flows in the periods recognized or paid. However, considering our past experience and existing reserves, we do not expect that environmental matters will have a material adverse effect on our consolidated financial position.
Onondaga Lake, Syracuse, NY—We are implementing a combined dredging/capping remedy of Onondaga Lake pursuant to a consent decree approved by the United States District Court for the Northern District of New York in January 2007. We have accrued for our estimated cost of remediating Onondaga Lake based on currently available information and analysis performed by our engineering consultants. Honeywell is also conducting remedial investigations and activities at other sites in Syracuse. We have recorded reserves for these investigations and activities where appropriate, consistent with the accounting policy described above.
Honeywell has entered into a cooperative agreement with potential natural resource trustees to assess alleged natural resource damages relating to this site. It is not possible to predict the outcome or duration of this assessment, or the amounts of, or responsibility for, any damages.
60
Years Ended December 31,2015 2014 2013
Beginning of year $ 591 $ 643 $ 654 Accruals for environmental matters deemed probable and
reasonably estimable 194 268 272 Environmental liability payments (273 ) (321 ) (304 ) Other 6 1 21
End of year $ 518 $ 591 $ 643
December 31, 2015 2014
Accrued liabilities $ 253 $ 278 Other liabilities 265 313
$ 518 $ 591

HONEYWELL INTERNATIONAL INC. NOTES TO FINANCIAL STATEMENTS—(Continued)
(Dollars in millions, except per share amounts)
Asbestos Matters
Honeywell is a defendant in asbestos related personal injury actions related to two predecessor companies:
The following tables summarize information concerning NARCO and Bendix asbestos related balances:
Asbestos Related Liabilities
Insurance Recoveries for Asbestos Related Liabilities
61
• North American Refractories Company (NARCO), which was sold in 1986, produced refractory products (bricks and cement used in high temperature applications). Claimants consist largely of individuals who allege exposure to NARCO asbestos-containing refractory products in an occupational setting.
• Bendix Friction Materials (Bendix) business, which was sold in 2014, manufactured automotive brake parts that contained chrysotile asbestos in an encapsulated form. Claimants consist largely of individuals who allege exposure to asbestos from brakes from either performing or being in the vicinity of individuals who performed brake replacements.
Year Ended December 31, Year Ended December 31, Year Ended December 31, 2015 2014 2013
Bendix NARCO Total Bendix NARCO Total Bendix NARCO Total
Beginning of year $ 623 $ 929 $ 1,552 $ 656 $ 955 $ 1,611 $ 653 $ 1,119 $ 1,772 Accrual for update to estimated
liability 180 8 188 195 4 199 180 5 185 Change in estimated cost of
future claims 11 — 11 (1 ) — (1 ) 16 — 16 Update of expected resolution
values for pending claims 1 — 1 2 — 2 (5 ) — (5 ) Asbestos related liability
payments (193 ) (16 ) (209 ) (229 ) (30 ) (259 ) (188 ) (169 ) (357 ) End of year $ 622 $ 921 $ 1,543 $ 623 $ 929 $ 1,552 $ 656 $ 955 $ 1,611
Year Ended December 31, Year Ended December 31, Year Ended December 31, 2015 2014 2013
Bendix NARCO Total Bendix NARCO Total Bendix NARCO Total
Beginning of year $ 135 $ 350 $ 485 $ 141 $ 531 $ 672 $ 138 $ 569 $ 707 Probable insurance recoveries related
to estimated liability 21 — 21 24 — 24 27 — 27 Insurance receipts for asbestos related
liabilities (33 ) (30 ) (63 ) (24 ) (187 ) (211 ) (24 ) (34 ) (58 ) Insurance receivables settlements and
write offs 1 6 7 (6 ) 7 1 — (6 ) (6 ) Other — (1 ) (1 ) — (1 ) (1 ) — 2 2
End of year $ 124 $ 325 $ 449 $ 135 $ 350 $ 485 $ 141 $ 531 $ 672

HONEYWELL INTERNATIONAL INC. NOTES TO FINANCIAL STATEMENTS—(Continued)
(Dollars in millions, except per share amounts)
NARCO and Bendix asbestos related balances are included in the following balance sheet accounts:
NARCO Products—In connection with NARCO’s emergence from bankruptcy on April 30, 2013, a federally authorized 524(g) trust (NARCO Trust) was established for the evaluation and resolution of all existing and future NARCO asbestos claims. Both Honeywell and NARCO are protected by a permanent channeling injunction barring all present and future individual actions in state or federal courts and requiring all asbestos related claims based on exposure to NARCO asbestos-containing products to be made against the NARCO Trust. The NARCO Trust reviews submitted claims and determines award amounts in accordance with established Trust Distribution Procedures approved by the Bankruptcy Court which set forth the criteria claimants must meet to qualify for compensation including, among other things, exposure and medical criteria that determine the award amount. In addition, Honeywell provided, and continues to provide, input to the design of control procedures for processing NARCO claims, and has on-going audit rights to review and monitor the claims processors’ adherence to the established requirements of the Trust Distribution Procedures.
Honeywell is obligated to fund NARCO asbestos claims submitted to the NARCO Trust which qualify for payment under the Trust Distribution Procedures (Annual Contribution Claims), subject to annual caps of $140 million in the years 2016 through 2018 and $145 million for each year thereafter. However, the initial $100 million of claims processed through the NARCO Trust (the Initial Claims Amount) will not count against the annual cap and any unused portion of the Initial Claims Amount will roll over to subsequent years until fully utilized. In 2015, Honeywell filed suit against the NARCO Trust in Bankruptcy Court alleging breach of certain provisions of the Trust Agreement and Trust Distribution Procedures. The proceeding is ongoing. As of December 31, 2015, Honeywell has not made any payments to the NARCO Trust for Annual Contribution Claims.
Honeywell is also responsible for payments due to claimants pursuant to settlement agreements reached during the pendency of the NARCO bankruptcy proceedings that provide for the right to submit claims to the NARCO Trust subject to qualification under the terms of the settlement agreements and Trust Distribution Procedures criteria (Pre-established Unliquidated Claims), which amounts are estimated at $150 million and are expected to be paid during the initial years of trust operations ($5 million of which has been paid since the effective date of the NARCO Trust). Such payments are not subject to the annual cap described above.
Our consolidated financial statements reflect an estimated liability for pre-established unliquidated claims ($145 million), unsettled claims pending as of the time NARCO filed for bankruptcy protection ($33 million) and for the estimated value of future NARCO asbestos claims expected to be asserted against the NARCO Trust through 2018 ($743 million). In the absence of actual trust experience on which to base the estimate, Honeywell projected the probable value of asbestos related future liabilities, including trust claim handling costs, based on a commonly accepted methodology used by numerous bankruptcy courts addressing 524(g) trusts. Some critical assumptions underlying this methodology include claims filing rates, disease criteria and payment values contained in the Trust Distribution Procedures, estimated approval rates of claims submitted to the NARCO Trust and epidemiological studies estimating disease instances. This projection resulted in a range of estimated
62
December 31,2015 2014
Other current assets $ 23 $ 31 Insurance recoveries for asbestos related liabilities 426 454
$ 449 $ 485
Accrued liabilities $ 292 $ 352 Asbestos related liabilities 1,251 1,200
$ 1,543 $ 1,552

HONEYWELL INTERNATIONAL INC. NOTES TO FINANCIAL STATEMENTS—(Continued)
(Dollars in millions, except per share amounts)
liability of $743 million to $961 million. We believe that no amount within this range is a better estimate than any other amount and accordingly, we have recorded the minimum amount in the range. In light of the uncertainties inherent in making long-term projections and in connection with the recent implementation of the Trust Distribution Procedures by the NARCO Trust, as well as the stay of all NARCO asbestos claims which remained in place throughout NARCO’s Chapter 11 case, we do not believe that we have a reasonable basis for estimating NARCO asbestos claims beyond 2018.
Our insurance receivable corresponding to the estimated liability for pending and future NARCO asbestos claims reflects coverage which reimburses Honeywell for portions of NARCO-related indemnity and defense costs and is provided by a large number of insurance policies written by dozens of insurance companies in both the domestic insurance market and the London excess market. We conduct analyses to estimate the probable amount of insurance that is recoverable for asbestos claims. While the substantial majority of our insurance carriers are solvent, some of our individual carriers are insolvent, which has been considered in our analysis of probable recoveries. We made judgments concerning insurance coverage that we believe are reasonable and consistent with our historical dealings and our knowledge of any pertinent solvency issues surrounding insurers.
Projecting future events is subject to many uncertainties that could cause the NARCO-related asbestos liabilities or assets to be higher or lower than those projected and recorded. Given the uncertainties, we review our estimates periodically, and update them based on our experience and other relevant factors. Similarly, we will reevaluate our projections concerning our probable insurance recoveries in light of any changes to the projected liability or other developments that may impact insurance recoveries.
Friction Products—The following tables present information regarding Bendix related asbestos claims activity:
Honeywell has experienced average resolution values per claim excluding legal costs as follows:
It is not possible to predict whether resolution values for Bendix-related asbestos claims will increase, decrease or stabilize in the future.
63
Claims Activity
Years Ended December 31,
2015 2014
Claims Unresolved at the beginning of year 9,267 12,302 Claims Filed 2,862 3,694 Claims Resolved(1) (4,350 ) (6,729 ) Claims Unresolved at the end of year 7,779 9,267
(1) Claims resolved in 2014 include 2,110 cancer claims which were determined to have no value. Also, claims resolved in 2015 and 2014 include significantly aged (i.e., pending for more than six years) claims totaling 153 and 1,266.
Disease Distribution of Unresolved ClaimsDecember 31,
2015 2014
Mesothelioma and Other Cancer Claims 3,772 3,933 Nonmalignant Claims 4,007 5,334
Total Claims 7,779 9,267
Years Ended December 31,2015 2014 2013 2012 2011
(in whole dollars) Malignant claims $ 44,000 $ 53,500 $ 51,000 $ 49,000 $ 48,000 Nonmalignant claims $ 100 $ 120 $ 850 $ 1,400 $ 1,000

HONEYWELL INTERNATIONAL INC. NOTES TO FINANCIAL STATEMENTS—(Continued)
(Dollars in millions, except per share amounts)
Our consolidated financial statements reflect an estimated liability for resolution of pending (claims actually filed as of the financial statement date) and future Bendix-related asbestos claims. We have valued Bendix pending and future claims using average resolution values for the previous five years. We update the resolution values used to estimate the cost of Bendix pending and future claims during the fourth quarter each year.
The liability for future claims represents the estimated value of future asbestos related bodily injury claims expected to be asserted against Bendix over the next five years. Such estimated cost of future Bendix-related asbestos claims is based on historic claims filing experience and dismissal rates, disease classifications, and resolution values in the tort system for the previous five years. In light of the uncertainties inherent in making long-term projections, as well as certain factors unique to friction product asbestos claims, we do not believe that we have a reasonable basis for estimating asbestos claims beyond the next five years. The methodology used to estimate the liability for future claims is similar to that used to estimate the liability for future NARCO-related asbestos claims.
Our insurance receivable corresponding to the liability for settlement of pending and future Bendix asbestos claims reflects coverage which is provided by a large number of insurance policies written by dozens of insurance companies in both the domestic insurance market and the London excess market. Based on our ongoing analysis of the probable insurance recovery, insurance receivables are recorded in the financial statements simultaneous with the recording of the estimated liability for the underlying asbestos claims. This determination is based on our analysis of the underlying insurance policies, our historical experience with our insurers, our ongoing review of the solvency of our insurers, judicial determinations relevant to our insurance programs, and our consideration of the impacts of any settlements reached with our insurers.
Honeywell believes it has sufficient insurance coverage and reserves to cover all pending Bendix-related asbestos claims and Bendix-related asbestos claims estimated to be filed within the next five years. Although it is impossible to predict the outcome of either pending or future Bendix-related asbestos claims, we do not believe that such claims would have a material adverse effect on our consolidated financial position in light of our insurance coverage and our prior experience in resolving such claims. If the rate and types of claims filed, the average resolution value of such claims and the period of time over which claim settlements are paid (collectively, the Variable Claims Factors) do not substantially change, Honeywell would not expect future Bendix-related asbestos claims to have a material adverse effect on our results of operations or operating cash flows in any fiscal year. No assurances can be given, however, that the Variable Claims Factors will not change.
Other Matters
We are subject to a number of other lawsuits, investigations and disputes (some of which involve substantial amounts claimed) arising out of the conduct of our business, including matters relating to commercial transactions, government contracts, product liability, prior acquisitions and divestitures, employee benefit plans, intellectual property, and environmental, health and safety matters. We recognize a liability for any contingency that is probable of occurrence and reasonably estimable. We continually assess the likelihood of adverse judgments of outcomes in these matters, as well as potential ranges of possible losses (taking into consideration any insurance recoveries), based on a careful analysis of each matter with the assistance of outside legal counsel and, if applicable, other experts. Included in these other matters are the following:
Honeywell v. United Auto Workers (UAW) et. al—In July 2011, Honeywell filed an action in federal court (District of New Jersey) against the UAW and all former employees who retired under a series of Master Collective Bargaining Agreements (MCBAs) between Honeywell and the UAW seeking a declaratory judgment that certain express limitations on its obligation to contribute toward the healthcare coverage of such retirees (the CAPS) set forth in the MCBAs may be implemented, effective January 1, 2012. The UAW and certain retiree defendants filed a mirror suit in the Eastern
64

HONEYWELL INTERNATIONAL INC. NOTES TO FINANCIAL STATEMENTS—(Continued)
(Dollars in millions, except per share amounts)
District of Michigan alleging that the MCBAs do not provide for CAPS on the Company’s liability for healthcare coverage. The New Jersey action was dismissed and Honeywell subsequently answered the UAW’s complaint in Michigan and asserted counterclaims for fraudulent inducement, negligent misrepresentation and breach of implied warranty. The UAW filed a motion to dismiss these counterclaims. The court dismissed Honeywell’s fraudulent inducement and negligent misrepresentation claims, but let stand the claim for breach of implied warranty. In the second quarter of 2014, the parties agreed to stay the proceedings with respect to those retirees who retired before the initial inclusions of the CAPS in the 2003 MCBA until the Supreme Court decided the M&G Polymers USA, LLC v. Tackett case. In a ruling on January 26, 2015, the Supreme Court held that retiree health insurance benefits provided in collective bargaining agreements do not carry an inference that they are vested or guaranteed to continue for life and that the “vesting” issue must be decided pursuant to ordinary principles of contract law. The stay of the proceedings has been lifted and the case is again proceeding in the normal course. Based on the Supreme Court’s ruling, Honeywell is confident that the CAPS will be upheld and that its liability for healthcare coverage premiums with respect to the putative class will be limited as negotiated and expressly set forth in the applicable MCBAs. In the event of an adverse ruling, however, Honeywell’s other postretirement benefits for pre-2003 retirees would increase by approximately $176 million, reflecting the estimated value of these CAPS.
In December 2013, the UAW and certain of the plaintiffs filed a motion for partial summary judgment with respect to those retirees who retired after the initial inclusion of the CAPS in the 2003 MCBA. The UAW sought a ruling that the 2003 MCBA did not limit Honeywell’s obligation to contribute to healthcare coverage for the post-2003 retirees. That motion remains pending. Honeywell is confident that the Court will find that the 2003 MCBA does, in fact, limit Honeywell’s retiree healthcare obligation for post-2003 retirees. In the event of an adverse ruling, however, Honeywell’s other postretirement benefits for post- 2003 retirees would increase by approximately $110 million, reflecting the estimated value of these CAPS.
Joint Strike Fighter Investigation—In 2013 the Company received subpoenas from the Department of Justice requesting information relating primarily to parts manufactured in the United Kingdom and China used in the F-35 fighter jet. The Company is cooperating fully with the investigation. While we believe that Honeywell has complied with all relevant U.S. laws and regulations regarding the manufacture of these sensors, it is not possible to predict the outcome of the investigation or what action, if any, may result from it.
Given the uncertainty inherent in litigation and investigations (including the specific matters referenced above), we do not believe it is possible to develop estimates of reasonably possible loss in excess of current accruals for these matters (other than as specifically set forth above). Considering our past experience and existing accruals, we do not expect the outcome of these matters, either individually or in the aggregate, to have a material adverse effect on our consolidated financial position. Because most contingencies are resolved over long periods of time, potential liabilities are subject to change due to new developments, changes in settlement strategy or the impact of evidentiary requirements, which could cause us to pay damage awards or settlements (or become subject to equitable remedies) that could have a material adverse effect on our results of operations or operating cash flows in the periods recognized or paid.
Warranties and Guarantees
In the normal course of business we issue product warranties and product performance guarantees. We accrue for the estimated cost of product warranties and performance guarantees based on contract terms and historical experience at the time of sale. Adjustments to initial obligations for warranties and guarantees are made as changes in the obligations become reasonably estimable.
65

HONEYWELL INTERNATIONAL INC. NOTES TO FINANCIAL STATEMENTS—(Continued)
(Dollars in millions, except per share amounts)
The following table summarizes information concerning our recorded obligations for product warranties and product performance guarantees:
Product warranties and product performance guarantees are included in the following balance sheet accounts:
Note 20. Pension and Other Postretirement Benefits
We sponsor both funded and unfunded U.S. and non-U.S. defined benefit pension plans covering the majority of our employees and retirees. Pension benefits for substantially all U.S. employees are provided through non-contributory, qualified and non-qualified defined benefit plans. All non-union hourly and salaried employees joining Honeywell for the first time after December 31, 2012, are not eligible to participate in Honeywell’s U.S. defined benefit pension plans. We also sponsor defined benefit pension plans which cover non-U.S. employees who are not U.S. citizens, in certain jurisdictions, principally the UK, Netherlands, Germany, and Canada. Other pension plans outside of the U.S. are not material to the Company either individually or in the aggregate.
We also sponsor postretirement benefit plans that provide health care benefits and life insurance coverage mainly to U.S. eligible retirees. Less than 1% of Honeywell’s U.S. employees are eligible for a retiree medical subsidy from the Company; and this subsidy is limited to a fixed-dollar amount. In addition, more than 80% of Honeywell’s current retirees either have no Company subsidy or have a fixed-dollar subsidy amount. This significantly limits our exposure to the impact of future health care cost increases. The retiree medical and life insurance plans are not funded. Claims and expenses are paid from our operating cash flow.
66
Years Ended December 31,
2015 2014 2013
Beginning of year $ 403 $ 405 $ 407 Accruals for warranties/guarantees issued during the year 206 225 212 Adjustment of pre-existing warranties/guarantees 13 (34 ) (1 ) Settlement of warranty/guarantee claims (206 ) (193 ) (213 ) End of year $ 416 $ 403 $ 405
December 31,2015 2014
Accrued liabilities $ 355 $ 332 Other liabilities 61 71
$ 416 $ 403

HONEYWELL INTERNATIONAL INC. NOTES TO FINANCIAL STATEMENTS—(Continued)
(Dollars in millions, except per share amounts)
The following tables summarize the balance sheet impact, including the benefit obligations, assets and funded status associated with our significant pension and other postretirement benefit plans.
67
Pension BenefitsU.S. Plans Non-U.S. Plans
2015 2014 2015 2014Change in benefit obligation:
Benefit obligation at beginning of year $ 18,035 $ 16,290 $ 5,761 $ 5,523 Service cost 223 241 51 56 Interest cost 696 771 177 231 Plan amendments (429 ) — — (17 ) Actuarial (gains) losses (269 ) 1,718 (178 ) 601 Acquisitions 61 — 1,137 — Divestitures — — — (61 ) Benefits paid (1,027 ) (996 ) (199 ) (210 ) Settlements and curtailments — — (11 ) — Foreign currency and other 8 11 (400 ) (362 ) Benefit obligation at end of year 17,298 18,035 6,338 5,761
Change in plan assets: Fair value of plan assets at beginning of year 17,066 16,727 5,333 5,037 Actual return on plan assets 233 1,290 154 622 Company contributions 34 36 147 187 Acquisitions 43 — 1,036 — Benefits paid (1,027 ) (996 ) (199 ) (210 ) Foreign currency and other — 9 (354 ) (303 ) Fair value of plan assets at end of year 16,349 17,066 6,117 5,333
Funded status of plans $ (949 ) $ (969 ) $ (221 ) $ (428 ) Amounts recognized in Consolidated Balance Sheet consist of:
Prepaid pension benefit cost(1) $ — $ — $ 427 $ 270 Accrued pension liabilities—current(2) (51 ) (74 ) (7 ) (8 ) Accrued pension liabilities—noncurrent(3) (898 ) (895 ) (641 ) (690 )
Net amount recognized $ (949 ) $ (969 ) $ (221 ) $ (428 )
(1) Included in other assets on Consolidated Balance Sheet
(2) Included in accrued liabilities on Consolidated Balance Sheet
(3) Included in other liabilities—noncurrent on Consolidated Balance Sheet

HONEYWELL INTERNATIONAL INC. NOTES TO FINANCIAL STATEMENTS—(Continued)
(Dollars in millions, except per share amounts)
Amounts recognized in accumulated other comprehensive (income) loss associated with our significant pension and other postretirement benefit plans at December 31, 2015 and 2014 are as follows:
68
Other Postretirement
Benefits2015 2014
Change in benefit obligation: Benefit obligation at beginning of year $ 973 $ 1,096 Service cost — — Interest cost 33 42 Plan amendments(1) (290 ) (87 ) Actuarial (gains) losses (55 ) 46 Benefits paid (92 ) (124 ) Benefit obligation at end of year 569 973
Change in plan assets: Fair value of plan assets at beginning of year — — Actual return on plan assets — — Company contributions — — Benefits paid — —
Fair value of plan assets at end of year — — Funded status of plans $ (569 ) $ (973 ) Amounts recognized in Consolidated Balance Sheet consist of:
Accrued liabilities $ (85 ) $ (111 ) Postretirement benefit obligations other than pensions(2) (484 ) (862 )
Net amount recognized $ (569 ) $ (973 )
(1) Elimination of retiree medical insurance coverage for certain retirees. Amount will be recognized as part of net postretirement benefit cost over the expected future lifetime of the remaining participants in the plan.
(2) Excludes non-U.S. plans of $42 million and $49 million in 2015 and 2014.
Pension BenefitsU.S. Plans Non-U.S. Plans
2015 2014 2015 2014
Transition obligation $ — $ — $ — $ 1 Prior service (credit) cost (355 ) 88 (22 ) (27 ) Net actuarial loss 1,005 281 464 493
Net amount recognized $ 650 $ 369 $ 442 $ 467
Other Postretirement
Benefits2015 2014
Prior service (credit) $ (496 ) $ (235 ) Net actuarial loss 189 278
Net amount recognized $ (307 ) $ 43

HONEYWELL INTERNATIONAL INC. NOTES TO FINANCIAL STATEMENTS—(Continued)
(Dollars in millions, except per share amounts)
The components of net periodic benefit (income) cost and other amounts recognized in other comprehensive (income) loss for our significant pension and other postretirement benefit plans include the following components:
The estimated prior service (credit) for pension benefits that will be amortized from accumulated other comprehensive (income) loss into net periodic benefit (income) cost in 2016 are expected to be ($44) million and ($3) million for U.S. and non-U.S. pension plans.
69
Net Periodic Benefit Cost
Pension BenefitsU.S. Plans Non-U.S. Plans
2015 2014 2013 2015 2014 2013
Service cost $ 223 $ 241 $ 272 $ 51 $ 56 $ 58 Interest cost 696 771 677 177 231 215 Expected return on plan assets (1,278 ) (1,257 ) (1,076 ) (358 ) (354 ) (308 ) Amortization of transition obligation — — — 1 2 2 Amortization of prior service cost (credit) 13 23 23 (3 ) (2 ) (2 ) Recognition of actuarial losses 52 26 — 15 223 51 Settlements and curtailments 8 — — 2 — —
Net periodic benefit (income) cost $ (286 ) $ (196 ) $ (104 ) $ (115 ) $ 156 $ 16
Other Changes in Plan Assets and Benefits Obligations Recognized in Other Comprehensive (Income) Loss
U.S. Plans Non-U.S. Plans
2015 2014 2013 2015 2014 2013
Actuarial losses (gains) $ 775 $ 1,686 $ (3,090 ) $ 27 $ 333 $ (48 ) Prior service (credit) cost (429 ) — 14 — (17 ) — Transition obligation recognized during year — — — (1 ) (2 ) (2 ) Prior service (cost) credit recognized during year (13 ) (23 ) (23 ) 3 2 2 Actuarial losses recognized during year (52 ) (26 ) — (17 ) (223 ) (51 ) Foreign exchange translation adjustments — — — (37 ) (50 ) 3
Total recognized in other comprehensive (income) loss $ 281 $ 1,637 $ (3,099 ) $ (25 ) $ 43 $ (96 ) Total recognized in net periodic benefit (income) cost and other
comprehensive (income) loss $ (5 ) $ 1,441 $ (3,203 ) $ (140 ) $ 199 $ (80 )
Net Periodic Benefit Cost
Other Postretirement Benefits Years Ended
December 31,2015 2014 2013
Service cost $ — $ — $ — Interest cost 33 42 44 Amortization of prior service (credit) (30 ) (20 ) (13 ) Recognition of actuarial losses 34 24 27 Settlements and curtailments(1) — — (42 ) Net periodic benefit cost $ 37 $ 46 $ 16
(1) Curtailment gain in 2013 related to elimination of retiree medical coverage for a union group in connection with a new collective bargaining agreement.
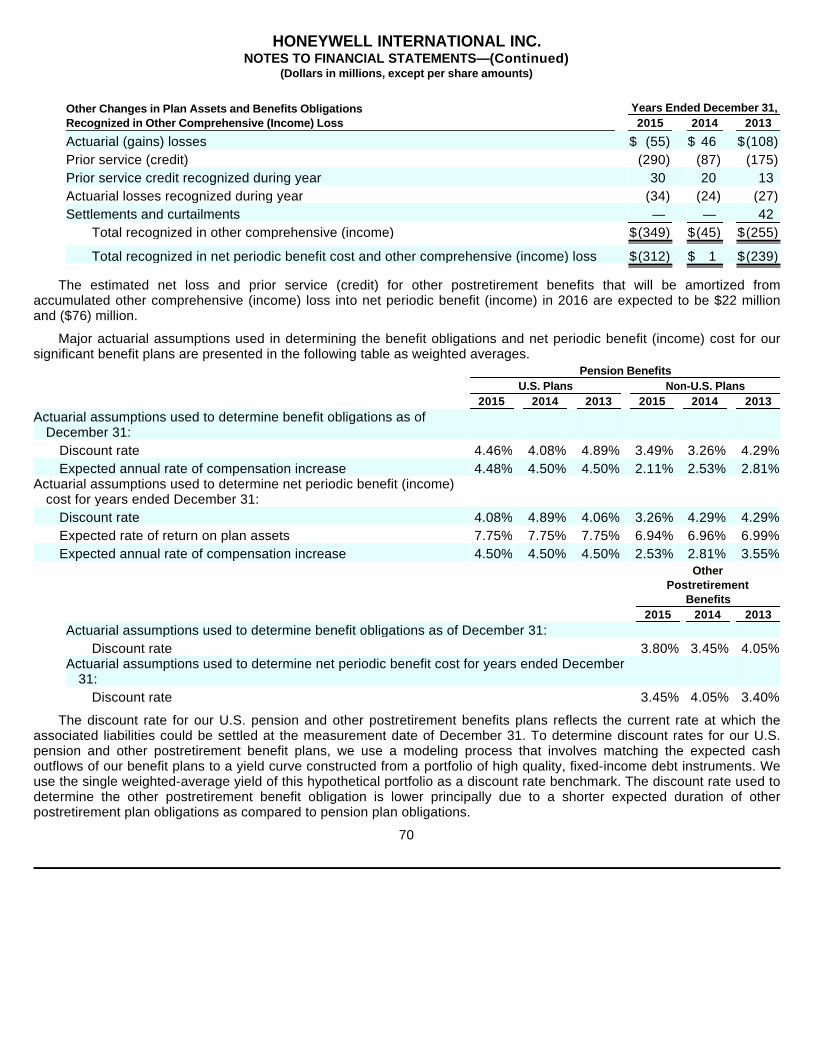
HONEYWELL INTERNATIONAL INC. NOTES TO FINANCIAL STATEMENTS—(Continued)
(Dollars in millions, except per share amounts)
The estimated net loss and prior service (credit) for other postretirement benefits that will be amortized from accumulated other comprehensive (income) loss into net periodic benefit (income) in 2016 are expected to be $22 million and ($76) million.
Major actuarial assumptions used in determining the benefit obligations and net periodic benefit (income) cost for our significant benefit plans are presented in the following table as weighted averages.
The discount rate for our U.S. pension and other postretirement benefits plans reflects the current rate at which the associated liabilities could be settled at the measurement date of December 31. To determine discount rates for our U.S. pension and other postretirement benefit plans, we use a modeling process that involves matching the expected cash outflows of our benefit plans to a yield curve constructed from a portfolio of high quality, fixed-income debt instruments. We use the single weighted-average yield of this hypothetical portfolio as a discount rate benchmark. The discount rate used to determine the other postretirement benefit obligation is lower principally due to a shorter expected duration of other postretirement plan obligations as compared to pension plan obligations.
70
Other Changes in Plan Assets and Benefits Obligations Recognized in Other Comprehensive (Income) Loss
Years Ended December 31,2015 2014 2013
Actuarial (gains) losses $ (55 ) $ 46 $ (108 ) Prior service (credit) (290 ) (87 ) (175 ) Prior service credit recognized during year 30 20 13 Actuarial losses recognized during year (34 ) (24 ) (27 ) Settlements and curtailments — — 42
Total recognized in other comprehensive (income) $ (349 ) $ (45 ) $ (255 ) Total recognized in net periodic benefit cost and other comprehensive (income) loss $ (312 ) $ 1 $ (239 )
Pension BenefitsU.S. Plans Non-U.S. Plans
2015 2014 2013 2015 2014 2013Actuarial assumptions used to determine benefit obligations as of
December 31: Discount rate 4.46 % 4.08 % 4.89 % 3.49 % 3.26 % 4.29 % Expected annual rate of compensation increase 4.48 % 4.50 % 4.50 % 2.11 % 2.53 % 2.81 %
Actuarial assumptions used to determine net periodic benefit (income) cost for years ended December 31:
Discount rate 4.08 % 4.89 % 4.06 % 3.26 % 4.29 % 4.29 % Expected rate of return on plan assets 7.75 % 7.75 % 7.75 % 6.94 % 6.96 % 6.99 % Expected annual rate of compensation increase 4.50 % 4.50 % 4.50 % 2.53 % 2.81 % 3.55 %
Other Postretirement
Benefits2015 2014 2013
Actuarial assumptions used to determine benefit obligations as of December 31: Discount rate 3.80 % 3.45 % 4.05 %
Actuarial assumptions used to determine net periodic benefit cost for years ended December 31:
Discount rate 3.45 % 4.05 % 3.40 %

HONEYWELL INTERNATIONAL INC. NOTES TO FINANCIAL STATEMENTS—(Continued)
(Dollars in millions, except per share amounts)
During the fourth quarter of 2015 we changed the methodology used to estimate the service and interest cost components of net periodic benefit (income) cost for our significant pension plans. Previously, we estimated such cost components utilizing a single weighted-average discount rate derived from the yield curve used to measure the pension benefit obligation. The new methodology utilizes a full yield curve approach in the estimation of these cost components by applying the specific spot rates along the yield curve used in the determination of the pension benefit obligation to their underlying projected cash flows and provides a more precise measurement of service and interest costs by improving the correlation between projected cash flows and their corresponding spot rates. The change does not affect the measurement of our pension obligation and is applied prospectively as a change in estimate.
For our U.S. pension plans, the single weighted-average spot rates used to determine service and interest costs for 2016 are 4.69% and 3.59%. We estimate the service and interest costs for our U.S. pension plans will be reduced by approximately $150 million in 2016.
Our expected rate of return on U.S. plan assets of 7.75% is a long-term rate based on historical plan asset returns over varying long-term periods combined with current market conditions and broad asset mix considerations. We review the expected rate of return on an annual basis and revise it as appropriate.
For non-U.S. benefit plans actuarial assumptions reflect economic and market factors relevant to each country. The impact of the discount rate methodology change on service and interest costs for our non-U.S. pension plans was not material.
Pension Benefits
Included in the aggregate data in the tables above are the amounts applicable to our pension plans with accumulated benefit obligations exceeding the fair value of plan assets. Amounts related to such plans were as follows:
Accumulated benefit obligation for our U.S. defined benefit pension plans were $16.9 billion and $17.2 billion and for our Non-U.S. defined benefit plans were $6.2 billion and $5.5 billion at December 31, 2015 and 2014.
Our asset investment strategy for our U.S. pension plans focuses on maintaining a diversified portfolio using various asset classes in order to achieve our long-term investment objectives on a risk adjusted basis. Our actual invested positions in various securities change over time based on short and longer- term investment opportunities. To achieve our objectives, we have established long-term target allocations as follows: 60%-70% equity securities, 10%-20% fixed income securities and cash, 5%-15% real estate investments, and 10%-20% other types of investments. Equity securities include publicly-traded stock of companies located both inside and outside the United States. Fixed income securities include corporate bonds of companies from diversified industries, mortgage-backed securities, and U.S. Treasuries. Real estate investments include direct investments in commercial properties and investments in real estate funds. Other types of investments include investments in private equity and hedge funds that follow several different strategies. We review our assets on a regular basis to ensure that we are within the targeted asset allocation ranges and, if necessary, asset balances are adjusted back within target allocations.
71
December 31,U.S. Plans Non-U.S. Plans
2015 2014 2015 2014
Projected benefit obligation $ 17,298 $ 626 $ 1,624 $ 1,686 Accumulated benefit obligation $ 16,899 $ 618 $ 1,574 $ 1,584 Fair value of plan assets $ 16,349 $ 194 $ 976 $ 994

HONEYWELL INTERNATIONAL INC. NOTES TO FINANCIAL STATEMENTS—(Continued)
(Dollars in millions, except per share amounts)
Our non-U.S. pension assets are typically managed by decentralized fiduciary committees with the Honeywell Corporate Investments group providing standard funding and investment guidance. Our non-U.S. investment policies are different for each country as local regulations, funding rules, and financial and tax considerations are part of the funding and investment allocation process in each country.
The fair values of both our U.S. and non-U.S. pension plans assets by asset category are as follows:
72
U.S. PlansDecember 31, 2015
Total Level 1 Level 2 Level 3Common stock/preferred stock:
Honeywell common stock $ 1,916 $ 1,916 $ — $ — U.S. large cap stocks 3,761 3,761 — — U.S. mid cap stocks 722 722 — — U.S. small cap stocks 89 89 — — International stocks 2,099 1,943 156 — Real estate investment trusts 209 209 — —
Fixed income investments: Short term investments 1,332 1,332 — — Government securities 425 — 425 — Corporate bonds 3,003 — 3,003 — Mortgage/Asset-backed securities 561 — 561 — Insurance contracts 7 — 7 —
Investments in private funds: Private funds 889 — — 889 Hedge funds 19 — — 19 Real estate funds 156 — — 156
Direct investments: Direct private investments 535 — — 535 Real estate properties 626 — — 626
$ 16,349 $ 9,972 $ 4,152 $ 2,225

HONEYWELL INTERNATIONAL INC. NOTES TO FINANCIAL STATEMENTS—(Continued)
(Dollars in millions, except per share amounts)
73
U.S. PlansDecember 31, 2014
Total Level 1 Level 2 Level 3Common stock/preferred stock:
Honeywell common stock $ 1,851 $ 1,851 $ — $ — U.S. large cap stocks 3,913 3,867 46 — U.S. mid cap stocks 1,028 1,018 10 — U.S. small cap stocks 219 219 — — International stocks 2,576 2,400 176 — Real estate investment trusts 204 204 — —
Fixed income investments: Short term investments 1,078 1,078 — — Government securities 438 — 438 — Corporate bonds 2,988 — 2,988 — Mortgage/Asset-backed securities 635 — 635 — Insurance contracts 7 — 7 —
Investments in private funds: Private funds 999 — — 999 Hedge funds 3 — — 3 Real estate funds 226 — — 226
Direct investments: Direct private investments 301 — — 301 Real estate properties 600 — — 600
$ 17,066 $ 10,637 $ 4,300 $ 2,129
Non-U.S. PlansDecember 31, 2015
Total Level 1 Level 2 Level 3Common stock/preferred stock:
U.S. companies $ 569 $ 479 $ 90 $ — Non-U.S. companies 2,200 228 1,972 —
Fixed income investments: Short-term investments 108 105 3 — Government securities 1,621 — 1,621 — Corporate bonds 1,073 — 1,073 — Mortgage/Asset-backed securities 94 — 94 — Insurance contracts 170 — 170 —
Investments in private funds: Private funds 61 — — 61 Hedge funds — — — — Real estate funds 221 — — 221
$ 6,117 $ 812 $ 5,023 $ 282
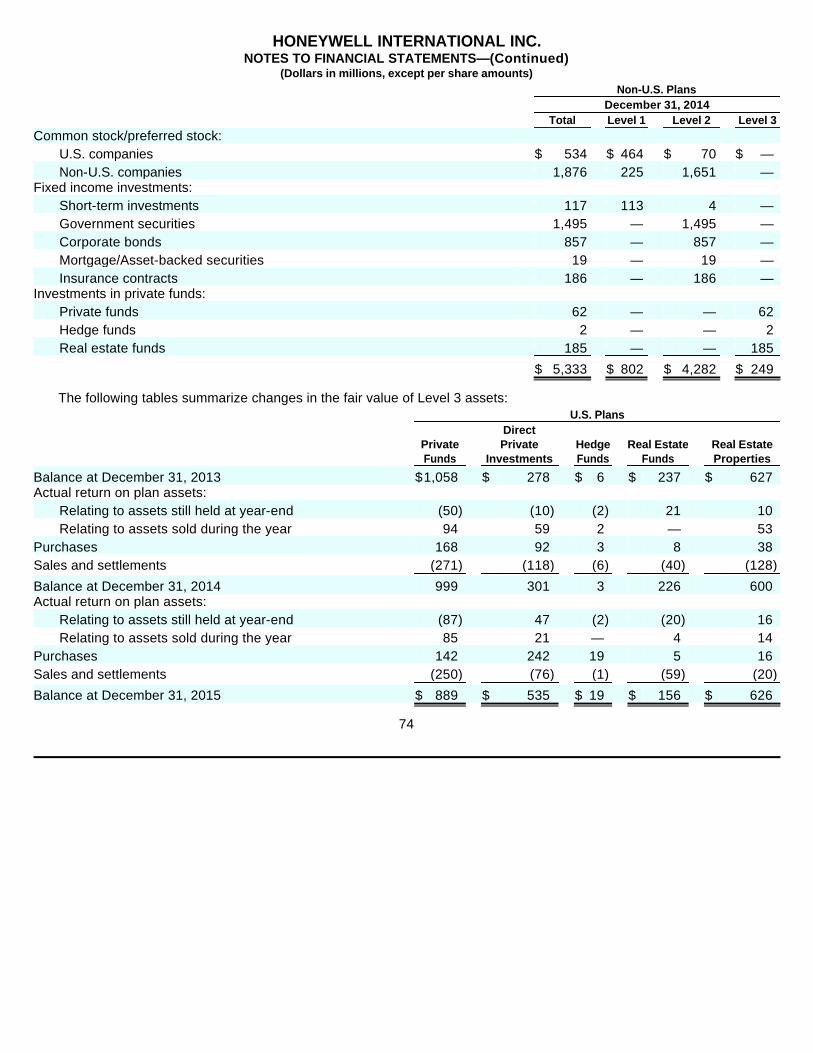
HONEYWELL INTERNATIONAL INC. NOTES TO FINANCIAL STATEMENTS—(Continued)
(Dollars in millions, except per share amounts)
The following tables summarize changes in the fair value of Level 3 assets:
74
Non-U.S. PlansDecember 31, 2014
Total Level 1 Level 2 Level 3Common stock/preferred stock:
U.S. companies $ 534 $ 464 $ 70 $ — Non-U.S. companies 1,876 225 1,651 —
Fixed income investments: Short-term investments 117 113 4 — Government securities 1,495 — 1,495 — Corporate bonds 857 — 857 — Mortgage/Asset-backed securities 19 — 19 — Insurance contracts 186 — 186 —
Investments in private funds: Private funds 62 — — 62 Hedge funds 2 — — 2 Real estate funds 185 — — 185
$ 5,333 $ 802 $ 4,282 $ 249
U.S. Plans
Private Funds
Direct Private
InvestmentsHedge Funds
Real Estate Funds
Real Estate Properties
Balance at December 31, 2013 $ 1,058 $ 278 $ 6 $ 237 $ 627 Actual return on plan assets:
Relating to assets still held at year-end (50 ) (10 ) (2 ) 21 10 Relating to assets sold during the year 94 59 2 — 53
Purchases 168 92 3 8 38 Sales and settlements (271 ) (118 ) (6 ) (40 ) (128 ) Balance at December 31, 2014 999 301 3 226 600 Actual return on plan assets:
Relating to assets still held at year-end (87 ) 47 (2 ) (20 ) 16 Relating to assets sold during the year 85 21 — 4 14
Purchases 142 242 19 5 16 Sales and settlements (250 ) (76 ) (1 ) (59 ) (20 ) Balance at December 31, 2015 $ 889 $ 535 $ 19 $ 156 $ 626

HONEYWELL INTERNATIONAL INC. NOTES TO FINANCIAL STATEMENTS—(Continued)
(Dollars in millions, except per share amounts)
The Company enters into futures contracts to gain exposure to certain markets. Sufficient cash or cash equivalents are held by our pension plans to cover the notional value of the futures contracts. At December 31, 2015 and 2014, our U.S. plans had contracts with notional amounts of $2,613 million and $2,354 million. At December 31, 2015 and 2014, our non-U.S. plans had contracts with notional amounts of $54 million and $65 million. In both our U.S. and non-U.S. pension plans, the notional derivative exposure is primarily related to outstanding equity futures contracts.
Common stocks, preferred stocks, real estate investment trusts, and short-term investments are valued at the closing price reported in the active market in which the individual securities are traded. Corporate bonds, mortgages, asset-backed securities, and government securities are valued either by using pricing models, bids provided by brokers or dealers, quoted prices of securities with similar characteristics or discounted cash flows and as such include adjustments for certain risks that may not be observable such as credit and liquidity risks. Certain securities are held in commingled funds which are valued using net asset values provided by the administrators of the funds. Investments in private equity, debt, real estate and hedge funds and direct private investments are valued at estimated fair value based on quarterly financial information received from the investment advisor and/or general partner. Investments in real estate properties are valued on a quarterly basis using the income approach. Valuation estimates are periodically supplemented by third party appraisals.
Our general funding policy for qualified defined benefit pension plans is to contribute amounts at least sufficient to satisfy regulatory funding standards. In 2015, 2014 and 2013, we were not required to make contributions to our U.S. pension plans and no contributions were made. We are not required to make any contributions to our U.S. pension plans in 2016. In 2015, contributions of $139 million were made to our non-U.S. pension plans to satisfy regulatory funding requirements. In 2016, we expect to make contributions of cash and/or marketable securities of approximately $160 million to our non-U.S. pension plans to satisfy regulatory funding standards. Contributions for both our U.S. and non-U.S. pension plans do not reflect benefits paid directly from Company assets.
75
Non-U.S. PlansPrivate Funds
Hedge Funds
Real Estate Funds
Balance at December 31, 2013 $ 67 $ 62 $ 181 Actual return on plan assets:
Relating to assets still held at year-end (4 ) (11 ) 17 Relating to assets sold during the year 6 12 1
Purchases — — 4 Sales and settlements (7 ) (61 ) (18 ) Balance at December 31, 2014 62 2 185 Actual return on plan assets:
Relating to assets still held at year-end (7 ) — 24 Relating to assets sold during the year 7 — (3 )
Purchases 11 — 41 Sales and settlements (12 ) (2 ) (26 ) Balance at December 31, 2015 $ 61 $ — $ 221
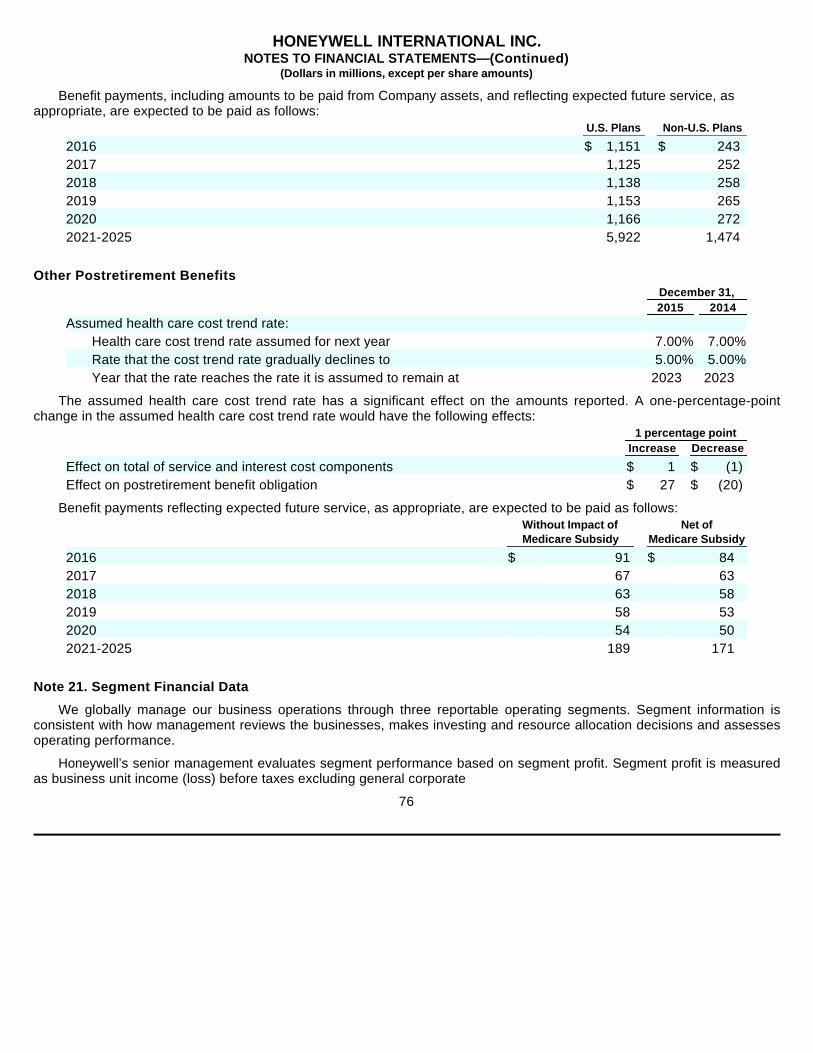
HONEYWELL INTERNATIONAL INC. NOTES TO FINANCIAL STATEMENTS—(Continued)
(Dollars in millions, except per share amounts)
Benefit payments, including amounts to be paid from Company assets, and reflecting expected future service, as appropriate, are expected to be paid as follows:
Other Postretirement Benefits
The assumed health care cost trend rate has a significant effect on the amounts reported. A one-percentage-point change in the assumed health care cost trend rate would have the following effects:
Benefit payments reflecting expected future service, as appropriate, are expected to be paid as follows:
Note 21. Segment Financial Data
We globally manage our business operations through three reportable operating segments. Segment information is consistent with how management reviews the businesses, makes investing and resource allocation decisions and assesses operating performance.
Honeywell’s senior management evaluates segment performance based on segment profit. Segment profit is measured as business unit income (loss) before taxes excluding general corporate
76
U.S. Plans Non-U.S. Plans
2016 $ 1,151 $ 243 2017 1,125 252 2018 1,138 258 2019 1,153 265 2020 1,166 272 2021-2025 5,922 1,474
December 31,2015 2014
Assumed health care cost trend rate: Health care cost trend rate assumed for next year 7.00 % 7.00 % Rate that the cost trend rate gradually declines to 5.00 % 5.00 % Year that the rate reaches the rate it is assumed to remain at 2023 2023
1 percentage pointIncrease Decrease
Effect on total of service and interest cost components $ 1 $ (1 ) Effect on postretirement benefit obligation $ 27 $ (20 )
Without Impact of Medicare Subsidy
Net of Medicare Subsidy
2016 $ 91 $ 84 2017 67 63 2018 63 58 2019 58 53 2020 54 50 2021-2025 189 171

HONEYWELL INTERNATIONAL INC. NOTES TO FINANCIAL STATEMENTS—(Continued)
(Dollars in millions, except per share amounts)
unallocated expense, other income (expense), interest and other financial charges, pension and other postretirement benefits (expense), stock compensation expense and repositioning and other charges.
77
Years Ended December 31,2015 2014 2013
Net Sales Aerospace
Product $ 10,379 $ 10,773 $ 10,798 Service 4,858 4,825 4,937
Total 15,237 15,598 15,735 Automation and Control Solutions
Product 12,882 13,219 12,253 Service 1,227 1,268 1,212
Total 14,109 14,487 13,465 Performance Materials and Technologies
Product 7,434 8,406 8,163 Service 1,801 1,815 1,692
Total 9,235 10,221 9,855
$ 38,581 $ 40,306 $ 39,055
Depreciation and amortization Aerospace $ 267 $ 277 $ 290 Automation and Control Solutions 277 306 302 Performance Materials and Technologies 282 284 336 Corporate 57 57 61
$ 883 $ 924 $ 989
Segment Profit Aerospace $ 3,218 $ 2,915 $ 2,870 Automation and Control Solutions 2,313 2,200 1,983 Performance Materials and Technologies 1,935 1,817 1,725 Corporate (210 ) (236 ) (227 )
$ 7,256 $ 6,696 $ 6,351
Capital expenditures Aerospace $ 314 $ 315 $ 310 Automation and Control Solutions 152 145 132 Performance Materials and Technologies 479 537 448 Corporate 128 97 57
$ 1,073 $ 1,094 $ 947
December 31,2015 2014 2013
Total Assets Aerospace $ 11,235 $ 11,151 $ 11,379 Automation and Control Solutions 22,355 17,191 17,675 Performance Materials and Technologies 10,300 9,699 9,534 Corporate 5,426 7,410 6,847
$ 49,316 $ 45,451 $ 45,435

HONEYWELL INTERNATIONAL INC. NOTES TO FINANCIAL STATEMENTS—(Continued)
(Dollars in millions, except per share amounts)
A reconciliation of segment profit to consolidated income from continuing operations before taxes are as follows:
Note 22. Geographic Areas—Financial Data
78
Years Ended December 31,2015 2014 2013
Segment Profit $ 7,256 $ 6,696 $ 6,351 Other income (expense)(1) 38 269 202 Interest and other financial charges (310 ) (318 ) (327 ) Stock compensation expense(2) (175 ) (187 ) (170 ) Pension ongoing income (expense)(2) 430 254 90 Pension mark-to-market expense(2) (67 ) (249 ) (51 ) Other postretirement income (expense)(2) (40 ) (49 ) (20 ) Repositioning and other charges(2) (546 ) (598 ) (663 ) Income from continuing operations before taxes $ 6,586 $ 5,818 $ 5,412
(1) Equity income (loss) of affiliated companies is included in Segment Profit.
(2) Amounts included in cost of products and services sold and selling, general and administrative expenses.
Net Sales(1) Long-lived Assets(2)Years Ended December 31, December 31,
2015 2014 2013 2015 2014 2013
United States $ 23,771 $ 23,911 $ 22,978 $ 3,939 $ 3,612 $ 3,393 Europe 8,674 9,870 9,804 746 741 905 Other International 6,136 6,525 6,273 1,104 1,030 980
$ 38,581 $ 40,306 $ 39,055 $ 5,789 $ 5,383 $ 5,278
(1) Sales between geographic areas approximate market and are not significant. Net sales are classified according to their country of origin. Included in United States net sales are export sales of $5,526 million, $5,647 million and $5,431 million in 2015, 2014 and 2013.
(2) Long-lived assets are comprised of property, plant and equipment—net.

HONEYWELL INTERNATIONAL INC. NOTES TO FINANCIAL STATEMENTS—(Continued)
(Dollars in millions, except per share amounts)
Note 23. Supplemental Cash Flow Information
Note 24. Unaudited Quarterly Financial Information
79
Years Ended December 31,2015 2014 2013
Payments for repositioning and other charges: Severance and exit cost payments $ (118 ) $ (161 ) $ (160 ) Environmental payments (273 ) (321 ) (304 ) Insurance receipts for asbestos related liabilities 63 211 58 Asbestos related liability payments (209 ) (259 ) (357 )
$ (537 ) $ (530 ) $ (763 ) Interest paid, net of amounts capitalized $ 310 $ 312 $ 330 Income taxes paid, net of refunds 1,192 1,142 1,271 Non-cash investing and financing activities:
Common stock contributed to savings plans 174 168 159 Marketable securities contributed to non-U.S. pension plans 109 117 —
2015Mar. 31 June 30 Sept. 30 Dec. 31 Year
Net Sales $ 9,213 $ 9,775 $ 9,611 $ 9,982 $ 38,581 Gross Profit 2,851 2,961 2,957 3,065 11,834
Net income attributable to Honeywell 1,116 1,194 1,264 1,194 4,768 Earnings per share—basic 1.42 1.52 1.62 1.55 6.11 Earnings per share—assuming dilution 1.41 1.51 1.60 1.53 6.04 Dividends paid per share 0.5175 0.5175 0.5175 0.5950 2.15 Market Price per share
High 101.76 104.17 104.29 101.65 104.29 Low 98.78 102.87 101.72 92.93 92.93
2014Mar. 31 June 30 Sept. 30 Dec. 31 Year
Net Sales $ 9,679 $ 10,253 $ 10,108 $ 10,266 $ 40,306 Gross Profit 2,712 2,957 2,980 2,700 11,349
Net income attributable to Honeywell 1,017 1,099 1,167 956 4,239 Earnings per share—basic 1.30 1.40 1.49 1.22 5.40 Earnings per share—assuming dilution 1.28 1.38 1.47 1.20 5.33 Dividends paid per share 0.4500 0.4500 0.4500 0.5175 1.87 Market Price per share
High 95.44 95.81 97.34 101.98 101.98 Low 88.47 90.36 90.56 85.11 85.11

Report of Independent Registered Public Accounting Firm
TO THE BOARD OF DIRECTORS AND SHAREHOLDERS OF HONEYWELL INTERNATIONAL INC.:
We have audited the accompanying consolidated balance sheet of Honeywell International Inc. and subsidiaries (the “Company”) as of December 31, 2015, and the related consolidated statements of operations, comprehensive income, cash flows and shareowners’ equity for the year then ended. We also have audited the Company’s internal control over financial reporting as of December 31, 2015 based on the criteria established in Internal Control—Integrated Framework (2013) issued by the Committee of Sponsoring Organizations of the Treadway Commission. As described in Management’s Report on Internal Control Over Financial Reporting, management excluded from its assessment the internal control over financial reporting at the Elster Division of Melrose Industries Plc. (“Elster”), which was acquired on December 29, 2015 and whose financial statements constitute approximately 1.8% of consolidated total assets and a de minimis percentage of total consolidated net sales for the year ended December 31, 2015. Accordingly, our audit did not include the internal control over financial reporting at Elster. The Company’s management is responsible for these financial statements, for maintaining effective internal control over financial reporting, and for its assessment of the effectiveness of internal control over financial reporting, including in the accompanying Management’s Report on Internal Control Over Financial Reporting. Our responsibility is to express an opinion on these consolidated financial statements and an opinion on the Company’s internal control over financial reporting based on our audits.
We conducted our audits in accordance with the standards of the Public Company Accounting Oversight Board (United States). Those standards require that we plan and perform the audit to obtain reasonable assurance about whether the financial statements are free of material misstatement and whether effective internal control over financial reporting was maintained in all material respects. Our audit of the financial statements included examining, on a test basis, evidence supporting the amounts and disclosures in the financial statements, assessing the accounting principles used and significant estimates made by management, and evaluating the overall financial statement presentation. Our audit of internal control over financial reporting included obtaining an understanding of internal control over financial reporting, assessing the risk that a material weakness exists, and testing and evaluating the design and operating effectiveness of internal control based on the assessed risk. Our audits also included performing such procedures as we considered necessary in the circumstances. We believe that our audits provide a reasonable basis for our opinions.
A company’s internal control over financial reporting is a process designed by, or under the supervision of, the company’s principal executive and principal financial officers, or persons performing similar functions, and effected by the company’s board of directors, management, and other personnel to provide reasonable assurance regarding the reliability of financial reporting and the preparation of financial statements for external purposes in accordance with generally accepted accounting principles. A company’s internal control over financial reporting includes those policies and procedures that (1) pertain to the maintenance of records that, in reasonable detail, accurately and fairly reflect the transactions and dispositions of the assets of the company; (2) provide reasonable assurance that transactions are recorded as necessary to permit preparation of financial statements in accordance with generally accepted accounting principles, and that receipts and expenditures of the company are being made only in accordance with authorizations of management and directors of the company; and (3) provide reasonable assurance regarding prevention or timely detection of unauthorized acquisition, use, or disposition of the company’s assets that could have a material effect on the financial statements.
Because of the inherent limitations of internal control over financial reporting, including the possibility of collusion or improper management override of controls, material misstatements due to error or fraud may not be prevented or detected on a timely basis. Also, projections of any evaluation of the effectiveness of the internal control over financial reporting to future periods are subject to the risk that the controls may become inadequate because of changes in conditions, or that the degree of compliance with the policies or procedures may deteriorate.
80

In our opinion, the consolidated financial statements referred to above present fairly, in all material respects, the financial position of the Company as of December 31, 2015, and the results of their operations and their cash flows for the year then ended, in conformity with accounting principles generally accepted in the United States of America. Also, in our opinion, the Company maintained, in all material respects, effective internal control over financial reporting as of December 31, 2015, based on the criteria established in Internal Control—Integrated Framework (2013) issued by the Committee of Sponsoring Organizations of the Treadway Commission.
/s/ Deloitte & Touche LLP Parsippany, New Jersey February 12, 2016
81

Report of Independent Registered Public Accounting Firm
TO THE BOARD OF DIRECTORS AND SHAREHOLDERS OF HONEYWELL INTERNATIONAL INC.:
In our opinion, the accompanying consolidated balance sheet as of December 31, 2014 and the related consolidated statements of income, comprehensive income, shareholders’ equity and cash flows for each of two years in the period ended December 31, 2014 present fairly, in all material respects, the financial position of Honeywell International Inc. and its subsidiaries at December 31, 2014, and the results of their operations and their cash flows for each of the two years in the period ended December 31, 2014, in conformity with accounting principles generally accepted in the United States of America. These financial statements are the responsibility of the Company’s management. Our responsibility is to express an opinion on these financial statements based on our audits. We conducted our audits of these statements in accordance with the standards of the Public Company Accounting Oversight Board (United States). Those standards require that we plan and perform the audit to obtain reasonable assurance about whether the financial statements are free of material misstatement. An audit includes examining, on a test basis, evidence supporting the amounts and disclosures in the financial statements, assessing the accounting principles used and significant estimates made by management, and evaluating the overall financial statement presentation. We believe that our audits provide a reasonable basis for our opinion.
/s/ PricewaterhouseCoopers LLP Florham Park, New Jersey February 13, 2015
82

Item 9. Changes in and Disagreements with Accountants on Accounting and Financial Disclosure
Not Applicable.
Item 9A. Controls and Procedures
Honeywell management maintains disclosure controls and procedures designed to provide reasonable assurance that information required to be disclosed in reports filed under the Securities Exchange Act of 1934, as amended (Exchange Act) is recorded, processed, summarized and reported within the specified time periods and accumulated and communicated to our management, including our principal executive officer and principal financial officer, as appropriate to allow timely decisions regarding required disclosure. There have been no changes that have materially affected, or are reasonably likely to materially affect, Honeywell’s internal control over financial reporting that have occurred during the quarter ended December 31, 2015.
Our management, with the participation of our CEO and CFO, evaluated the effectiveness of our disclosure controls and procedures (as defined in Rules 13a-15(e) or 15d-15(e) promulgated under the Exchange Act) at December 31, 2015. Based on these evaluations, our CEO and CFO concluded that our disclosure controls and procedures required by paragraph (b) of Rules 13a-15 or 15d-15 were effective as of December 31, 2015.
Management’s Report on Internal Control Over Financial Reporting
Honeywell management is responsible for establishing and maintaining adequate internal control over financial reporting and for its assessment of the effectiveness of internal control over financial reporting as defined in Rules 13a-15(f) and 15d-15(f) under the Securities Exchange Act of 1934. Honeywell’s internal control over financial reporting is a process designed to provide reasonable assurance to our management and board of directors regarding the reliability of financial reporting and the preparation of financial statements for external purposes in accordance with generally accepted accounting principles.
Because of its inherent limitations, internal control over financial reporting may not prevent or detect misstatements.
Management assessed the effectiveness of Honeywell’s internal control over financial reporting as of December 31, 2015. In making this assessment, management used the criteria set forth by the Committee of Sponsoring Organizations of the Treadway Commission (COSO) in Internal Control–Integrated Framework (2013). Management excluded the Elster Division of Melrose Industries plc (Elster), acquired on December 29, 2015, from its evaluation of internal control over financial reporting as of December 31, 2015. As of December 31, 2015 Elster represented approximately 1.8% of our consolidated total assets and a de minimus percentage of our total consolidated sales for the year ended December 31, 2015.
Based on this assessment, management determined that Honeywell maintained effective internal control over financial reporting as of December 31, 2015.
The effectiveness of Honeywell’s internal control over financial reporting as of December 31, 2015 has been audited by Deloitte & Touche LLP, an independent registered public accounting firm, as stated in their report which is included in Item 8. Financial Statements and Supplementary Data.
Item 9B. Other Information
Under the Iran Threat Reduction and Syrian Human Rights Act of 2012, which added Section 13(r) of the Securities Exchange Act of 1934, Honeywell is required to disclose in its periodic reports if it or any of its affiliates knowingly engaged in certain activities, transactions or dealings relating to Iran or with entities or individuals designated pursuant to certain Executive Orders.
A non-U.S. wholly-owned subsidiary of Honeywell (the Non-U.S. Subsidiary) inadvertently made four ground shipments of low value, non-U.S. items from Turkey to Uzbekistan from December 2013 to
83

March 2014 that transited through Iran en route to Uzbekistan on trucks operated by a third party transportation vendor (the Vendor) retained by the Non-U.S. Subsidiary. The Non-U.S. Subsidiary hired the Vendor to facilitate shipment and the Vendor further engaged a trucking company to provide surface transport. The Vendor proposed the transport route for the shipment. The shipment of the items via Iran occurred inadvertently as a result of non-U.S. person employees approving the transport route proposed by the Vendor. Honeywell disclosed these past transactions voluntarily to the U.S. Treasury Department’s Office of Foreign Assets Control (OFAC).
The Non-U.S. Subsidiary did not pay, directly or indirectly, any duties or taxes to the Government of Iran as a result of these shipments because the shipments were made under TIR (Transports Internationaux Routiers) Carnets, a treaty system which allows for the transport of merchandise through contracting parties from the customs office of departure to the customs office of destination without payment of customs duties/taxes in transiting countries. Further, the Non-U.S. Subsidiary made all payments for shipping services to the Vendor on a flat-fee basis at a rate of $11,800 per shipment, and the Non- U.S. Subsidiary did not reimburse the Vendor for any fees or other expenses incurred in Iran.
Neither Honeywell nor the Non-U.S. Subsidiary derived any revenue by inadvertently shipping the items via Iran.
Item 10. Directors and Executive Officers of the Registrant
Information relating to the Directors of Honeywell, as well as information relating to compliance with Section 16(a) of the Securities Exchange Act of 1934, will be contained in our definitive Proxy Statement involving the election of the Directors, which will be filed with the SEC pursuant to Regulation 14A not later than 120 days after December 31, 2015, and such information is incorporated herein by reference. Certain other information relating to the Executive Officers of Honeywell appears in Part I of this Annual Report on Form 10-K under the heading Executive Officers of the Registrant.
The members of the Audit Committee of our Board of Directors are: George Paz (Chair), Kevin Burke, D. Scott Davis, Linnet Deily, Judd Gregg and Robin L. Washington. The Board has determined that Mr. Paz, Mr. Davis and Ms. Washington are audit committee financial experts as defined by applicable SEC rules and that Mr. Paz, Mr. Burke, Mr. Davis, Ms. Deily and Ms. Washington satisfy the accounting or related financial management expertise criteria established by the NYSE. All members of the Audit Committee are independent as that term is defined in applicable SEC rules and NYSE listing standards.
Honeywell’s corporate governance policies and procedures, including the Code of Business Conduct, Corporate Governance Guidelines and Charters of the Committees of the Board of Directors are available, free of charge, on our website under the heading Investor Relations (see Corporate Governance), or by writing to Honeywell, 115 Tabor Road, Morris Plains, New Jersey 07950, c/o Vice President and Corporate Secretary. Honeywell’s Code of Business Conduct applies to all Honeywell directors, officers (including the Chief Executive Officer, Chief Financial Officer and Controller) and employees. Amendments to or waivers of the Code of Business Conduct granted to any of Honeywell’s directors or executive officers will be published on our website within five business days of such amendment or waiver.
Item 11. Executive Compensation
Information relating to executive compensation is contained in the Proxy Statement referred to above in Item 10. Directors and Executive Officers of the Registrant, and such information is incorporated herein by reference.
84

Item 12. Security Ownership of Certain Beneficial Owners and Management and Related
Stockholder Matters
Information relating to security ownership of certain beneficial owners and management and related stockholder matters is contained in the Proxy Statement referred to above in Item 10. Directors and Executive Officers of the Registrant, and such information is incorporated herein by reference.
Item 13. Certain Relationships and Related Transactions
Information relating to certain relationships and related transactions is contained in the Proxy Statement referred to above in Item 10. Directors and Executive Officers of the Registrant, and such information is incorporated herein by reference.
Item 14. Principal Accounting Fees and Services
Information relating to fees paid to and services performed by Deloitte & Touche LLP in 2015 and PricewaterhouseCoopers LLP in 2014 and our Audit Committee’s pre-approval policies and procedures with respect to non-audit services are contained in the Proxy Statement referred to above in Item 10. Directors and Executive Officers of the Registrant, and such information is incorporated herein by reference.
Item 15. Exhibits and Financial Statement Schedules
85
Page Number in Form 10-K
(a)(1.) Consolidated Financial Statements: Consolidated Statement of Operations for the years ended December 31, 2015, 2014 and
2013 32 Consolidated Statement of Comprehensive Income for the years ended December 31,
2015, 2014 and 2013 33 Consolidated Balance Sheet at December 31, 2015 and 2014 34 Consolidated Statement of Cash Flows for the years ended December 2015, 2014 and
2013 35 Consolidated Statement of Shareowners’ Equity for the years ended December 31, 2015,
2014 and 2013 36 Notes to Financial Statements 37 Report of Independent Registered Public Accounting Firm 80
Page Number in Form 10-K
(a)(2.) Exhibits See the Exhibit Index of this Annual Report on Form 10-K 87

SIGNATURES
Pursuant to the requirements of the Securities Exchange Act of 1934, the registrant has duly caused this report to be signed on its behalf by the undersigned thereunto duly authorized.
Pursuant to the requirements of the Securities Exchange Act of 1934, this annual report has been signed below by the following persons on behalf of the Registrant and in the capacities and on the date indicated:
February 12, 2016
86
HONEYWELL INTERNATIONAL INC. Date: February 12, 2016 By: /s/ Adam M. Matteo
Adam M. Matteo Vice President and Controller (on behalf of the Registrant and as the Registrant’s Principal Accounting Officer)
Name Name * *
David M. Cote Chairman of the Board, Chief Executive Officer
and Director
Judd Gregg Director
* * William S. Ayer
Director Clive Hollick
Director * *
Gordon M. Bethune Director
Grace D. Lieblein Director
* * Kevin Burke
Director George Paz
Director * *
Jaime Chico Pardo Director
Bradley T. Sheares, Ph.D. Director
* * D. Scott Davis
Director Robin L. Washington
Director *
Linnet F. Deily Director
/s/ Thomas A. Szlosek /s/ Adam M. Matteo Thomas A. Szlosek
Senior Vice President and Chief Financial Officer
(Principal Financial Officer)
Adam M. Matteo Vice President and Controller (Principal Accounting Officer)
*By: /s/ Thomas A. Szlosek
(Thomas A. Szlosek Attorney-in-fact)

EXHIBIT INDEX
87
Exhibit No. Description 3(i) Amended and Restated Certificate of Incorporation of Honeywell International Inc., as amended April 26,
2010 (incorporated by reference to Exhibit 3(i) to Honeywell’s Form 8-K filed April 27, 2010) 3(ii) By-laws of Honeywell International Inc., as amended December 11, 2015 (incorporated by reference to
Exhibit 3(ii) to Honeywell’s Form 8-K filed December 14, 2015) 4 Honeywell International Inc. is a party to several long-term debt instruments under which, in each case,
the total amount of securities authorized does not exceed 10% of the total assets of Honeywell and its subsidiaries on a consolidated basis. Pursuant to paragraph 4(iii)(A) of Item 601(b) of Regulation S-K, Honeywell agrees to furnish a copy of such instruments to the Securities and Exchange Commission upon request.
10.1* 2003 Stock Incentive Plan of Honeywell International Inc. and its Affiliates (incorporated by reference to Honeywell’s Proxy Statement, dated March 17, 2003, filed pursuant to Rule 14a-6 of the Securities Exchange Act of 1934), and amended by Exhibit 10.1 to Honeywell’s Form 8-K filed December 21, 2004, Exhibit 10.1 to Honeywell’s Form 10-K for the year ended December 31, 2006 and Exhibit 10.1 to Honeywell’s Form 10-K for the year ended December 31, 2008
10.2* Deferred Compensation Plan for Non-Employee Directors of Honeywell International Inc., as amended and restated (incorporated by reference to Exhibit 10.2 to Honeywell’s Form 10-Q for quarter ended June 30, 2003), and amended by Exhibit 10.1 to Honeywell’s Form 8-K filed December 21, 2004 and Exhibit 10.2 to Honeywell’s Form 10-K for the year ended December 31, 2005
10.3* Honeywell International Inc. Incentive Compensation Plan for Executive Employees, as amended and restated (incorporated by reference to Exhibit 10.4 to Honeywell’s Form 10-K for the year ended December 31, 2013)
10.4* Supplemental Non-Qualified Savings Plan for Highly Compensated Employees of Honeywell International Inc. and its Subsidiaries, as amended and restated (incorporated by reference to Exhibit 10.6 to Honeywell’s Form 10-K for the year ended December 31, 2008), and amended by Exhibit 10.5 to Honeywell’s Form 10-K for the year ended December 31, 2010, Exhibit 10.1 to Honeywell’s Form 10-Q for the quarter ended June 30, 2012, Exhibit 10.5 to Honeywell’s Form 10-K for the year ended December 31, 2013 and Exhibit 10.1 to Honeywell’s Form 10-Q for the quarter ended June 30, 2015
10.5* Honeywell International Inc. Severance Plan for Designated Officers, as amended and restated (incorporated by reference to Exhibit 10.6 to Honeywell’s Form 10-K for the year ended December 31, 2013)
10.6* Salary and Incentive Award Deferral Plan for Selected Employees of Honeywell International Inc. and its Affiliates, as amended and restated (incorporated by reference to Exhibit 10.8 to Honeywell’s Form 10-K for the year ended December 31, 2008), and amended by Exhibit 10.7 to Honeywell’s Form 10-K for the year ended December 31, 2013
10.7* Honeywell International Inc. Supplemental Pension Plan, as amended and restated (incorporated by reference to Exhibit 10.10 to Honeywell’s Form 10-K for the year ended December 31, 2008), and amended by Exhibit 10.10 to Honeywell’s Form 10-K for the year ended December 31, 2009 and the attached amendment (filed herewith)

88
Exhibit No. Description 10.8* Honeywell International Inc. Supplemental Executive Retirement Plan for Executives in Career Band 6
and Above, as amended and restated (incorporated by reference to Exhibit 10.12 to Honeywell’s Form 10-K for the year ended December 31, 2008), and amended by Exhibit 10.12 to Honeywell’s Form 10-K for the year ended December 31, 2009, Exhibit 10.9 to Honeywell’s Form 10-K for the year ended December 31, 2013, and the attached amendment (filed herewith)
10.9* Honeywell Supplemental Defined Benefit Retirement Plan, as amended and restated (incorporated by reference to Exhibit 10.13 to Honeywell’s Form 10-K for the year ended December 31, 2008), and amended by Exhibit 10.13 to Honeywell’s Form 10-K for the year ended December 31, 2009 and the attached amendment (filed herewith)
10.10* Letter between David J. Anderson and Honeywell International Inc. dated June 12, 2003 (incorporated by reference to Exhibit 10.26 to Honeywell’s Form 10-Q for the quarter ended June 30, 2003), and amended by Exhibit 10.14 to Honeywell’s Form 10-K for the year ended December 31, 2008
10.11* Honeywell International Inc. Severance Plan for Corporate Staff Employees (Involuntary Termination Following a Change in Control), as amended and restated (incorporated by reference to Exhibit 10.12 to Honeywell’s Form 10-K for the year ended December 31, 2013)
10.12* Employment Agreement dated as of February 18, 2002 between Honeywell and David M. Cote (incorporated by reference to Exhibit 10.24 to Honeywell’s Form 8-K filed March 4, 2002), and amended by Exhibit 10.3 to Honeywell’s Form 10-Q for the quarter ended September 30, 2008, Exhibit 10.17 to Honeywell’s Form 10-K for the year ended December 31, 2008, and Exhibit 10.1 to Honeywell’s Form 10-Q for the quarter ended March 31, 2013
10.13* 2003 Stock Incentive Plan for Employees of Honeywell International Inc. and its Affiliates Award Agreement (incorporated by reference to Exhibit 10.1 to Honeywell’s Form 8-K filed February 7, 2005)
10.14* Deferred Compensation Agreement dated August 4, 2006 between Honeywell and David M. Cote (incorporated by reference to Exhibit 10.22 to Honeywell’s Form 10-K for the year ended December 31, 2006) and amended by Exhibit 10.22 to Honeywell’s Form 10-K for the year ended December 31, 2009
10.15* Honeywell Supplemental Retirement Plan (incorporated by reference to Exhibit 10.24 to Honeywell’s Form 10-K for the year ended December 31, 2006)
10.16* Pittway Corporation Supplemental Executive Retirement Plan (incorporated by reference to Exhibit 10.25 to Honeywell’s Form 10-K for the year ended December 31, 2006) and amended by Exhibit 10.25 to Honeywell’s Form 10-K for the year ended December 31, 2008, Exhibit 10.25 to Honeywell’s 10-K for the year ended December 31, 2009, and the attached amendment (filed herewith)
10.17* 2006 Stock Incentive Plan of Honeywell International Inc. and Its Affiliates, as amended and restated (incorporated by reference to Exhibit 10.26 to Honeywell’s Form 10-K for the year ended December 31, 2008), and amended by Exhibit 10.1 to Honeywell’s 10-Q for the quarter ended March 31, 2011
10.18* 2006 Stock Incentive Plan of Honeywell International Inc. and Its Affiliates—Form of Option Award Agreement (incorporated by reference to Exhibit 10.2 to Honeywell’s Form 10-Q for the quarter ended March 31, 2009)
10.19* 2006 Stock Incentive Plan of Honeywell International Inc. and Its Affiliates—Form of Restricted Unit Agreement (incorporated by reference to Exhibit 10.1 to Honeywell’s Form 10-Q for the quarter ended March 31, 2009)
10.20* 2006 Stock Incentive Plan of Honeywell International Inc. and Its Affiliates—Form of Performance Share Agreement (incorporated by reference to Exhibit 10.30 to Honeywell’s Form 10-K for the year ended December 31, 2006)

89
Exhibit No. Description 10.21* 2006 Stock Plan for Non-Employee Directors of Honeywell International Inc., as amended and restated
(incorporated by reference to Exhibit 10.31 to Honeywell’s Form 10-K for the year ended December 31, 2008), and amended by Exhibit 10.27 to Honeywell’s Form 10-K for the year ended December 31, 2011 and Exhibit 10.24 to Honeywell’s Form 10-K for the year ended December 31, 2014
10.22* 2006 Stock Plan for Non-Employee Directors of Honeywell International Inc.—Form of Option Agreement (incorporated by reference to Exhibit 10.3 to Honeywell’s Form 10-Q for the quarter ended March 31, 2012)
10.23* 2006 Stock Plan for Non-Employee Directors of Honeywell International Inc.—Form of Restricted Unit Agreement (incorporated by reference to Exhibit 10.4 to Honeywell’s Form 10-Q for the quarter ended March 31, 2012)
10.24* 2007 Honeywell Global Employee Stock Plan (incorporated by reference to Honeywell’s Proxy Statement, dated March 12, 2007, filed pursuant to Rule 14a-6 of the Securities Exchange Act of 1934)
10.25* Letter Agreement dated July 20, 2007 between Honeywell and Roger Fradin (incorporated by reference to Exhibit 10.1 to Honeywell’s Form 10-Q for the quarter ended September 30, 2007) and amended by Exhibit 10.36 to Honeywell’s Form 10-K for the year ended December 31, 2009
10.26* Letter Agreement dated October 6, 2010 between Honeywell and Roger Fradin (incorporated by reference to Exhibit 10.34 to Honeywell’s Form 10-K for the year ended December 31, 2010) and amended by Exhibit 10.1 to Honeywell’s Form 10-Q for the quarter ended September 30, 2012
10.27* Employee Non-Competition Agreement dated October 26, 2010 for Andreas Kramvis (incorporated by reference to Exhibit 10.35 to Honeywell’s Form 10-K for the year ended December 31, 2010)
10.28* 2006 Stock Incentive Plan of Honeywell International Inc. and its Affiliates—Form of Restricted Unit Agreement, Form 2 (incorporated by reference to Exhibit 10.2 to Honeywell’s Form 10-Q for the quarter ended June 30, 2010)
10.29* 2006 Stock Incentive Plan of Honeywell International Inc. and Its Affiliates—Form of Option Award Agreement, Form 2 (incorporated by reference to Exhibit 10.37 to Honeywell’s Form 10-K for the year ended December 31, 2010)
10.30* Letter Agreement dated September 3, 2009 between Honeywell and Timothy Mahoney (incorporated by reference to Exhibit 10.38 to Honeywell’s Form 10-K for the year ended December 31, 2010)
10.31* Form of Honeywell International Inc. Noncompete Agreement for Senior Executives (incorporated by reference to Exhibit 10.39 to Honeywell’s Form 10-K for the year ended December 31, 2010)
10.32* 2011 Stock Incentive Plan of Honeywell International Inc. and its Affiliates (incorporated by reference to Honeywell’s Proxy Statement, dated March 10, 2011, filed pursuant to Rule 14a-6 of the Securities Exchange Act of 1934), and amended by Exhibit 10.36 to Honeywell’s Form 10-K for the year ended December 31, 2012 and Exhibit 10.1 to Honeywell’s Form 10-Q for the quarter ended March 31, 2014
10.33* 2011 Stock Incentive Plan of Honeywell International Inc. and its Affiliates—Form of Restricted Unit Agreement (incorporated by reference to Exhibit 10.2 to Honeywell’s Form 10-Q for the quarter ended March 31, 2014)
10.34* 2011 Stock Incentive Plan of Honeywell International Inc. and its Affiliates—Form of Restricted Unit Agreement, Form 2 (incorporated by reference to Exhibit 10.3 to Honeywell’s Form 10-Q for the quarter ended March 31, 2014)
10.35* 2011 Stock Incentive Plan of Honeywell International Inc. and Its Affiliates—Form of Stock Option Award Agreement (incorporated by reference to Exhibit 10.4 to Honeywell’s Form 10-Q for the quarter ended March 31, 2014)

90
Exhibit No. Description 10.36* 2011 Stock Incentive Plan of Honeywell International Inc. and Its Affiliates—Form of Stock Option Award
Agreement, Form 2 (incorporated by reference to Exhibit 10.39 to Honeywell’s Form 10-K for the year ended December 31, 2014)
10.37* 2011 Stock Incentive Plan of Honeywell International Inc. and Its Affiliates—Form of Growth Plan Agreement (incorporated by reference to Exhibit 10.5 to Honeywell’s Form 10-Q for the quarter ended March 31, 2014)
10.38* Letter Agreement dated August 4, 2011 between Honeywell International Inc. and David M. Cote (incorporated by reference to Exhibit 10.1 to Honeywell’s Form 10-Q for the quarter ended September 30, 2011)
10.39* Transition Agreement dated April 7, 2014 between Honeywell International Inc. and David J. Anderson (incorporated by reference to Exhibit 10.6 to Honeywell’s Form 10-Q for the quarter ended March 31, 2014)
10.40* Consulting Agreement effective as of June 1, 2014 between Honeywell International Inc. and David J. Anderson (incorporated by reference to Exhibit 10.7 to Honeywell’s Form 10-Q for the quarter ended March 31, 2014)
10.41* Letter Agreement dated April 7, 2014 between Honeywell International Inc. and Roger Fradin (incorporated by reference to Exhibit 10.8 to Honeywell’s Form 10-Q for the quarter ended March 31, 2014)
10.42* Letter Agreement dated April 7, 2014 between Honeywell International Inc. and Andreas Kramvis (incorporated by reference to Exhibit 10.9 to Honeywell’s Form 10-Q for the quarter ended March 31, 2014)
10.43* Letter Agreement dated April 7, 2014 between Honeywell International Inc. and Thomas A. Szlosek (incorporated by reference to Exhibit 10.10 to Honeywell’s Form 10-Q for the quarter ended March 31, 2014)
10.44* CEO Retention Agreement, as approved by the Board of Directors of Honeywell International Inc. on October 31, 2014 and agreed to by David M. Cote on December 11, 2014 (incorporated by reference to Exhibit 99.2 to Honeywell’s Form 8-K filed December 12, 2014)
10.45 Amended and Restated Five Year Credit Agreement dated as of July 10, 2015 among Honeywell International Inc., the banks, financial institutions and other institutional lenders parties thereto, Citibank, N.A., as administrative agent, Citibank International Limited, as swing line agent, JPMorgan Chase Bank, N.A., as syndication agent, Bank of America, N.A., Barclays Bank PLC, Deutsche Bank Securities Inc., Goldman Sachs Bank USA, Morgan Stanley MUFG Loan Partners, LLC and Wells Fargo Bank, National Association, as documentation agents, and Citigroup Global Markets Inc., and J.P. Morgan Securities LLC, as joint lead arrangers and co-book managers (incorporated by reference to Exhibit 10.1 to Honeywell’s Form 8-K filed July 10, 2015)
10.46 Amendment No. 1, dated as of September 30, 2015, to the $4.0 billion Amended and Restated Five Year Credit Agreement dated as of July 10, 2015 among Honeywell International Inc., the banks, financial institutions and other institutional lenders parties thereto, Citibank, N.A., as administrative agent, Citibank International Limited, as swing line agent, JPMorgan Chase Bank, N.A., as syndication agent, Bank of America, N.A., Barclays Bank PLC, Deutsche Bank Securities Inc., Goldman Sachs Bank USA, Morgan Stanley MUFG Loan Partners, LLC and Wells Fargo Bank, National Association, as documentation agents, and Citigroup Global Markets Inc. and J.P. Morgan Securities LLC, as joint lead arrangers and co-book managers. (incorporated by reference to Exhibit 10.1 to Honeywell’s Form 8-K filed October 1, 2015)

The Exhibits identified above with an asterisk (*) are management contracts or compensatory plans or arrangements.
91
(Back To Top)
Exhibit 10.7
AMENDMENT TO THE
HONEYWELL INTERNATIONAL INC. SUPPLEMENTAL PENSION PLAN
The Honeywell International Inc. Supplemental Pension Plan shall be, and hereby is, amended by inserting the following
new Section 4.01(i) immediately following Section 4.01(h):
“(i) Notwithstanding any provision of this Plan to the contrary, the Supplemental Benefit for a Participant who is accruing a benefit as of December 31, 2015 under a Pension Plan formula that includes a traditional final average pay or career average benefit formula shall be calculated by taking into account the amendments that were made to the corresponding Pension Plan formula definitions of compensation, final average pay, and Social Security benefit, as applicable. For the avoidance of doubt, for traditional final average pay formulas, final average pay shall be frozen as of December 31, 2015 and no amounts earned or paid, or deemed earned or paid, after December 31, 2015 shall be included in compensation; provided, however, that amounts earned in 2015 and paid in March 2016 under the Honeywell Management Incentive Plan, the Honeywell International Inc. Incentive Compensation Plan for Executive Employees, or the Honeywell Capital Management Incentive Compensation Plan shall be included in 2015 compensation for purposes of the formulas that include such incentive compensation in the year earned. For career average formulas, earnings for a year
Exhibit No. Description 10.47 364-Day Credit Agreement, dated as of September 30, 2015, among Honeywell International Inc., the
banks, financial institutions and other institutional lenders parties thereto, Citibank, N.A., as administrative agent and Bank of America, N.A., Barclays Bank PLC and Goldman Sachs Bank USA, as documentation agents and Citigroup Global Markets Inc., Merrill Lynch, Pierce, Fenner & Smith Incorporated, Barclays Bank PLC and Goldman Sachs Bank USA, as joint lead arrangers and co-book managers. (incorporated by reference to Exhibit 10.1 to Honeywell’s Form 8-K filed October 1, 2015)
12 Statement re: Computation of Ratio of Earnings to Fixed Charges (filed herewith) 21 Subsidiaries of the Registrant (filed herewith) 23.1 Consent of Deloitte & Touche LLP (filed herewith) 23.2 Consent of PricewaterhouseCoopers LLC (filed herewith) 24 Powers of Attorney (filed herewith) 31.1 Certification of Principal Executive Officer Pursuant to Section 302 of the Sarbanes-Oxley Act of 2002
(filed herewith) 31.2 Certification of Principal Financial Officer Pursuant to Section 302 of the Sarbanes-Oxley Act of 2002
(filed herewith) 32.1 Certification of Principal Executive Officer Pursuant to 18 U.S.C. Section 1350, as Adopted Pursuant to
Section 906 of the Sarbanes-Oxley Act of 2002 (filed herewith) 32.2 Certification of Principal Financial Officer Pursuant to 18 U.S.C. Section 1350, as Adopted Pursuant to
Section 906 of the Sarbanes-Oxley Act of 2002 (filed herewith) 101.INS XBRL Instance Document (filed herewith) 101.SCH XBRL Taxonomy Extension Schema (filed herewith) 101.CAL XBRL Taxonomy Extension Calculation Linkbase (filed herewith) 101.DEF XBRL Taxonomy Extension Definition Linkbase (filed herewith) 101.LAB XBRL Taxonomy Extension Label Linkbase (filed herewith) 101.PRE XBRL Taxonomy Extension Presentation Linkbase (filed herewith)
Section 2: EX-10.7
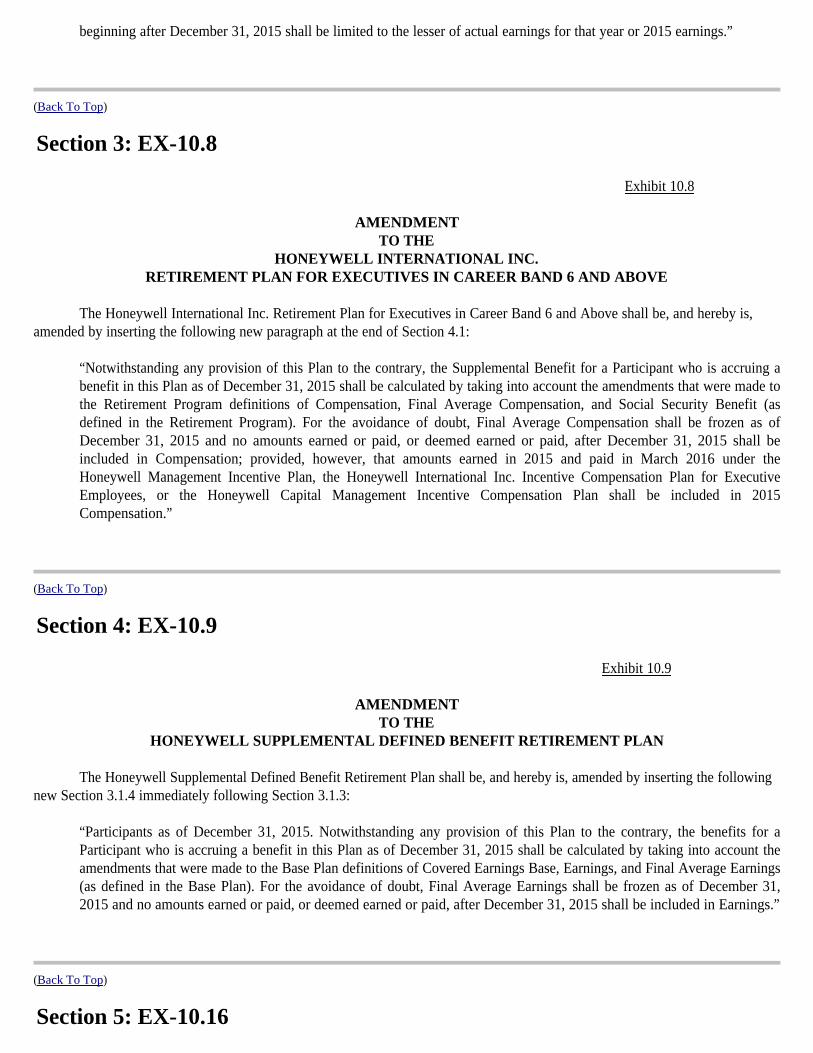
beginning after December 31, 2015 shall be limited to the lesser of actual earnings for that year or 2015 earnings.”
(Back To Top)
Exhibit 10.8
AMENDMENT TO THE
HONEYWELL INTERNATIONAL INC. RETIREMENT PLAN FOR EXECUTIVES IN CAREER BAND 6 AND ABOVE
The Honeywell International Inc. Retirement Plan for Executives in Career Band 6 and Above shall be, and hereby is,
amended by inserting the following new paragraph at the end of Section 4.1:
“Notwithstanding any provision of this Plan to the contrary, the Supplemental Benefit for a Participant who is accruing a benefit in this Plan as of December 31, 2015 shall be calculated by taking into account the amendments that were made to the Retirement Program definitions of Compensation, Final Average Compensation, and Social Security Benefit (as defined in the Retirement Program). For the avoidance of doubt, Final Average Compensation shall be frozen as of December 31, 2015 and no amounts earned or paid, or deemed earned or paid, after December 31, 2015 shall be included in Compensation; provided, however, that amounts earned in 2015 and paid in March 2016 under the Honeywell Management Incentive Plan, the Honeywell International Inc. Incentive Compensation Plan for Executive Employees, or the Honeywell Capital Management Incentive Compensation Plan shall be included in 2015 Compensation.”
(Back To Top)
Exhibit 10.9
AMENDMENT TO THE
HONEYWELL SUPPLEMENTAL DEFINED BENEFIT RETIREMENT PLAN
The Honeywell Supplemental Defined Benefit Retirement Plan shall be, and hereby is, amended by inserting the following new Section 3.1.4 immediately following Section 3.1.3:
“Participants as of December 31, 2015. Notwithstanding any provision of this Plan to the contrary, the benefits for a Participant who is accruing a benefit in this Plan as of December 31, 2015 shall be calculated by taking into account the amendments that were made to the Base Plan definitions of Covered Earnings Base, Earnings, and Final Average Earnings (as defined in the Base Plan). For the avoidance of doubt, Final Average Earnings shall be frozen as of December 31, 2015 and no amounts earned or paid, or deemed earned or paid, after December 31, 2015 shall be included in Earnings.”
(Back To Top)
Section 3: EX-10.8
Section 4: EX-10.9
Section 5: EX-10.16

Exhibit 10.16
AMENDMENT TO THE
PITTWAY CORPORATION SUPPLEMENTAL EXECUTIVE RETIREMENT PLAN
The Pittway Corporation Supplemental Executive Retirement Plan shall be, and hereby is, amended by inserting the
following new paragraph at the end of Section 2.3:
“Notwithstanding any provision of this plan to the contrary, the benefit for a participant who is accruing a benefit in this plan as of December 31, 2015 shall be calculated by taking into account the amendments that were made to the definition of Earnings in Supplement DD of the Honeywell Retirement Earnings Plan. For the avoidance of doubt, earnings for any year beginning after December 31, 2015 shall equal the lesser of the participant’s earnings for that year or the participant’s earnings for the 2015 year.”
(Back To Top)
EXHIBIT 12
HONEYWELL INTERNATIONAL INC. STATEMENT RE: COMPUTATION OF RATIO OF EARNINGS TO FIXED CHARGES
(Dollars in millions)
(Back To Top)
Section 6: EX-12
2015 2014 2013 2012 2011Determination of Earnings:
Income before taxes $ 6,586 $ 5,818 $ 5,412 $ 3,875 $ 2,282 Add (Deduct):
Amortization of capitalized interest 19 19 20 20 20 Fixed charges 356 364 371 404 432 Equity income, net of distributions (30 ) (36 ) (36 ) (45 ) (51 )
Total earnings, as defined $ 6,931 $ 6,165 $ 5,767 $ 4,254 $ 2,683
Fixed Charges: Rents(1) $ 46 $ 46 $ 44 $ 53 $ 56 Interest and other financial charges 310 318 327 351 376
356 364 371 404 432 Capitalized interest 20 21 19 18 13
Total fixed charges $ 376 $ 385 $ 390 $ 422 $ 445
Ratio of Earnings to Fixed Charges 18.43 16.01 14.79 10.08 6.03
(1) Denotes the equivalent of an appropriate portion of rentals representative of the interest factor on all rentals other than for capitalized leases.
Section 7: EX-21

EXHIBIT 21
HONEYWELL INTERNATIONAL INC. SUBSIDIARIES OF THE REGISTRANT
(Back To Top)
NameCountry or State of Incorporation
Percent Ownership
ADI-Gardiner Limited United Kingdom 100% AlliedSignal Aerospace Service Corporation Delaware 100% Elster GmbH Germany 100% Elster s.r.o. Slovakia 100% Grimes Aerospace Company Delaware 100% Hand Held Products, Inc Delaware 100% Honeywell Aerospace de México, S. de R.L. de C.V. Mexico 100% Honeywell Automation India Limited India 75% Honeywell Automotive Parts Services (Shanghai) Co., Ltd. China 100% Honeywell Aerospace Avionics Malaysia Sdn Bhd. Malaysia 100% Honeywell Aerospace UK United Kingdom 100% Honeywell Co., Ltd. Korea 100% Honeywell Control Systems Limited United Kingdom 100% Honeywell Deutschland GmbH Germany 100% Honeywell Electronic Materials, Inc. Washington 100% Honeywell Europe NV Belgium 100% Honeywell Finance LP Delaware 100% Honeywell Holdings Pty. Ltd. Australia 100% Honeywell International Sàrl Switzerland 100% Honeywell International Services SRL Romania 100% Honeywell Japan Inc. Japan 100% Honeywell Korea Ltd. Korea 100% Honeywell Limited Australia 100% HONEYWELL LIMITED / HONEYWELL LIMITÉE Canada 100% Honeywell Luxembourg Holding S.a.r.l. Luxembourg 100% Honeywell Resins & Chemicals LLC Delaware 100% Honeywell Safety Products Europe SAS France 100% Honeywell Safety Products USA, Inc. Delaware 100% Honeywell Specialty Chemicals Seelze GmbH Germany 100% Honeywell, spol. s r.o. Czech Republic 100% HONEYWELL TECHNOLOGIES Sàrl Switzerland 100% Honeywell Technology Solutions Inc. Delaware 100% Honeywell Technology Solutions Lab Pvt. Ltd. India 100% Honeywell UK Limited United Kingdom 100% Intermec Technologies Corporation Washington 100% Life Safety Distribution AG Switzerland 100% Metrologic Instruments, Inc. New Jersey 100% Novar ED&S Limited United Kingdom 100% Sigma-Aldrich Laborchemikalien GmbH Germany 100% UOP LLC Delaware 100% UOP Russell LLC Delaware 70%
Section 8: EX-23.1

EXHIBIT 23.1
CONSENT OF INDEPENDENT REGISTERED PUBLIC ACCOUNTING FIRM
We consent to the incorporation by reference in the Registration Statement on Form S-3 (No.033-55425, 333-22355, 333-101455 and 333-208501), Form S-8 (No. 033-58347, 333-49280, 333-136083, 333-136086, 333-146932, 333-148995, 333-175260 and 333-195331) and Form S-4 (No. 333-82049) of our report dated February 12, 2016, relating to the consolidated financial statements of Honeywell International Inc. and subsidiaries (the “Company”) and the effectiveness of the Company’s internal control over financial reporting, appearing in this Annual Report on Form 10-K of the Company for the year ended December 31, 2015.
/s/ Deloitte & Touche LLP
Parsippany, New Jersey February 12, 2016
(Back To Top)
EXHIBIT 23.2
CONSENT OF INDEPENDENT REGISTERED PUBLIC ACCOUNTING FIRM
We hereby consent to the incorporation by reference in the Registration Statement on Form S-3 (No.033-55425, 333-22355, 333-101455 and 333-208501), Form S-8 (No. 033-58347, 333-49280, 333-136083, 333-136086, 333-146932, 333-148995, 333-175260 and 333-195331) and Form S-4 (No. 333-82049) of Honeywell International Inc. of our report dated February 13, 2015 relating to the financial statements which appears in this Form 10-K.
/s/ PricewaterhouseCoopers LLP
Florham Park, New Jersey February 12, 2016
(Back To Top)
Exhibit 24
POWER OF ATTORNEY
Each of the undersigned, as a director of Honeywell International Inc. (the “Company”), a Delaware corporation, hereby appoints David M. Cote, Katherine L. Adams, Adam M. Matteo, Jeffrey N. Neuman, Thomas A. Szlosek and John J. Tus, each with power to act without the other and with power of substitution and resubstitution, as my attorney-in-fact and agent for me and in my name, place and stead in any and all capacities,
(i) to sign the Company’s Annual Report on Form 10-K under the Securities Exchange Act of 1934 for the year ended December 31, 2015, (ii) to sign any amendment to the Annual Report referred to in (i) above, and (iii) to file the documents described in (i) and (ii) above and all exhibits thereto and any and all other documents in connection therewith,
granting unto each said attorney-in-fact and agent full power and authority to do and perform every act and thing requisite, necessary or desirable to be done in connection therewith, as fully to all intents and purposes as I might or could do in person, hereby ratifying and confirming all that said attorneys-in-fact and agents, or any of them, or their or his or her substitutes or substitute, may lawfully do or cause to be done by virtue hereof.
This Power of Attorney may be signed in any number of counterparts, each of which shall be an original, with the same effect as if the
Section 9: EX-23.2
Section 10: EX-24

signatures thereto and hereto were upon the same instrument. /s/ William S. Ayer /s/ Judd GreggWilliam S. Ayer, Director Judd Gregg, Director /s/ Gordon M. Bethune /s/ Clive R. HollickGordon M. Bethune, Director Clive R. Hollick, Director /s/ Kevin Burke /s/ Grace LiebleinKevin Burke, Director Grace Lieblein, Director /s/ Jaime Chico Pardo /s/ George PazJaime Chico Pardo, Director George Paz, Director /s/ D. Scott Davis /s/ Bradley T. ShearesD. Scott Davis, Director Bradley T. Sheares, Director /s/ Linnet F. Deily /s/ Robin WashingtonLinnet F. Deily, Director Robin Washington, Director Dated: December 11, 2015

POWER OF ATTORNEY
Each of the undersigned, as a director of Honeywell International Inc. (the “Company”), a Delaware corporation, hereby appoints David M. Cote, Katherine L. Adams, Adam M. Matteo, Jeffrey N. Neuman, Thomas A. Szlosek and John J. Tus, each with power to act without the other and with power of substitution and resubstitution, as my attorney-in-fact to sign on my behalf in my capacity as a director of the Company one or more registration statements on Form S-8 or any other appropriate form during fiscal year 2016 and to file the same together with all exhibits thereto, under the Securities Act of 1933, including any amendment or supplement thereto or to any registration statement heretofore filed by the Company on Form S-8 or any other appropriate form for the registration of shares of the Company’s Common Stock (or participations where appropriate) to be offered pursuant to the Honeywell Savings and Ownership Plan, the Honeywell Puerto Rico Savings and Ownership Plan, the Honeywell Supplemental Savings Plan, the 2006 Stock Plan for Non-Employee Directors of Honeywell International Inc., the 2007 Honeywell Global Employee Stock Plan (including any and all sub-plans), or the 2011 Stock Incentive Plan of Honeywell International Inc. and its Affiliates, and any plan which is a successor to such plans or is a validly authorized new plan pursuant to which securities of the Company are issued to employees or non-employee directors.
I hereby grant to each such attorney-in-fact full power and authority to perform every act necessary to be done in connection with the foregoing as fully as I might do in person, hereby ratifying and confirming all that said attorneys-in-fact, or any of them or their substitutes, may lawfully do or cause to be done.
I hereby revoke any or all prior appointments of attorneys-in-fact to sign the above-described documents.

This Power of Attorney may be signed in any number of counterparts, each of which shall be an original, with the same effect as if the signatures thereto and hereto were upon the same instrument. /s/ William S. Ayer /s/ Judd GreggWilliam S. Ayer, Director Judd Gregg, Director /s/ Gordon M. Bethune /s/ Clive R. HollickGordon M. Bethune, Director Clive R. Hollick, Director /s/ Kevin Burke /s/ Grace LiebleinKevin Burke, Director Grace Lieblein, Director /s/ Jaime Chico Pardo /s/ George PazJaime Chico Pardo, Director George Paz, Director /s/ D. Scott Davis /s/ Bradley T. ShearesD. Scott Davis, Director Bradley T. Sheares, Director /s/ Linnet F. Deily /s/ Robin WashingtonLinnet F. Deily, Director Robin Washington, Director Dated: December 11, 2015

POWER OF ATTORNEY
Each of the undersigned, as a director of Honeywell International Inc. (the “Company”), a Delaware corporation, hereby appoints David M. Cote, Katherine L. Adams, Adam M. Matteo, Jeffrey N. Neuman, Thomas A. Szlosek and John J. Tus, each with power to act without the other and with power of substitution and resubstitution, as my attorney-in-fact to sign on my behalf in my capacity as a director of the Company one or more registration statements on Form S-3 or S-4 or any other appropriate form during fiscal year 2016, and to file the same together with all exhibits thereto, under the Securities Act of 1933, including any amendment or supplement thereto or to any registration statement heretofore filed by the Company for the registration of sales or resales of:
(i) shares of the Company’s common stock, par value, $1.00 per share, including shares of common stock to be offered under the Dividend
Reinvestment and Share Purchase Plan of the Company and any successor or new plan for such purposes;
(ii) shares of the Company’s preferred stock, without par value; (iii) debt securities of the Company, with such terms as may be from time to time specified in such registration statement or any
amendment, post-effective amendment or supplement thereto; and (iv) such other securities of the Company, its subsidiaries, joint ventures or affiliates or any other person or entity, as may be specified in
any such registration statement, amendment or supplement thereto, all in accordance with the Securities Act of 1933 and the rules and regulations thereunder.
I hereby grant to each such attorney-in-fact full power and authority to perform every act necessary to be done in connection with the
foregoing as fully as I might do in person, hereby ratifying and confirming all that said attorneys-in-fact, or any of them or their substitutes, may lawfully do or cause to be done.
I hereby revoke any or all prior appointments of attorneys-in-fact to the extent that they confer authority to sign the above-described
documents.

This Power of Attorney may be signed in any number of counterparts, each of which shall be an original, with the same effect as if the signatures thereto and hereto were upon the same instrument. /s/ William S. Ayer /s/ Judd Gregg William S. Ayer, Director Judd Gregg, Director /s/ Gordon M. Bethune /s/ Clive R. Hollick Gordon M. Bethune, Director Clive R. Hollick, Director /s/ Kevin Burke /s/ Grace Lieblein Kevin Burke, Director Grace Lieblein, Director /s/ Jaime Chico Pardo /s/ George Paz Jaime Chico Pardo, Director George Paz, Director /s/ D. Scott Davis /s/ Bradley T. Sheares D. Scott Davis, Director Bradley T. Sheares, Director /s/ Linnet F. Deily /s/ Robin Washington Linnet F. Deily, Director Robin Washington, Director Dated: December 11, 2015

POWER OF ATTORNEY
I, David M. Cote, a director of Honeywell International Inc. (the “Company”), a Delaware corporation, hereby appoint Katherine L. Adams, Adam M. Matteo, Jeffrey N. Neuman, Thomas A. Szlosek and John J. Tus, each with power to act without the other and with power of substitution and resubstitution, as my attorney-in-fact and agent for me and in my name, place and stead in any and all capacities,
(i) to sign the Company’s Annual Report on Form 10-K under the Securities Exchange Act of 1934 for the year ended December 31, 2015, (ii) to sign any amendment to the Annual Report referred to in (i) above, and (iii) to file the documents described in (i) and (ii) above and all exhibits thereto and any and all other documents in connection therewith,
granting unto each said attorney-in-fact and agent full power and authority to do and perform every act and thing requisite, necessary or desirable to be done in connection therewith, as fully to all intents and purposes as I might or could do in person, hereby ratifying and confirming all that said attorneys-in-fact and agents, or any of them, or their or his or her substitutes or substitute, may lawfully do or cause to be done by virtue hereof. /s/ David M. Cote David M. Cote Dated: December 11, 2015

POWER OF ATTORNEY
I, David M. Cote, a director of Honeywell International Inc. (the “Company”), a Delaware corporation, hereby appoint Katherine L. Adams, Adam M. Matteo, Jeffrey N. Neuman, Thomas A. Szlosek and John J. Tus, each with power to act without the other and with power of substitution and resubstitution, as my attorney-in-fact to sign on my behalf in my capacity as a director of the Company one or more registration statements on Form S-8 or any other appropriate form during fiscal year 2016, and to file the same together with all exhibits thereto, under the Securities Act of 1933, including any amendment or supplement thereto or to any registration statement heretofore filed by the Company on Form S-8 or any other appropriate form for the registration of shares of the Company’s Common Stock (or participations where appropriate) to be offered pursuant to the Honeywell Savings and Ownership Plan, the Honeywell Puerto Rico Savings and Ownership Plan, the Honeywell Supplemental Savings Plan, the 2006 Stock Plan for Non-Employee Directors of Honeywell International Inc., the 2007 Honeywell Global Employee Stock Plan (including any and all sub-plans), or the 2011 Stock Incentive Plan of Honeywell International Inc. and its Affiliates, and any plan which is a successor to such plans or is a validly authorized new plan pursuant to which securities of the Company are issued to employees or non-employee directors.
I hereby grant to each such attorney-in-fact full power and authority to perform every act necessary to be done in connection with the foregoing as fully as I might do in person, hereby ratifying and confirming all that said attorneys-in-fact, or any of them or their substitutes, may lawfully do or cause to be done.
I hereby revoke any or all prior appointments of attorneys-in-fact to sign the above-described documents. /s/ David M. Cote David M. Cote Dated: December 11, 2015

POWER OF ATTORNEY
I, David M. Cote, a director of Honeywell International Inc. (the “Company”), a Delaware corporation, hereby appoint Katherine L. Adams, Adam M. Matteo, Jeffrey N. Neuman, Thomas A. Szlosek and John J. Tus, each with power to act without the other and with power of substitution and resubstitution, as my attorney-in-fact to sign on my behalf in my capacity as a director of the Company one or more registration statements on Form S-3 or S-4 or any other appropriate form during fiscal year 2016, and to file the same together with all exhibits thereto, under the Securities Act of 1933, including any amendment or supplement thereto or to any registration statement heretofore filed by the Company for the registration of sales or resales of:
(i) shares of the Company’s common stock, par value, $1.00 per share, including shares of common stock to be offered under the Dividend
Reinvestment and Share Purchase Plan of the Company and any successor or new plan for such purposes; (ii) shares of the Company’s preferred stock, without par value; (iii) debt securities of the Company, with such terms as may be from time to time specified in such registration statement or any
amendment, post-effective amendment or supplement thereto; and (iv) such other securities of the Company, its subsidiaries, joint ventures or affiliates or any other person or entity, as may be specified in
any such registration statement, amendment or supplement thereto, all in accordance with the Securities Act of 1933 and the rules and regulations thereunder.
I hereby grant to each such attorney-in-fact full power and authority to perform every act necessary to be done in connection with the
foregoing as fully as I might do in person, hereby ratifying and confirming all that said attorneys-in-fact, or any of them or their substitutes, may lawfully do or cause to be done.
I hereby revoke any or all prior appointments of attorneys-in-fact to the extent that they confer authority to sign the above-described
documents.
(Back To Top)
EXHIBIT 31.1
CERTIFICATION PURSUANT TO SECTION 302
OF THE SARBANES-OXLEY ACT OF 2002
I, David M. Cote, Chief Executive Officer, certify that:
/s/ David M. Cote David M. Cote Dated: December 11, 2015
Section 11: EX-31.1
1. I have reviewed this Annual Report on Form 10-K of Honeywell International Inc.;
2. Based on my knowledge, this report does not contain any untrue statement of a material fact or omit to state a material fact necessary to make the statements made, in light of the circumstances under which such statements were made, not misleading with respect to the period covered by this report;
3. Based on my knowledge, the financial statements, and other financial information included in this report, fairly present in all material respects the financial condition, results of operations and cash flows of the registrant as of, and for, the periods presented in this report;
4. The registrant’s other certifying officer and I are responsible for establishing and maintaining disclosure controls and procedures (as defined in Exchange Act Rules 13a-15(e) and 15d-15(e)) and internal control over financial reporting (as defined in Exchange Act Rules 13a-15(f) and 15d-15(f)) for the registrant and have:
a) designed such disclosure controls and procedures, or caused such disclosure controls and procedures to be designed under our supervision, to ensure that material information relating to the registrant, including its consolidated subsidiaries, is made known to us by others within those entities, particularly during the period in which this report is being prepared;
b) designed such internal control over financial reporting, or caused such internal control over financial reporting to be designed under our supervision, to provide reasonable assurance regarding the reliability of financial reporting and the preparation of financial statements for external purposes in accordance with generally

(Back To Top)
EXHIBIT 31.2
CERTIFICATION PURSUANT TO SECTION 302
OF THE SARBANES-OXLEY ACT OF 2002
I, Thomas A. Szlosek, Chief Financial Officer, certify that:
accepted accounting principles;
c) evaluated the effectiveness of the registrant’s disclosure controls and procedures and presented in this report our conclusions about the effectiveness of the disclosure controls and procedures, as of the end of the period covered by this report based on such evaluation; and
d) disclosed in this report any change in the registrant’s internal control over financial reporting that occurred during the registrant’s most recent fiscal quarter (the registrant’s fourth fiscal quarter in the case of an annual report) that has materially affected, or is reasonably likely to materially affect, the registrant’s internal control over financial reporting; and
5. The registrant’s other certifying officer and I have disclosed, based on our most recent evaluation of internal control over financial reporting, to the registrant’s auditors and the audit committee of the registrant’s board of directors (or persons performing the equivalent functions):
a) all significant deficiencies and material weaknesses in the design or operation of internal control over financial reporting which are reasonably likely to adversely affect the registrant’s ability to record, process, summarize and report financial information; and
b) any fraud, whether or not material, that involves management or other employees who have a significant role in the registrant’s internal control over financial reporting.
Date: February 12, 2016 By: /s/ David M. Cote
David M. Cote Chief Executive Officer
Section 12: EX-31.2
1. I have reviewed this Annual Report on Form 10-K of Honeywell International Inc.;
2. Based on my knowledge, this report does not contain any untrue statement of a material fact or omit to state a material fact necessary to make the statements made, in light of the circumstances under which such statements were made, not misleading with respect to the period covered by this report;
3. Based on my knowledge, the financial statements, and other financial information included in this report, fairly present in all material respects the financial condition, results of operations and cash flows of the registrant as of, and for, the periods presented in this report;
4. The registrant’s other certifying officer and I are responsible for establishing and maintaining disclosure controls and procedures (as defined in Exchange Act Rules 13a-15(e) and 15d-15(e)) and internal control over financial reporting (as defined in Exchange Act Rules 13a-15(f) and 15d-15(f)) for the registrant and have:
a) designed such disclosure controls and procedures, or caused such disclosure controls and procedures to be designed under our supervision, to ensure that material information relating to the registrant, including its consolidated subsidiaries, is made known to us by others within those entities, particularly during the period in which this report is being prepared;
b) designed such internal control over financial reporting, or caused such internal control over financial reporting to be designed under our supervision, to provide reasonable assurance regarding the reliability of financial reporting and the preparation of financial statements for external purposes in accordance with generally accepted accounting principles;
c) evaluated the effectiveness of the registrant’s disclosure controls and procedures and presented in this report our conclusions about the effectiveness of the disclosure controls and procedures, as of the end of the period covered by this report based on such evaluation; and
d) disclosed in this report any change in the registrant’s internal control over financial reporting that occurred during

(Back To Top)
EXHIBIT 32.1
CERTIFICATION PURSUANT TO 18 U.S.C. SECTION 1350,
AS ADOPTED PURSUANT TO SECTION 906 OF THE SARBANES-OXLEY ACT OF 2002
In connection with the Annual Report of Honeywell International Inc. (the Company) on Form 10-K for the period ending December 31, 2015 as filed with the Securities and Exchange Commission on the date hereof (the Report), I, David M. Cote, Chief Executive Officer of the Company, certify, pursuant to 18 U.S.C. Section 1350, as adopted pursuant to Section 906 of the Sarbanes-Oxley Act of 2002, that:
(Back To Top)
EXHIBIT 32.2
CERTIFICATION PURSUANT TO 18 U.S.C. SECTION 1350,
AS ADOPTED PURSUANT TO SECTION 906 OF THE SARBANES-OXLEY ACT OF 2002
In connection with the Annual Report of Honeywell International Inc. (the Company) on Form 10-K for the period ending December 31, 2015 as filed with the Securities and Exchange Commission on the date hereof (the Report), I, Thomas A. Szlosek, Chief Financial Officer of the Company, certify, pursuant to 18 U.S.C. Section 1350, as adopted pursuant to Section 906 of the Sarbanes-Oxley Act of 2002, that:
the registrant’s most recent fiscal quarter (the registrant’s fourth fiscal quarter in the case of an annual report) that has materially affected, or is reasonably likely to materially affect, the registrant’s internal control over financial reporting; and
5. The registrant’s other certifying officer and I have disclosed, based on our most recent evaluation of internal control over financial reporting, to the registrant’s auditors and the audit committee of the registrant’s board of directors (or persons performing the equivalent functions):
a) all significant deficiencies and material weaknesses in the design or operation of internal control over financial reporting which are reasonably likely to adversely affect the registrant’s ability to record, process, summarize and report financial information; and
b) any fraud, whether or not material, that involves management or other employees who have a significant role in the registrant’s internal control over financial reporting.
Date: February 12, 2016 By: /s/ Thomas A. Szlosek
Thomas A. Szlosek Chief Financial Officer
Section 13: EX-32.1
(1) The Report fully complies with the requirements of Section 13(a) or 15(d) of the Securities Exchange Act of 1934; and
(2) The information contained in the Report fairly presents, in all material respects, the financial condition and results of operations of the Company.
Date: February 12, 2016 By: /s/ David M. Cote
David M. Cote Chief Executive Officer
Section 14: EX-32.2

(Back To Top)
(1) The Report fully complies with the requirements of Section 13(a) or 15(d) of the Securities Exchange Act of 1934; and
(2) The information contained in the Report fairly presents, in all material respects, the financial condition and results of operations of the Company.
Date: February 12, 2016 By: /s/ Thomas A. Szlosek
Thomas A. Szlosek Chief Financial Officer