Embed Size (px)
Citation preview

Oil & Gas Monthly Report
December 2018

Oil and Gas Monthly Report
2 | P a g e
CONTENT
o Market Definitions
o Global Trends in Oil and Gas Industry
o Supply: World Crude Oil Snapshot
o Demand: World Crude Oil Snapshot
o Geopolitical Issues
o Economic Factors
o Crude Oil Price Drivers And Restraints
o Commodity Price Trends

Oil and Gas Monthly Report
3 | P a g e
MARKET DEFINITIONS
• This research analyzes the Global Crude Oil and Gas Market, its major categories (West Texas Intermediate (WTI), Brent Blend and OPEC Basket), its
present status, current trends, demand drivers, demand restraints and forecast outlook.
• Crude oil is a natural resource; it is a petroleum product which is composed of hydrocarbon deposits and organic materials. Crude oil is a fossil fuel which is
refined to produce various products, for instance, gasoline, diesel and other petrochemicals. Crude Oil is a nonrenewable resource, i.e. it cannot be replaced
naturally at the rate of its consumption and is hence is a limited resource.1
• There are more than 160 different oils traded on the market, however for or the scope of this study, we will focus on three primary oils that dominate the news
and the markets, which are - West Texas Intermediate (WTI), Brent Blend and OPEC Basket.2
GEOGRAPHIC LOCATION: 3 MAJOR CRUDE OIL GRADES OPEC SHARE OF WORLD CRUDE OIL RESERVES, 2017
1 Crude Oil https://www.investopedia.com/terms/c/crude-oil.asp#ixzz5IjGgvYoH
2 https://oilprice.com/Energy/Crude-Oil/A-Detailed-Guide-On-The-Many-Different-Types-Of-Crude-Oil.html

Oil and Gas Monthly Report
4 | P a g e
GLOBAL TRENDS IN OIL & GAS INDUSTRY OPEC and its allies led by Russia agreed on recent meet to implement 1.2 million b/d of production cuts from January 2019 to shore up lowering oil prices
and prevent a supply glut .3
In its stage budget for year 2019 announced, analysts predicted that Saudi Arabia will need oil prices higher than $80/b to avoid another deficit.
Qatar suddenly gave a surprise and announce its exit from OPEC.
US crude oil exports surged to reach a new all-time high and exports exceeds imports4.
Indonesia is planning to enhance the its self-sufficiency in oil and its products within the next few years with state-owned Pertamina trying to expand its
refining facilities. This could help Jakarta in reducing fuel import bills amidst weaknening local currency.
As per the US Energy Information Administration , US shale oil production is expected to rise to 134,000 b/d month on month in January 19 to 8.166
million b/d,
The Government of Neuquen has announced that Shell plans to start a full-scale development project in Vaca Muerta next year.
The US crude first shipment was recently delivered to Croatia while another vessel set the European country.
Qatar Petroleum is looking to invest as much as US$20 billion in LNG projects in the United States over the next few years. The investment is separate,
apparently, from Qatar’s plans to boost its local production capacity from the current 77 million tons of LNG annually to 110 million tons by the early 2020s
3 https://www.spglobal.com/platts/en/market-insights/latest-news/oil/120718-opec-coalition-agrees-12-million-b-d-cuts-deal-as-iran-secures-
exemption?utm_source=linkedin&utm_medium=social&utm_content=news&utm_term=we-oil&hootpostid=d4a52aab78929d998a4dbb1f2a352ed0 4 https://www.reuters.com/article/us-usa-oil-eia/in-major-shift-us-now-exports-more-oil-than-it-ships-in-idUSKBN1O51X7
01020304050607080
Jan-18 Feb-18 Mar-18 Apr-18 May-18 Jun-18 Jul-18 Aug-18 Sep-18 Oct-18 Nov-18 Dec-18
WTI , Year 2018 Price trend
Price – WTI/Brent
Geopolitics Demand Supply Dollar Price – WTI/Brent

Oil and Gas Monthly Report
5 | P a g e
Major Trend of 2018 – Year of Merger & Acquisition
Quarter Announced
Buyer Seller Value ($MM)
Asset Location Month Closed
1Q 2018 Concho Resources RSP Permian $9,500 Permian Basin July
3Q 2018 Diamondback Energy Energen $9,200 Permian Basin November
4Q 2018 Encana Newfield Exploration $7,700 Multibasin (Scoop/Stack) Pending
4Q 2018 Chesapeake Energy WildHorse Resource Development $3,977 Eagle Ford Pending
4Q 2017 Talos Energy Stone Energy $1,900 US Gulf of Mexico May
4Q 2018 Denbury Resources Penn Virginia $1,700 Eagle Ford Pending
4Q 2018 Cimarex Energy Resolute Energy $1,600 Permian Basin Pending
3Q 2017 Alta Mesa Resources (f/k/a Silver Run Acquisition) Alta Mesa Holdings; Kingfisher Midstream $1,400 Anadarko Basin (Scoop/Stack) February
3Q 2018 Diamondback Energy Ajax Resources $1,245 Permian Basin October
3Q 2018 Kosmos Energy Deep Gulf Energy $1,225 US Gulf of Mexico September
4Q 2017 Oasis Petroleum Forge Energy $946 Permian Basin (Delaware) February
2Q 2018 Falcon Minerals Royal Resources Partners $800 Eagle Ford August
4Q 2017 HighPoint Resources (f/k/a Bill Barrett) Fifth Creek Energy $649 D-J Basin March
1Q 2018 Admiral Permian Resources Three Rivers Operating III $640 Permian Basin (Delaware) April
3Q 2018 PennEnergy Resources Rex Energy $600.50 Appalachia September
2Q 2018 Kimbell Royalty Partners Haymaker Minerals & Royalties $404 Multibasin July
2Q 2018 Triple Crown Resources Broad Oak Energy II $400 Permian Basin April
3Q 2018 Eclipse Resources Blue Ridge Mountain $345 Appalachia Pending
2Q 2018 Cox Oil Offshore Energy XXI Gulf Coast $322 US Gulf of Mexico October
4Q 2017 Eclipse Resources Travis Peak Resources $92.20 Appalachia (Utica) January
3Q 2018 Talos Energy Whistler Energy II $52 US Gulf of Mexico September
2Q 2018 Venado Oil & Gas Texas American Resources N/A Eagle Ford July

Oil and Gas Monthly Report
6 | P a g e
WORLD CRUDE OIL AND NATURAL GAS SUPPLY SNAPSHOT
US Oil & Gas Production
US crude oil production was recorded at 11,537 thousand barrels per day in Oct 2018, which is 0.6 % higher than Sep 2018, as per the data published by
U.S Energy Information Administration
US natural gas production saw a rise in month of Oct, 2018 (as per latest data available) and stood at 105,398 million cubic feet per day.
OPEC Crude Oil Production
The average total OPEC crude oil production was 32.96 Million barrels per day in Nov, 2018 as per the secondary sources. Production saw decrease in
Iran, Iraq, Venezuela, Algeria, Congo, Gabon ,Nigeria, Libya & Kuwait.
11,400
11,600
Sep-18 Oct-18
US Crude Oil Production, Thousand Barrels Per Day
Source: EIA 914 US Energy Information
Administration
104,000
105,000
106,000
Sep-18 Oct-18
Natural Gas Gross Production, 2018, Million Cubic Feet Per Day
Source: EIA 914 US Energy Information
Administration
Source: OPEC monthly report – Dec 2018
Source: EIA US Energy Information Administration
32,600
32,800
33,000
Sep-18 Oct-18 Nov-18
OPEC Crude Oil Production -2018, Thousand Barrels Per Day
99,500
100,000
100,500
101,000
Oct-18 Nov-18
World Crude Oil Production -2018, Thousand Barrels Per Day
Source: OPEC monthly report – Dec 2018

Oil and Gas Monthly Report
7 | P a g e
WORLD CRUDE OIL DEMAND SNAPSHOT
According to OPEC, World Oil demand for 2018 is forecasted to grow by 1.50 million barrels per day unchanged from last month projection by OPEC due
to weak demand from Asia pacific, Middle East and China. Total oil demand is reduced by OPEC as compared to last month and expected to reach at
98.79 million barrels per day
Demand in Latin America has been softened to 20 tb/d and and in Middle east it was negative 60 tb/d, due to economic slowdown and reforms including
substitution plans subsidy removals and efficiency-related policies.
As per OPEC monthly report, a 10% reduction in aviation fuel prices by Indian Oil Corporation could favor additional buying interest and support jet fuel
crack spreads in the near future.
Positive potential for kerosene, aviation fuel and heating oil demand will provide a support to products market in near future.
World oil demand as per OPEC is projected to average 100.08 mb/d in 2019 which is unchanged from previous month’s estimates.
98.0
98.5
99.0
99.5
100.0
100.5
101.0
101.5
Q1 2019 Q2 2019 Q3 2019 Q4 2019
World Crude Oil Demand Forecast, 2019Million Barrels Per Day
Source: OPEC Oil Report, Dec, 2018
Regional Oil Demand, 2018 Americas
Europe
Asia Pacific
Other Asia
Latin America
Middle East
Africa
Former Soviet UnionOther Europe
China
Source: OPEC Oil Report, Dec, 2018

Oil and Gas Monthly Report
8 | P a g e
GEOPOLITICAL ISSUES G20 Summit: US and China Trade Tensions :
The surprisingly G20 constructive meeting could bring a peace to the US-China trade spat. There were positive sentiments from both the
sides. There is hold that has been put on escalated tariffs for three months while ongoing negotiations happen on China's policies. As per
US, China has further agreed to buy a significant amount of energy, agricultural and industrial goods. China’s GDP growth rate is further
slowing down as a consequence of the long deleveraging campaign and ongoing US-China trade tensions.
Past cut in crude oil imports of China from US has raised the US crude oil inventory levels. Hope the 3 months hold could reduce the inventory levels and
reinitiate the crude oil exports from US to China.
Khashoggi Crisis:
Saudi Arabia was facing a significant international disappointment and protest on killing on the Saudi Journalist “Jamal Khashoggi”. There was a internal
as well as external pressure on US to take strict action on Saudi for Journalist killing as there were reports that highest level in the government could be
involved in executing the murder. Further, there was support shown by US president for Saudis and no significant action was taken. We all know that the
Saudi Arabia is the largest crude oil producer and produced record crude oil on the month of November 2018.
Amid pressure on OPEC from US president to lower prices might have resulted in record production from Saudi.
0
5000
10000
15000
20000
Jul-18 Aug-18 Sep-18 Oct-18
US Crude Oil Exports to China, Thousand Barrels Per Day
Oil and Gas Monthly Report
9 | P a g e
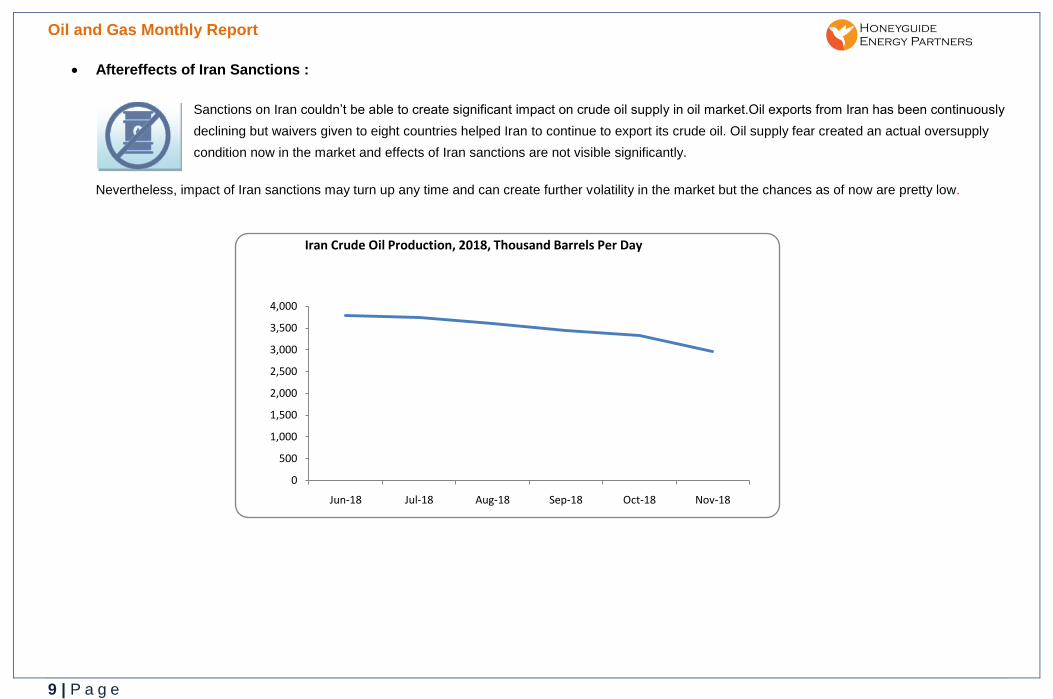
Aftereffects of Iran Sanctions :
Sanctions on Iran couldn’t be able to create significant impact on crude oil supply in oil market.Oil exports from Iran has been continuously
declining but waivers given to eight countries helped Iran to continue to export its crude oil. Oil supply fear created an actual oversupply
condition now in the market and effects of Iran sanctions are not visible significantly.
Nevertheless, impact of Iran sanctions may turn up any time and can create further volatility in the market but the chances as of now are pretty low.
0
500
1,000
1,500
2,000
2,500
3,000
3,500
4,000
Jun-18 Jul-18 Aug-18 Sep-18 Oct-18 Nov-18
Iran Crude Oil Production, 2018, Thousand Barrels Per Day

Oil and Gas Monthly Report
10 | P a g e
Nigeria is Expected to Lose 27% of its Oil Production in 2019:
Nigeria is expected to lose almost 226,300,000 million barrels of oil production in 2019, which constitutes 27% of its current year’s target. The loss is a
consequence of the Organization of Petroleum Exporting Countries (OPEC) decision to cut the country’s production quota from January 1, 2019.
According to an arrangement by the oil cartel, OPEC members will reduce production by 800,000 barrels per day (bpd), while non-OPEC producing
countries will cut production by 400,000bpd to bring total oil cuts to 1.2 million bpd.
The move to cut Nigeria’s crude oil production to 1.68 million bpd for the first half of 2019 was part of efforts by the cartel to stabilize and firm crude oil
prices at the international market. Nigeria with a daily production quota of 2.3 million (which has never been attained) had its production quota slashed to
1.68 million by the cartel last December. The cut represents about 620,000 barrels per day, which translates to approximately 226,300,000 million for
2019.5
Venezuela Braces for More Sanctions Amid Oil Exports Slumping to 28-Year Low:
Venezuela, which was once Latin America’s largest oil exporter, ended 2018 with overseas sales lowest in nearly three decades. The country exported
1.245 million barrels a day last year, the lowest since 1990, as production tumbled on the back of economic and humanitarian crisis. Financial sanctions
imposed by the U.S. have further added to the woes of Venezuela’s ailing economy, while creditors have sought to seize its assets including oil cargoes
and its valued Citgo refineries in the U.S.
Plummeting exports increased the pain, as oil is Venezuela’s main source of revenue and bankrolls the regime of President Nicolas Maduro. The OPEC
member’s crude production fell by more than half in the past five years to a daily average of 1.346 million barrels this year, according to OPEC secondary
source data.
The country is also bracing for more sanctions, as the Trump administration is said to mull new actions against Venezuela by Jan. 10, when Maduro’s
current term expires. Maduro faced criticism back in May, when he was re-elected in a vote derided as a sham.6
Libya Lofty Plans to More than Double Oil Output after Losing 400,000 bpd of Supply:
5 Source: https://www.energymixreport.com/nigeria-to-lose-27-of-its-oil-production-in-2019/
6 Source: https://www.rigzone.com/news/wire/venezuela_oil_exports_slump_to_28year_low-03-jan-2019-157834-article/

Oil and Gas Monthly Report
11 | P a g e
Libya aims to more than double its oil production to 2.1 million barrels per day (bpd) by 2021 if the security and stability are strengthened in the conflict-
stricken country.7 This announcement comes after Libya just lost 400,000 bpd because of militant activity - blockade by a militant group at Libya’s largest
oil field, Sharara, was shuttered by a force majeure declaration by the National Oil Corporation in December.8 The North African OPEC member has been
a source of supply instability for years. Libyan leaders are likely to visit to China in the first quarter of 2019 to discuss oil investment opportunities.
Qatar’s exit from OPEC:
A surprise decision came from a prominent OPEC member “Qatar” that it will be exiting the OPEC.9 As per Qatar, due to increased Saudi interference, the
move was taken to isolate itself from OPEC. The Qatar also responded to the attempt to isolate Qatar by establishing new longer-term natural gas
agreements with China, Britain and Japan, to give a message that it remained open for business. This has shown that Qatar wants to pursue its own
approach in global gas markets.
7 Source: https://uk.reuters.com/article/libya-oil/update-1-libya-plans-to-more-than-double-oil-output-to-21-million-bpd-noc-idUKL8N1Z60G4
8 Source: https://oilprice.com/Energy/Crude-Oil/Libya-Declares-Force-Majeure-On-Largest-Oil-Field.html
9 Source: https://www.nytimes.com/2018/12/10/opinion/qatar-leaving-opec-saudi-arabia-blockade-failure.html

Oil and Gas Monthly Report
12 | P a g e
ECONOMIC FACTOR
Qatar To Invest Up To $20 Billion In U.S. LNG
Qatar Petroleum is looking to invest as much as US$20 billion in LNG projects in the United States over the next few years. The investment is separate,
apparently, from Qatar’s plans to boost its local production capacity from the current 77 million tons of LNG annually to 110 million tons by the early 2020s.
Qatar already commands a solid presence in the emerging LNG market of the United States. It is the majority stakeholder in the Golden Pass terminal in
Texas, where it has partnered with Exxon and ConocoPhillips. Yet, the US$20 billion won’t be spent just on LNG. Qatar Petroleum is expected to also look
into oil production in the United States.10
US Shale Exports:
U.S. shale is likely to continue its explosive growth. The shale producers have immensely exceeded 2018 forecasts, exceeding few initial estimates by
almost 1 mb/d. It is even more notable since the drilling frenzy was believed to be hobbled by pipeline bottlenecks. However, the recent downturn in prices,
financial stress and ongoing pipeline problems might finally slow growth. Production decline or even flatten out at current levels is far from expected, but
because so many pricing scenarios factor in massive growth from U.S. shale, even a slight disappointment could tighten balances more than anticipated.11
Nigeria Lost N197bn to Gas Flaring in 9 Months of 2018
Oil and gas firms operating in the country flared a total of 215.9 billion standard cubic feet of natural gas in the first nine months of 2018, amounting to a
potential loss of N197bn.
Data obtained from the Nigerian National Petroleum Corporation displayed that 31.68 billion scf of gas was flared in January; 27.25 billion scf, in February;
and 26.88 billion scf in March, and 23.06 billion scf in April. The firms, including international and indigenous operators, wasted 21.20 billion scf of gas in
May; 21.66 billion scf in June; 21.21 billion scf in July; 22.42 billion scf in August, and 20.54 billion scf in September.
10
Source: https://oilprice.com/Energy/Natural-Gas/Qatar-To-Invest-Up-To-20-Billion-In-US-LNG.html 11
Source: https://oilprice.com/Energy/Energy-General/2019-Will-Be-A-Wild-Year-For-Oil.html

Oil and Gas Monthly Report
13 | P a g e
Explosion of the Conoil Oil Field amid Economic Unrest by Leads to Production Disruption:
The oil field operated by Conoil exploded on January 4 and went up in flames at Koluama, Southern Ijaw Local Government Area, Bayelsa State. A group,
which identified itself as the Koluama Seven Brothers (KSB), claimed responsibility for the explosion and said that the attack was warning to the oil firm,
vowing deadlier attacks if the company failed to address their grievances.
Angel Michael, the President of KSB said King Solomon Eddy and his cartel failed to address issues of scholarships and job creation in the Memorandum
of Understanding (MOU) between the company and the community.12
12
Source: http://naija247news.com/2019/01/06/niger-delta-militiants-returns-bombs-oil-field/

Oil and Gas Monthly Report
14 | P a g e
PRICE DRIVERS AND RESTRAINTS
Geopolitics: Geopolitical tensions pressured the crude oil prices downward primarily driven by pressure on Saudi from US to lower the prices
which has led to record high production.
Dollar Value: Strenghthining Dollar aainst major currencies in November created an negative impact on markets like Europe, China, Japan and
Switzerland.
Supply: Global Oil Supply saw increase in the month of November and stood at an average of 100.64 mb/d. Strong US inventory levels
coupled with strong OPEC production led to the supply glut.
Demand: Global demand shows a weakening trend and demand as seen in previous months.
Traders Sentiments: Traders sentiment had a negative impact on cride oil price. We can see that market has not responded to OPEC
production cut announcement this time the way it used to respond previously
Refiners: Refinery margin in US saw a moderate loss supported inspite of jetffuel/kerosene draw.US WTI margin was $15.75 /b in November.

Oil and Gas Monthly Report
15 | P a g e
COMMODITY PRICE TRENDS
Coal
Average Thermal Coal Prices decreased to $100.70/mt in November. Low demand was
due to weak demand in East Asia and Import restrictions imposed by China.
Based Metal
Average base metal prices saw a decline in the month of November and decreased to
13.4% since June 2018. Some metals are getting support in price s since Sep 2018. Global
Slowdown in manufacturing a activity was a concern.
Precious Metal
Average Precious metal prices saw a increase from previous months due to weakening
sentiment in world’s equity market. Gold prices revised by 0.4%, and silver prices saw
decrease by 1.7%..
90
92
94
Sep-18 Oct-18 Nov-18
Wo
rld
Ban
k co
mm
od
ity
pri
ce
ind
ices
(2
01
0 =
10
0).
Precious Metal (Gold, Platinum & Silver)
82
84
86
88
Sep-18 Oct-18 Nov-18
Wo
rld
Ban
k co
mm
od
ity
pri
ce
ind
ices
(2
01
0 =
10
0).
Base Metal (Aluminium, Copper,Lead, Zinc,Nickel & Tin)
90
100
110
120
Sep-18 Oct-18 Nov-18
USD
/met
ric
ton
ne
Coal, Australia
Source: World Bank, Commodity price data.
Source: World Bank, Commodity price data.
Source: World Bank, Commodity price data.