Embed Size (px)
Citation preview

An Examination of the Relationship between Participation in Extra-
Curricular Physical Activity and the Psychological Well-Being of
Adolescent Males from Disadvantaged Communities.
Paul Prior
Thesis Supervisors: Dr. Catherine Woods, Dr. Sarahjane Belton
Date of Submission: September 18th, 2013.
This thesis is submitted in fulfilment of the requirements for a MSc.
Degree by Research in the School of Health and Human Performance at
Dublin City University.
I
Honesty Statement
I hereby certify that this material, which I now submit for assessment on the programme
of study leading to the award of M.Sc. is entirely my own work, that I have exercised
reasonable care to ensure that the work is original, and does not, to the best of my
knowledge, breach any law of copyright, and has not been taken from the work of others
save and to the extent that such work has been cited and acknowledged within the text of
my work.
Signed: ______________________________
Date: _______________________________

II
Acknowledgements
I would like to express my gratitude to the following people:
To my supervisors Dr. Sarahjane Belton and Dr. Catherine Woods for all your time,
energy and enthusiasm during my research.
To Sarah Chadwick and Eamon O’Leary who gave me lessons in SPSS!
To my wife Michelle, sorry again for the early mornings and late nights of study,
thank you for your patience!
To all the students who took part in the study and for their honesty.
And finally, to baby Maria, this ones for you sweetheart.
III
Table of Contents
Honesty statement I
Acknowledgements II
Table of Contents III
List of Tables VI
List of Figures VII
Abbreviations and Acronyms VIII
Peer Reviewed Abstracts IX
Abstract X
Chapter One 1
1.0 Introduction 1
1.1 Physical Activity and Adolescents 1
Physical Activity Recommendations 1
Levels of Physical Activity among Irish Adolescents 2
Extra-Curricular Physical Activity in Post-Primary Schools 3
Levels of Extra-Curricular Physical Activity Participation in
Irish Post-Primary Schools
3
1.2 Justification of the Study 4
1.3 Study Aims and Objectives 5
Chapter Two 6
2.0 Literature Review 6
2.1 Introduction 6
2.2 Types of Physical Activity 7
Physical Education 7
Extra-Curricular Physical Activity 7
Club Sport and Physical Activity Outside School 8
Active Travel to and From School 8
2.3 The Importance of ECPA 9
2.4 Health Benefits Associated with Adolescent Physical Activity 10
Physical Health Benefits 10
Mental and Social Health Benefits 12
2.5 Prevalence of Physical Activity in Adolescents 19
2.6 Correlates of Physical in Adolescents 24
Demographic and Biological Factors 25
Behavioural Factors 26
Psychological Factors 26
Social Factors 27
Physical Environment Factors 27
2.7 Youth Physical Activity Promotion Model 30
Predisposing Factors 30
Reinforcing Factors 30
Enabling Factors 31
Personal Demographics 31
2.8 Measurement of Physical Activity Levels in Adolescents 33
Accelerometers 33
IV
Pedometers 34
Self-Report 35
2.9 Pillars of Adolescent Physical Activity 36
Physical Education 37
Extra-Curricular Physical Activity 43
Sports Clubs and Physical Activity Outside of School 48
Active Travel to and from School 52
2.10 Overall Literature Review Summary and Future Research
Challenges
54
Chapter Three 58
3.0 Methodology 58
3.1 Research Design 58
3.2 Participants and Recruitment 59
3.3 Results and Methods 59
Pilot Study 59
Questionnaire Data Collection 60
Pedometer Data Collection 62
Focus Group Data Collection 63
3.4 Instruments 64
PA Questionnaire 64
Focus Groups 71
Pedometer Step Count 72
3.5 Data Process 73
Data Storage 73
Data Entry 73
Data Cleaning 73
Data Analysis 74
Chapter Four 77
4.0 Quantitative Data - Results and Discussion 77
4.1 Demographic Characteristics of the Sample and Numbers per
Time Interval
77
4.2 Behavioural Data 78
Meeting Physical Activity Recommendations 78
Habitual Physical Activity 79
Pedometer Step Count 80
Extra-Curricular Physical Activity 83
Most Popular ECPA 85
Barriers to Participation 87
Examining the Relationship between ECPA, HPA and
Pedometer Step Count
89
4.3 Psychosocial Data - Youth Physical Activity Promotion Model 90
Within Subject Change Over Time 90
Bivariate Correlations between Outcomes and YPAP Subscales 91
Between Subject Comparison for Year Long Participation 94
Regression Analysis to Predict ECPA Participation 96
4.4 Discussion on the Quantitative Data 97

V
4.4.1 Behavioural Data 97
Meeting Physical Activity Recommendations and Weekly HPA
Levels
97
Pedometer Step Count 101
Extra-Curricular Physical Education (ECPA) 104
Levels of Participation 104
Most Popular ECPAs 106
Barriers to ECPA Participation 108
Examining the Relationship Between ECPA, HPA and Step
Count
110
4.4.2 Psychosocial Data 110
Summary and Future Research Challenges 114
Strengths and Limitations 117
Chapter Five 118
5.0 Qualitative data – Results and Discussion 118
5.1 Demographic Characteristics of the Sample and Numbers per
Time Interval
118
5.2 Regular ECPA Participants 119
Enjoyment 119
Perceived Competence 122
Social Influences 124
Importance of ECPA to Students 127
5.3 Barriers to ECPA Participation 131
Perceived Lack of Competence 132
Peer Rejection 134
Acknowledgement of ECPA Participation Benefits 136
Encouragement to Participate in ECPA from Peers, Parents,
Teachers
137
5.4 Summary of Qualitative Data Analysis 138
Strengths and Limitation 139
Chapter Six 141
6.0 Conclusion and Recommendations 141
6.1 Implications of Study 141
6.2 Future Research Recommendations 142
References/Appendices 149
VI
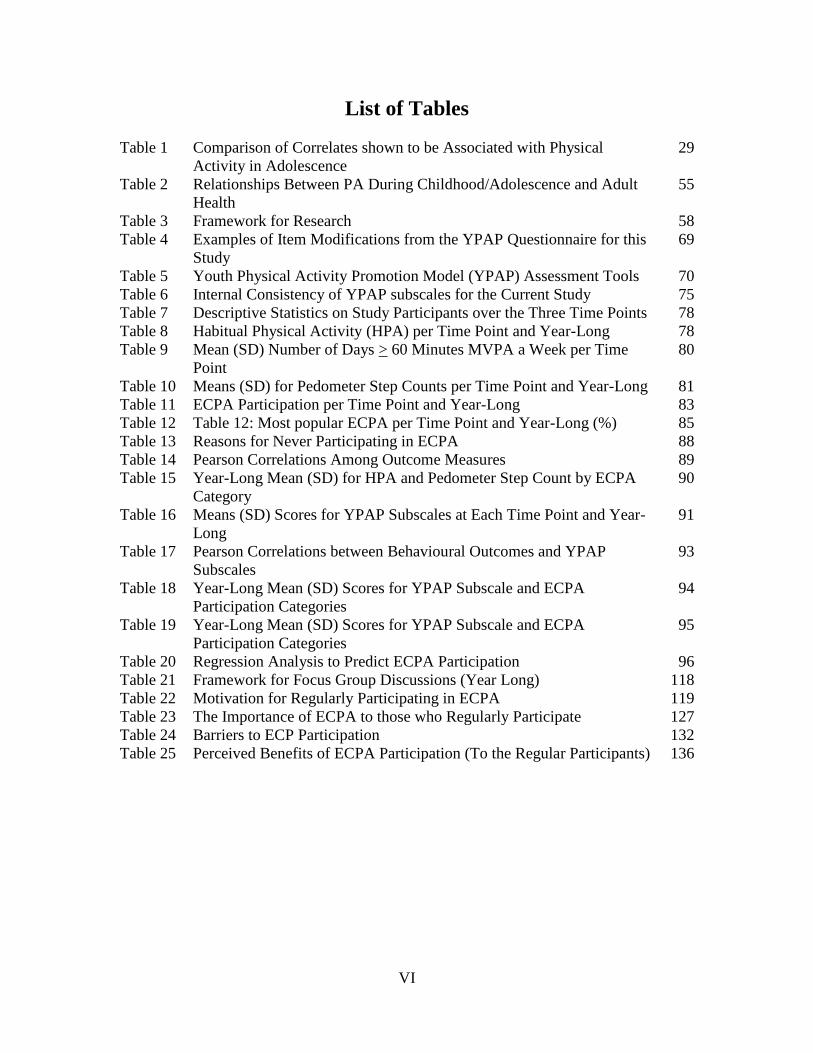
List of Tables
Table 1 Comparison of Correlates shown to be Associated with Physical
Activity in Adolescence
29
Table 2 Relationships Between PA During Childhood/Adolescence and Adult
Health
55
Table 3 Framework for Research 58
Table 4 Examples of Item Modifications from the YPAP Questionnaire for this
Study
69
Table 5 Youth Physical Activity Promotion Model (YPAP) Assessment Tools 70
Table 6 Internal Consistency of YPAP subscales for the Current Study 75
Table 7 Descriptive Statistics on Study Participants over the Three Time Points 78
Table 8 Habitual Physical Activity (HPA) per Time Point and Year-Long 78
Table 9 Mean (SD) Number of Days > 60 Minutes MVPA a Week per Time
Point
80
Table 10 Means (SD) for Pedometer Step Counts per Time Point and Year-Long 81
Table 11 ECPA Participation per Time Point and Year-Long 83
Table 12 Table 12: Most popular ECPA per Time Point and Year-Long (%) 85
Table 13 Reasons for Never Participating in ECPA 88
Table 14 Pearson Correlations Among Outcome Measures 89
Table 15 Year-Long Mean (SD) for HPA and Pedometer Step Count by ECPA
Category
90
Table 16 Means (SD) Scores for YPAP Subscales at Each Time Point and Year-
Long
91
Table 17 Pearson Correlations between Behavioural Outcomes and YPAP
Subscales
93
Table 18 Year-Long Mean (SD) Scores for YPAP Subscale and ECPA
Participation Categories
94
Table 19 Year-Long Mean (SD) Scores for YPAP Subscale and ECPA
Participation Categories
95
Table 20 Regression Analysis to Predict ECPA Participation 96
Table 21 Framework for Focus Group Discussions (Year Long) 118
Table 22 Motivation for Regularly Participating in ECPA 119
Table 23 The Importance of ECPA to those who Regularly Participate 127
Table 24 Barriers to ECP Participation 132
Table 25 Perceived Benefits of ECPA Participation (To the Regular Participants) 136
VII
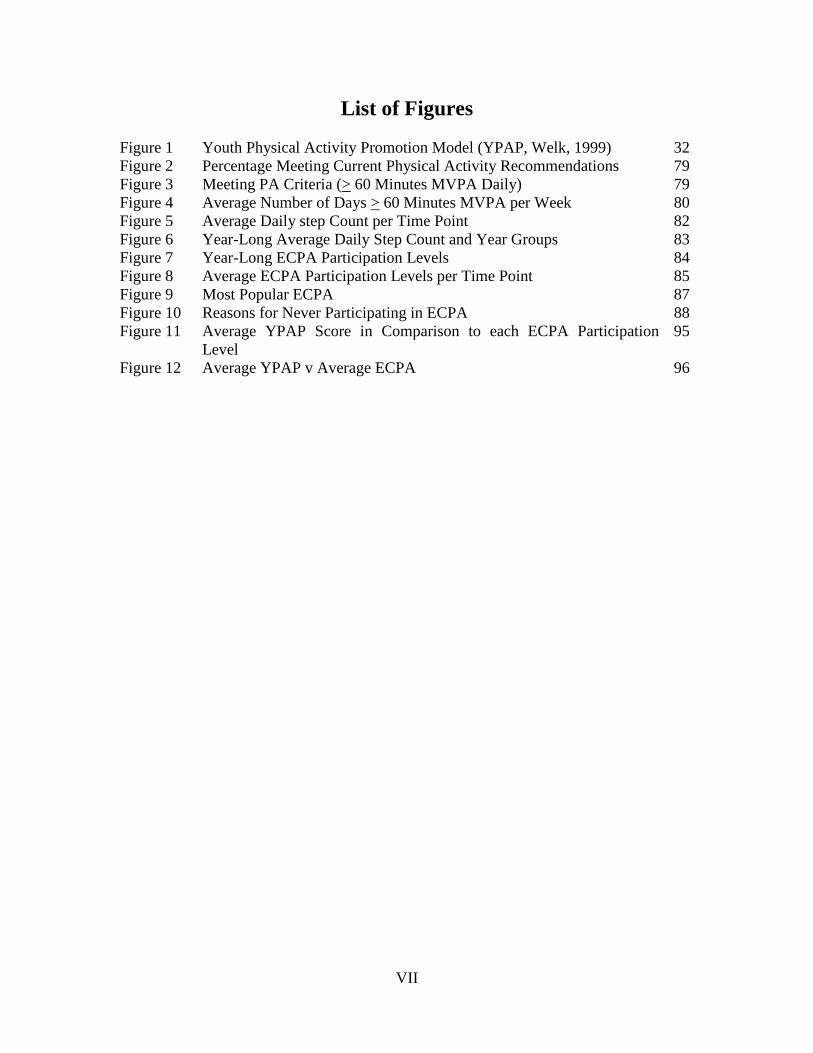
List of Figures
Figure 1 Youth Physical Activity Promotion Model (YPAP, Welk, 1999) 32
Figure 2 Percentage Meeting Current Physical Activity Recommendations 79
Figure 3 Meeting PA Criteria (> 60 Minutes MVPA Daily) 79
Figure 4 Average Number of Days > 60 Minutes MVPA per Week 80
Figure 5 Average Daily step Count per Time Point 82
Figure 6 Year-Long Average Daily Step Count and Year Groups 83
Figure 7 Year-Long ECPA Participation Levels 84
Figure 8 Average ECPA Participation Levels per Time Point 85
Figure 9 Most Popular ECPA 87
Figure 10 Reasons for Never Participating in ECPA 88
Figure 11 Average YPAP Score in Comparison to each ECPA Participation
Level
95
Figure 12 Average YPAP v Average ECPA 96
VIII
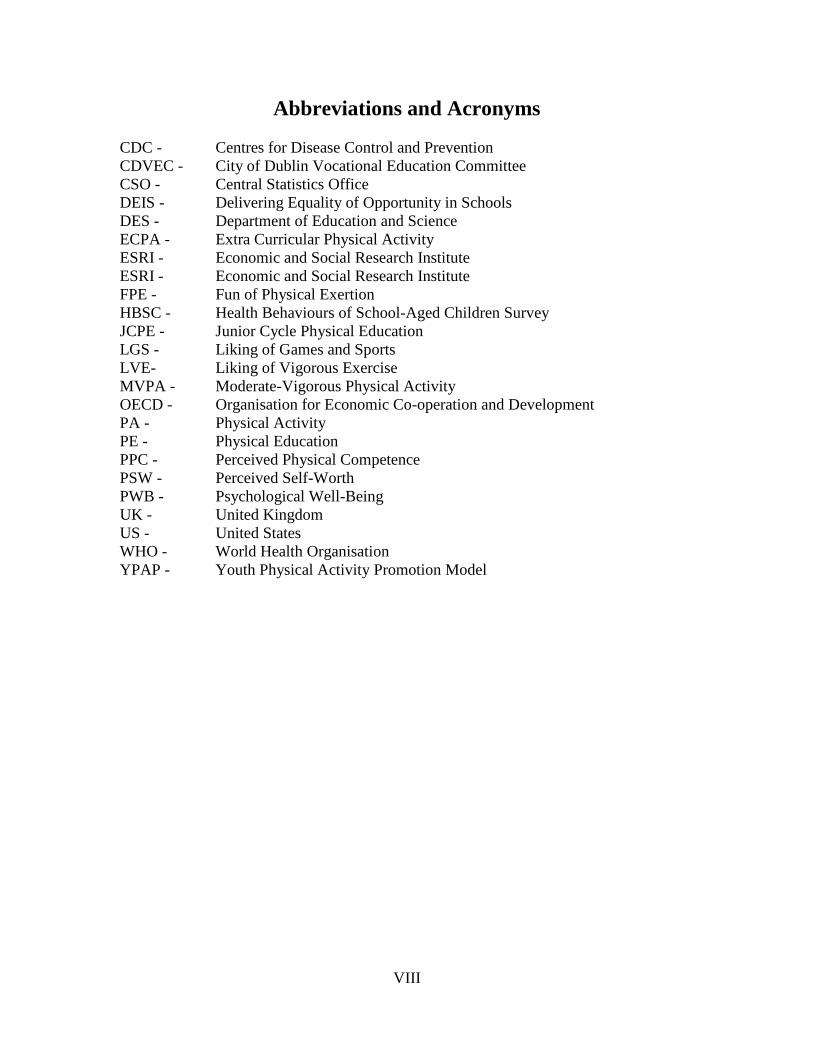
Abbreviations and Acronyms
CDC - Centres for Disease Control and Prevention
CDVEC - City of Dublin Vocational Education Committee
CSO - Central Statistics Office
DEIS - Delivering Equality of Opportunity in Schools
DES - Department of Education and Science
ECPA - Extra Curricular Physical Activity
ESRI - Economic and Social Research Institute
ESRI - Economic and Social Research Institute
FPE - Fun of Physical Exertion
HBSC - Health Behaviours of School-Aged Children Survey
JCPE - Junior Cycle Physical Education
LGS - Liking of Games and Sports
LVE- Liking of Vigorous Exercise
MVPA - Moderate-Vigorous Physical Activity
OECD - Organisation for Economic Co-operation and Development
PA - Physical Activity
PE - Physical Education
PPC - Perceived Physical Competence
PSW - Perceived Self-Worth
PWB - Psychological Well-Being
UK - United Kingdom
US - United States
WHO - World Health Organisation
YPAP - Youth Physical Activity Promotion Model
IX
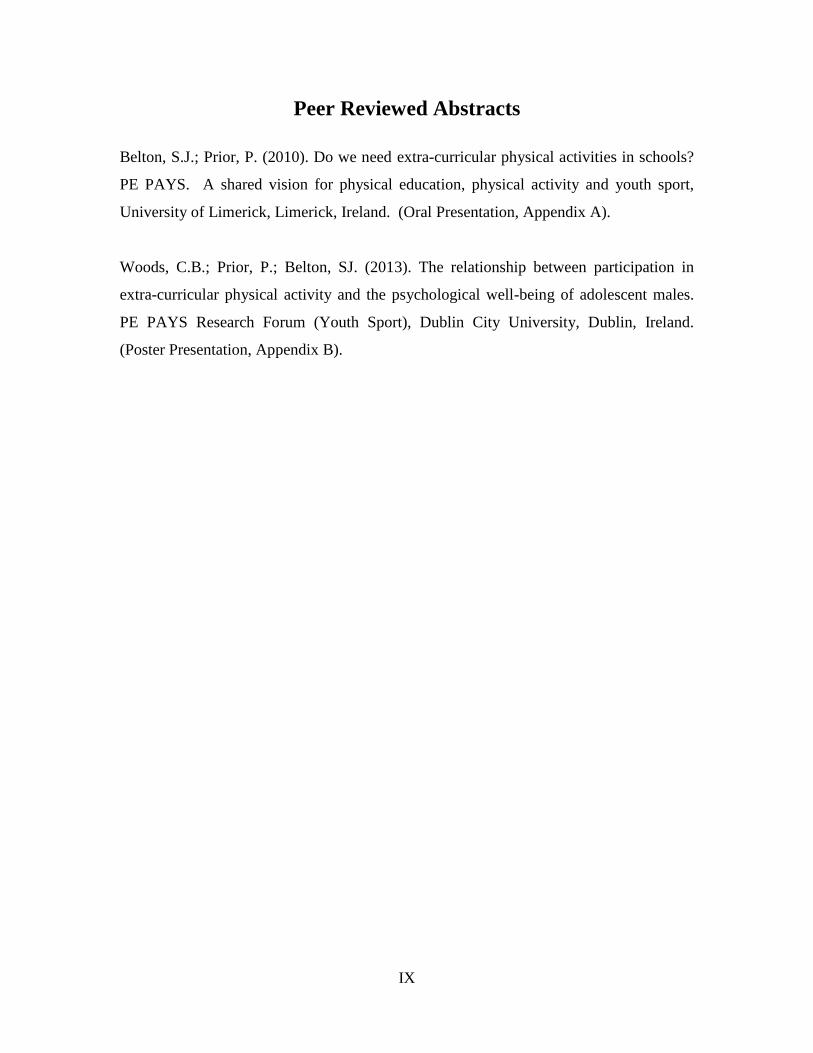
Peer Reviewed Abstracts
Belton, S.J.; Prior, P. (2010). Do we need extra-curricular physical activities in schools?
PE PAYS. A shared vision for physical education, physical activity and youth sport,
University of Limerick, Limerick, Ireland. (Oral Presentation, Appendix A).
Woods, C.B.; Prior, P.; Belton, SJ. (2013). The relationship between participation in
extra-curricular physical activity and the psychological well-being of adolescent males.
PE PAYS Research Forum (Youth Sport), Dublin City University, Dublin, Ireland.
(Poster Presentation, Appendix B).
X
Abstract
Extra-curricular physical activity (ECPA) has an important role to play in post-primary
schools. The main aim of this study was to examine participation levels of adolescent
males (aged 12-15 years) from disadvantaged communities in ECPA and to investigate
the impact on the psychological well-being of those who regularly participated. The
main psychological areas to be investigated were physical self-worth, perceived physical
competence and enjoyment of physical activity (PA). The study also looked to identify
barriers to participation in ECPA.
Data were generated using self-report questionnaires, activity monitoring devices
(pedometers) and focus group discussions. A longitudinal approach was adopted for this
study with data being collected at Autumn, Winter and Summer during the academic year
2008/2009. Junior cycle students (N=174, male, 12-15 years of age, mean age 13.59 +
.91) from four City of Dublin Vocational Education Committee (CDVEC) schools
participated in the study. Overall, N=174 students completed questionnaires, N=146
students recorded pedometer step counts, and N=43 students were involved in focus
group discussions.
Only 14% of students met Department of Health and Children (DOHC, 2009) guidelines
of > 60 minutes MVPA daily. Over the academic year, the average daily step count was
11,891 (SD = + 3,384) and the average number of days per week that students achieved
> 60 minutes MVPA was 4.98 (SD = + 1.21). In terms of ECPA participation, 43% of
students reported to ‘regularly’ (2 or more times weekly) participate in ECPA, 41%
reported to ‘sometimes’ participate (once a week) and 16% reported ‘never’ participating
in ECPA. As the rate of ECPA participation got higher, so did the average daily step
count and the number of days > 60 minutes MVPA per week.
XI
The students who reported to either ‘sometimes’ or ‘regularly’ participate in ECPA,
scored higher on all psychological well-being sub-scales than the students who reported
‘never’ participating in ECPA. An example of this can be seen under perceived physical
competence where regular ECPA participants year-long average score was 23.49 (2.36),
compared to students who never participated in ECPA who had a score of 14.88 (3.35),
F(2,167)=71.0, p<0.01.
The focus groups with students, who regularly participated in ECPA, revealed that their
main motivations for participation were enjoyment, being with friends and to improve
their self-esteem, fitness and skills. These students also recognised the value of
participation in ECPA, commenting on how it helped improve attendance and made
school more appealing for them. In comparison, the students who never participated in
ECPA suggested a lack of perceived competence and peer rejection were their main
reasons for non-engagement. These students however, acknowledged the value of ECPA
for its regular participants, namely building their confidence and making friends.
Strategies suggested by the non-participants that might encourage participation included
more positive support from significant others including peers, parents and teachers.
The main recommendation from this study is that ECPA in post-primary schools is a
potential untapped resource for increasing minutes of PA in adolescent males. The
present study has shown that ECPA participation can also have a positive effect on the
psychological well-being of adolescent males, in particular, perceived competence,
physical self-worth and enjoyment of PA. Future research should repeat this study with a
same age female sample and should examine in greater detail, possibly through direct
observation, the role of significant others (parents, peers, PE teachers) in the promotion
of ECPA participation for adolescents.
1
Chapter One
1.0 Introduction
1.1 Physical Activity and Adolescents
Physical activity (PA) is defined as any bodily movement that is produced by the
skeletal muscle and that increases energy expenditure (Casperson, et al., 1985). The
World Health Organisation (WHO, 2010) refers to PA as all movements in everyday
life, including work, recreation, exercise, and sporting activities. According to the
Department of Health and Children (DOHC, 2009), physical activities for young
people include walking, cycling, swimming, gardening, and participating in physical
education (PE) classes, and the key to getting and staying healthy is regular PA.
Woods and colleagues (2010) suggest that childhood and youth provides a real
opportunity to influence attitudes and participation rates positively towards PA.
According to Smith and Biddle (2008), there are five main characteristics that make
up PA. They are frequency, intensity, time, type and domain.
Frequency is the number of times that PA is performed within a certain period
of time.
Intensity is the physiological response to PA (amount of effort made)
Time is the amount of time that an activity is performed
Type is the particular activity being performed
Domain is the setting in which the activity occurs e.g. at school, sports club.
Physical Activity Recommendations
The Department of Health and Children (DOHC, 2009) PA guidelines for Irish
adolescents’ are in line with the World Health Organisation (WHO, 2010)
recommendations that young people should participate in moderate to vigorous
physical activity (MVPA) for at least 60 minutes every day (> 60 minutes MVPA
daily). These guidelines are consistent with those in the US, Australia and across all
member states of the European Union. Moderate activity is referred to as activity that
raises the heart rate above normal and breathing is harder than normal, while vigorous
activity refers to activity that raises the heart rate to much faster than normal and
breathing is much harder than normal (DOHC, 2009). It is suggested that for children
2
and youth (aged 5-17 years) their main activity is aerobic (WHO, 2010).
Adolescents’ should also be doing muscle strengthening, flexibility and bone
strengthening exercises three times a week and PA should be enjoyable (DOHC,
2009). According to the US Physical Activity Guidelines Advisory Committee
(2008), for those children and adolescent’s who meet the recommendation of > 60
minutes MVPA daily, there is strong evidence of better cardio-respiratory and
muscular fitness, stronger bones, better cardiovascular and metabolic health and a
healthier fat composition. They also highlight some evidence of reduced symptoms
of anxiety and depression. The recommended amount of time allocated to PE in post-
primary schools in Ireland is 120 minutes per week (Department of Education and
Science, 2003). In terms of physical steps taken daily, Tudor-Locke and colleagues
(2004) established that to achieve health benefits, the average age and gender specific
pedometer cut-points should be 12,000 steps daily for girls and 15,000 steps daily for
boys (aged 6-12 years). No recommendations for adolescent daily step counts were
given, however, they did suggest that the likelihood was for a decrease in the average
daily step count with increasing age in adolescence.
Levels of Physical Activity among Irish Adolescents
The ‘Take Part’ study (Woods et al., 2004) indicated low levels of PA among Irish
adolescents (aged 15-17 years) with only 35% of students meeting the recommended
> 60 minutes of MVPA 4 or more days per week (the recommended amount of PA for
this age group at that time). Males made up 42% of this total and the study also
pointed to a decrease in PA levels with increasing age in adolescence. The ‘Health
Behaviours of School Aged Children’ study (HBSC, Ireland, 2006) found that by 15
years of age, almost nine out of ten females and seven out of ten males did not
achieve the recommended level of > 60 minutes MVPA 4 or more times per week
(Nic Gabhainn et al., 2007). The study also highlighted a decrease in PA levels with
increasing age. The ‘Children’s Sport Participation and Physical Activity’ study
(CSPPA, Woods et al., 2010) found that only 12% of Irish post-primary students met
the Department of Health and Children (2009) PA recommendations (> 60 minutes of
MVPA daily). The findings showed that 92% of students were not receiving the
recommended 120 minutes per week of PE (DES, 2003). The study also indicated a
drop in PA levels as the age of the students increased (Woods et al., 2010). Fahey
3
and colleagues (2005) suggested that second year to sixth year students received, on
average, 69 minutes per week of PE. They also found that one in five students never
participated in ECPA in school. These findings over the last ten years indicate a need
for more in-depth analysis of opportunities to be physically active, such as ECPA, and
the potential health benefits from them, given the lack of emphasis on PE in schools
and a failure to adhere to the recommended 120 minutes of PE per week (Department
of Education and Science, DES, 2003).
Extra-Curricular Physical Activity (ECPA) in Post-Primary Schools
ECPA is frequently presented as a fundamental link between curricular physical
education (PE) and participation in sport and physical activity (PA) and is seen as
significant in laying the foundations for lifelong participation in sport and PA among
young people (Bass and Cale, 1999). However, Penney and Harris (1997) suggested
that ECPA provided limited opportunities to only a minority of pupils who possessed
sporting ability, at the expense of the majority of students with limited sporting
ability. ECPA is seen as a potentially good medium for enhancing pupil’s health, yet
researchers have very little idea of how much ECPA actually contributes to students’
health. (Curtner-Smith et al, 2007). There is also a dearth of information regarding
the possible association between ECPA participation and the psychological well-
being of adolescents. In Ireland, little is known about the amount of ECPA on offer in
post-primary schools, the content of ECPA, the levels of participation in it or the
possible health benefits to be gained from ECPA participation. The lack of ECPA
focussed studies in the literature highlights how the whole area of ECPA is under
researched in this country. According to Fahey and colleagues (2005), ECPA in Irish
schools can be a focus of school life, can give a school character and therefore, needs
to be brought much closer to the attention of research and policy development on
adolescent’s PA.
Levels of ECPA Participation in Irish Post-Primary Schools
In Ireland, the Economic and Social Research Institute study (ESRI, Fahey et al.,
2005) ‘School Children and Sport in Ireland’ found that far higher frequencies of
post-primary students (male and female) were participating in ECPA compared to

4
Physical Education (PE). The number of students participating in ECPA four or more
days a week was 22%, two or three days a week was 30%, with 18% participating
once a week. Male students were found to participate more often in ECPA than
females, with 29% of females unlikely to take part in ECPA at all, compared to 16%
of males. Fahey and colleagues (2005) also reported a decrease in ECPA
participation, as the students got older. The ‘Children’s Sport Participation and
Physical Activity’ study CSPPA study (Woods et al., 2010) found that 31% of post-
primary students were participating in ECPA four or more days a week, 26% were
participating two or three days a week and 16% were participating once a week. The
amount of students that reported to never participate in ECPA was 16%. Again,
males were found to be more regularly involved in ECPA than females and similar to
the ESRI study (Fahey et al, 2005), ECPA participation levels decreased with an
increase in age of the students; the decrease was more prevalent in females. The
CSPPA study reported that social class, area of residence and the designation of a
school as disadvantaged, did not influence participation rates in ECPA. However, it
was noted in the CSPPA study (Woods et al., 2010) that post-primary students from a
higher social class were more involved in community-based sport than those from a
lower social class.
1.2 Justification of the Study
There is a need to investigate the potential, positive impact of regular ECPA
participation on the psychological well-being of adolescent males in post-primary
schools. The importance, if any, of this form of activity to males from disadvantaged
communities, their motivations and barriers to participation and potential strategies to
encourage uptake and sustainability of ECPA amongst this target group need to be
examined. There has been little longitudinal research in this area and it is particularly
under-researched in Ireland, and amongst hard to reach, disadvantaged groups. This
research will provide a unique opportunity to investigate ECPA in disadvantaged
post-primary schools over the period of a single academic year. This study is advised
by Welk’s (1999) Youth Physical Activity Promotion model (YPAP). This model,
which will be discussed in detail in chapter 2, focuses on explaining youth
engagement in, or avoidance of, PA. Its four main explanatory mechanisms are an
understanding of one’s i) enabling ii) predisposing and iii) reinforcing factors and iv)
personal demographics in relation to PA behaviour.
5
1.3 Study Aims and Objectives
The aims of this study are to examine ECPA participation amongst Irish post-primary
males (aged 12-15 years) from disadvantaged backgrounds, to evaluate the potential
impact of regular ECPA participation on their psychological well-being and to
investigate the motivations or barriers to participation. The specific objectives are:
1. To explore the ECPA participation levels of Irish adolescent males.
2. To assess the PA levels of adolescent males in terms of Habitual Physical
Activity (HPA, > 60 minutes MVPA daily) and daily pedometer step count
3. To explore the possibility of regular ECPA participation being linked with
positive psychological well-being, as is defined by the Youth Physical Activity
Promotion model (Welk, 1999). It is hypothesised that perceived physical
competence (PPC), physical self-worth (PSW) and enjoyment of PA will
improve with an increase in ECPA participation levels.
4. To understand the motivations and barriers to ECPA for students.
6
Chapter Two
2.0 Literature Review
2.1 Introduction
The purpose of this chapter is to review the literature on physical activity (PA) and
adolescents. Section 1 will outline the different types of PA, the current guidelines on
PA for adolescents, PA prevalence levels of Irish adolescents and the physical
benefits associated with PA for this population. Section 2 will examine the
psychosocial benefits associated with PA and explore the correlates and measurement
of PA in youth. The final section will review, in detail, the different types of PA in
adolescence.
This literature review is focused mainly on post-primary school students (aged 12-18
years). In Ireland, post-primary school (second level education) generally starts at the
age of 12 and consists of a 3-year ‘junior cycle’, followed by a 2 or 3 year ‘senior
cycle’. The junior cycle consists of years 1, 2 and 3. The typical age range of
students in the junior cycle is 12-15 years of age. The senior cycle is typically a 2-
year programme, however, an optional ‘transition year’ may be chosen in schools
where it is offered. This is a 1-year programme, which acts as a bridge between the
junior and senior cycle. The typical age range of students in the senior cycle is 15-18
years of age (Department of Education and Skills, 2009). This age range, commonly
referred to as adolescence, is a peak time of leisure needs (Hendry et al., 1993). It is
the transition from childhood to adulthood and is one of the most important and
critical periods of development in the life cycle during which physical, social and
emotional changes occur (Fox, 1997; Harter, 1999). Yet, research suggests it is a
period characterised by a decline in PA (Pratt et al., 1999; Trost et al., 1999). As
such, it makes an ideal time to study how PA habits change, and how participation in
different types of PA, in this case extra-curricular physical activity (ECPA),
influences the health and well-being of adolescents. For the purpose of clarity, the
main types of PA that youth participate in are introduced below. These include
physical education (PE) and extra-curricular physical activity (ECPA) in school,
community based PA and active travel to and from school. A full review of these
types of PA is presented at the end of the chapter.

7
2.2 Types of Physical Activity
There are many different types of PA that adolescents can participate in to meet the
recommended PA guidelines of > 60 minutes MVPA daily ((DOHC, 2009).
Opportunities for adolescents’ in Ireland to be physically active include physical
education (PE) and extra-curricular physical activity (ECPA) within the school
setting, active travel to and from school, and PA within sports clubs in the community
(Woods et al., 2010).
Physical Education (PE)
PE in schools is seen as an important way of encouraging young people to be
physically active, which can promote their health and well-being (Cale, 2000;
Blanksby and Whipp, 2004). The current PE syllabus in Ireland states that ‘‘PE
recognises the physical, mental, emotional and social dimensions of human movement
and emphasises the contribution of physical activity in the promotion of individual
and group well-being’’ (Department of Health and Science, 2003:4). The PE
curriculum in Irish post-primary schools is made up of 7 areas of study. These
include adventure activities, aquatics, athletics, dance, games, gymnastics and health
related activity. The curriculum is developed on the basis of a time allocation of two
hours per week. PE is compulsory for students within the junior cycle (aged 12-15
years), however, it is optional for students at senior cycle level (aged 16-18 years).
PE is a non-examinable school subject in Ireland. The potential of PE to affect young
people’s PA is apparent from 2 standpoints. First, high-quality, active PE can
contribute to recommended PA levels for youth. Second, positive PE experiences
may be key in the promotion of PA beyond the curriculum and outside of school
(Cavill et al., 2001; Corbin and Pangrazi, 2003).
Extra-Curricular Physical Activity (ECPA)
ECPA is usually associated with PE in schools and it is often referred to as extra-
curricular PE, particularly in the UK. Extra-curricular PE in schools has been defined
as “the provision of activities outside of the formal PE curriculum, most often after
school and at lunch times, but also in some schools, at weekends and/or before
school” (Penney and Harris, 1997:42). Extra-curricular physical activity (ECPA) will
be used in this document as the term to describe any physical activities participated in
8
by students within the school setting, but outside of the formal curriculum. They are
organised by the school, by volunteers or by local clubs coming into the school and
they normally take place at lunchtimes, before or after school. ECPA is
acknowledged as an essential part of young peoples’ PA experience in school (Fahey
et al., 2005). Across the literature, varying terms are used to describe ECPA, such as
‘extra-curricular sport’, ‘extra-curricular activities’ and the aforementioned ‘extra-
curricular PE’. For the purpose of this study, ECPA is used as an umbrella phrase and
will reflect all of these terms.
Club Sport and PA Outside of School
Club sport and PA outside of school are important in helping young people achieve
the WHO (2010) and DOHC (2009) recommendation of > 60 minutes MVPA daily.
According to Lunn and colleagues (2007), clubs that are run outside of the school
system are an important part of the institutional structure of sports participation in
Ireland. The European Heart Network document on ‘Children and Young People –
The Importance of Physical Activity’ (2001), states that after-school and weekends
are key times associated with PA for young people.
Active Travel to and from School
Active travel is walking or cycling all or part of the journey to a destination, whereas,
inactive travel is using motorised transport e.g. car or bus (Smarter Travel: A
Sustainable Transport Future, Department of Transport, 2009). Murtagh and Murphy
(2011) suggest that active travel to and from school may represent a worthwhile
strategy for improving children’s PA levels. The WHO (2010) states that walking can
have significant benefits to health and is the nearest activity to perfect exercise. The
National Heart Alliance, Ireland (2010) referred the daily trip to school as the most
universal opportunity for regular PA through cycling or walking and a great way of
getting young people physically active.
Alongside club sport and PA outside of school, there is a real opportunity for
adolescents to be physically active in school, including active travel to and from
school. These opportunities need to be highlighted to increase the PA levels of
adolescent males in post-primary schools.
9
2.3 The Importance of ECPA
The school environment is an important setting for children and adolescents to take
part in PA through PE, ECPA and participation during lunchtime or after school
(WHO, 2003). ECPA is not part of the formal curriculum in post-primary schools,
yet it can provide an excellent opportunity for adolescents to be physically active
within the school setting. Due to the amount of time adolescents spend in school
during the academic year, post-primary schools can play an important role in
potentially increasing the PA levels of adolescents. However, despite the potential,
the impact of ECPA participation on PA levels in adolescents has not been studied
extensively in research (Pate et al., 2006).
In many schools, ECPA is actually provided more often than PE, highlighting the
importance of ECPA as an opportunity for students to be physically active. The
official weekly PE recommendation in Irish post-primary schools (Department of
Education and Science, 2003) is that of at least two hours per student. Evidence
would suggest that many schools do not meet these recommendations and studies
have shown that students’ participation in PE drops significantly in the senior cycle
(McPhail and Halbert, 2005; Woods et al., 2010). For this reason, the availability of
ECPA in post-primary schools is crucial. PE and ECPA in post-primary schools are
often linked by the physical activities that are provided. Students’ views on ECPA
and its content need to be investigated in order to possibly increase motivation to be
physically active within the school setting. In order to gauge the honest views of
students on ECPA in school, more qualitative research needs to be carried out. An
understanding of the factors that influence adolescent’s participation in PA is
required. Focus group discussions should provide students’ with a window of
opportunity to portray their views on PA in school, including what motivates them to
participate or what prevents them from participating in ECPA. This current study
provides that platform for junior cycle males (aged 12-15 years). The findings, if
acted upon, could lead to a more positive environment created in post-primary schools
around the area of PA for all students and could increase the motivation of more
students to participate in ECPA on a more regular basis.
10
2.4 Health Benefits Associated with Adolescent PA
According to Inchley and colleagues (2011), the increasing recognition of the health
benefits of PA in recent times has led to renewed efforts to promote active lifestyles
among young people. Regular participation in PA for young people has been shown to
enhance their physical, psychological, and social well-being (Biddle, Sallis and
Cavill, 1998; European Heart Network, 2001; National Heart Alliance, 2010; WHO,
2010).
Physical Health Benefits
The WHO (2010) recommend PA to young people to assist in the development of a
healthy cardiovascular and musculoskeletal system, as well as the development of
neuromuscular awareness and to help maintain a healthy body weight. The direct
relationship, however, between PA and health in young people is not exactly clear.
This is somewhat linked to methodological problems, in terms of how it can be
measured. It is also due to the main morbidities, particularly non-communicable
diseases, which affect adults, but have not had long enough to become established in
adolescents (Riddoch, 1998). According to Cale and Harris (2005), the evidence to
suggest that PA in adolescence benefits them greatly in terms of physical health is
inconsistent and makes the guidelines for PA in youth somewhat superficial. This
suggests that further research, particularly longitudinal research, into this area is
warranted. Twisk (2001) suggests that PA guidelines for children and adolescents are
highly speculative and reports there is only marginal evidence that PA is beneficial
for health during childhood and adolescence or that PA in youth is related to adult
health status.
Weight control/Obesity management
One of the more widely recognised physical health benefits from PA participation
both in the short term and the long term is weight control/obesity management (Chief
Medical Officer, CMO, Department of Health, England, 2004; Strong et al., 2005).
Overweight and obesity in young people has been linked to psychosocial problems
that may persist into adulthood (Edmunds et al., 2001). This manifests, for example,
in obesity negatively effecting self-esteem in youth, the effects of which may last into
adulthood (Fahey et al., 2005; Hallal, 2006; Department of health and ageing,
Australian Government, 2009). Overweight and obesity in young people is one of the
11
major public health challenges of the 21st century (WHO, 2010). Obesity can be
referred to as a symptom of an imbalance between calories taken in as food and
calories that are expended through PA (European Heart Network, 2001). Although
physical inactivity and consequent low energy expenditure is not the sole cause of
obesity, there is a correlation between sedentary behaviours and levels of overweight
and obesity (European Heart Network, 2001). Some of the problems that can be
caused by overweight and obesity in young people include the onset of Type 2
diabetes, cardiovascular problems, lower levels of physical fitness and a lower quality
of life (CDC, 2011; CMO, England, 2004; National Heart Alliance, 2010; WHO,
2010). PA is recognised as key to effective management of overweight and obesity
problems (Strong et al., 2005; Department of Health and Children, Ireland, 2005).
The Department of Health and Children in Ireland (DOHC, 2009) suggest that to be a
healthy weight, regular PA and a healthy diet is essential, which ensures a balance
between energy received from food eaten and the amount of energy used.
According to Ogden and colleagues (2008), obesity levels among American
adolescents (aged 12-19 years) more than tripled in the last 30 years, increasing from
5% to 17.6%. In Australia, a National Health Survey (2007/2008) found that 24.9%
of children (5-17 years) were overweight or obese (Department of Health and Ageing,
Australian Government, 2009). In 2011, the National Health Service (NHS),
England, produced a report on ‘Statistics on Obesity, Physical Activity and Diet in
England’. The report used figures on overweight and obesity in youth from a Health
Survey for England (2009). This survey included a total of N=7,521 children and
adolescents (aged 2-15 years). The report stated that three in ten males and females
(aged 2-15 years) were classified as overweight or obese. The report also concluded
that 16% of males and 15% of females (aged 2-15 years) were classified as obese, an
increase from 11% and 12% respectively from 1995.
According to the Department of Health and Children, Ireland (2005), obesity is a
major public health concern in this country and that the less active people are, the
more at risk of being overweight they are. The National Teens Food Survey (2008) in
Ireland reported that teenage obesity had significantly increased since 1990. The
increase had gone from 1% to 8% in males and 3% to 6% in females. It was also
stated that one in five teenagers were overweight or obese (Irish Universities Nutrition
12
Alliance, 2008). The National Taskforce on Obesity estimated that 300,000 children
in Ireland were overweight and obese and predicted that this figure would increase by
10,000 annually (Department of Health and Children, 2005). The ‘Growing Up in
Ireland’ study has highlighted more worrying evidence on the state of the nations
children (Layte and McCrory, 2011). This document reports on a sample of N=8,568
primary school pupils during 2007 and 2008. All the males and females involved
were nine years of age at the time of the study. From the data collected, 19% of the
children were classified as overweight and 7% as obese. Thirty-three percent of
females and 22% of males were classified as overweight or obese. The report
suggests that overweight or obese children are likely to become overweight or obese
adults (Layte and McCrory, 2011).
Fahey and colleagues (2005) carried out research for the Economic and Social
Research Institute (ESRI) in conjunction with the Irish Sports Council. This ‘School
Children and Sport in Ireland’ report collected information from post-primary school
students (N= 3,527), across eighty schools. The figures showed that approximately 1
in 5 post-primary students were either obese or overweight. In the CSPPA study
(Woods et al., 2010) a sub-sample (N=1,215) of the overall cohort of students
completed physical health measures. Three-quarters of the students had a healthy
Body Mass Index (BMI), 18% were found to be overweight and 4% were obese.
Mental and Social Health Benefits
The psychosocial benefits to young people from involvement in PA have been well
documented (CMO, 2004; Department of Health and Children, Ireland, 2009; WHO,
2010). The CMO (2004) report suggested that participation in PA by young people
could improve their psychological well-being and provide opportunities to develop
social skills. The WHO (2010) also emphasised the importance of PA participation
for them, stating that PA can benefit their social development. They suggest that
confidence levels can be increased and that social interaction and integration can
flourish.
In 2001, the European Heart Health Initiative published ‘Children and Young People
– The Importance of Physical Activity’. This paper recognised the importance of PA
as a normal part of growing up and identified the importance of the links between
13
physical activity and psychological health. Tortolero and colleagues (2000) reviewed
forty-eight articles regarding PA and young people and found strong to moderate
support for the positive relationship between PA in youth and many psychological
variables. In particular, they demonstrated evidence for a positive association
between PA in youth and psychological variables such as self-esteem and perceived
physical competence.
Biddle and colleagues (2000) referred to self-esteem as the awareness of good
possessed by the self. According to Whitehead (1995), self-esteem is associated with
self-worth. Biddle and Mutrie (2001) suggested that self-esteem is the single most
important measure of psychological well-being. They suggested that those who
recommend participation in exercise and sport often claim the enhancement of self-
esteem, which is in line with benefits associated with PA in youth today. Calfas and
Taylor (1994) reviewed the literature on the effects of PA on psychological variables
in adolescents. They found moderate evidence to suggest that PA was related to
higher self-esteem levels in adolescents. Fox (2000) found that higher levels of self-
esteem could be achieved with higher levels of PA in youth. Altintas and Hulya Asci
(2008) investigated the physical self-esteem of adolescents with regard to PA. Turkish
adolescents (N=420 male/383 female, aged 11-14 years) completed The ‘Children and
Youth Self-Perception Profile’ (Whitehead, 1995), a 36-item questionnaire, which can
be used to ascertain physical perception in different areas of self-worth. They also
completed a weekly activity checklist, which reported their PA for the whole week.
The investigation found that physically active males and females scored higher on
almost all subscales of physical self-esteem than their less active counterparts.
A more recent study examined Scottish adolescents’ physical self-perceptions and
their association with PA using a longitudinal perspective (Inchely et al., 2011).
Scottish adolescents (N=641, aged 11-15 years/N=49% males) across four school
years completed self-report questionnaires. Self-esteem was assessed using a ten-item
scale based on the Rosenberg self-esteem scale (West and Sweeting, 1997). A four
point Likert scale was used and responses ranged from ‘agree a lot’ to ‘disagree a lot’.
Males reported higher levels of self-esteem than females in all years of the study.
This study suggests the importance of physical self-perceptions in terms of PA
participation among adolescent males and females. The study suggests that future
14
research should aim to identify those physical activities, which may be most likely to
foster positive self-perceptions during the adolescent years. In summary, several
researchers have highlighted the positive effect on psychological well-being and self-
esteem from PA in childhood and adolescence (Crocker et al., 2000; European Heart
Network, 2001; Green and Hardman, 2005; Hallal et al., 2006; Kremer et al., 1997).
Inchley and colleagues (2011) refer to physical self-worth as a component of global
self-esteem, which relates specifically to perceptions of self in the physical domain.
The study, referred to above, measured physical self-worth in Scottish adolescents
(aged 11-15) using the physical self-worth subscale of the Child and Youth Physical
Self-Perception Profile (Whitehead, 1995). Physical self-worth was associated with
PA in males and females and males reported higher levels of physical self-worth than
females in all years of the study. In 1999, the Institute of Youth Sport carried out a
study across 49 secondary schools in England (N=2510, aged 11-15 years, 1178
male/1332 female). The objective was to identify possible links between PA and
psychological well-being. All participants completed a battery of self-report
questionnaires. Results showed that there were two distinct groups. Group 1 was
categorised as the highly physically active students (N=13%) who scored highest on
the physical self-worth levels. This particular group was made up of more males
(N=66%) than females (N=33%). Group 2 was categorised as the lowly physically
active group (N=14%) scored low on physical self-worth levels. This particular group
was made up of more females (N=67%) than males (N=33%) and were, on average,
older. The results from this study showed that regular participation in health
enhancing PA for youth is beneficial to their physical self-worth and may protect it,
whereas a lack of PA may be damaging to it.
Perceived competence has been referred to as the perception of control over an
outcome and is associated with the mastery of a desired behaviour (Biddle and
Mutrie, 2001). The motivation literature emphasises the importance of perceived
competence in an individual’s decision to engage in and maintain involvement in a
PA (Bandura, 1997; Fox, 2000; Horn and Harris, 2002). McNamara and colleagues
(2011) viewed perceived competence as the drive to keep persisting in the face of
difficulty. It is also believed that these variables can grow in importance as
individual’s progress further in their PA. A study by Telama and colleagues (2005)

15
looked at the relationship between lifestyle and PA among Belgian (N=1439) and
Finnish (N=789) adolescents (aged 12-15 years, N=1142 male/1086 female) using
self-report questionnaires. The most active adolescents had the highest mean score in
perceived physical competence and task orientation and had a positive attitude
towards school and PE. The most inactive groups were found to have low levels of
perceived physical competence, a negative attitude towards PE and they reported low
perceptions of the importance of being good at sport. These results emphasise that
perceived physical competence and perceived importance of being fit or good at
sports were among the main correlates of adolescents’ PA. There is a need for future
research to further develop our understanding of the relationship between perceived
physical competence and different types of PA that adolescents choose to engage in.
Inchely and colleagues (2011) measured Scottish adolescents’ perceived sports
competence using the Physical Ability Subscale of the Self-Description Questionnaire
(Marsh, 1990). The study found that perceived competence was significantly
correlated with PA for males and females and that males reported higher levels of
perceived competence than females in all years of the study. The study suggests that
future research should aim to identify those physical activities, which may be most
likely to foster positive self-perceptions during the adolescent years (Inchely et al.,
2011).
PA in youth has been shown to not only benefit the mental well-being of children and
adolescents, but it can also be beneficial in alleviating mental ill-health. Calfas and
Taylor (1994) reviewed literature on the effects of PA on psychological variables in
adolescents. They found moderate evidence to suggest that PA was related to lower
stress levels. A study by Motl (2004) showed that PA was inversely related to
depression symptoms in early adolescence. A review of 48 articles regarding PA and
young people that found that a positive relationship between PA in youth and many
psychological variables, also indicated a negative relationship to depression and stress
(Tortolero et al., 2000). These studies have led many health organisations and
Government Health Departments, when promoting PA in youth, to refer to the control
and reduction of anxiety, stress and depression symptoms in young people from being
physically active (European Heart Network, 2001; Department of Health and Human
Services, US, 2008; WHO, 2010). The Chief Medical Officer (CMO) reported that
16
children and adolescents who have low PA levels have more symptoms of distress
than their more active counterparts (Department of Health, England, 2004).
Participation in PA can also benefit the social development of adolescents by raising
their confidence levels and by improving their social interaction and integration
(DOH, England, 2004; WHO, 2010). Berger and colleagues (2007) suggest that
parents, siblings and friends typically comprise the social support system for
adolescent participation in PA and that adolescents aspire to do what peers do, have
similar desires and possess the same values. Being with friends (Department of
Health and Human Services, US, 2008) is one of the main motives why children and
adolescents engage in PA. Enjoyment of PA has also been linked in research to the
social aspect of PA for young people (McCarthy and Jones, 2007; Tannehill et al.,
2011). The links between parental support and healthy adolescent behaviours have
been extensively studied and there are positive relationships between parental support
and adolescent involvement in PA (Sallis, Prochaska and Taylor, 2000).
A report by the Women’s Sport and Fitness Foundation (WSFF, 2011) provided an
insight to the attitudes of primary and secondary school students (N=1500) to sport
and PA in England. The survey, carried out by the Institute of Youth Sport at
Loughborough University from 2009 to 2011, was questionnaire based and included
focus group discussions with students. The report found that for females, one of the
most enjoyable and motivating aspects of sport and PA is the social aspect. The focus
groups showed that females were very influenced by the behaviour of their friends.
They felt that if their friends were active, it would encourage them more to take part
and make them feel more comfortable participating in sport and PA. This was even
more evident with older females. Overall, 57% of females reported being active
because their friends were and the same number agreed that females drop out of sport
and PA because their friends do. Encouragement and social involvement and
friendships have been reported among older children (aged > 12 years), which
indicated that affiliation with peers in youth sport and PA is an important source of
enjoyment for children. Older children are, however, more strongly influenced by
peers in sport, reflecting a developmental shift in enjoyment perceptions (Allen,
2003).
17
A study by Wenthe and colleagues (2009) in the US investigated the relationship
between predisposing, reinforcing and enabling factors from the Youth physical
Activity Promotion model (YPAP) and moderate to vigorous Physical Activity
(MVPA). Family and peer support were two of the main factors examined. The
participants (N= 205 adolescents, 102 male) completed a self-report questionnaire
(Physical Activity Questionnaire for Adolescents) and a questionnaire based on the
YPAP model. The participants also wore an activity monitor (accelerometer) for five
consecutive days. The study found that peer support demonstrated a significant
correlation with the MVPA of the male participants. Of all the factors looked at,
family support demonstrated the strongest and most consistent relationship with male
MVPA. The study suggested that family support has the potential to positively alter
the PA behaviour of adolescents.
A longitudinal study carried out by DiLorenzo and colleagues (1998) examined the
determinants of exercise among children (Phase 1, N=242, N=121 males, mean age
11.2 years) and phase 2 (N=111, N=57 males, mean age 14 years). The study
involved the participants completing a Physical Activity Questionnaire and being
involved in interviews. The findings showed that peer influence was important for
both males and females in terms of PA participation, yet more so for females as they
got older. The most important predictor of PA participation found was enjoyment.
Both peer and family support in the form of encouragement of PA were important to
both males and females but became more so for females over time. Sabistion and
Crocker (2008) examined the leisure time activity correlates of adolescents (N=857,
aged 15-18 years) using questionnaires to assess social influence and PA. The study
found that encouragement from significant others was associated with high sport
values among youth. This can be related to PA. The study (Sabistion and Crocker,
2008) suggested that parent and peer influences should continue to be explored as
sources of adolescent PA values. Smith and Biddle (2008) stated that parental support
for their children’s PA participation ranges from verbal encouragement to logistic
support (providing transportation e.g. providing transportation, and creating a home
environment conducive to PA behaviour. In Gustafson and Rhodes (2006) review, 19
studies investigated parental support and 18 of them showed a significant positive
relationship with youth PA. The review also reported that the association was
stronger in younger (< 12 years) than in older children (> 12 years). Brustad (1996)
18
suggested that parental encouragement of PA, not role modelling (activity level of
parents), was significantly related to perceived competence and attraction to PA.
Kimiecik (1998) also highlighted the links between parental beliefs (perception of the
child’s competence) and children’s PA participation. The focus group discussions in
the present study look at the type of parental influence affecting adolescent males
ECPA participation in chapter 5.
Summary of section 2.4
It has been suggested by Riddoch and colleagues (2004) that the evidence for physical
health benefits of PA in children and adolescent’s is by no means strong and that the
real goal of PA promotion in young people lies in the establishment of regular PA
participation, which could persist throughout life, rather than the production of health
outcomes. Overall, specific studies need to be carried out to clear up inconsistencies
surrounding the physical health benefits to adolescents from being physically active.
Longitudinal studies tracking adolescents and their PA participation into adulthood to
investigate physical health benefits over a longer period would also be worthwhile.
Reducing sedentary behaviour, as well as promoting PA, is the key to addressing the
inactivity problem among Irish adolescents (Woods et al., 2010). This study looks at
the possibility of ECPA being an important contributor to PA levels in adolescent
males (aged 12-15 years) over the duration of a full academic year.
This review of mental and social health benefits to adolescents from participation in
PA has shown that participation is positively linked with both psychological well-
being and positive social support. However, much of the research is cross-sectional
(Inchely et al., 2011; WSFF, 2011) and quantitative (Wenthe et al., 2009; Institute of
Youth Sport, 1999). This suggests a very short time frame, with a-priori hypothesis
agreed before the research commences. There is a need to broaden our research
learning through more longitudinal research, facilitating extensive use of qualitative
research methods such as focus groups. The focus groups, used in some of the studies
reviewed (McCarthy and Jones, 2007; Tannehill et al., 2011; WSFF, 2011) have
given adolescents an opportunity to portray their attitude towards PA, in terms of
benefits they derive from PA participation. This is potentially very important as the
adolescent voice can allow exploration into the research challenge of preventing
19
dropout and sustaining long-term PA participation. This present study includes focus
groups at three different stages over the course of an academic school year.
2.5 Prevalence of Physical Activity in Adolescents
Despite the widely acknowledged health benefits of PA participation for youth,
research is showing that a large volume of children and adolescents across Europe and
North America are not meeting the minimum recommended level of > 60 minutes
MVPA daily (Nic Gabhainn, 2010; Twisk, 2001; WHO, 2010). The WHO (2010) has
stated that the decrease in PA begins in adolescence and continues throughout the
adult years. Approximately, 600,000 deaths per year in Europe occur as a
consequence of physical inactivity (WHO – European Region, 2006). More recent
figures estimate that 1.9 million people worldwide die each year as a result of
physical inactivity (WHO, 2010). The most concerning long-term consequences of
inactivity in youth, is its persistence into adulthood (Department of Health and
Children, Ireland, 2009;European Heart Network, 2001; Nic Gabhainn et al., 2007;
WHO, 2010).
A nationwide self-report survey was carried out by the Centres for Disease Control
and Prevention (CDC) in the United States (Eaton et al., 2009). This Youth Risk
Behaviour Surveillance survey (YRBS) included a total of N=16,410 high school
students (N=52% male) in grades nine to twelve (aged 14-19 years). The survey
found that only 18% of students had participated in > 60 minutes of MVPA per day
on each of the previous seven days. Overall, 24% of males and 11% of females were
physically active on each of the previous seven days. The number of students who
participated in > 60 minutes of MVPA on each of the previous seven days decreased
as the age of the students increased (9th
grade – 21%, 10th
grade – 19%, 11th
grade –
17%, 12th
grade – 15%). This decrease was prevalent among males and females. The
percentage of students who participated in > 60 minutes of MVPA on five or more
days in the previous seven was 37%. Overall, 45% of males and 27% of females
participated in > 60 minutes of MVPA on five or more days in the previous seven.
The numbers decreased with increasing age (9th
grade – 39.7%, 10th
grade – 39.3%,
11th
grade – 36%, 12th
grade – 31%). Again, this was prevalent among males and
females. The survey showed that 23% of students did not participate in > 60 minutes
of MVPA at least one day during the previous seven days. Overall, 29% of females
20
and 17% of males did not participate in at > 60 minutes of MVPA at least one day in
the previous seven days. The numbers here increase, as the students get older (9th
grade – 21%, 12th
grade – 25%). Once again, this is prevalent among males and
females.
The ‘Children and Young People – the Importance of Physical Activity’ paper,
published in the context of the European Heart Health Initiative, carried out a review
of PA surveys of young people (aged 11-15 years) across Europe (European Heart
Network, 2001). The review recognised that males were more active than females in
all countries and in the majority of countries, PA levels decreased with increasing age.
Findings from the 2009/2010 HBSC Europe survey showed that 23% of 11 year olds
met the guidelines of > 60 minutes MVPA daily (WHO, 2010), while only 15 % of 15
year olds met the guidelines (Currie et al., 2012). A decrease of PA in males and
females occurred with increasing age and the decrease was more pronounced in
females than in males.
The National Diet and Nutrition survey (Department of Health, England, 2000) of
young people (N=2,672, aged 7-18 years) found that males (61%) and females (42%)
were achieving the recommendation of > 60 minutes moderate intensity PA daily.
These proportions declined with increasing age. More recently, a ‘Health Survey for
England’ (2008) used self-report and objective methods of PA measurement in
children and adolescents. The self-report results showed that only 32% of males and
24% of females (N=7521, aged 2-15 years) were meeting the Chief Medical Officer’s
(CMO, 2004) recommendation of > 60 minutes of moderate PA daily. The
percentage of males (aged 12 years) meeting the recommended levels was 29%,
decreasing to 27% at 13 years of age, 32% at 14 years of age and the same percentage
again at 15 years of age. Females showed a more consistent pattern with age in
relation to meeting the recommendations. The percentages went from 20% of 13 year
olds to 12% of 14 year olds to 15% of 15 year olds. Objective measuring of PA was
used with a sub-sample of participants (n=1707, aged 4-15 years) by way of
accelerometers. The accelerometer data showed that a higher proportion of boys than
girls were meeting the recommendations (33% and 21% respectively).
21
In Scotland, the ‘Scottish Health Survey, 2009’ (Ormstan et al., 2010) interview based
survey was carried out in households (N=9,000+) across the country. In total,
N=2,607 children (aged 2-15 years) participated in the survey. The survey found that
overall, males (75%) and females (68%) met the recommended amount of > 60
minutes of moderate PA daily (Scottish Executive, 2003). Males showed a decrease
in the numbers meeting the PA recommendations with age. Eighty percent of males
(aged 5-12 years) met the recommended amount of PA, dropping to 70% of males
(aged 13-15 years). Females meeting the recommended amount of > 60 minutes
moderate PA daily dropped significantly, from 79% (aged 8-10 years), 67% (aged 11-
12 years) down to 41% (aged 13-15 years). The survey shows adolescent males being
more physically active than adolescent females, and highlighted the drop in PA with
increasing age (male and female). Both these surveys from England and Scotland
were using the United Kingdom PA recommendations at that time (> 60 minutes
moderate PA daily), as opposed to the current recommendation of > 60 minutes
MVPA daily. This may be a reason behind the relatively high percentages of students
meeting the guidelines at that time. Inchely and colleagues (2011) examined Scottish
adolescents’ physical self-perceptions and their association with PA using a
longitudinal perspective. A total of N=641 Scottish adolescents (aged 11-15 years)
across 4 school years (2002-2006) completed self-report questionnaires. The results
of the study showed that males were consistently more active than females in each
year and there was a significant decrease in the proportion of active males and
females over time.
From an Irish perspective, the ‘Take Part’ study (Woods et al., 2004), which surveyed
N=939 students (60% female/40% male) from the East Coast Area Health Board
region of Ireland showed low levels of PA among young people (aged 15-17 years).
The study found that 35% of students were meeting the recommended > 60 minutes
of MVPA 4 or more days per week (the recommended amount of PA for this age
group at that time). For males, 42% met the recommended levels, while for females,
only 30% met the recommended levels of PA. The study also reported that 15 and 16
year olds were more likely to meet the PA recommendations than the 17 year olds,
indicating a decrease in PA with age.
22
The ‘Health Behaviours of school aged children’ study (HBSC, Ireland, 2006) found
that over half of primary school age children (aged 4-12 years) in Ireland did not
achieve the recommended level of > 60 minutes MVPA daily (Nic Gabhainn et al.,
2007). The study reported that 27% of participants (aged 10-17 years) were engaged
in > 60 minutes MVPA daily over the last 7 days. The study found that by 15 years
of age, almost nine out of ten females and seven out of ten males did not achieve the
recommended level. A drop in PA levels with increasing age was highlighted. The
young people who achieved > 60 minutes MVPA 4 or more times per week ranged
from 64% (aged 10-11 years), to 59% (aged 12-14 years) down to just 42% (aged 15-
17 years). The decline in PA levels with increasing age was apparent among both
genders, but it was particularly noticeable among females. The decrease among
females who were active 4 or more times per week went from 58% (aged 10-11 years)
through 51% (aged 12-14 years) to 28% (aged 15-17 years). The more recent HBSC,
Ireland (2010) study found there has been little change in PA levels of children and
adolescents since 2006 (Nic Gabhainn et al., 2012). A total of N=16,060 participants
(aged 10-17 years) completed self-report questionnaires from around Ireland.
Overall, 25% of participants were engaged in > 60 minutes MVPA daily over the last
7 days, while 51% were engaged in vigorous exercise > 4 times per week compared to
53% in 2006. The children and adolescents who achieved 60 minutes per day MVPA
> 4 times per week ranged from 62% (aged 10-11 years), to 54% (aged 12-14 years)
to 41% (aged 15-17 years). Again, this shows that the levels of PA among Irish
children and adolescence have remained stable since 2006. The study also found that
males were more active than females and PA levels decreased with increasing age.
Older adolescents and those from a lower social class were more likely to report less
participation in MVPA weekly than younger children and adolescents and those from
other social class groups.
The ‘Children’s Sport Participation and Physical Activity’ study (CSPPA) presents
information on PA and children and adolescents in the Republic of Ireland (Woods et
al., 2010). A total of N=5397 children from primary (N=53) and post-primary
(N=70) schools were surveyed as part of this study. The participants completed self-
report questionnaires and a small, sub-sample of participants (n=293) wore an activity
monitor (accelerometer/pedometer) over a period of 7 days. Of the overall total of
participants, N=4122 were post-primary students, ranging in school years from 1st to
23
6th
(aged 12-18 years). The study found that only 12% of post primary students met
the Department of Health and Children (2009) PA recommendations (> 60 minutes
MVPA daily). On average, participants (aged 10-18 years) achieved the PA
recommendations on 4.0 days per week. For males, the number of students who met
the current PA recommendations ranged from 27% (aged 10-12 years), 24% (aged 12-
13 years), through 16% (aged 14-15 years) to 7% (aged 16-18 years). The number of
females who met the current PA recommendations ranged from 13% (aged 10-12
years), 13% (aged 12-13 years) 8% (aged 14-15 years) to 6% (aged 16-18 years). For
both genders, the proportion of students meeting the PA guidelines decreased with
age and females were found to be less physically active than males. Again, this trend
is in keeping with the previously mentioned trends for young people in the US and
across Europe.
Summary of section 2.5
The review of the literature on the prevalence of PA in youth shows that adolescents’
are not active enough. The recommended amount of > 60 minutes MVPA daily
(DOHC, 2009; WHO, 2010) is not being met by large numbers of adolescents. The
high percentage of Scottish adolescent males (70%, aged 13-15 years) meeting
National guidelines is positive (Ormstan et al., 2010). This could, however, be due to
the PA recommendation in Scotland for children and adolescents of > 60 minutes of
moderate PA daily, as opposed to the WHO (2010) recommendation of > 60 minutes
of MVPA daily. It may also be highlighting the limitation of self-report as a valid
measurement of PA in adolescents on its own. There also appears to be a consensus
that PA levels decrease with age in adolescence and that males consistently report to
be more active than females. Studies from Ireland show that Irish adolescents
conform to these worldwide trends regarding PA levels and youth. The difference in
participation levels of adolescents across studies highlights the need for a more
accurate and clear definition of PA and how active adolescents should be on a daily
basis.
The majority of studies reviewed have collected data on young people’s PA levels
through self-report questionnaires. The use of motion sensors to track the actual PA
levels of young people is limited. The combination of self-report and motion sensor
measurement are recommended (Chad et al., 2009; Morgan et al., 2008; Twisk.,
24
2001). Much of the research into youth PA levels is through cross-sectional studies,
restricted by a one-off questionnaire at a particular time of the year. This could
produce miss-leading information from young people, as their PA levels in May, for
example, could possibly be very different to their PA levels in December. This
current study takes a longitudinal approach, with questionnaires and motion sensor
assessment (pedometers) taking place three times in a single school year (autumn,
winter and summer) to give an accurate picture of PA levels during the different
seasons of the school year.
2.6 Correlates of Physical Activity in Adolescents
In order to get more young people physically active on a regular basis, we need to
identify and understand the correlates of PA for young people. The correlates of PA
for young people are the key factors relating to whether they take part in PA or
dropout. In keeping with previous reviews from adult correlates, Sallis and
colleagues (2000) included the following as the five main categories of determinants
of PA for children and adolescents i.) demographic and biological factors, ii.)
behavioural factors, iii.) psychological factors, iv.) social environment factors v.)
physical environment factors. These correlates of PA for youth have been given
much attention by researchers, as they categorise a multitude of different correlates.
Three comprehensive reviews that are focused on here are from Sallis and colleagues
(2000) Review of Correlates of Physical Activity for Children and Adolescents; Biddle
and colleagues (2005) Correlates of participation in PE for Adolescent girls: A
Systematic Review and Van Der Horst and colleagues (2007) A Brief Review on
Correlates of Physical Activity and Sedentariness in Youth. Both the Van Der Horst
and colleagues review (2007) and the Biddle and colleagues review (2005) elaborate
on the Sallis and colleagues (2000) review, using the same correlate categories.
The following are the make-up of the studies that were reviewed.
Sallis and colleagues (2000) reviewed fifty-four studies of potential correlates of PA
among adolescent youth (aged 13-18 years) that covered a period of nearly thirty
years from 1970-1998. Sample sizes ranged from 51 to 7302 with a mean of 1286
(SD=1645). Overall, 1-28 variables were evaluated, 83% of studies had a cross-
sectional design, 68% of studies were carried out in the US. In terms of measures,
69% used unvalidated self-reports, 28% were empirically supported self-reports and
25
4% were objective measures PA. Biddle and colleagues (2005) reviewed papers
(N=50) published between 1999 and 2003, with a specific focus on adolescent
females (aged 10-18 years). Sample sizes ranged from 48-17,776 with a mean of
2448. In total, 1-21 variables were evaluated. Eighty percent of studies had a cross-
sectional design, and 20% were longitudinal or prospective. Sixty-four percent were
carried out in the US. In terms of PA measurement, 18% were unvalidated self-
reports, while 61% were validated self-reports. Eight percent were acceptable
objective measures and 8% were unvalidated, self-reports and objective measures.
Six percent were validated self-reports and objective measures. Van Der Horst and
colleagues (2007) reviewed papers (N=43) published between 1999 and 2005 with a
more concentrated focus on correlates of PA and sedentariness in adolescents’ (aged
13-18 years). The sample sizes were unspecified and 1-23 variables were evaluated.
Seven percent were prospective studies and 9% used objective measures.
Table 1 provides a summary of the three reviews and compares the correlates
associated with PA in adolescents’ found in each review. The correlates will be
categorised under the following variables:
i. Demographic and Biological factors
ii. Behavioural factors
iii. Psychological factors
iv. Social Environment factors
v. Physical Environment factors
Demographic and Biological factors
All three reviews identified a consensus that increasing age and female gender are
negatively associated with PA during adolescence. These findings are consistent with
much research and Government publications worldwide on the prevalence of PA in
young people (European Heart Network, 2001; Twisk et al., 2001; Woods et al.,
2004; Fahey et al., 2005; Nic Gabhainn et al., 2007; Eaton et al., 2009; Ormstan et
al., 2009; Woods et al., 2010). There was no association found between ethnicity
(Caucasian) and PA in adolescence in the Van Der Horst et al. (2007) review,
however, it was positively associated in the Sallis et al. (2000) and Biddle et al.
(2005) reviews. Biddle and colleagues reported a negative association for BMI

26
(skinfolds) and female adolescent PA, yet no association for this was found in the
Sallis and colleagues (2000) or the Van Der Horst and colleagues (2007) reviews. A
positive association was reported for family income in the review by Biddle et al.
(2005), however, both the other two reviews reported no association. The Biddle and
colleagues (2005) and Van Der Horst and colleagues (2007) reviews both found a
positive association for higher parental education and PA in adolescence. This
particular correlate was not included in the Sallis and colleagues (2000) review
Behavioural factors
The behavioural correlates linked to PA in youth were different across the three
reviews. Sallis and colleagues (2000) and Biddle and colleagues (2005) both made
reference to a positive association between community sport and PA. In terms of
school sport, Van Der Horst and colleagues (2007) found evidence of a positive
association, Sallis and colleagues (2000) found no association, while school sport was
not included in the Biddle and colleagues (2005) review. Smoking was found to be
negatively associated with PA in the Biddle and colleagues review, not included in the
Sallis and colleagues (2000) review and no association was found in the Van Der
Horst and colleagues (2007) review. The relationship between TV/sedentary time and
PA was found to be negatively associated with PA in the Sallis and colleagues (2000)
review, inconclusive in the Biddle and colleagues (2005) review and no association
was found in the Van Der Horst and colleagues (2007) review. Active commuting
was not included in any of the three reviews, which is a limitation of all three reviews,
considering the opportunity for PA minutes that can be accrued by an active commute
to and from school.
Psychological Factors
The association of psychological factors to PA in youth were inconsistent between the
reviews. A positive association between perceived competence and PA was reported
from the both the Sallis and colleagues (2000) review and the Biddle and colleagues
(2005) review. No association was reported for perceived competence from the Van
Der Horst and colleagues (2007) review. Self-efficacy was found to be positively
associated with PA in the Biddle and colleagues (2005) and the Van Der Horst and
colleagues (2007) reviews, while it was inconclusive in the Sallis and colleagues
(2000) review. No association was reported between PA enjoyment in two of the
27
reviews (Sallis et al., 2000; Van Der Horst et al., 2007), however, it was positively
associated with PA in the Biddle and colleagues (2005) review focussing on female
adolescents. Perceived barriers and their association with PA also varied across the
reviews. Biddle and colleagues (2005) reported that perceived barriers had a negative
association with PA. The specific barriers included a ‘lack of time’, ‘lack of interest’
and ‘too much effort required’. Sallis and colleagues (2000) found no association
between perceived barriers and PA, while Van Der Horst and colleagues (2007) found
the association between perceived barriers and PA to be inconclusive.
Social Factors
The social environment category was consistent across all three reviews. Family
support was shown to be positively associated with PA in all three reviews
highlighting the important role of parents and siblings in getting and keeping young
people active. In terms of parental PA, two of the studies (Sallis et al., 2000; Van Der
Horst et al., 2007) showed no association with adolescent PA, however, Biddle and
colleagues (2005) findings for female adolescents’ were slightly different. They
found no association from the PA levels of the mother, but the father’s PA levels had
a positive association with PA. Both the Sallis and colleagues (2000) review and the
Van Der Horst and colleagues (2007) review identified a positive association between
peer involvement and support, and adolescent PA. Biddle and colleagues (2005)
found the association between peer involvement and support, and females to be
inconclusive. Teacher support was not included in any of the three reviews, which is
a limitation and underestimates the potential of teachers (particularly PE teachers) to
have an influence on adolescent PA participation. It is also a gap in our research
knowledge.
Physical Environment Factors
The only physical environment variable included in two of the reviews (Sallis et al.,
2000; Van Der Horst et al., 2007) was access to facilities/services. Both, however,
found no association between access to facilities/services and adolescent PA. Biddle
and colleagues (2005) review did not include any physical environment variables and
they highlighted the need for a more extensive investigation into the role of
environmental factors in terms of adolescent female PA.
28
In summarising the three reviews, the first aspect of note is the range of correlates
associated with adolescent PA, which is extensive. It is also clear that there are a lot
of differences between the reviews. These differences are in the form of
measurement, sampling sizes, variables identified, gender etc. This has led to many
inconsistencies in terms of identifying correlates of adolescent PA participation.
Given the findings from the Biddle and colleagues (2005) review, which focussed on
adolescent females only, there is a strong case for more gender specific investigations
to identify the differences in correlates of PA between male and female adolescents.
This could be crucial for identifying the main factors associated with getting
adolescent males and/or females active on a regular basis, as no clear picture is
currently available.
This current study focuses on male adolescents only. The demographic factors of the
students were dealt with on the first page of the physical activity questionnaire (PA-
Q). This study did not investigate physical environment factors, however, it was
known that ECPA was offered in each of the four school involved. The main targets
of the study were on psychological, behavioural and social factors associated with
ECPA participation. Under psychological factors, the main emphasis was on
perceived physical competence, physical self-worth and enjoyment of PA. The focus
from the behavioural factors was participation levels in ECPA. From the social
factors, the influence of parents and peers was investigated in terms of ECPA
participation levels. The inconsistencies of the reviews in this section highlight the
need for more research in the identification of correlates to adolescent PA
participation.
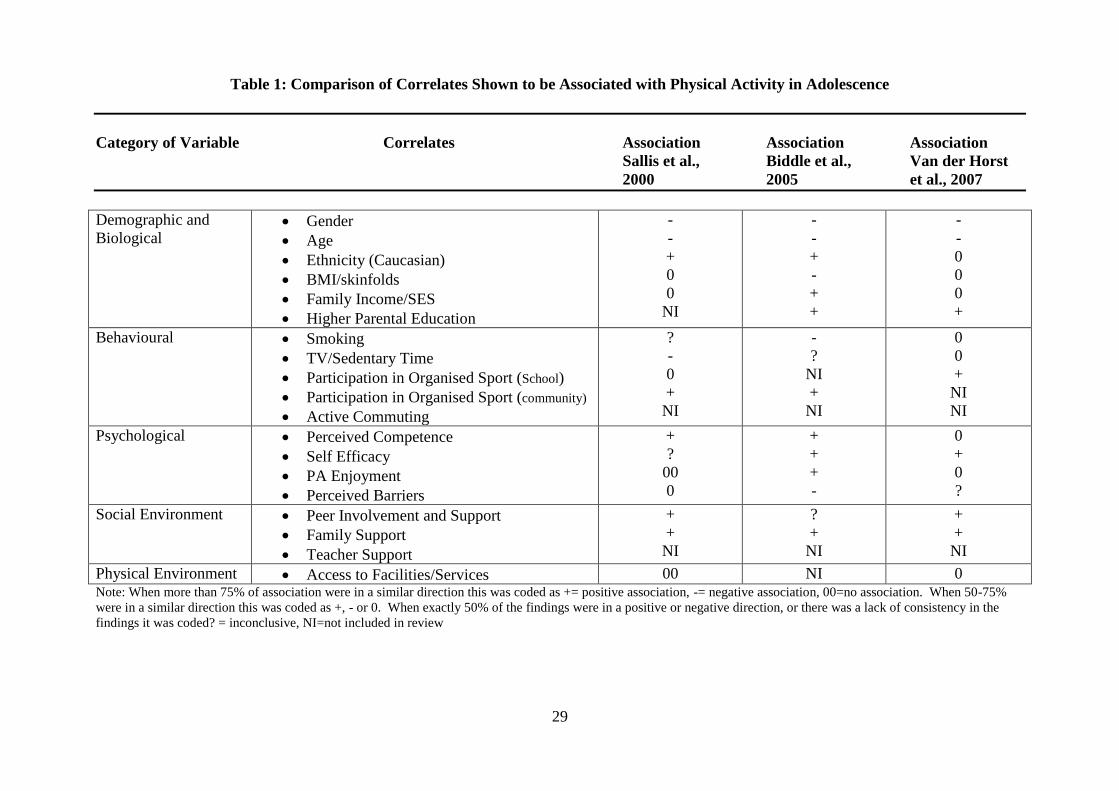
29
Table 1: Comparison of Correlates Shown to be Associated with Physical Activity in Adolescence
Category of Variable Correlates Association Association Association
Sallis et al., Biddle et al., Van der Horst
2000 2005 et al., 2007
Demographic and
Biological
Gender
Age
Ethnicity (Caucasian)
BMI/skinfolds
Family Income/SES
Higher Parental Education
-
-
+
0
0
NI
-
-
+
-
+
+
-
-
0
0
0
+
Behavioural Smoking
TV/Sedentary Time
Participation in Organised Sport (School)
Participation in Organised Sport (community)
Active Commuting
?
-
0
+
NI
-
?
NI
+
NI
0
0
+
NI
NI
Psychological Perceived Competence
Self Efficacy
PA Enjoyment
Perceived Barriers
+
?
00
0
+
+
+
-
0
+
0
?
Social Environment Peer Involvement and Support
Family Support
Teacher Support
+
+
NI
?
+
NI
+
+
NI
Physical Environment Access to Facilities/Services 00 NI 0 Note: When more than 75% of association were in a similar direction this was coded as += positive association, -= negative association, 00=no association. When 50-75%
were in a similar direction this was coded as +, - or 0. When exactly 50% of the findings were in a positive or negative direction, or there was a lack of consistency in the
findings it was coded? = inconclusive, NI=not included in review
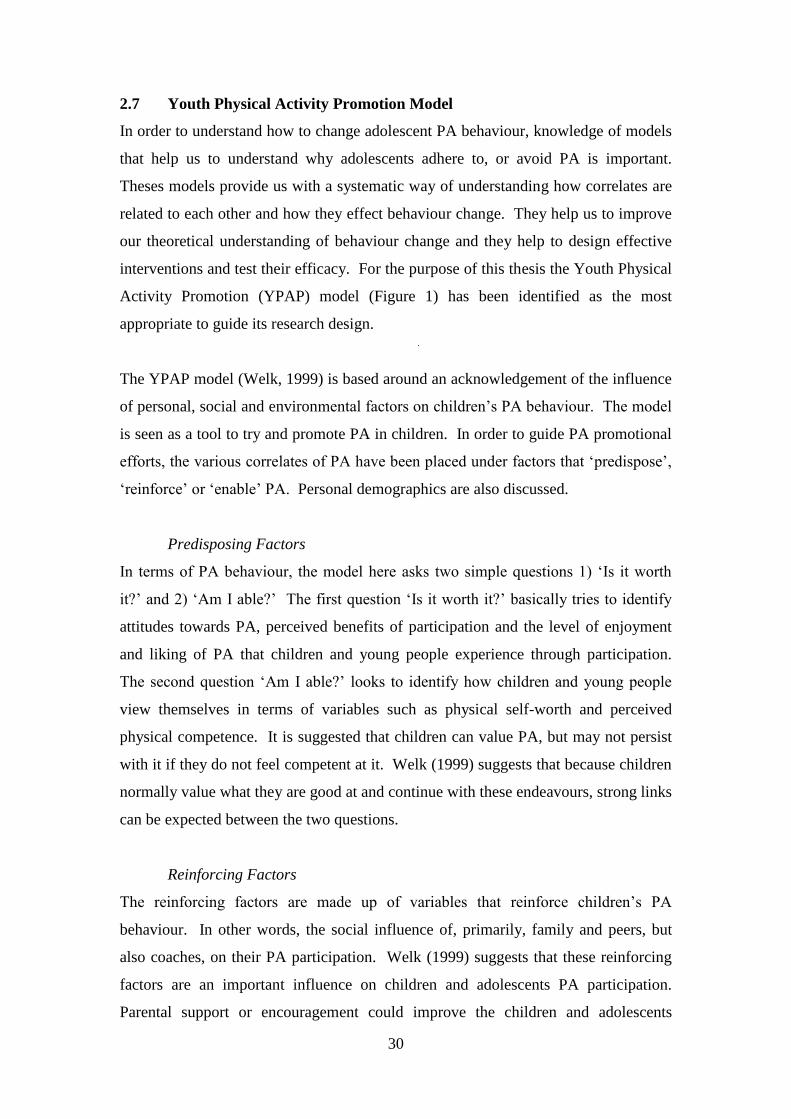
30
2.7 Youth Physical Activity Promotion Model
In order to understand how to change adolescent PA behaviour, knowledge of models
that help us to understand why adolescents adhere to, or avoid PA is important.
Theses models provide us with a systematic way of understanding how correlates are
related to each other and how they effect behaviour change. They help us to improve
our theoretical understanding of behaviour change and they help to design effective
interventions and test their efficacy. For the purpose of this thesis the Youth Physical
Activity Promotion (YPAP) model (Figure 1) has been identified as the most
appropriate to guide its research design.
The YPAP model (Welk, 1999) is based around an acknowledgement of the influence
of personal, social and environmental factors on children’s PA behaviour. The model
is seen as a tool to try and promote PA in children. In order to guide PA promotional
efforts, the various correlates of PA have been placed under factors that ‘predispose’,
‘reinforce’ or ‘enable’ PA. Personal demographics are also discussed.
Predisposing Factors
In terms of PA behaviour, the model here asks two simple questions 1) ‘Is it worth
it?’ and 2) ‘Am I able?’ The first question ‘Is it worth it?’ basically tries to identify
attitudes towards PA, perceived benefits of participation and the level of enjoyment
and liking of PA that children and young people experience through participation.
The second question ‘Am I able?’ looks to identify how children and young people
view themselves in terms of variables such as physical self-worth and perceived
physical competence. It is suggested that children can value PA, but may not persist
with it if they do not feel competent at it. Welk (1999) suggests that because children
normally value what they are good at and continue with these endeavours, strong links
can be expected between the two questions.
Reinforcing Factors
The reinforcing factors are made up of variables that reinforce children’s PA
behaviour. In other words, the social influence of, primarily, family and peers, but
also coaches, on their PA participation. Welk (1999) suggests that these reinforcing
factors are an important influence on children and adolescents PA participation.
Parental support or encouragement could improve the children and adolescents
31
perception of competence. This could lead to increased levels of PA participation.
However, a lack of parental support could decrease PA participation levels. Welk
(1999) also makes reference to a change in children and adolescent’s source of
influence, as they get older suggesting that peers become more of an important source
of influence than parents. To a lesser extent, coaches and PE teachers could be
playing or could play a major part in influencing PA behaviour in children and
adolescents, yet this is an area that is under researched.
Enabling Factors
The enabling factors consider conditions or personal attributes that can allow or have
an impact on participation in PA e.g. fitness levels, skills, access and the environment.
The model suggests that children and adolescents who are fit and have the necessary
skills are more likely to participate in PA and continue with it than those with poor
levels of fitness and skills. Access to areas that allow PA are also possible
determinants of PA as children and adolescents can only participate if there is an
opportunity to do so, however, even though the opportunity may be there,
participation is not guaranteed. The weather is also noted as having an influence on
PA participation. In this present study, the enabling factors were measured in section
one and two of the questionnaire by way of PA levels and ECPA participation levels.
A limitation of the study is that the physical environment beyond the school was not
measured, however, the study did control for ECPA by ensuring that it was offered in
all schools involved.
Personal Demographics
Personal demographics look at the possible influence of variables such as age, gender,
ethnicity/culture and socio-economic status on PA behaviour in children and
adolescents. The participants of this present study were male (aged 12-15 years) and
all from disadvantaged backgrounds.
Overall, the model suggests that children and adolescents who respond positively to
the questions ‘Am I able?’ and ‘Is it worth it?’ and receive positive reinforcement are
more likely to participate in PA on a more regular basis than those who answer both
questions negatively and receive negative or no reinforcement from significant others
e.g. parents and peers. In the present study, the YPAP model has been used to

32
identify any possible improvement to psychological well-being of adolescent males
from participation in ECPA. The main area targeted is the predisposing factors. The
question of ‘am I able?’ is linked with perceived physical competence and physical
self-worth. The ‘is it worth it?’ question is linked with any enjoyment adolescents
may receive from participation in ECPA. These are the main areas of psychological
well-being to be targeted in this study to find out how they affect PA behaviour in
adolescent males (aged 12-15 years).
Fitness
Family influence
Skills Peer influence
Access Coach influence
Environment
Perceptions of Enjoyment
Competence Beliefs
Self-Efficacy Attitudes
Age
Gender
Ethnicity/Culture
Socio-economic Status
Fig 1. Youth Physical Activity Promotion Model (YPAP, Welk, 1999).
Physical Activity
(Extra-Curricular Physical
Activity)
Enabling Predisposing
Reinforcing
Am I able? Is it worth it?
Personal demographics

33
2.8 Measurement of Physical Activity Levels in Adolescents
The recognition of the importance of PA for optimal health has led to an increased
interest in accurately assessing PA behaviour (US Department of Health and Human
Services, 1996). Monitoring the PA levels of youth in order to gather accurate and
reliable information is problematic (Tudor-Locke et al., 2004). According to Sallis
and colleagues (1993), there is no single PA measure that is fit for all purposes. Cale
and Harris (2005) suggest that accurate assessment of PA levels in youth is important
for several reasons including establishing current levels of PA and compliance with
PA recommendations. Detail is given below of the most popular methods for
measuring the PA levels of young people in free-living environments. Numerous
methods of measuring PA for children and adolescents exist. These include objective
(e.g. motion sensors) and subjective (e.g. self-report) methods.
Accelerometers
Accelerometers are electronic devices that can measure accelerations produced by
body movement (Cale and Harris, 2005). The small instruments are usually worn on
a belt at the waist and they can record PA levels reflecting the intensity of movement
(Smith and Biddle, 2008). They use piezo-electric transducers and microprocessers to
convert body accelerations to a quantifiable digital signal referred to as counts. The
advantages of the accelerometer are that they provide an objective, non-reactive,
relatively unobtrusive and reusable tool for assessing PA (Siriad and Pate, 2001).
They are also relatively easy to use, information can be stored over a number of days
and data collected by the accelerometer can be downloaded to a computer for analysis
(Baumgartner et al., 2007). According to Welk (2002), they are one of the most
popular techniques in assessing levels of PA. This has been shown by the use of
accelerometers in providing objective measures of compliance with PA
recommendations in the US in recent years (Heyward, 2010). The limitations to
accelerometer use is the inability to detect upper-body movement when worn at the
hip, when walking on an incline, water based activity and the high cost (Welk, 2002).
They can also be misplaced or forgotten about if data collection covers a few days or
more.
34
Pedometers
Pedometers are small, battery-powered mechanical devices that are used to count and
monitor the number of steps taken by an individual (Heyward, 2010; Smith and
Biddle, 2008). Pedometers are typically attached to a belt around the waist. The
advantages of pedometers are that they are small, inexpensive, unobtrusive, objective
and re-usable (Sirad and Pate, 2001; Cooper, 2003). This makes them a useful
monitoring device when measuring PA levels in children and youth. However,
pedometers have a number of disadvantages. According to Baumgartner and
colleagues (2007), pedometers are insensitive to static forms of PA such as
weightlifting, they are not waterproof, thus making them more liable to be destroyed
and that they have to be removed for any water based PA. Pedometers may be
removed from the waist and shaken to increase the steps recorded or jumping up and
down may increase PA. Pedometers with a reset button available could invalidate
results if pressed by an adolescent. Pedometers, like accelerometers, are also easily
misplaced or forgotten about if data collection covers a few days or more. For the
current study, pedometers were chosen as the most appropriate motion sensor to
measure students’ PA levels, due to their cost-effectiveness with a large number of
participants, ease of use and their relative accuracy.
In order to achieve PA health benefits, Tudor-Locke et al. (2004) established that the
average age and sex specific pedometer cut points should be 12,000 steps/day for
females and 15,000 steps/day for males. These cut-offs were established using a
contrasting groups method to establish criterion-referenced standards based on body
mass index (BMI) categories from 2000 boys and girls from the USA, Australia and
Sweden. The cut-off points were seen as optimal for separating normal-weight and
overweight/obese students (aged 6-12 years), with students averaging fewer steps than
the cut-off points per day more likely to be overweight/obese.
In Canada, children and youth (N=11,669, aged 5-19 years) were recruited from
across the country to establish average daily step counts for the Canadian Physical
Activity Levels among Youth (CANPLAY) survey (Craig et al., 2010). Participants
were asked to wear a pedometer of 7 consecutive days and to log daily steps. Results
showed that, on average, males took 12,259 steps daily and females took 10,906 steps
daily. These figures are well below the recommended 16,500 steps daily for children
35
and youth (Canada’s PA Guide, 2009). The survey found that overall, males were
more active than females, PA levels decreased with increasing age and average
weekday step counts were higher than weekend day step counts.
An Irish study by Belton and colleagues (2010) investigated the number of students
(N= 301, 51% male, aged 6-9 years) meeting the Tudor-Locke et al. (2004) daily step
count recommendations for this age group, and explored any relationships between
step count and self-reported PA patterns during and after school. PA was assessed
using the Yamax SW200 pedometer worn over a period of 7 days. In addition to this,
participants completed a self-report questionnaire ‘Attitudes Towards PA’ (adapted
from Pieron et al., 1996). Results showed that the majority (69%) of the participants
achieved the recommended cut-off points. Children who took part in PA immediately
after school had a significantly higher step count in the weekday (p=0.029) and after
school (p=0.015) periods, but not in the overall average step count. In addition to
this, children were found to be more active on weekends than on weekdays. The
results are positive in terms of the amount of children meeting the daily step count
recommendations (69%), however, it highlights the need to promote further
opportunities for primary school children to be physically active in the school day e.g.
through more PE or active commuting. At post-primary school, ECPA provides an
extra opportunity for students to be physically active and raise daily step count levels.
Objective measures of PA in adolescents are becoming more and more frequent in
research. Pedometers offer a practical method of assessing PA levels in youth and
provide a simple way of tracking daily PA given as a summary output of steps per day
(Tudor-Locke et al., 2008). According to Trost (2007) pedometers are now a viable
alternative to accelerometers as they are cheaper and more cost-effective for large-
scale studies. Pedometers provide valuable feedback about steps taken and they have
emerged as self-monitoring tools to promote PA in youth (Lubans et al., 2009). For
these reasons, pedometers were chosen as the motion sensor of use for this current
research.
Self-Report
Self-report instruments are a useful way of identifying activity patterns in large
groups of people (Welk et al., 2000) and are the most widely used and practical
36
method for collecting information regarding PA in youth (Smith and Biddle, 2008).
According to Mathews (2002), self-reporting PA instruments are an invaluable tool
when in PA research due to their simplicity, flexibility, validity and minimal expense.
One of the main advantages of the self-report method of monitoring PA is the
flexibility of a questionnaire. Welk and Wood (2000) suggest that existing
questionnaires can be adapted and alternative questionnaires can be devised using
existing ones as a guide. This flexibility makes the self-report instrument a popular
choice in PA research. Baumgartner and colleagues (2007) suggest that if participants
can be relied upon to give honest responses to questions on a questionnaire, that it is a
relatively inexpensive method of collecting data on a large scale over a short period of
time.
Smith and Biddle (2008) state that self-report instruments fall into two main
categories: recall-based measures and general measures. Recall-based measures look
to gain information regarding young persons PA on a specific day or number of days,
while general measures focus on specific PA behaviour. This study combines
objective and subjective methods of PA measurement. Objectively we measure PA
via pedometer step count. Subjectively, both recall (list questionnaire) and general
(list questionnaire) measures are used. These will be discussed in more detail in the
methodology. The limitations of using self-report techniques to assess PA are well
known. These limitations may include misunderstanding the questions, difficulty in
recalling the time or intensity of PA or possibly giving the wrong information
deliberately (Welk et al., 2002).
2.9 Pillars of Adolescent Physical Activity
According to the School Children and Sport in Ireland report (Fahey et al., 2005)
organised sport in Ireland rests on three main pillars:
i.) Physical Education
ii.) Extra-Curricular Physical Activity (played in school)
iii.) Sports clubs and physical activity outside of school
Fahey and colleagues suggest that these three pillars are providing the majority of
physical activities for Irish children and adolescents. Woods and colleagues (2010)
37
referred to active travel to and from school as another opportunity for adolescents’ to
be physically active. This literature review will highlight the importance of active
travel to and from school as another pillar of PA in youth:
iv.) Active travel to and from school
i. Physical Education (PE)
“The PE curriculum has a key role to play in providing appropriate physical activity
opportunities, information and guidance to young people, and in encouraging and
empowering young people to make informed lifestyle choices” (Cale and Harris,
2005:166).
Liukkonen (2007) suggests that PE has the potential to influence many young people
in schools and those students who receive positive experiences and enjoyment from
PE can develop a strong foundation for the practice of lifelong exercise activity. PE
in schools is seen as an important way of encouraging young people to be physically
active, which can promote their health and well-being (Cale, 2000; Blanksby &
Whipp, 2004). According to Biddle and colleagues (1998) important aims of PE are
to i) promote the adoption of a physically active lifestyle that persists throughout
adulthood and ii) to provide situations where young people are required to interact
with each other, thus producing a rich environment for social development. The value
of PE in schools is recognised by a number of researchers who have argued that it is
the best opportunity to address the health-related needs of virtually all children and
youth (Fairclough 2003; Fairlcough and Stratton, 2006; Sallis and McKenzie, 1991;
Shephard and Trudeau, 2000).
According to Luikkonen and colleagues (2007) curriculum goals for PE are designed
to have an effect on personality and social functioning and look to promote the
development of positive self-perceptions and social skills. In their survey of fifty-two
countries around the world, Bailey and Dismore (2006) found that the promotion of
lifelong PA was a universal aim of PE, highlighting PE as an important vehicle in
getting children and adolescents active. The PE syllabus in Ireland suggests that
participation in PE should promote recognition of individual capacities, a positive
38
attitude towards participation and an appreciation of the benefits of interaction with
others (Department of Education and Science, 2003).
Time Allocated to PE in Schools
The ‘Children and Young People – the Importance of Physical Activity’ document,
emphasised how PE is such a hugely important area in terms of young people being
physically active (European Heart Network, 2001). The paper suggested that
provision of PE has declined in many schools across Europe and indicated that much
more should be done in order to enhance PE by way of more time being allocated to it
and improvements in provision. This same paper also recommended that the time
devoted to PE in the school curriculum be increased to three hours per week for all
age groups. For countries with no existing statutory minimum time for PE, an initial
aim should be for a statutory two-hour minimum per week (European Heart Network,
2001).
A study published by the European Parliament entitled, ‘Current Situation and
Prospects for PE in the European Union’, stated that the average time allocated to PE
in schools across the European Union is 109 minutes. The study also found that
students (aged 9-14 years) were allocated the most amount of PE in schools and
overall, time allocation of PE decreased with increasing age of the students (Hardman
et al., 2007). The PE and Sport Survey (2009/2010) looked at levels of participation
by students in PE in schools (N=21,436) across England (Department for Children,
Schools and Families, 2010). The survey found that students in the years 1-13 spent
an average of 117 minutes in a typical week on curriculum PE. The survey also found
a big difference in the amount of time students participated in PE as they progressed
through post-primary school. In school years 7-9 (aged 12-14 years), the amount of
students who participated in at least 120 minutes of PE was 87%. For years 10-11
(aged 15 –16 years), the number decreased to 64% and for years 12-13 (aged 17-19
years), only 23% of students were participating in the recommended 120 minutes at
least of PE each week in school. These statistics show a major decrease in PE
participation levels of adolescent students with increasing age.
In Ireland, the recommendation is that all post-primary students should have at least
two hours of PE per week (Department of Education and Science, 2003). This,
39
however, has been highlighted as not being the case in a large number of second-level
schools in Ireland. Generally, the contribution of PE to the development of children
and young people is recognised; however, sport and PE can be looked upon as the
poor relation in the school curriculum in Ireland, where other subjects certainly take
precedence over it (MacPhail and Halbert, 2005). The ESRI report, School Children
and Sport in Ireland, revealed that second level students were receiving, on average,
69 minutes of PE per week and that participation levels decreased as students moved
up through the second-level school years (Fahey et al., 2005). The CSPPA study
(Woods et al., 2010), which was designed as a follow up to the School Children and
Sport in Ireland (Fahey et al., 2005) study, reported that only 10% of second-level
students were timetabled with the Department of Education and Skills recommended
minimum minutes (120) of PE per week in 2009. The report also found that, on
average, second level students received 77 minutes of PE weekly and that most of the
pupils were receiving double class periods.
The study indicated that senior cycle pupils received less PE time than junior cycle
pupils and that 5% of post-primary students received no timetabled PE in school at
all. The 5% were mainly made up of senior cycle students. The reported decrease in
PE participation as students get older is in line with the findings of Fahey and
colleagues (2005).
Content of PE in Schools
The Irish PE syllabus for second level schools is made up of seven core disciplines –
adventure activities, aquatics, athletics, dance, games, gymnastics and health related
activities (Department of Education and Science, 2003). Fahey and colleagues (2005)
report suggested a dominance of team sports delivered in PE lessons, and they
highlighted the gap between the multi-activity approach of the syllabus and the
narrow range of activities students actually did. The most common physical activities
in PE lessons were soccer (74%), basketball (68%) and badminton (45%). For males,
soccer (83%), basketball (60%) and Gaelic football (50%) were the most common
physical activities undertaken in PE lessons, while, for females, basketball (77%),
soccer (65%), badminton and rounders (both 54%) were the most common. Overall, a
large majority of pupils reported no exposure in PE lessons to dance (86%),
swimming (86%) and gymnastics (81%).
40
The more recent CSPPA study (Woods et al., 2010) also found that games were the
dominant activity delivered in second-level schools’ PE lessons. The most common
physical activities in PE lessons were basketball (56%), soccer (54%) and rounders
(47%). For males, soccer, basketball and badminton were the most common physical
activities undertaken in PE lessons, while for females, basketball, rounders and
badminton were most common. Overall, other strands of the PE curriculum were
found to be largely ignored. A large majority of second-level pupils reported no
exposure to swimming (85%), no exposure to outdoor and adventurous activities
(76%) and no exposure to dance (76%) in PE lessons. Again, these findings are very
similar to the findings of Fahey and colleagues (2005), highlighting the dominance of
games activities within school PE programmes. A greater emphasis on individual
physical activities was recommended in the report to make PE more appealing to
females.
Attitude Towards PE in Schools
Pieron and colleagues (1997) published a paper on ‘Attitudes Towards School and
PE’. This European research project was focussed on young people (aged 12-15
years). A self-report questionnaire was completed by N=6,766 students (N=3142
males/3,624 females) across eight European countries. The study found that students
were more positive about PE than they were about school. Between 60% and 70% of
students reported to ‘like’ PE in school. In general, the younger students looked more
positively on PE in school than their older counterparts, which again, is in line with
the suggestion of PA levels decreasing with increasing age of young people. Pieron
and colleagues (1997) highlighted the more positive attitude towards PE than to
school and believed that it should be built upon in the future.
A study carried out by Wang and colleagues (2008) ‘Student’s Attitudes and
Perceived Purposes of Physical Education in Singapore’ looked at students’ attitudes
towards PE in four Singapore schools. In total, 493 second-level school students
(N=222 males, 262 females, 13-18 years) completed self-report questionnaires.
Generally, the findings of the study portrayed a positive picture of PE in Singapore.
The students reported a high level of enjoyment in PE. Enjoyment of PE was
analysed through an adaptation of the Intrinsic Motivation Inventory (McAuley et al.,
1989). The items were measured on a 5-point Likert scale ranging from 1 (strongly
41
disagree) to 5 (strongly agree). The mean score for enjoyment from the whole cohort
was positive at 3.58 out of 5. Students also reported a high intention to participate in
physical activity and a belief that PE has the potential to enhance social status. The
results also indicated that the students believed that the purpose of PE involved
showing them how to lead a fit and healthy lifestyle and to increase their self-esteem.
To establish self-esteem, among others, as a possible purpose of PE, an adapted
version of the Perceived Purposes of PE Questionnaire (McNeill and Wang, 2005;
Wang and Koh, 2006) was used. Responses from this part of the questionnaire were
made on a 5-point Likert scale (1 = strongly disagree to 5 = strongly agree). The
mean score for the self-esteem from the whole cohort of students was 3.33. This
strong relationship found between self-esteem and enjoyment of PE in this research
highlights the potential, positive psychological benefits to be gained from PE
participation for many young people.
The positive findings from the Wang and colleagues (2008) and Pieron and colleagues
(1997) studies, in terms of enjoyment of PE and improved self-esteem from PE
involvement, are in line with the psychological benefits to young people identified in
research with PA participation, which have been highlighted in this review. This
indicates an important link between PA and PE. Prochaska and colleagues (2003)
argued that enjoyable PE might increase student engagement, which in turn may
increase or maintain participation in PA outside of school. The link between PA and
PE has also been alluded to by Kirk (2005) who highlighted the importance of schools
and school PE in improving sustained participation in PA.
A report by the Women’s Sport and Fitness Foundation (WSFF, 2011) provided an
insight into the attitudes of primary and secondary school students in England
(N=1,500) to sport and PA. The report showed that 51% of all females are put off
sport and PA because of their experiences of school sport and PE. The least active of
the females surveyed were found to be very negative about PE. Forty-six percent of
the least active females surveyed suggested that they did not like the activities they do
in PE. Forty-five percent of females felt that PE was too competitive. The females
who were most active were very positive about PE and stated that they would like
more of it in school. Twenty-two percent of the most active females, however, also
stated that they did not like the activities in PE’. Over a quarter of females stated that
42
they did not feel they had the skills to do well in sport and the confidence levels were
found to be lower amongst those who were less physically active. Seventy-six
percent of females were found to be self-conscious about their bodies and 20% of
post-primary school females felt their body was on show in PE, making them like PE
less.
In Ireland, the ESRI study (Fahey et al., 2005) found that post-primary students,
generally, had a positive attitude towards PE and sport in school. When asked if they
‘enjoyed PE/sport in school’, 81% of students either ‘agreed strongly’ or ‘agreed
slightly’ with the statement. In terms of gender, males reported to be very positive
about PE and sport in school (66% strongly agree), while females were positive (47%
strongly agree). An area of difference was that males enjoyed the ‘pressure to win’ in
PE/sport (64%), while females were less keen under those circumstances (36%). A
major negative about participation that was highlighted was ‘being left out for not
being good enough’. One third of students either ‘minded this a lot/minded this a bit’.
When asked ‘are you good at sport?’, 14% of males and 30% of females reported that
they ‘disagreed slightly/strongly’ with this question. Overall, however, the general
attitude of students towards PE and sport in school was positive. School principals
were asked in the same study about their attitude towards the amount of PE and sport
undertaken by students in post-primary schools. Overall, 49% of principals felt that
in junior cycle, it was ‘too little’ while 50% felt that it was ‘about right’. In terms of
senior cycle, it was reported that 70% felt it was ‘too little’ while 29% thought the
amount was ‘about right’. A large majority of principals (71%) reported that they
believed sport was ‘very important to the ethos of their school’, while none thought it
to be ‘unimportant’.
The CSPPA study (Woods et al., 2010) also looked at what post-primary school
principals thought about the amount of PE and sport their pupils were undertaking in
school. The majority of principals (58%) believed that the amount junior cycle pupils
received was ‘about right’, while 59% felt that there was too little on offer in at senior
cycle level. Not one of the principals (N=59) reported that there was ‘too much PE on
offer at either junior or senior level’. In terms of facilities, 41% of principals felt that
their school sports facilities were ‘not at all adequate’. A majority (58%) indicated
that a major investment in sports facilities was needed in their school.
43
Summary of PE
This section of the literature review highlights the importance of PE as part of the
curriculum in second level schools. The time allocated to PE on the curriculum in
Ireland, however, is not meeting Government recommendations. The review also
highlighted the worrying trend of adolescents being allocated less PE as they increase
in age. This is a real concern as the review has already showed evidence of
adolescents’ PA levels, in general, decreasing with age, particularly in females.
There is a dearth of information as to why this decrease in PA is occurring,
particularly from an Irish perspective. The need to find out the reasons for a drop in
PA levels, from the students themselves, is vital to try and keep young people
physically active throughout adolescence. Focus group discussions need to be carried
out to get young people talking and to obtain a real sense of their attitude towards PE.
Studies have shown that the content of PE lessons in post-primary schools is
dominated by games and team sports. The emphasis on competition and team sports
in PE lessons may be a reason why females are less enthusiastic about PE in school
than males. Again, the amount of research into this particular area is limited,
particularly from an Irish perspective, and students need to be consulted at to what
activities they do or do not enjoy in PE and why. The present study has its emphasis
on ECPA in post-primary schools. Self-report questionnaires and focus groups
carried out on three separate occasions throughout the academic year track students’
participation in and their views on ECPA over time. The findings, however, may give
an indication as to student views on PE in school and their involvement or otherwise
in it and how attitudes may change with increasing age from first to third year.
ii. Extra-Curricular Physical Activity (ECPA)
ECPAs are designed to further the curriculum of schools and PE teachers have a
central role in terms of promoting PA and sport beyond the normal school curriculum
(Capel, 1997). ECPA is the one school context that has the potential to play a
significant role in the promotion of childhood and adolescent PA (Cleland et al.,
2005; Trudeau and Shephard, 2005). The European Heart Network (2001) report on
children and young people emphasised the importance of PA promotion going beyond
the PE curriculum in schools. The potential benefits of participation in ECPA
include, increasing the chances of lifelong participation in sport (Bass and Cale, 1999)
44
and enhancing pupils’ health (Curtner-Smith et al., 2007). Within the literature,
however, the health benefits of ECPA participation for young people are only referred
to as ‘potential’. Researchers are still unclear to the actual extent to which
involvement in ECPA contributes to pupil’s health (Curtner-Smith et al., 2007).
From an American perspective, ECPA is often not considered as an extension of the
curriculum, as it is in other countries and in American schools, is often given a more
elevated status than PE by pupils, parents, teachers and administrators (Curtner-Smith
et al., 2007). The indication is that the predominant model of American ECPAs is
highly conservative and focussed on winning in a narrow range of team games
(Curtner-Smith et al., 2007). Teachers are often hired because of their ability to
coach a sport rather than their teaching prowess (Cleland et al., 2005).
As already stated, ECPA in school is one of the main pillars of organised sport in
Ireland (Fahey et al., 2005). The ESRI study by Fahey and colleagues (2005) states
that the amount of ECPA offered to post-primary students in schools depends on the
willingness of teachers to take on these extra duties outside of their formal teaching
duties. It is also important to mention the importance of clubs or sporting
organisations coming into schools to run PA programmes. In a similar vain to the
Fahey and colleagues (2005) study, which suggested that ECPA’s offered in post-
primary schools depended on the willingness of teachers to take on extra duties, the
Woods and colleagues (2010) study suggested that the quality of ECPA programmes
in schools is dependent on the goodwill of teachers, in most cases.
Levels of ECPA Participation in Schools
Over the last two decades, studies have been carried out to identify the number of
students participating in ECPA in England and Wales. The Young People and Sport
in England 2002 survey focussed on students across 63 post-primary schools (Sport
England, 2003b). Students completed a self-report questionnaire. The survey found
that 34% of students reported taking part in ECPA at least once a week, 23% of
students on two or more days a week and 15% on three or more days a week. In
terms of participation once a week or more, numbers dropped from 43% of students in
school years seven to nine (aged 11-14 years), to 35% of students in years ten to
45
eleven (14-16 years of age). The survey also indicated that, overall, 41% of students
took part in ECPA at some time or other in the previous year. The findings showed
that participation rates in extra-curricular PE declined as the students moved up
through the schools years.
In Wales, a 2004 questionnaire based survey Active Young People (Sports Council
Wales, 2006), found that 42% of post-primary school students were taking part in
ECPA at least once a week, 17% participated two or three times a week and 8%
participated three or more times a week. Overall, 71% of students reported taking
part in ECPA at some stage during 2004. Participation rates with age also reported a
drop in Wales, with 51% of year seven (aged 11-12 years) students to 38% of year
eleven (aged 15-16 years) students participating once a week or more in 2004. A
study conducted by Smith and colleagues (2007) ‘Young People’s Participation in
National Curriculum Physical Education’ examined the levels and forms of
participation in PE and ECPA of 1010 (N=497 males/513 females) students (15/16
years) attending seven post-primary schools across the northwest of England and the
northeast of Wales. All of the Year eleven students involved completed a Young
People, Sport and Leisure (YPSAL) self-report questionnaire. The study found that
males (3%) and females (2%) participated in ECPA five or six times a week. The
numbers that reported involvement three or four times a week included males (30%)
and females (24%). Twice a week ECPA participants included males (40%) and
females (43%). The students who reported involvement on only one occasion a week,
included males (26%) and females (29%). Overall, 46% of students in this study
reported to have participated in ECPA in school at least once in the previous twelve
months.
In Ireland, the ESRI study (Fahey et al., 2005) found that, overall, a far higher
frequency of students were participating in ECPA compared to PE. The number of
students participating in ECPA four or more days a week was 22% (33% male and
10% female). The number of students participating in ECPA two or three days a
week was 30% (29% male and 30% female). The number of students participating in
ECPA only once a week was 18% (15% male and 23% female). The findings suggest
that males are more regularly involved in ECPA than females and that 29% of females
are unlikely to take part in ECPA at all compared to just 16% of males. The number
46
of students who never took part in ECPA in school was 22%. This study showed a
gradient of decline in ECPA participation (for both males and females) as they moved
up through the second level school cycle. For example, the number of second year
students that participated in ECPA four or more times a week was 25% compared to
17% of sixth year students. The amount of students who participated in ECPA two or
three days a week also decreased as the age level increased (36% of second years
down to 24% of sixth years). This trend is in line with the previously mentioned
decline in PE participation levels, as students move up through the school cycle. In
terms of ECPA involvement at least once per week, among males, soccer (28%) and
Gaelic football (22%) were reported to be the most popular ECPA’s. For females,
basketball (20%) and Gaelic football (12%) were most popular. In a similar vain to
PE in second level Irish schools, invasion games were highlighted in this study as the
dominant ECPA on offer.
Following on from the ESRI study (Fahey et al., 2005), the CSPPA study (Woods et
al., 2010) provides the latest insight into ECPA participation rates in Irish second
level schools. The study indicates that the number of students participating in ECPA
four or more days a week was 31% (41% male and 21% female). The number of
students participating in ECPA two or three days a week was 26% (26% male and
27% female). The number of students participating in ECPA only once a week was
16% (12% male and 19% female). Overall, 16% of students reported never to take
part in ECPA, while more females (21%) than males (11%) never took part in ECPA.
The number of students participating in ECPA decreased as students progressed
through second level education. As an example, the number of second year students
that participated in ECPA four or more times a week was 32% compared to 21% of
sixth years. The amount of students who participated in ECPA two or three days a
week also decreased as the age of the students increased (29% of second years down
to 22% of sixth years). The decrease in participation with age was found to be more
prevalent in females than in males. These decreases in participation with increasing
age mirror the results from the Fahey and colleagues (2005) study in ECPA and PE.
Content of ECPA in Schools
The Sport England (2003b) survey highlighted the dominance of traditional,
competitive games offered as part of ECPA in schools with football (15%) and netball

47
(7%) the most frequently attended among all the second level students. Football and
netball were the two most popular ECPAs participated in by males and females
respectively. This is supported by Smith and colleagues (2007) who also found that
the most widely played sports and physical activities in ECPA were football (52%)
for males and netball (24%) for females. The next most widely played physical
activities for males and females were basketball (14%) and hockey (15%)
respectively. The study concluded that the kind of physical activities and sports on
offer in post-primary schools have an impact on whether students participate in ECPA
or not.
In Ireland, the ESRI report (Fahey et al., 2005), in terms of ECPA involvement at
least once per week among males, soccer (28%) and Gaelic football (22%) were
reported to be the most popular activities. For females, basketball (20%) and Gaelic
football (12%) were most popular. In a similar vain to PE in second level Irish
schools, invasion games were highlighted in this study as the dominant ECPA on
offer (Fahey, 2005). Recently, the CSPPA study (Woods et al., 2010) found that
soccer (17%), gaelic football (12%) and basketball (9%) were the most popular
ECPA’s among males. The most popular ECPA’s among females were basketball
(14%), Gaelic football (9%) and athletics (9%). These findings showed how games
dominated male ECPA participation, while a mix of individual and team based
activities proved most popular among females.
Attitude Towards ECPA
In terms of attitude towards ECPA and sport in general, young people reported to be
generally confident about their involvement in it, however, there was concern about
feelings of ‘not being good enough’ (Sport England, 2003). This view from the UK
corresponds with the Curtner-Smith and colleagues (2007) view in the US, in that
ECPA is often geared towards a minority of pupils with a competitive focus at its
core. Curtner-Smith and colleagues (2007) also suggest the need for more
exploratory research around the area of ECPA in schools. They proposed an
investigation into the attractiveness of ECPA to post-primary students and also to
verify or refute the idea that students who take part in ECPAs are already active and
those that do not participate are relatively inactive.
48
From an Irish perspective, there has been little or no research carried out into the
attitude of post-primary school students towards ECPA. The CSPPA study looked at
school principal’s attitude towards ECPA in school (Woods et al., 2010). The study
found that all principals felt ECPA was important to the ethos of their school. Most
described it as ‘very important’ (79%) or ‘fairly important’ (21%).
Summary of ECPA
This literature review looked at ECPA in schools by way of levels of participation,
content and attitude towards it. In terms of participation levels, the research suggests
that the numbers are high, but are mirroring the trends found in PE and PA
participation (males more physically active than females and a decline in PA with
age). The research regarding ECPA in schools has been mostly carried out using the
self-report methods for measuring PA participation and correlates of PA. There is a
need for research to consider qualitative research in order to find out, from actually
talking to young people, what are their key motives, barriers for participation in or
avoidance of ECPA. The need to find out why students do or do not participate in
ECPA in school is important. If more young people are to be active on a more regular
basis, then the reasons behind their participation or non-participation in ECPA are
required.
Research has shown that the content of ECPA is similar to the content of PE lessons
in schools. Studies from the UK and Ireland found that physical activities on offer
were both competitive and traditional team games. This emphasis on team games,
and a lack of broad and balanced opportunities for PA may be a reason for the decline
in numbers of students participating, as they get older. There is a need for research
into the attitudes of students towards ECPA to find out what physical activities
adolescents would like to see offered. Smith and colleagues (2007) believe that what
ECPA schools offer is a critical factor in understanding school differences in
participation levels.
iii. Sports Clubs and Physical Activity Outside of School
The European Heart Network document on Children and Young People – The
Importance of Physical Activity (2001), states that after school and weekends are key
49
times associated with activity for young people. The document suggests that if young
people are inactive during these times, they are unlikely to reach recommended PA
levels. Therefore, it is important that facilities and services are provided to aid the
promotion of PA outside of school time. The document also suggests that the role of
national governing bodies of sport in providing opportunities for participation in both
school and after school settings should be considered. Clubs that are run outside of
the school system are an important part of the institutional structure of sports
participation in Ireland (Lunn et al., 2007).
Level of Participation
The Health Survey for England (HSE, 2008) found that 95% of males and females (2-
15 years) had taken part in some form of PA outside of school in the past week. The
survey also showed that more males than females had taken part in formal sports
(49% of males and 38% of females) and the same trend occurred for informal
activities (90% of males and 86% of females). The Take Part survey (Woods et al.,
2004) showed that the most popular sports participated in by youth (11-15 years) both
in and out of school over the previous four weeks were football (53%), basketball
(29%) and swimming (28%).
The ESRI produced some interesting statistics in this area from their ‘School Children
and Sport in Ireland’ study (Fahey et al., 2005). They found that a high frequency of
participation in sport by students is through sports clubs outside of school. The
findings showed that 18% of students surveyed participated in non-school sports clubs
four or more times a week (25% male and 11% female) and 34 % participated two or
three times a week (39% male and 30% female). The study also indicated that 18% of
students surveyed participated one day a week (14% male and 22% female). The
number of students that never participated in non-school sports clubs was 21%. The
findings of this study show that there is a general decrease in participation levels, with
increasing age, among second level students in non-school sports clubs. An example
of this decrease was found with second year students where 21% reported
participating in non-school sports clubs four or more days a week, compared to 20%
of third years, to 14% of both fifth and sixth year students. These reported figures are
similar to the trends found in the same study with ECPA participation, where student
participation also decreased with increasing age. The decline in participation levels
50
with age was, however, more consistent and steeper across the adolescent age groups
with ECPA than with non-school sports clubs.
The Health Behaviours of School-aged Children (HBSC, 2009) study concluded that
27% of males and 23% of females aged ten to eleven years old were exercising four to
six times per week outside of school (Nic Gabhainn et al., 2010). The ESRI
‘Growing up in Ireland’ study found that 75% of nine year olds were involved in
organised sports/fitness clubs outside of school (Layte and McCrory, 2011). Again,
this is demonstrating the emerging pattern of PA participation decreasing with an
increase in age of young people.
The CSPPA study (Woods et al., 2010) found that 64% of second level students
participate in extra-school sport at least once a week. The number of students
participating in extra-school sport four or more days a week was 24%, 30% were
participating two to three days a week and 10% were participating one day a week.
The number of students who reported never to participate in extra-school sport was
34%. The findings also showed that participation rates decreased with increasing age
of students. Participation at least once a week decreased from 70% (aged 12-13
years) to 65% (aged 14-15 years) to 57% (aged 16-18 years). Those who never
participated in extra school sports increased with age also, 25% (aged 12-13 years) to
34% (aged 14-15 years) to 41% (aged 16-18 years). This trend is similar to the trend
identified in the Fahey and colleagues (2005) study, which also reported a decline in
non-school sports club participation levels with increasing age of students.
Most Popular Games/Sports Participated in
Gaelic football and soccer (invasion games) were the two most popular sports
engaged in by male second level students outside of school (29% participating weekly
in Gaelic football and 31% in soccer). Gaelic football and dance were the two most
popular sports engaged in by female second level students outside of school (14%
participated weekly in Gaelic football and 13% in dance). Fahey and colleagues
(2005) indicated that the high participation rates reported in non-school sports clubs
highlights their importance as an outlet for PA among Irish adolescents.
51
The CSPPA study (Woods et al., 2010) looked at the most popular extra school club
sports and extra school sports. They found that Gaelic football was the most popular
extra school club sport participated in on a weekly basis (22%), followed by soccer
(20%), swimming (15%), dance (14%) and hurling (11%). For males, the most
popular physical activities reported were Gaelic football (27%), soccer (32%) and
hurling (17%). For females, the most popular extra school club sports were dance
(23%), swimming (19%) and Gaelic football (17%). Eighteen percent were involved
with sports clubs at a basic level (recreation purposes), 57% were involved at a
competitive level (club competitions) and 25% were elite (competing at a regional or
a national level). Significantly, the study concluded that participation in extra-
curricular school sport led to a 60% increase in the likelihood of involvement in extra
school clubs. Another interesting finding from the study was that 10% of second
level students chose not to participate in ECPA in school or extra-school sport or PA.
The main reasons given for not taking part were a ‘lack of time’ and feelings of
‘incompetence’.
Summary of Sports Clubs and Physical Activity Outside of School
In summary, a large part of adolescents’ PA participation comes in the form of PA
outside of the school setting. One of the main trends highlighted is the decrease in PA
levels of adolescents with increasing age. The research carried out to date in Ireland,
however, focuses on the numbers involved PA rather then the reasons why they either
do or do not participate. The statistics highlight the problem, but do not give
qualitative evidence as to why young people are active or otherwise. The CSPPA
study gave a rare insight into the reasons why young Irish adolescents do not take part
in ECPA or extra-school sport or PA (Woods et al., 2010). The findings showed that
these young people highlighted reasons such as a lack of time and feelings of
incompetence for their lack of involvement. This present study has looked at the
reasons behind non-participation in ECPA through self-report questionnaire and focus
group work, which may give a more specific insight into why more young people are
not physically active outside of school on a regular basis.
In terms of the most popular games/sports participated in outside of the school setting,
the Irish studies showed a trend a similar trend to PE and ECPA with games
dominating students’ involvement. The studies by Fahey and colleagues (2005) and
52
Woods and colleagues (2010) showed that large numbers of Irish adolescents’ were
involved in sports clubs outside of school, highlighting their importance as a source of
PA. To find out what it is that attracts students into sports clubs outside of school,
however, has been somewhat under-researched. This is an area that needs to be
looked at in future research in order to get more adolescents joining clubs and
becoming more active on a regular basis.
iv. Active Travel to and from School
Travelling to and from school has been recognised as an opportunity for children and
adolescents to achieve part of their recommended daily PA (NHS, England, 2011).
The promotion of active travel to school can reduce inactive behaviour in young
people and replace it with moderate intensity behaviour (Alexander et al., 2005).
Active travel is seen as walking or cycling all or part of the journey to a destination.
Inactive travel is seen as using a form of motorised transport e.g. car or bus.
In the United Kingdom, a National Travel Survey (2009) looked at the travel habits of
people from all age groups (Department for Transport, UK, 2010). Data was
collected from 8,000 households across the UK covering almost 20,000 people. In
terms of second level school students, the survey showed that 41% actively travelled
to school. This total consisted of those who walked to school (38%) and those who
cycled (3%). Of those who inactively travelled to school, the main modes of transport
were by bus (32%) and by car (22%). The average distance students had to travel to
school was 3.3 miles.
The School Children and Sport in Ireland report (Fahey et al., 2005) looked at how
young people travelled to and from school. Their results showed that 27% of students
walked to school, 3% cycled, 32% were brought by car and 35% went by bus. The
majority of those who walked or cycled did so for a quarter of an hour or less (76%
walking/89% cycling). Fahey and colleagues (2005) believe that the journey to
school is not a major source of PA for second level students. The Central Statistics
Office (CSO, 2006) in Ireland produced figures concerning second level school
students’ active travel to school. The CSO figures showed that only 27% of school
and college students (aged 13-18 years) actively travelled in 2006. The main form of
transport for those who inactively travelled was by bus (36%) and car (33%). The

53
figures from 2006 are lower than previous years and are part of a continuous
downward trend in active travel to school since 1991. The CSO figures show that in
1991, for the same age range of students, 42% actively travelled to school. In 1996,
the figure dropped to 36% and in 2002, the figure had decreased to 29%. In terms of
gender, the CSO figures from 2006 suggested that males (29%) were more likely to
actively travel than females (25%) and only 5% of males and less than 1% of females
cycled to school in 2006.
The CSPPA study (Woods et al., 2010) found that 40% of second level school
students either walked or cycled to school in 2009. Only 3% of those cycled to
school. The average journey time for active travel to school was fifteen minutes. In
terms of gender differences, females (38%) were less likely to actively travel to
school than males (43%). The results produced no evidence to show a decline in
active travel to school with increasing age. Distance (54%) and time (19%) were
reported as the main barriers to active travel to school. A third barrier of convenience
(8%) was also prominent amongst students with many suggesting that it was easier to
get the bus than to walk.
Summary of Active Travel to school
A recommendation from the Children and Young People – the Importance of PA
report was to prioritise walking and cycling to school for students (European Heart
Network, 2001). The latest figures published over the last number of years shows that
the numbers of second level school students who actively travel to school are
increasing (Woods et al., 2010). The CSO (2006) figures in Ireland, however,
showed a decrease in the number of students who actively travelled to school over a
fifteen-year period (1991 – 42%/2006 –27%). The evidence from the Woods and
colleagues study is more positive and indicates the importance of active travel to
school as another source of PA for young people. Woods and colleagues do, however,
give a note of caution when analysing results in terms of the differences in student
samples and the time of year in which data was collected (2004 – October/November,
2009 – March, April and May). It would be beneficial for any future studies in this
area to target specific times of the year, as part of a longitudinal study, to observe any
differences in active travel to school during a school year or over a number of years.
54
Another important area of research for active travel to school is the students’ attitude
to PA and in this particular case, active travel to and from school. To encourage and
promote active travel to school, it is vital to know why some students do walk or
cycle to school and why others are inactively travel to school. In Ireland, very little
research has analysed the reasons for these behaviours. Woods and colleagues (2010)
did look into this as part of their CSPPA study, finding that second level school
students gave distance, time and convenience as the main barriers to active travel to
school. The Department of Education and skills in Ireland, and schools themselves,
need to promote active travel for students where it is actually possible to walk or
cycle to school. The key is to find out what the students actually think about active
travel and what would encourage them to do it. This is where focus group work with
students could be extremely valuable.
Research studies show a similar trend, in terms of gender, as the figures from studies
in PE and ECPA and PA show in general. The trend highlighted was that of male
students being more likely to actively travel to school than females. Unlike the
findings from PE, ECPA and PA, where a drop off in PA levels occurred with age,
active travel figures in the Woods and colleagues (2010) study showed that students
(aged 18 years) were as likely to walk or cycle to school as younger students (aged 10
years). This is potentially a really important finding. It highlights active travel as a
valuable source of PA in young people, particularly with senior cycle students in
second level schools, where the research has shown a real decrease in PA levels.
2.10 Overall Literature Review Summary and Future Research Challenges
This literature review has highlighted the many health benefits to be gained by young
people from PA participation. The health benefits can be physical and psychosocial.
The research has found, however, many inconsistencies in the physical effects, in
particular, on young people from PA. This has led to some researchers (Riddoch et
al., 1998; Twisk et al., 2001; Cale and Harris, 2005) questioning the physical benefits
to young people from PA that are regularly suggested when promoting PA in youth.
Research has shown, however, that habits and patterns of PA in youth can have an
effect on PA activity levels into in adulthood. Twisk (2001) illustrates the importance
of PA in childhood and adolescence with his model (derived from Blair et al., 1989)
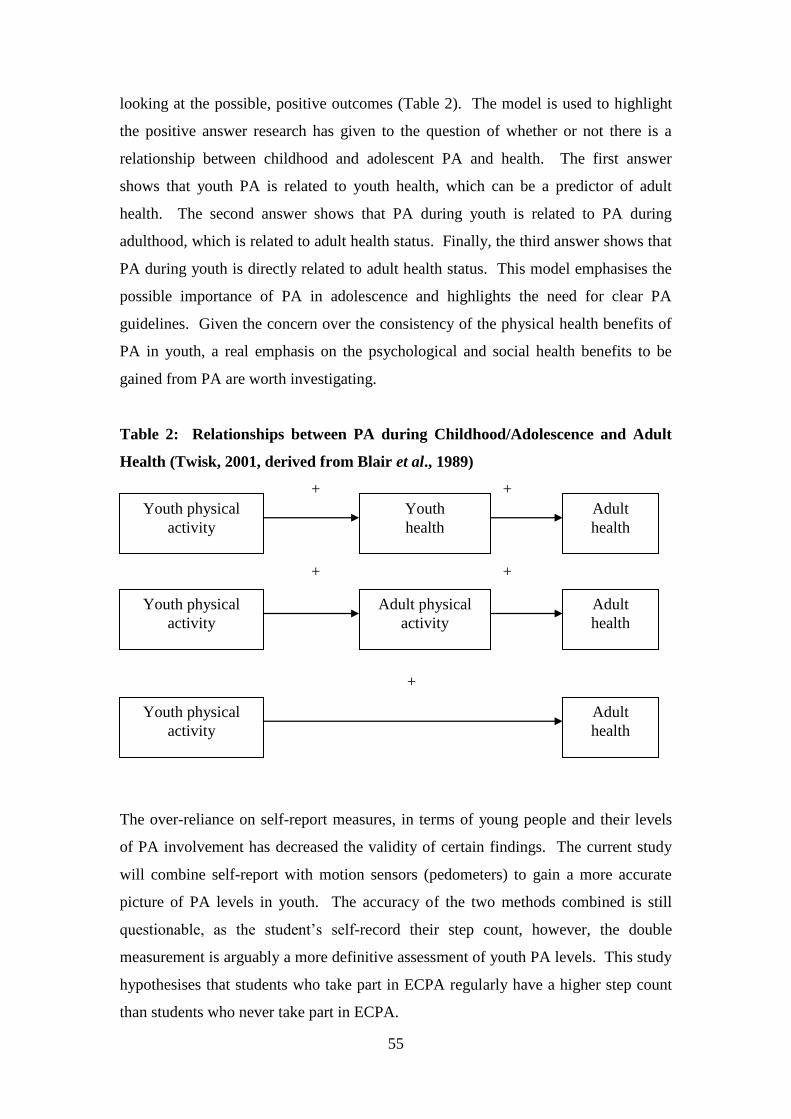
55
looking at the possible, positive outcomes (Table 2). The model is used to highlight
the positive answer research has given to the question of whether or not there is a
relationship between childhood and adolescent PA and health. The first answer
shows that youth PA is related to youth health, which can be a predictor of adult
health. The second answer shows that PA during youth is related to PA during
adulthood, which is related to adult health status. Finally, the third answer shows that
PA during youth is directly related to adult health status. This model emphasises the
possible importance of PA in adolescence and highlights the need for clear PA
guidelines. Given the concern over the consistency of the physical health benefits of
PA in youth, a real emphasis on the psychological and social health benefits to be
gained from PA are worth investigating.
Table 2: Relationships between PA during Childhood/Adolescence and Adult
Health (Twisk, 2001, derived from Blair et al., 1989)
+ +
+ +
+
The over-reliance on self-report measures, in terms of young people and their levels
of PA involvement has decreased the validity of certain findings. The current study
will combine self-report with motion sensors (pedometers) to gain a more accurate
picture of PA levels in youth. The accuracy of the two methods combined is still
questionable, as the student’s self-record their step count, however, the double
measurement is arguably a more definitive assessment of youth PA levels. This study
hypothesises that students who take part in ECPA regularly have a higher step count
than students who never take part in ECPA.
Youth physical
activity
Youth
health
Adult
health
Youth physical
activity
Adult physical
activity
Adult
health
Youth physical
activity
Adult
health
56
The review has also looked at the pillars of PA for young people. It found that males
are more active than females, participation levels decrease with increasing age and
there is a dominance of traditional team games in PE, in ECPA and in PA outside of
school and in sports clubs. The lack of research into ECPA in second level schools,
from an Irish perspective in particular, is evident. ECPA is an excellent school based
source of PA for adolescents, and therefore, demands attention. This study
specifically targets male second level students (aged 12-15 years) to identify levels of
ECPA participation.
Research has shown that there is a possible relationship between psychological well-
being and PA (Altintas and Hulya Asci, 2008; Calfas and Taylor, 1994; Inchely et al.,
2011; Mutrie and Parfitt, 1998). The psychological factors of physical self-worth,
perceived physical competence, enjoyment and liking of PA are of fundamental
importance to this research study. These factors are all part of the YPAP model. The
hypotheses being tested, guided by the Youth Physical Activity Promotion model
(Welk, 1999; Rowe et al., 2007) is that adolescent males with high levels of physical
self-worth, perceived physical competence, enjoyment and liking of PA will be more
likely to i) regularly participate in ECPA, ii) meet PA guidelines and iii) have a higher
pedometer step count than an adolescent with lower levels of physical self-worth,
perceived physical competence and enjoyment and liking of PA than those who do
not regularly participate in PA.
This literature review determined that there is a need for qualitative evaluation of
adolescents’ reasons for non-participation and also, to gain information on how to
motivate them to become more active. This study will use focus group discussions
with samples of students who have a similar outlook on ECPA i.e. groups of students
who regularly attend and groups who never attend ECPA in school. The focus groups
should provide students with an open environment to share their honest views on
ECPA in schools. The CMO report stated that childhood and adolescence is the best
opportunity for influencing attitudes towards PA (DOH, England, 2004). It also
suggests that students who emerge from their school years with confidence about their
physical skills and bodies and who have had positive experiences of PA are likely to
be active during adulthood. This suggestion emphasises the role ECPA in schools can
play in getting young people active and positively affecting their psychological well-
57
being. The importance of finding out what regular ECPA participants enjoy about
being involved is vital, as it has been suggested that poor or negative PA experiences
can reduce the self-esteem of young people (Health Education Authority, 1992;
Hopper, 2005: Bailey, 2005). This could negatively affect their future involvement in
PA and therefore, making PA, PE and ECPA more enjoyable and positive is vital in
terms of getting young people active and keeping them regularly active. This
literature review has shown that enjoyment of PA and being with friends are two
important correlates for young people being physically active. Additionally, the
positive effect on psychological well-being has been identified as a key factor in the
PA participation of children and adolescents. This particular study has ECPA in
schools as its core focus. ECPA needs more exposure to highlight its importance as a
source of PA for second level school students. This study examines the possible
affects on the psychological well-being of adolescent males from regular ECPA
involvement. The findings, if positive, could benefit organisations trying to
encourage more young people to be physically active on a more regular basis.
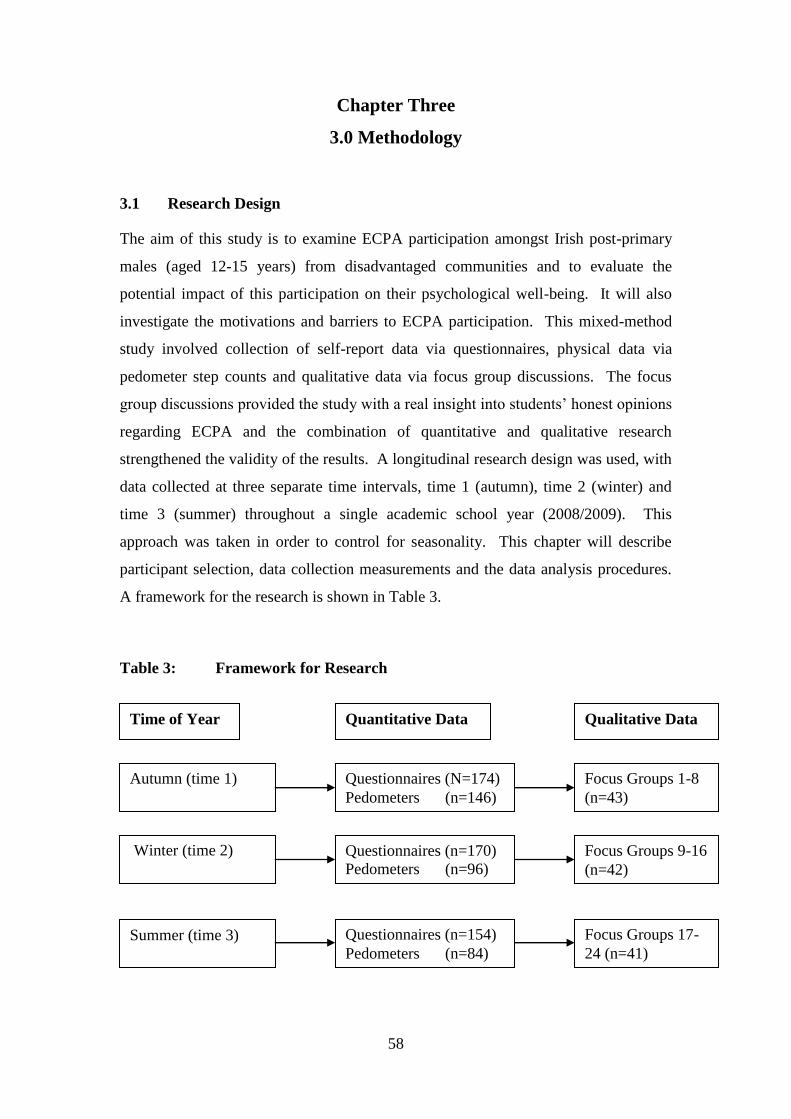
58
Chapter Three
3.0 Methodology
3.1 Research Design
The aim of this study is to examine ECPA participation amongst Irish post-primary
males (aged 12-15 years) from disadvantaged communities and to evaluate the
potential impact of this participation on their psychological well-being. It will also
investigate the motivations and barriers to ECPA participation. This mixed-method
study involved collection of self-report data via questionnaires, physical data via
pedometer step counts and qualitative data via focus group discussions. The focus
group discussions provided the study with a real insight into students’ honest opinions
regarding ECPA and the combination of quantitative and qualitative research
strengthened the validity of the results. A longitudinal research design was used, with
data collected at three separate time intervals, time 1 (autumn), time 2 (winter) and
time 3 (summer) throughout a single academic school year (2008/2009). This
approach was taken in order to control for seasonality. This chapter will describe
participant selection, data collection measurements and the data analysis procedures.
A framework for the research is shown in Table 3.
Table 3: Framework for Research
Time of Year Quantitative Data Qualitative Data
Autumn (time 1)
Winter (time 2)
Summer (time 3)
Questionnaires (N=174)
Pedometers (n=146)
Focus Groups 1-8
(n=43)
Questionnaires (n=170)
Pedometers (n=96)
Focus Groups 9-16
(n=42)
Questionnaires (n=154)
Pedometers (n=84)
Focus Groups 17-
24 (n=41)
59
3.2 Participants and Recruitment
At school level, a purposive sampling procedure was used with N=4 schools invited
to take part in the study. The entire sample of four schools were north-side, City of
Dublin Vocational Education Committee (CDVEC) schools. All schools were
designated ‘DEIS’ schools (Delivering Equality of Opportunity in Schools) by the
Department of Education. These schools cater for young people from socially and
economically disadvantaged communities (Department of Education and Skills,
2009). The principal in each of the schools was sent a letter (Appendix C) and then
contacted individually by phone to outline the purpose of the study, what it would
involve, what would be required from students and requesting their permission to
involve their particular school and students. All four schools contacted committed to
taking part giving a 100% recruitment rate. Ethical approval for the study was
obtained from Dublin City University (DCU) Research Ethics Committee. All
students and their parents received an information leaflet (appendix D, Plain
Language Statement) on the study and parents provided written consent (appendix D)
for their child to be involved in the study. All students involved provided assent
(appendix D) and were free to withdraw from participation in the research at any
stage. Dates and times for data collection were then agreed with the individual PE
teachers from each of the participating schools. At the individual student level, a
specific class group from first, second and third year in each participating school was
randomly selected. The criteria for inclusion in the study were males in first, second
or third year of post primary school, aged 12-15 years at the outset of the study and in
full time education. The cohort consisted of N=174 participants (N=30%, 1st years;
N=39%, 2nd
years; N=31%, 3rd
years, mean age = 13.59 + .91).
3.3 Results and Methods
Pilot Study
Piloting of the Physical Activity Questionnaire (PA-Q, Appendix E) took place in one
of the recruited CDVEC schools in May 2008. The sample (N=7) of students (aged
15 years) were all male and in third year of post primary school. Third year was
selected as these students would be moving on to fourth year the following September
and thus would not have to withdraw from the study. However, recruiting a larger
60
sample of students proved difficult due to the proximity of exams. Third years were
chosen to make sure that the questionnaire was comprehensible and to find out how
they would cope with a pedometer for a week. No problems were reported with
comprehension or layout of the questionnaire. The students each wore a pedometer
for 7 days and recorded steps taken in an activity diary (Appendix F). All pedometers
were returned safely and results recorded satisfactorily. The group also took part in
focus group discussions to assess the suitability of interview questions. Group one
(N=4) was made up of students who reported, on their questionnaire, to ‘regularly’
participate in ECPA at school. Group two (N=3) was made up of students who
reported ‘never’ taking part in ECPA. The focus group discussions revolved around
the students’ attitude towards and participation in ECPA in school. The discussions
were useful as the students’ reported being comfortable in groups with people who
had a similar participation level and attitude to ECPA as them. The pilot focus groups
also provided information on suitability, time and type of probes to use in actual focus
groups for the study.
Questionnaire Data Collection
The researcher and a member of the PE staff in each school supervised data collection
from the questionnaire. The students were in groups of no more than 30, giving a
ratio of adults to students at approximately 1:15. Completion time for the
questionnaire ranged from 40-50 minutes with an average time completion of 45
minutes. The procedure was as follows:
1. Students were seated in a normal classroom setting
2. Each student was given a questionnaire and their name was checked on a list
to make sure that consent forms had been signed by a parent
3. The students were all given an individual I.D. number to be written on their
questionnaire
4. The students were given a brief outline of the aims of the study and a detailed
instruction on how to complete the questionnaire.
5. The students’ attention was drawn to the importance of section 2 on the
questionnaire that related to their participation in ECPA in school.
61
6. Students were informed that the questionnaire was not a test, that there were
no right or wrong answers, and that the responses they gave needed to be
accurate and honest.
7. Students were encouraged to ask any questions that they may have had and
they were informed that their responses would be treated in confidence and
that their I.D. numbers would be used rather than their names.
8. Students were informed that they had approximately 25 minutes to complete
section 1 and 2 of the questionnaire.
9. After approximately 20/25 minutes, the group put down their pens and were
given a more detailed instruction on how to complete section 3 of the
questionnaire. This was due to section 3 being different from the rest of the
questionnaire in terms of questions asked and how to respond to those
questions.
10. The example question at the start of section 3 was written on the board in the
classroom and a student from the group was asked what type of student they
were in relation to the statement ‘Some students like football BUT other
students don’t like football very much’. From the response the student gave,
the correct box was ticked on the board to make it clear to all students how
they should answer the questions properly.
11. The students were told to make sure to tick one box only from each statement
in section 3.
12. The researcher and the individual schools’ PE staff moved around the
classroom asking students if they were able to understand the questions and
had a quick check on the students’ questionnaires to see if they were being
completed correctly.
13. Students were informed that they had 5 minutes before they had to hand up the
questionnaires and were told to read over the questionnaire making sure that
all questions were answered.
14. Participants handed up their questionnaires and were praised for their co-
operation up to that point.

62
Pedometer Data Collection
The procedure adhered to for pedometer data collection was as follows:
1. The students were shown what a pedometer looked like by the researcher at
the front of the class.
2. The researcher informed the students of why they were being given the
pedometers and the importance of keeping them safe.
3. The researcher explained how the pedometer worked, what its purpose was
and a demonstration was given on where to place the pedometer on their
person (attached to top of trousers/tracksuit bottoms at the waist).
4. Students were then shown a diary card (Appendix F) in which they were to
keep an account of their daily step counts.
5. Students were advised to record each days step count total when they went to
bed at night or first thing in the morning. They could then reset their
pedometer once the daily step count was recorded. Diaries were also to be
used to record physical activities that they may have been involved in, which
required the pedometer to be taken off. They were told that the pedometer
needed to be removed if they thought the activity, which they may be involved
in, was a danger to the safekeeping of the pedometer e.g. playing football.
The students were also reminded that the pedometers needed to be kept safe
and were not to get wet
6. Students were informed that the researcher would check the pedometer as they
left the classroom and it would be set to zero.
7. The students were told to write the code, which was on each individual
pedometer, onto their diary card, once they were given out.
8. The researcher and the PE teacher present, distributed the pedometers and the
diary cards to the students.
9. Students were given five minutes to ‘play’ with the pedometer, check they
knew what to do with it and got used to placing it on their person.
63
10. The researcher and the PE teacher present both went around to each individual
student checking everyone had a pedometer that worked, that they knew what
to do and that the code on the diary matched the one on the pedometer.
11. The students were informed that the pedometers and the diary cards would be
collected from them in school on the following Friday (7 days later).
12. The students were thanked for their willingness to participate and asked again
to take good care of the pedometers and to record honest results in their diary
cards. They were also told to speak to their PE teacher during the week if they
had any problems with the pedometer or the diary completion. They were
reminded again to wear the pedometer during all waking hours unless
swimming, washing, or taking part in any activity where it would be unsafe to
wear.
13. The students were asked to line up at the exit door and have their pedometer
attached to their waist at the top of their trousers/tracksuit, preferably close to
the hip.
14. As the students left, the pedometer was checked for correct attachment to the
waist and reset to zero.
Focus Group Data Collection
In each of the four participating schools, two separate groups of students
(approximately 5/6 per group) took part in focus group discussions at each of the three
time points across the academic year. One group consisted of students who regularly
took part in ECPA and the other group was made up of those who never took part in
ECPA at school. Students were selected to take part in the focus groups with the aid
of the physical education teachers in the particular schools who were aware of the
students’ ECPA involvement or non-involvement. An interview script containing the
list of questions guided the discussions, yet they were not used to limit the researcher
probing or asking follow-up questions. The focus groups were held post self-report
and objective data collection at each of the three time points and the same students
took part at each time point. Discussions took place in a small classroom in each
school and lasted approximately thirty minutes. The procedure adhered to for the
focus group discussions were as follows:
64
1. The students were informed that the discussion would revolve around their
participation or non-participation in ECPA in school and their attitude towards
it.
2. The researcher made the students aware that the discussion would be recorded,
but that no one would hear the recording other than the researcher and also,
they were assured that their names would not be used in the research.
3. The students were made aware that they did not have to answer any questions
that they did not want to and they could withdraw from the focus group
discussion at any time.
4. The researcher read though the list of questions to be used in the discussion
before the recorder was started so that the students were aware of what they
would be asked.
5. The students were asked to relax, to try and be honest in their answers, to
speak if they had something say and to try and not talk across one another so
that all opinions could be picked up on the tape recorder.
6. The tape recorder was turned on and the researcher began with first question
on the list.
7. At the end of the discussion, the students were asked if they had anything else
they wanted to add, they were thanked for their participation in the focus
group and the tape recorder was switched off.
3.4 Instruments
PA Questionnaire
The ‘Physical Activity’ Questionnaire (PA-Q) was a multi-section instrument
designed specifically for this study. This involved using a combination of well-
known, valid and reliable self-report measures. All measures were chosen, as they
were developmentally suitable for adolescents and they addressed the key areas of
interest of the research. The pilot study allowed the researcher to determine the
feasibility of the measures for the questionnaire, identify the length of time to
complete it and any problems with understanding. The PA-Q was made up of three
sections (Appendix E). Section 1 consisted of questions on Habitual Physical
65
Activity (HPA). Section 2 focussed on ECPA participation, and section 3 was an
evaluation of psychosocial subscales relevant to the Youth Physical Activity
Promotion model (Welk, 1999).
Demographics
Page 1 of the PA-Q collected demographic information including age, gender, school
name, year in school and disability status.
Section 1 – Habitual Physical Activity (HPA)
A definition of PA was read to all students prior to questionnaire completion, giving
further examples to clarify differences between intensities. PA was described as any
body movement completed at either ‘moderate’ or ‘vigorous’ levels of effort.
Moderate effort was described as ‘making your heart rate and breathing faster than
normal and you may sweat a little’. Examples given were brisk walking and jogging.
Vigorous effort was described as ‘making your heart rate and breathing much faster
than normal, and you will probably sweat’. Playing football or squash were given as
examples. Each student completed, on a scale from 0-7, the number of days during
the last 7 (Question 1) and from a typical week (Question 2) that they had
accumulated > 60 minutes MVPA. To ensure that students understood the definition
of PA and moderate and vigorous intensity activity, a definition with examples was
included in the questionnaire.
This instrument, the PACE+ scale, was originally developed by Prochaska and
colleagues (2001) as a reliable and valid screening measure to determine adolescents
who met recommended PA levels. It was developed for use with adolescents in
primary care (Prochaska, 2001) and was found to be reliable (intraclass correlation =
0.77) and correlated significantly (r=0.40, p<0.01) with accelerometer data
(Prochaska, 2001). It has since been used in similar cross sectional research by the
Take Part study (Woods et al., 2004), the 2006 Health Behaviours of School Aged
Children (HBSC, Ireland) study (Ni Gabhainn, 2007), CSPPA study (Woods et al.,
2010).
66
The main analysis from section 1 of the questionnaire was based upon working out
the Habitual Physical Activity (HPA) levels (number of days > 60 minutes MVPA per
week) of students (combining question 1 and question 2 and dividing by 2). This
composite average of the two items provided a score of days per week that the
students had accumulated > 60 minutes of MVPA (Department of Health and
Children, physical activity guidelines, 2009). This analysis was carried out at each of
the three time points of the study individually. In order to obtain a year-long average
for HPA, the three individual results were totalled and divided by 3. For those
students who had data recorded at only two time points (N=16), the information was
totalled and divided by 2. Students with HPA data from one time point only (N=4)
were excluded from year-long average levels.
Section 2 - Extra-Curricular Physical Activity (ECPA)
For the purpose of this study, ECPA was described for the participants as ‘the
provision of activities outside of the formal PE curriculum, most often after school
and at lunch times, but also in some schools, at weekends and/or before school’
(Penney and Harris, 1997:42). Four researcher developed questions assessed student-
frequency of participation in ECPA. These questions were based on those used in the
Take Part study (Woods et al., 2004) and the ESRI study (Fahey et al., 2005). The
first question (Q.9), similar to the HPA question, asked students to rate their
participation in ECPA in a typical week ranging from 1 = (never), 2 = (sometimes)
and 3 = (regularly). The second question (Q.10) asked students to report on the type
of ECPA they participated in by selecting from a range of potential ECPAs. This list
was generated following consultation with the PE teachers from the four participating
schools. This data was rank ordered from the highest proportion of students citing a
particular type of activity to the lowest proportion of students for activity type at each
time point. For year-long averages, the percentage participating in each ECPA at
every time point was combined and divided by 3.
The third question (Q.11) qualified the frequency count, by asking students to report
on frequency of participation in ECPA during the previous 7 days (defined as last
week) on a 5-point categorical measure. This ranged from 1 = never, 2 = once in the
past week, 3 = two or three times in the past week, 4 = four times in the past week and
67
5 = five times or more in the past week. These responses were then categorised into
never participating in ECPA (assigned a value of 1), participating at least once a week
in ECPA (assigned a value of 2) and participating twice or more per week in ECPA
(assigned a value of 3). A composite average of these two items provided a score of
the frequency of participation in ECPA at each time point. In order to determine year-
long average for participation in ECPA, all three time point scores were combined and
divided by three. For those students who only had data recorded at two time points
(N=16), their total was divided by 2. The students who had data recorded at only one
time point (N=4) were excluded from the study. Final year-long data was categorised
into never (never participated at any time point), sometimes (participated at least once
a week) and regularly (participating twice a week or more).
Finally, a fourth question (Q.12) investigated the barriers to ECPA participation for
those students who reported never participating in ECPA. Students had a choice of
four possible responses. These ranged from ‘I don’t enjoy PA’, ‘I’m too lazy’, ‘I
don’t think I’m good enough’ and an ‘other’ option for any other possible reason for
non-participation in ECPA. The results were analysed as percentage year-long
averages with data from each time point being combined.
Section 3 - Youth Physical Activity Promotion model (YPAP)
In this section, a 39-item questionnaire designed by Rowe and colleagues (2007) was
used to investigate PA behaviour in youth (Appendix E). The YPAP questionnaire
was developed specifically to test the validity of the YPAP model (Welk, 1999), for
the promotion of PA in children. It identified suitable existing questionnaires that met
three criteria, namely i) they had a common response format, ii) were reasonably brief
and iii) had satisfactory reliability and validity evidence for use with children (Welk,
1999).
Rowe and colleagues (2007) questionnaire comprised of seven subscales, which were
used to evaluate the components of the YPAP model (Welk, 1999). The YPAP model
consists of four main components, enabling, predisposing and reinforcing factors, and
personal demographics. Under the predisposing factors, in order to answer the
68
question of ‘am I able?’ Whitehead’s (1995) Physical Self-Worth scale (PSW) was
used to get an indication of how the students’ felt about themselves physically.
Harter’s (1985) Perceived Physical Competence scale (PPC) examined the
adolescents’ perceptions of their perceived competence at games and sports
specifically. ‘Games and sports’ was the term used here rather than just ‘sports’ from
the original scale (Harter, 1985). This was amended by Rowe and colleagues (2007)
to make the statements closer to PA rather than athletic competence. Also under
predisposing factors, the ‘is it worth it?’ question was investigated using Smith’s
(1999) Liking of Games and Sports (LGS), Fun of Physical Exertion (FPE) and
Liking of vigorous Exercise (LVE) adaptations from the original ‘Children’s
Attraction to Physical Activity scale (CAPA, Brustad, 1993, 1996) used to explore
adolescents’ overall enjoyment of exercise.
The reinforcing factors from the model examined the perceived influence of parents
and peers on adolescent participation in PA. The Parental Encouragement subscale
was chosen by Rowe and colleagues (2007) for this questionnaire, which originated
from Brustad’s (1996) three-parent socialisation subscale. This particular subscale
was chosen due to the suitability of the questions focusing on parental behaviour
towards the child’s PA rather than parent’s own PA behaviour. The Peer Acceptance
subscale was also taken from the ‘Children’s Attraction to Physical Activity scale
(CAPA, Brustad, 1993,1996) to identify the role played by peers in determining PA
behaviour in children.
Enabling factors from the model relate to the opportunities children and adolescents
have to be physically active. For the present study, the enabling factors investigated
were students HPA levels (number of days > 60 minutes MVPA per week), daily step
count levels and their level of ECPA participation. These were measured in section
one of the questionnaire. A limitation of the study was that the physical environment
beyond the school was not measured, yet, ECPA was controlled for by making sure
that it was offered to students in all schools involved. In terms of demographics, the
study focussed on adolescent males (aged 12-15 years) from disadvantaged
backgrounds.
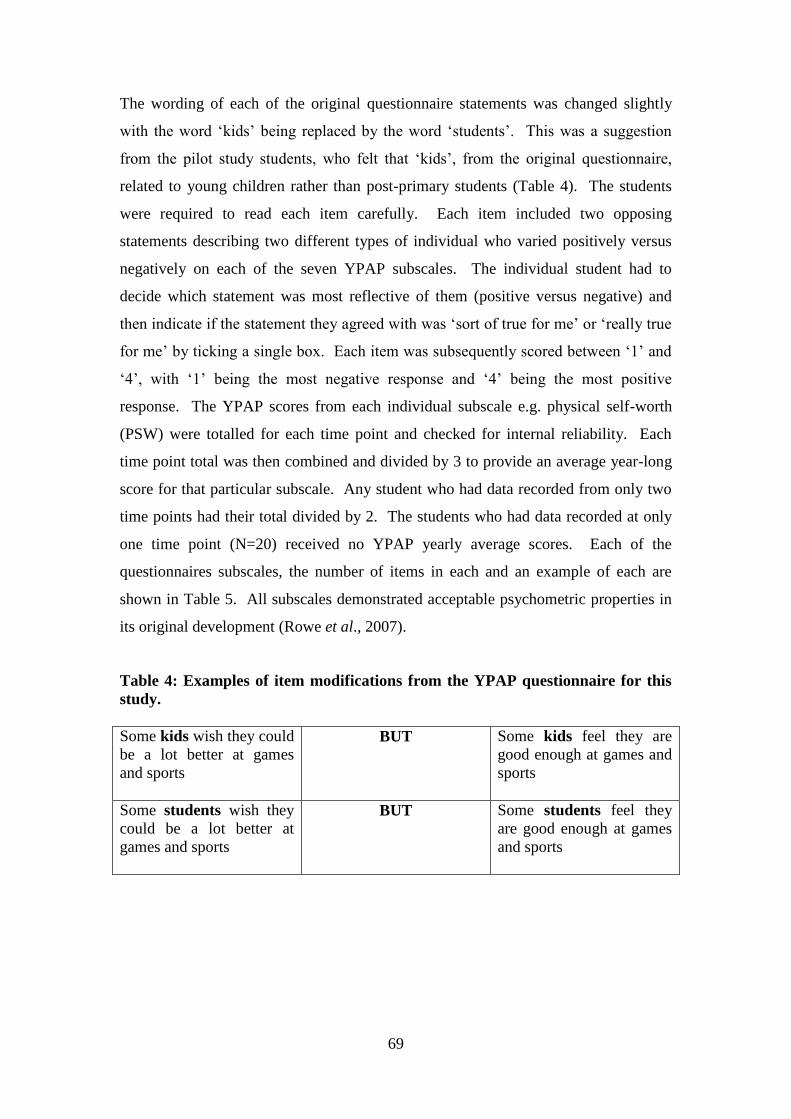
69
The wording of each of the original questionnaire statements was changed slightly
with the word ‘kids’ being replaced by the word ‘students’. This was a suggestion
from the pilot study students, who felt that ‘kids’, from the original questionnaire,
related to young children rather than post-primary students (Table 4). The students
were required to read each item carefully. Each item included two opposing
statements describing two different types of individual who varied positively versus
negatively on each of the seven YPAP subscales. The individual student had to
decide which statement was most reflective of them (positive versus negative) and
then indicate if the statement they agreed with was ‘sort of true for me’ or ‘really true
for me’ by ticking a single box. Each item was subsequently scored between ‘1’ and
‘4’, with ‘1’ being the most negative response and ‘4’ being the most positive
response. The YPAP scores from each individual subscale e.g. physical self-worth
(PSW) were totalled for each time point and checked for internal reliability. Each
time point total was then combined and divided by 3 to provide an average year-long
score for that particular subscale. Any student who had data recorded from only two
time points had their total divided by 2. The students who had data recorded at only
one time point (N=20) received no YPAP yearly average scores. Each of the
questionnaires subscales, the number of items in each and an example of each are
shown in Table 5. All subscales demonstrated acceptable psychometric properties in
its original development (Rowe et al., 2007).
Table 4: Examples of item modifications from the YPAP questionnaire for this
study.
Some kids wish they could
be a lot better at games
and sports
BUT Some kids feel they are
good enough at games and
sports
Some students wish they
could be a lot better at
games and sports
BUT Some students feel they
are good enough at games
and sports
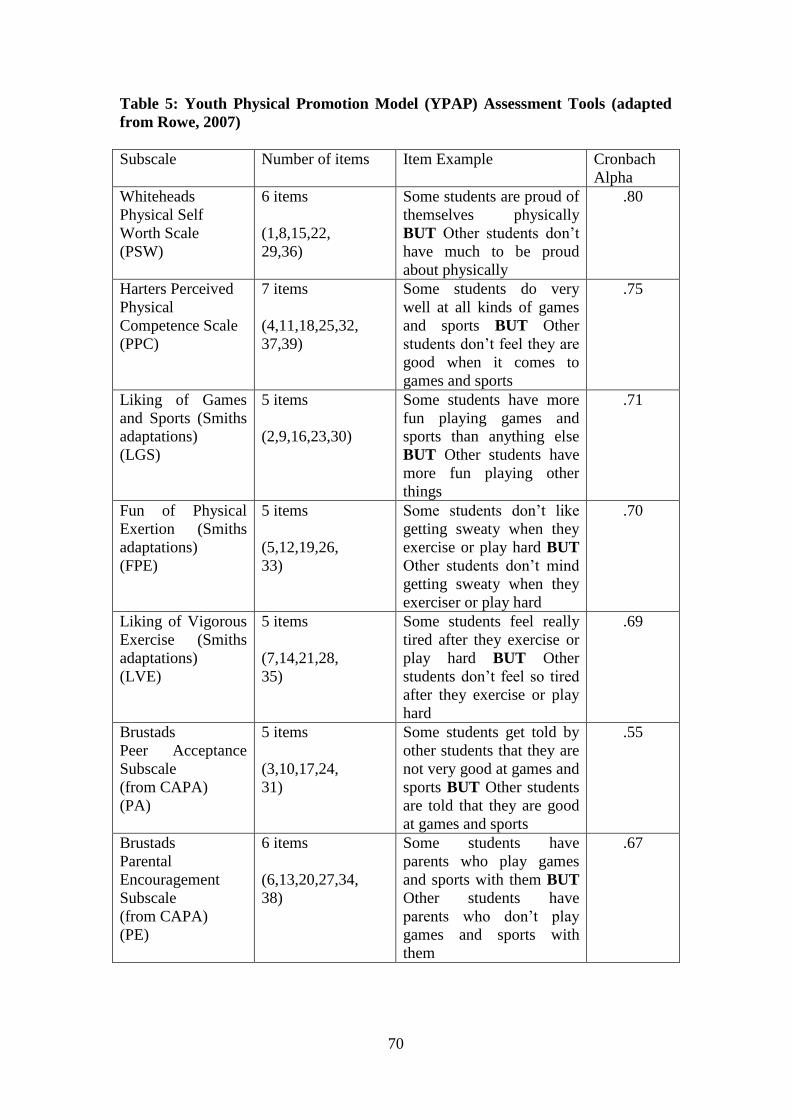
70
Table 5: Youth Physical Promotion Model (YPAP) Assessment Tools (adapted
from Rowe, 2007)
Subscale
Number of items Item Example Cronbach
Alpha
Whiteheads
Physical Self
Worth Scale
(PSW)
6 items
(1,8,15,22,
29,36)
Some students are proud of
themselves physically
BUT Other students don’t
have much to be proud
about physically
.80
Harters Perceived
Physical
Competence Scale
(PPC)
7 items
(4,11,18,25,32,
37,39)
Some students do very
well at all kinds of games
and sports BUT Other
students don’t feel they are
good when it comes to
games and sports
.75
Liking of Games
and Sports (Smiths
adaptations)
(LGS)
5 items
(2,9,16,23,30)
Some students have more
fun playing games and
sports than anything else
BUT Other students have
more fun playing other
things
.71
Fun of Physical
Exertion (Smiths
adaptations)
(FPE)
5 items
(5,12,19,26,
33)
Some students don’t like
getting sweaty when they
exercise or play hard BUT
Other students don’t mind
getting sweaty when they
exerciser or play hard
.70
Liking of Vigorous
Exercise (Smiths
adaptations)
(LVE)
5 items
(7,14,21,28,
35)
Some students feel really
tired after they exercise or
play hard BUT Other
students don’t feel so tired
after they exercise or play
hard
.69
Brustads
Peer Acceptance
Subscale
(from CAPA)
(PA)
5 items
(3,10,17,24,
31)
Some students get told by
other students that they are
not very good at games and
sports BUT Other students
are told that they are good
at games and sports
.55
Brustads
Parental
Encouragement
Subscale
(from CAPA)
(PE)
6 items
(6,13,20,27,34,
38)
Some students have
parents who play games
and sports with them BUT
Other students have
parents who don’t play
games and sports with
them
.67
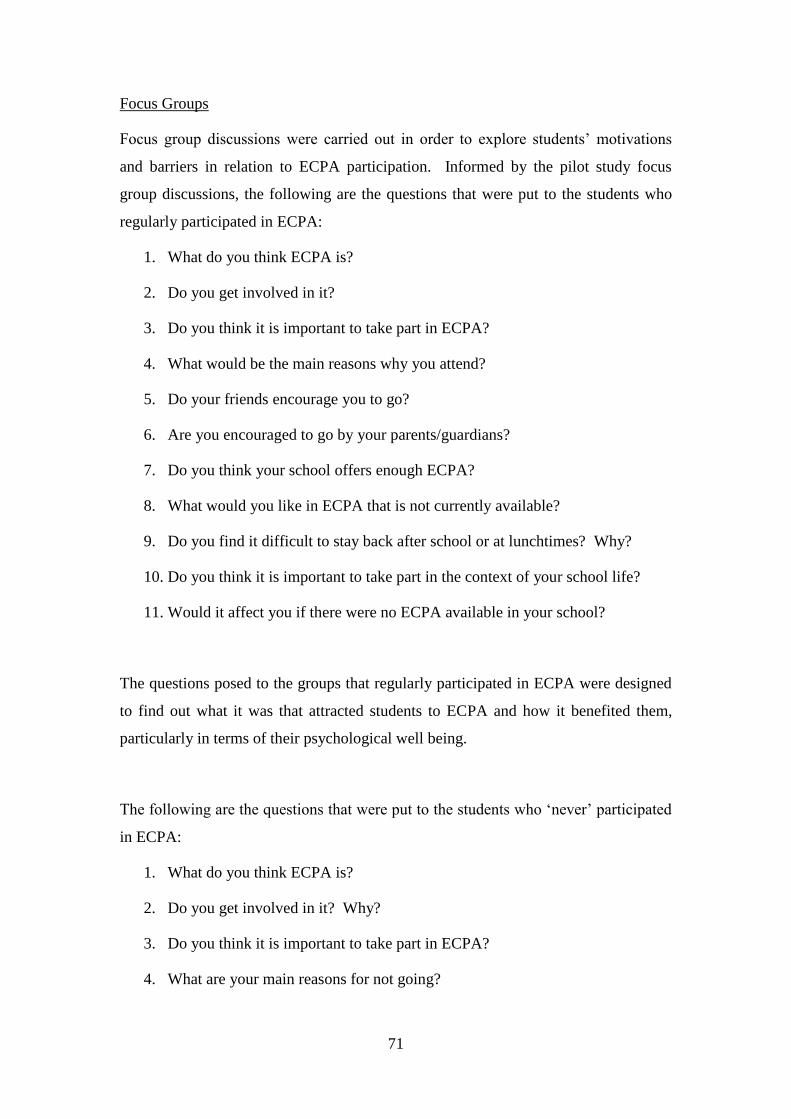
71
Focus Groups
Focus group discussions were carried out in order to explore students’ motivations
and barriers in relation to ECPA participation. Informed by the pilot study focus
group discussions, the following are the questions that were put to the students who
regularly participated in ECPA:
1. What do you think ECPA is?
2. Do you get involved in it?
3. Do you think it is important to take part in ECPA?
4. What would be the main reasons why you attend?
5. Do your friends encourage you to go?
6. Are you encouraged to go by your parents/guardians?
7. Do you think your school offers enough ECPA?
8. What would you like in ECPA that is not currently available?
9. Do you find it difficult to stay back after school or at lunchtimes? Why?
10. Do you think it is important to take part in the context of your school life?
11. Would it affect you if there were no ECPA available in your school?
The questions posed to the groups that regularly participated in ECPA were designed
to find out what it was that attracted students to ECPA and how it benefited them,
particularly in terms of their psychological well being.
The following are the questions that were put to the students who ‘never’ participated
in ECPA:
1. What do you think ECPA is?
2. Do you get involved in it? Why?
3. Do you think it is important to take part in ECPA?
4. What are your main reasons for not going?
72
5. Do you think you would benefit from going to ECPA more often?
6. Do you think that the students who attend on a regular basis are benefiting
from it? How?
7. Do your friends encourage you to go?
8. Are you encouraged to go by your parents/guardians?
9. Do you find it difficult to stay back after school or at lunchtimes?
10. What would make you attend more often?
11. Do you think your school offers enough ECPA?
12. What activities would you like to take part in, that are not currently available?
The questions posed to the ‘never’ ECPA participation group were designed to
examine the reasons behind their lack of participation in ECPA and what, if anything,
might entice them to participate more often. The same two sets of questions were
repeated at each round of the study to find out if students’ responses would be
consistent throughout the school year.
Pedometer Step Count
Physical activity was assessed using a Yamax Digiwalker SW200 pedometer (with a
tamperproof cover) worn over a period of seven days. These particular pedometers
have been accurate in measuring steps taken and have good instrument reliability
(Bassett et al., 1996; Belton et al., 2010 Crouter, Schneider, Karabulut and Bassett,
2003; Schneider, Cruder, Lukajic and Bassett, 2003).
The 7-day (Friday-Thursday) pedometer step counts were recorded by each student in
their pedometer diaries. The Friday step count total was disregarded in data analysis,
as this was the day pedometers were distributed to students in all four schools. Due to
the students receiving their pedometers at different times of the day, it was decided
not to include Friday as part of the weekly total. A 6-day step count was totalled at
each data collection time point. This number was then divided by six in order to get
73
an average daily step count per time point. The combined average daily step count
(sum of T1 + T2 + T3) for each student was then divided by three in order to get an
overall average daily step count across the school year. For those who only had data
from two time points (N=16), the total was divided by two in order to get the year-
long average. The students who had data collected at only one time point (N=76)
received no average year-long step count. The distribution and collection days were
omitted from the analysis due to the variability of time in which students received
their pedometers. The same process applied to weekend day step counts, which were
worked out by totalling the Saturday and Sunday step counts and dividing by 2.
3.5 Data Process
Data Storage
All data were labelled in order to avoid confusion, and to ensure suitability for
tracking purposes, after each round of data collection. All hard copy questionnaires,
step count recording diaries and focus group recording tapes, were stored securely in a
locked room.
Data Entry
All questionnaire and pedometer data were entered into Statistical Package for Social
Sciences (SPSS 17.0). Each set of data results at every time point was coded
appropriately to enable the researcher to compare results from time point to time
point. Focus group recordings were transcribed onto a word document and again,
each time point was clearly labelled to enable the researcher to compare responses
throughout the 3 separate time points.
Data Cleaning
In order to clean the data, SPSS, 17.0 was used. Descriptive statistics and frequency
analysis were used to detect missing data. Manual cleaning of the data by the
researcher also took place after each round of data collection to identify any unusual
results or figures. No unusual figures were present. Any missing data was coded as
999. Unfortunately, at time 1 (autumn), a large proportion of students (n=20) from
74
one of the schools did not return pedometers. A decision was made which allowed
that particular schools’ students continue to participate in the study, however, they did
not receive pedometers at time 2 (winter) and time 3 (summer). In order to ascertain
students’ average Habitual Physical Activity (HPA) level, average weekly pedometer
step count and average YPAP score over the school year, data from each of the time
points was combined and divided by three. For those who had 2 rounds complete, the
data was combined and divided by 2. Only those participants who had a minimum of
2 rounds of data were included in average yearly HPA, ECPA and step count analysis.
Data Analysis
Quantitative data
Self-report measures were tested for internal consistency and reliability using
Cronbach Alpha (α) where applicable. Table 6 shows that six out of the seven YPAP
subscales were above the 0.7 criterion for good reliability. Liking of Vigorous
Exercise (LVE) was the only subscale that was below the 0.7 criterion for good
reliability, however, given the sample size and its previous consistency in testing
(Table 4), it was deemed acceptably reliable. Table 6 shows that other YPAP
subscales were above the 0.7 criterion for good reliability. The data were explored for
homogeneity of variance, covariance, normality and outliers. Descriptive statistics and
frequency analyses were conducted to assess means, standard deviations, minimums,
maximums and percentages with figures and tables representing this data where
appropriate. Paired sample T-tests and one way ANOVAs (F) with Tukey post-hoc
tests were used to compare the means of interval parametric data and reveal where the
difference lay. Categorical data, such as year group categories (1st, 2
nd, 3
rd) and
ECPA participation levels (never, sometimes, regularly) were analysed using
Pearson’s Chi-square test (2). Pearson’s correlations coefficients (r) were used to
examine correlations between interval data. Repeated measures ANOVAs were used
to investigate differences within the group over the three time points. Greenhouse
geisser, Huynh-Feldt corrections were applied to control for sphericity and Bonferroni
post–hoc comparisons, with conservative p=<0.01 were used to establish where
differences lay. Multiple linear logistic regression analysis was used to examine
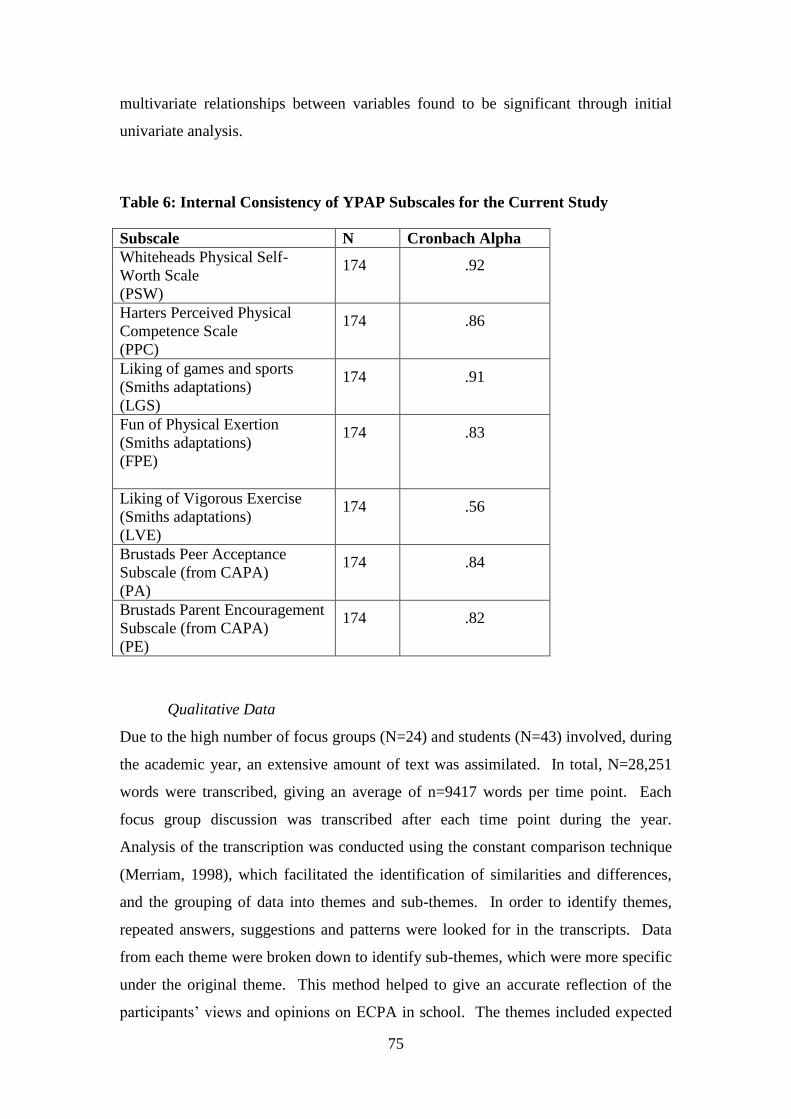
75
multivariate relationships between variables found to be significant through initial
univariate analysis.
Table 6: Internal Consistency of YPAP Subscales for the Current Study
Subscale N Cronbach Alpha
Whiteheads Physical Self-
Worth Scale
(PSW)
174 .92
Harters Perceived Physical
Competence Scale
(PPC)
174 .86
Liking of games and sports
(Smiths adaptations)
(LGS)
174 .91
Fun of Physical Exertion
(Smiths adaptations)
(FPE)
174 .83
Liking of Vigorous Exercise
(Smiths adaptations)
(LVE)
174 .56
Brustads Peer Acceptance
Subscale (from CAPA)
(PA)
174 .84
Brustads Parent Encouragement
Subscale (from CAPA)
(PE)
174 .82
Qualitative Data
Due to the high number of focus groups (N=24) and students (N=43) involved, during
the academic year, an extensive amount of text was assimilated. In total, N=28,251
words were transcribed, giving an average of n=9417 words per time point. Each
focus group discussion was transcribed after each time point during the year.
Analysis of the transcription was conducted using the constant comparison technique
(Merriam, 1998), which facilitated the identification of similarities and differences,
and the grouping of data into themes and sub-themes. In order to identify themes,
repeated answers, suggestions and patterns were looked for in the transcripts. Data
from each theme were broken down to identify sub-themes, which were more specific
under the original theme. This method helped to give an accurate reflection of the
participants’ views and opinions on ECPA in school. The themes included expected
76
information as well as other emergent themes, which revealed interesting insights.
The transcripts and a list of the themes and sub-themes were read over by a
supervisor. After much discussion, when all the themes and sub-themes were agreed
on, the most applicable and interesting quotes from participants were used to highlight
the main themes that emerged from the transcripts (Appendix G).
For this study, a variety of strategies were used to ensure data trustworthiness and
credibility. Participant verification was simply repeating to the students, after each
focus group discussion, the main conclusions from the discussions, in order to verify
that they were a true and accurate reflection of their views and opinions. Another
strategy involved peer de-briefing, whereby, as already mentioned, a supervisor read
over the text and agreed on the themes and sub-themes identified by the researcher.
According to Creswell and Plano Clark (2007) one way of increasing trustworthiness
is to utilize multiple methods of data collection so that the limitations of one method
can be offset against the strengths of another. Tashakkori & Teddlie (2003) refer to
the triangulation of data as combinations and comparisons of many data sources,
which can include data collection, research methods and analysis procedures. This
study combines quantitative data (self-report questionnaires and pedometer step
count) with qualitative data, giving support to emerging themes from either source to
improve the validity of the findings. Finally, Lincoln and Guba, (1985) suggest that
prolonged engagement can maximize trustworthiness. The longitudinal approach to
this study required the researcher to be in all four schools involved on numerous
occasions throughout the academic year.
77
Chapter Four –Quantitative Data
4.0 Results and Discussion
This chapter will present the findings of the quantitative study in three separate
sections. Section 4.1 will outline the demographics, section 4.2 will focus on the
behavioural data including habitual physical activity (HPA), extra-curricular physical
activity (ECPA), and pedometer step counts. Section 4.3 will examine the
psychosocial data based on the Youth Physical Activity Promotion model (YPAP,
Welk, 1999) and section 4.4 will conclude the chapter with a discussion of the
findings in light of relevant literature.
4.1 Demographic Characteristics of the Sample and Numbers per Time Interval
Four north-side, City of Dublin Vocational Education Committee (CDVEC) post-
primary schools were involved in this study. In total, N=174 Junior Cycle, adolescent
males (aged 12-15 years, mean age 13.59 + .91) participated in the study. School 1
contributed 22% (n=39), school 2, 18% (n=31), school 3, 22% (n=39) and school 4,
38% (n=65). The retention rate over the duration of the study was high with 98% of
time 1 participants involved at time 2, and 89% of time 2 participants engaged at time
3. No significant differences were found between the time points in terms of
participants’ age or year group.
Distributions for questionnaire and focus groups were similar across all three time
points. However, pedometer step count data was subject to change. At time 1, 146
participants completed step count diaries, this dropped to 96 at time 2 (66% retention)
and 84 at time 3 (88% retention of time 2). The drop in retention from time 1 to time
2 was due to a single school. In school 4, 20 students (31% of sample within this
school) did not return pedometers at the end of the first recording week. Due to
financial implications, a decision was made to remove the pedometers from this
school for future data collection time points and collect only questionnaire and focus
group information. Descriptive statistics for the participants are presented in Table 7.
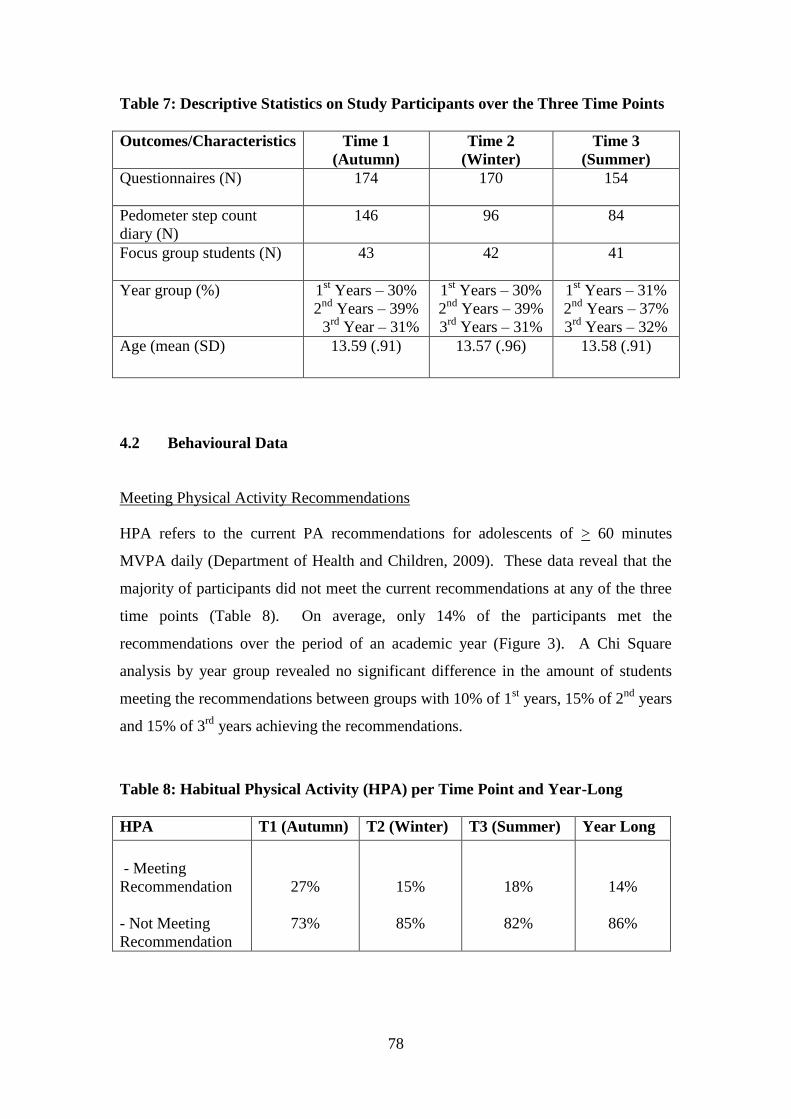
78
Table 7: Descriptive Statistics on Study Participants over the Three Time Points
Outcomes/Characteristics Time 1
(Autumn)
Time 2
(Winter)
Time 3
(Summer)
Questionnaires (N)
174 170 154
Pedometer step count
diary (N)
146 96 84
Focus group students (N)
43 42 41
Year group (%)
1st Years – 30%
2nd
Years – 39%
3rd
Year – 31%
1st Years – 30%
2nd
Years – 39%
3rd
Years – 31%
1st Years – 31%
2nd
Years – 37%
3rd
Years – 32%
Age (mean (SD) 13.59 (.91) 13.57 (.96) 13.58 (.91)
4.2 Behavioural Data
Meeting Physical Activity Recommendations
HPA refers to the current PA recommendations for adolescents of > 60 minutes
MVPA daily (Department of Health and Children, 2009). These data reveal that the
majority of participants did not meet the current recommendations at any of the three
time points (Table 8). On average, only 14% of the participants met the
recommendations over the period of an academic year (Figure 3). A Chi Square
analysis by year group revealed no significant difference in the amount of students
meeting the recommendations between groups with 10% of 1st years, 15% of 2
nd years
and 15% of 3rd
years achieving the recommendations.
Table 8: Habitual Physical Activity (HPA) per Time Point and Year-Long
HPA T1 (Autumn) T2 (Winter) T3 (Summer) Year Long
- Meeting
Recommendation
- Not Meeting
Recommendation
27%
73%
15%
85%
18%
82%
14%
86%
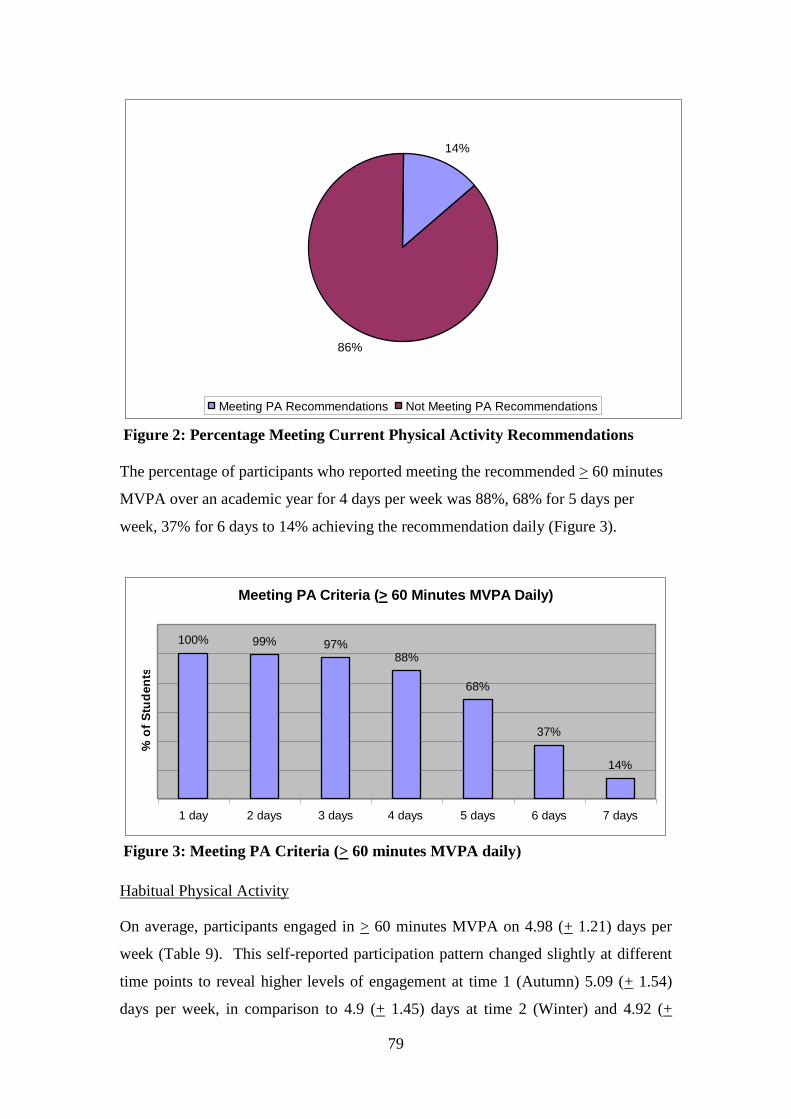
79
14%
86%
Meeting PA Recommendations Not Meeting PA Recommendations
Figure 2: Percentage Meeting Current Physical Activity Recommendations
The percentage of participants who reported meeting the recommended > 60 minutes
MVPA over an academic year for 4 days per week was 88%, 68% for 5 days per
week, 37% for 6 days to 14% achieving the recommendation daily (Figure 3).
Meeting PA Criteria (> 60 Minutes MVPA Daily)
99% 97%88%
68%
37%
14%
100%
1 day 2 days 3 days 4 days 5 days 6 days 7 days
% o
f S
tud
en
ts
Figure 3: Meeting PA Criteria (> 60 minutes MVPA daily)
Habitual Physical Activity
On average, participants engaged in > 60 minutes MVPA on 4.98 (+ 1.21) days per
week (Table 9). This self-reported participation pattern changed slightly at different
time points to reveal higher levels of engagement at time 1 (Autumn) 5.09 (+ 1.54)
days per week, in comparison to 4.9 (+ 1.45) days at time 2 (Winter) and 4.92 (+
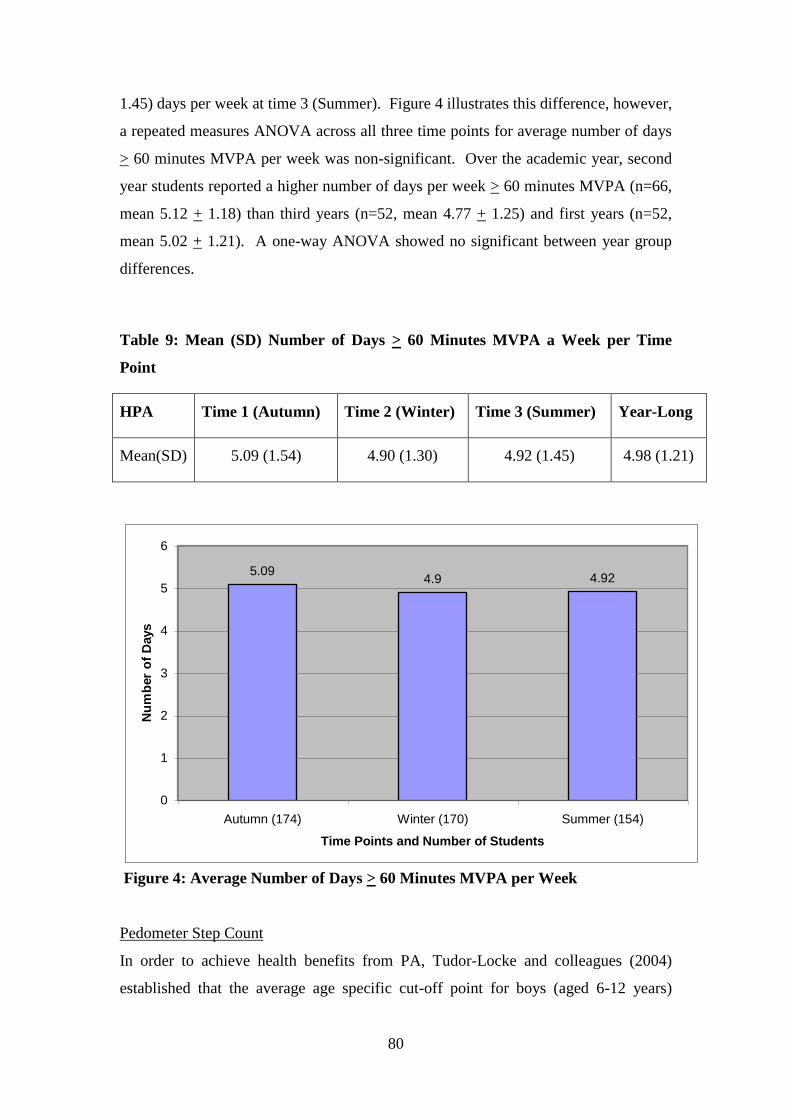
80
1.45) days per week at time 3 (Summer). Figure 4 illustrates this difference, however,
a repeated measures ANOVA across all three time points for average number of days
> 60 minutes MVPA per week was non-significant. Over the academic year, second
year students reported a higher number of days per week > 60 minutes MVPA (n=66,
mean 5.12 + 1.18) than third years (n=52, mean 4.77 + 1.25) and first years (n=52,
mean 5.02 + 1.21). A one-way ANOVA showed no significant between year group
differences.
Table 9: Mean (SD) Number of Days > 60 Minutes MVPA a Week per Time
Point
HPA Time 1 (Autumn) Time 2 (Winter) Time 3 (Summer) Year-Long
Mean(SD) 5.09 (1.54) 4.90 (1.30) 4.92 (1.45) 4.98 (1.21)
5.094.9 4.92
0
1
2
3
4
5
6
Autumn (174) Winter (170) Summer (154)
Time Points and Number of Students
Nu
mb
er
of
Days
Figure 4: Average Number of Days > 60 Minutes MVPA per Week
Pedometer Step Count
In order to achieve health benefits from PA, Tudor-Locke and colleagues (2004)
established that the average age specific cut-off point for boys (aged 6-12 years)
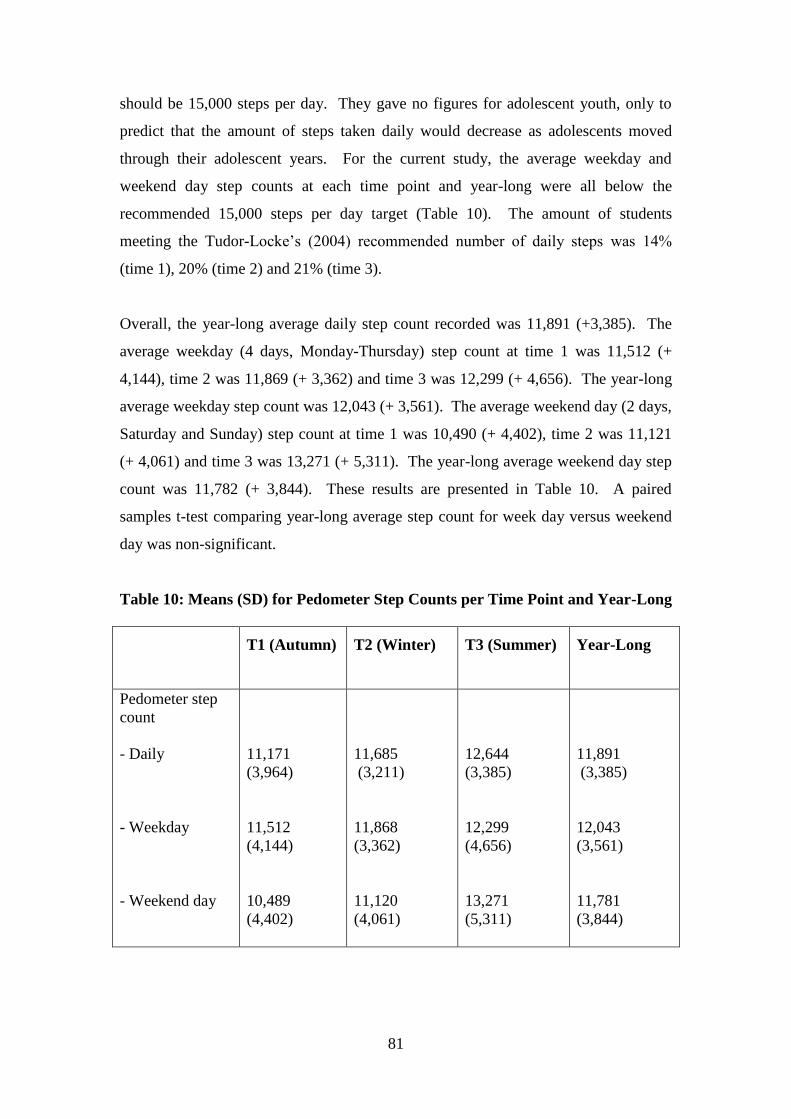
81
should be 15,000 steps per day. They gave no figures for adolescent youth, only to
predict that the amount of steps taken daily would decrease as adolescents moved
through their adolescent years. For the current study, the average weekday and
weekend day step counts at each time point and year-long were all below the
recommended 15,000 steps per day target (Table 10). The amount of students
meeting the Tudor-Locke’s (2004) recommended number of daily steps was 14%
(time 1), 20% (time 2) and 21% (time 3).
Overall, the year-long average daily step count recorded was 11,891 (+3,385). The
average weekday (4 days, Monday-Thursday) step count at time 1 was 11,512 (+
4,144), time 2 was 11,869 (+ 3,362) and time 3 was 12,299 (+ 4,656). The year-long
average weekday step count was 12,043 (+ 3,561). The average weekend day (2 days,
Saturday and Sunday) step count at time 1 was 10,490 (+ 4,402), time 2 was 11,121
(+ 4,061) and time 3 was 13,271 (+ 5,311). The year-long average weekend day step
count was 11,782 (+ 3,844). These results are presented in Table 10. A paired
samples t-test comparing year-long average step count for week day versus weekend
day was non-significant.
Table 10: Means (SD) for Pedometer Step Counts per Time Point and Year-Long
T1 (Autumn) T2 (Winter) T3 (Summer) Year-Long
Pedometer step
count
- Daily
- Weekday
- Weekend day
11,171
(3,964)
11,512
(4,144)
10,489
(4,402)
11,685
(3,211)
11,868
(3,362)
11,120
(4,061)
12,644
(3,385)
12,299
(4,656)
13,271
(5,311)
11,891
(3,385)
12,043
(3,561)
11,781
(3,844)

82
The average daily step count at time 1 (Autumn) was 11,171 (+ 3,964, N=146). Data
from time 2 (Winter) was higher with an average daily step count recorded as 11,685
(+ 3,211, N=96). Time 3 (Summer) showed a further increase in participants average
daily step count of 12,644 (+ 3,385, N=84), (Figure 5). A repeated measures
ANOVA conducted across all three time points for average daily step count was
significant F=(153, 2) 5.025, p<0.01 (greenhouse geisser and Huynh-Feldt). Post-hoc
Bonferroni tests revealed that time 1 was significantly lower than both time 2 and 3,
and that time 2 was significantly lower than time 3.
11,171
11,685
12,644
10,000
10,500
11,000
11,500
12,000
12,500
13,000
Autumn (146) Winter (96) Summer (84)
Time Point and Number of Students
Nu
mb
er
of
Ste
ps
Figure 5: Average Daily step Count per Time Point
Figure 6 shows the year-long average daily step count for participants who completed
pedometer step count diaries by each of the three year groups. Supporting the self-
report data, second year students recorded the greatest average daily step count
(12,526.3 + 3,733, N=39) with a decrease shown from second year to third year
(11,800.9 + 3,222, N=32). First year students showed the lowest average daily step
count (11,081.8 + 2,851, N=27). A one-way ANOVA revealed no significant
difference between the year groups.
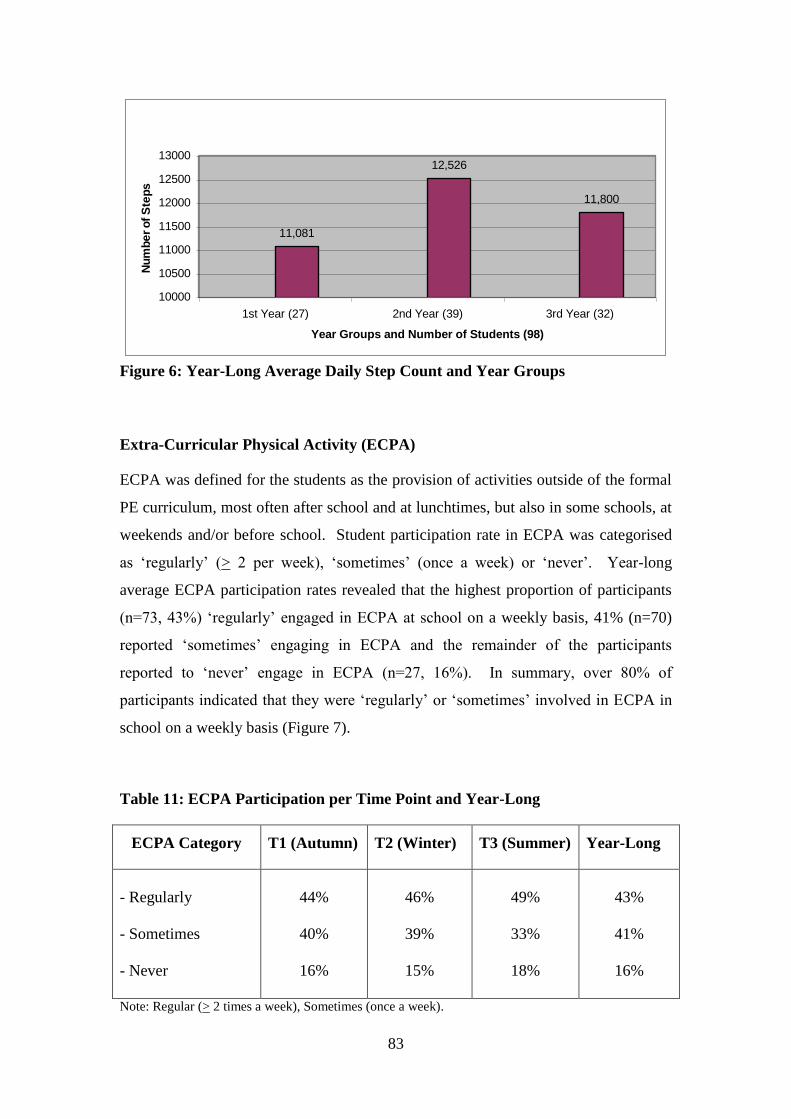
83
11,081
12,526
11,800
10000
10500
11000
11500
12000
12500
13000
1st Year (27) 2nd Year (39) 3rd Year (32)
Year Groups and Number of Students (98)
Nu
mb
er
of
Ste
ps
Figure 6: Year-Long Average Daily Step Count and Year Groups
Extra-Curricular Physical Activity (ECPA)
ECPA was defined for the students as the provision of activities outside of the formal
PE curriculum, most often after school and at lunchtimes, but also in some schools, at
weekends and/or before school. Student participation rate in ECPA was categorised
as ‘regularly’ (> 2 per week), ‘sometimes’ (once a week) or ‘never’. Year-long
average ECPA participation rates revealed that the highest proportion of participants
(n=73, 43%) ‘regularly’ engaged in ECPA at school on a weekly basis, 41% (n=70)
reported ‘sometimes’ engaging in ECPA and the remainder of the participants
reported to ‘never’ engage in ECPA (n=27, 16%). In summary, over 80% of
participants indicated that they were ‘regularly’ or ‘sometimes’ involved in ECPA in
school on a weekly basis (Figure 7).
Table 11: ECPA Participation per Time Point and Year-Long
ECPA Category T1 (Autumn) T2 (Winter) T3 (Summer) Year-Long
- Regularly
- Sometimes
- Never
44%
40%
16%
46%
39%
15%
49%
33%
18%
43%
41%
16%
Note: Regular (> 2 times a week), Sometimes (once a week).
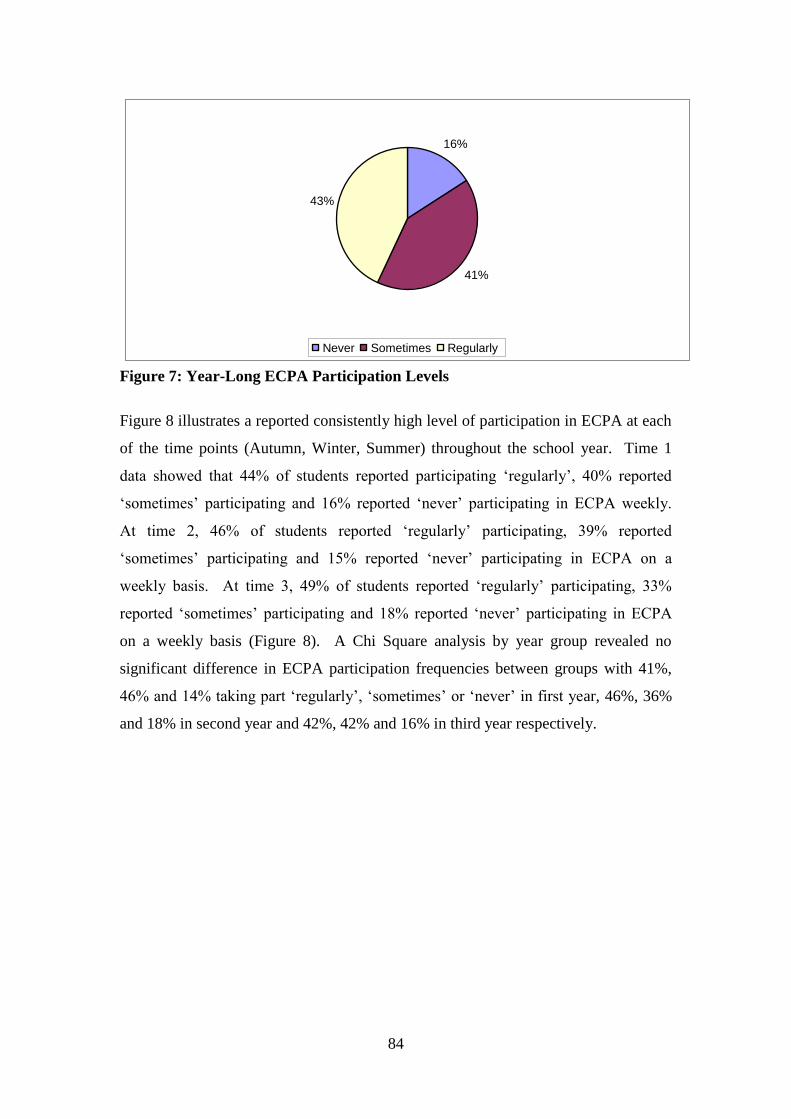
84
16%
41%
43%
Never Sometimes Regularly
Figure 7: Year-Long ECPA Participation Levels
Figure 8 illustrates a reported consistently high level of participation in ECPA at each
of the time points (Autumn, Winter, Summer) throughout the school year. Time 1
data showed that 44% of students reported participating ‘regularly’, 40% reported
‘sometimes’ participating and 16% reported ‘never’ participating in ECPA weekly.
At time 2, 46% of students reported ‘regularly’ participating, 39% reported
‘sometimes’ participating and 15% reported ‘never’ participating in ECPA on a
weekly basis. At time 3, 49% of students reported ‘regularly’ participating, 33%
reported ‘sometimes’ participating and 18% reported ‘never’ participating in ECPA
on a weekly basis (Figure 8). A Chi Square analysis by year group revealed no
significant difference in ECPA participation frequencies between groups with 41%,
46% and 14% taking part ‘regularly’, ‘sometimes’ or ‘never’ in first year, 46%, 36%
and 18% in second year and 42%, 42% and 16% in third year respectively.
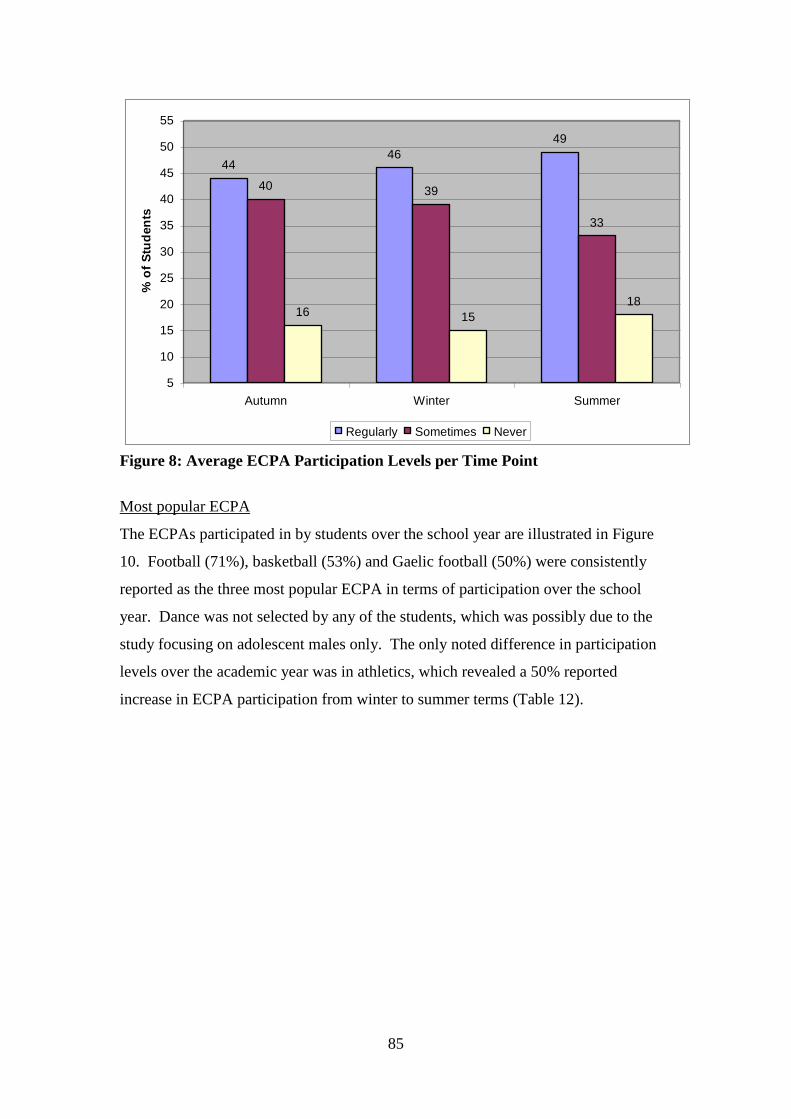
85
4446
49
40 39
33
16 15
18
5
10
15
20
25
30
35
40
45
50
55
Autumn Winter Summer
% o
f S
tud
en
ts
Regularly Sometimes Never
Figure 8: Average ECPA Participation Levels per Time Point
Most popular ECPA
The ECPAs participated in by students over the school year are illustrated in Figure
10. Football (71%), basketball (53%) and Gaelic football (50%) were consistently
reported as the three most popular ECPA in terms of participation over the school
year. Dance was not selected by any of the students, which was possibly due to the
study focusing on adolescent males only. The only noted difference in participation
levels over the academic year was in athletics, which revealed a 50% reported
increase in ECPA participation from winter to summer terms (Table 12).
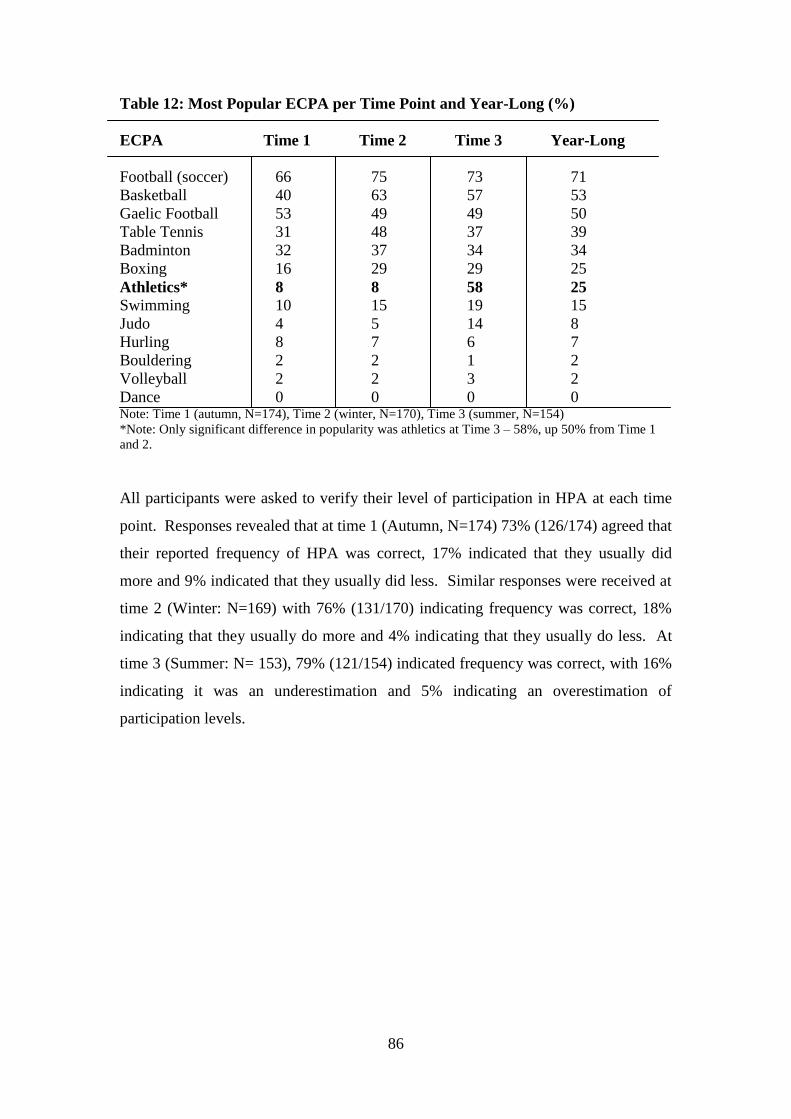
86
Table 12: Most Popular ECPA per Time Point and Year-Long (%)
ECPA Time 1 Time 2 Time 3 Year-Long
Football (soccer) 66 75 73 71
Basketball 40 63 57 53
Gaelic Football 53 49 49 50
Table Tennis 31 48 37 39
Badminton 32 37 34 34
Boxing 16 29 29 25
Athletics* 8 8 58 25
Swimming 10 15 19 15
Judo 4 5 14 8
Hurling 8 7 6 7
Bouldering 2 2 1 2
Volleyball 2 2 3 2
Dance 0 0 0 0 Note: Time 1 (autumn, N=174), Time 2 (winter, N=170), Time 3 (summer, N=154)
*Note: Only significant difference in popularity was athletics at Time 3 – 58%, up 50% from Time 1
and 2.
All participants were asked to verify their level of participation in HPA at each time
point. Responses revealed that at time 1 (Autumn, N=174) 73% (126/174) agreed that
their reported frequency of HPA was correct, 17% indicated that they usually did
more and 9% indicated that they usually did less. Similar responses were received at
time 2 (Winter: N=169) with 76% (131/170) indicating frequency was correct, 18%
indicating that they usually do more and 4% indicating that they usually do less. At
time 3 (Summer: N= 153), 79% (121/154) indicated frequency was correct, with 16%
indicating it was an underestimation and 5% indicating an overestimation of
participation levels.

87
71%
53%50%
39%
34%
25% 25%
15%
8% 7%
2% 2%0%
0%
10%
20%
30%
40%
50%
60%
70%
80%
Footb
all
Bas
ketb
all
Gae
lic F
ootb
all
Table
Ten
nis
Bad
minto
n
Box
ing
Ath
letic
s
Swim
min
g
Judo
Hur
ling
Bou
lder
ing
Vol
leyb
all
Dan
ce
% o
f S
tud
en
ts
Figure 9: Most Popular ECPA
Barriers to Participation in ECPA
Individuals who reported ‘never’ participating in ECPA (N=27, 16%) were given a
choice of four reasons for their lack of participation. The responses come under four
main themes i) perceived competence, ii) lack of enjoyment iii) laziness iv) others.
Perceived competence was the most frequent reason given for lack of engagement in
ECPA, ‘I don’t think I’m good enough’ (n=15, 56%). Laziness was the second most
popular reason reported for ‘rarely/never’ engaging in ECPA, ‘I’m too lazy’ (n=5,
20%). Lack of enjoyment was the third most popular reason given for a lack of
engagement in ECPA, ‘I don’t enjoy PA’ (n=4, 13%). Participants were given the
option of reporting their own specific reason for ‘rarely/never’ engaging in ECPA
under ‘others’. The responses (n=3, 11%) included ‘no time’, ‘have to get home’ and
‘not liking the particular ECPA’. These results are presented in full in Table 13 and
illustrated in Figure 10.
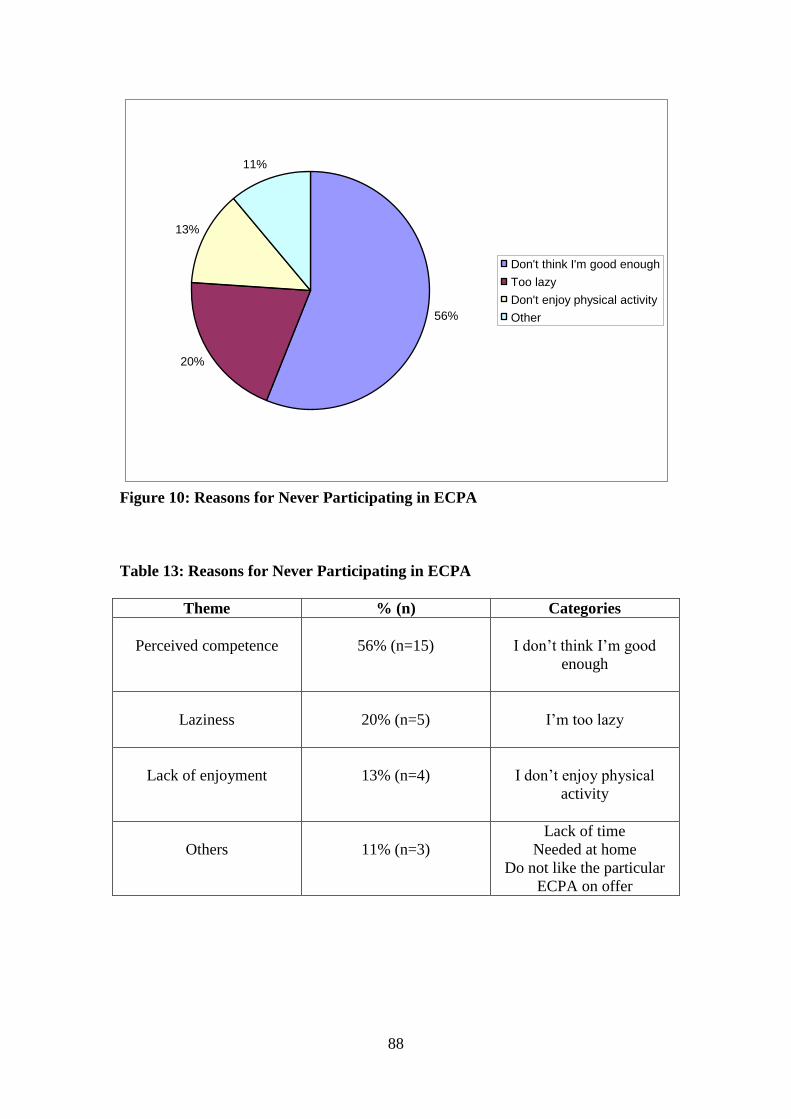
88
56%
20%
13%
11%
Don't think I'm good enough
Too lazy
Don't enjoy physical activity
Other
Figure 10: Reasons for Never Participating in ECPA
Table 13: Reasons for Never Participating in ECPA
Theme % (n) Categories
Perceived competence
56% (n=15)
I don’t think I’m good
enough
Laziness
20% (n=5)
I’m too lazy
Lack of enjoyment
13% (n=4)
I don’t enjoy physical
activity
Others
11% (n=3)
Lack of time
Needed at home
Do not like the particular
ECPA on offer
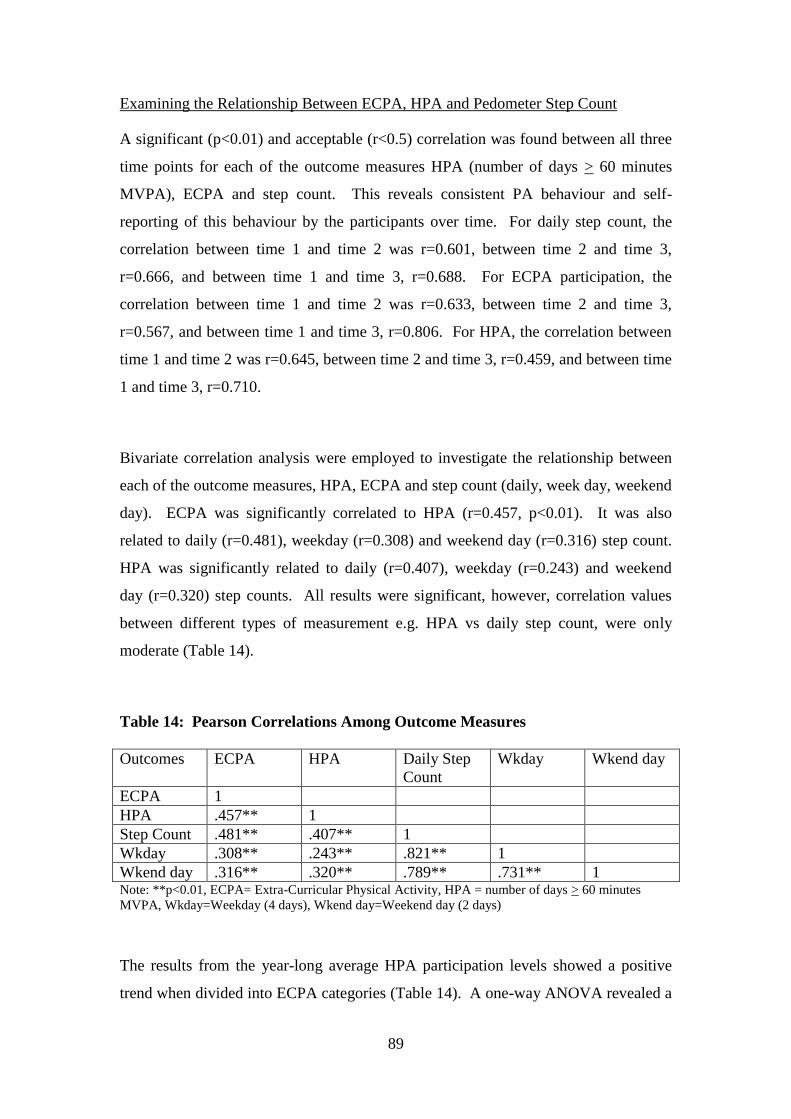
89
Examining the Relationship Between ECPA, HPA and Pedometer Step Count
A significant (p<0.01) and acceptable (r<0.5) correlation was found between all three
time points for each of the outcome measures HPA (number of days > 60 minutes
MVPA), ECPA and step count. This reveals consistent PA behaviour and self-
reporting of this behaviour by the participants over time. For daily step count, the
correlation between time 1 and time 2 was r=0.601, between time 2 and time 3,
r=0.666, and between time 1 and time 3, r=0.688. For ECPA participation, the
correlation between time 1 and time 2 was r=0.633, between time 2 and time 3,
r=0.567, and between time 1 and time 3, r=0.806. For HPA, the correlation between
time 1 and time 2 was r=0.645, between time 2 and time 3, r=0.459, and between time
1 and time 3, r=0.710.
Bivariate correlation analysis were employed to investigate the relationship between
each of the outcome measures, HPA, ECPA and step count (daily, week day, weekend
day). ECPA was significantly correlated to HPA (r=0.457, p<0.01). It was also
related to daily (r=0.481), weekday (r=0.308) and weekend day (r=0.316) step count.
HPA was significantly related to daily (r=0.407), weekday (r=0.243) and weekend
day (r=0.320) step counts. All results were significant, however, correlation values
between different types of measurement e.g. HPA vs daily step count, were only
moderate (Table 14).
Table 14: Pearson Correlations Among Outcome Measures
Outcomes ECPA HPA Daily Step
Count
Wkday Wkend day
ECPA 1
HPA .457** 1
Step Count .481** .407** 1
Wkday .308** .243** .821** 1
Wkend day .316** .320** .789** .731** 1 Note: **p<0.01, ECPA= Extra-Curricular Physical Activity, HPA = number of days > 60 minutes
MVPA, Wkday=Weekday (4 days), Wkend day=Weekend day (2 days)
The results from the year-long average HPA participation levels showed a positive
trend when divided into ECPA categories (Table 14). A one-way ANOVA revealed a
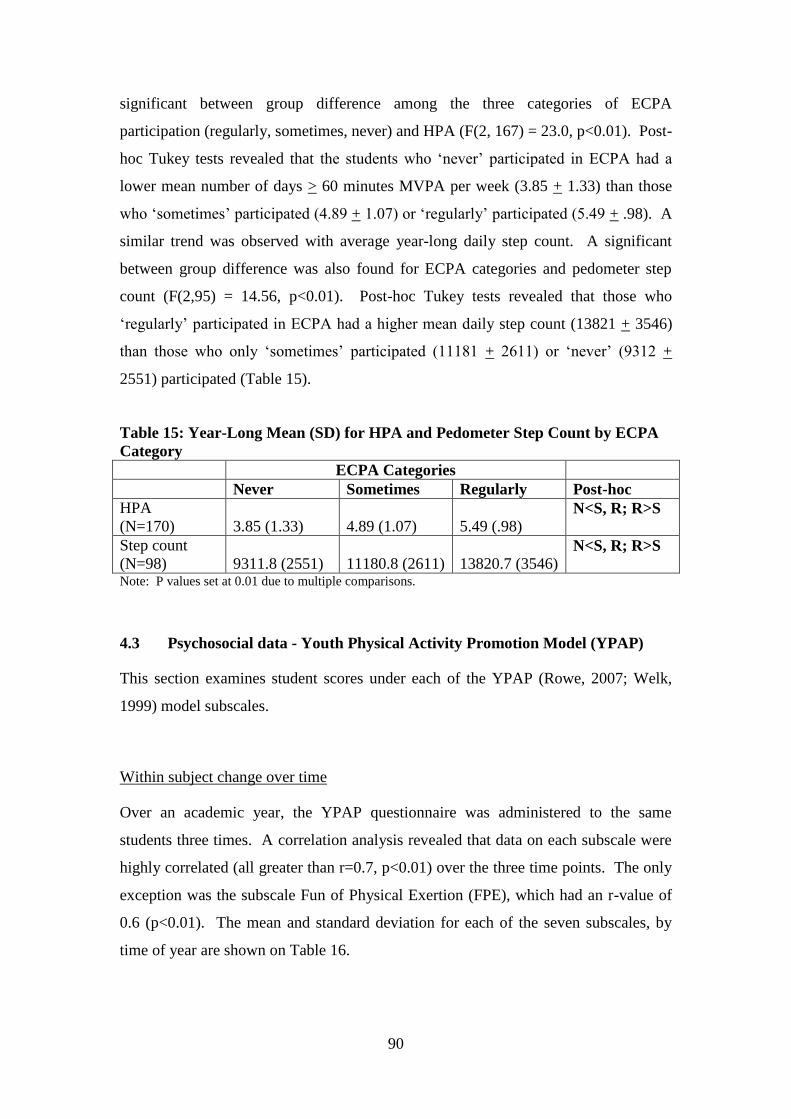
90
significant between group difference among the three categories of ECPA
participation (regularly, sometimes, never) and HPA (F(2, 167) = 23.0, p<0.01). Post-
hoc Tukey tests revealed that the students who ‘never’ participated in ECPA had a
lower mean number of days > 60 minutes MVPA per week (3.85 + 1.33) than those
who ‘sometimes’ participated (4.89 + 1.07) or ‘regularly’ participated (5.49 + .98). A
similar trend was observed with average year-long daily step count. A significant
between group difference was also found for ECPA categories and pedometer step
count (F(2,95) = 14.56, p<0.01). Post-hoc Tukey tests revealed that those who
‘regularly’ participated in ECPA had a higher mean daily step count (13821 + 3546)
than those who only ‘sometimes’ participated (11181 + 2611) or ‘never’ (9312 +
2551) participated (Table 15).
Table 15: Year-Long Mean (SD) for HPA and Pedometer Step Count by ECPA
Category
ECPA Categories
Never Sometimes Regularly Post-hoc
HPA
(N=170)
3.85 (1.33)
4.89 (1.07)
5.49 (.98) N<S, R; R>S
Step count
(N=98)
9311.8 (2551)
11180.8 (2611)
13820.7 (3546) N<S, R; R>S
Note: P values set at 0.01 due to multiple comparisons.
4.3 Psychosocial data - Youth Physical Activity Promotion Model (YPAP)
This section examines student scores under each of the YPAP (Rowe, 2007; Welk,
1999) model subscales.
Within subject change over time
Over an academic year, the YPAP questionnaire was administered to the same
students three times. A correlation analysis revealed that data on each subscale were
highly correlated (all greater than r=0.7, p<0.01) over the three time points. The only
exception was the subscale Fun of Physical Exertion (FPE), which had an r-value of
0.6 (p<0.01). The mean and standard deviation for each of the seven subscales, by
time of year are shown on Table 16.
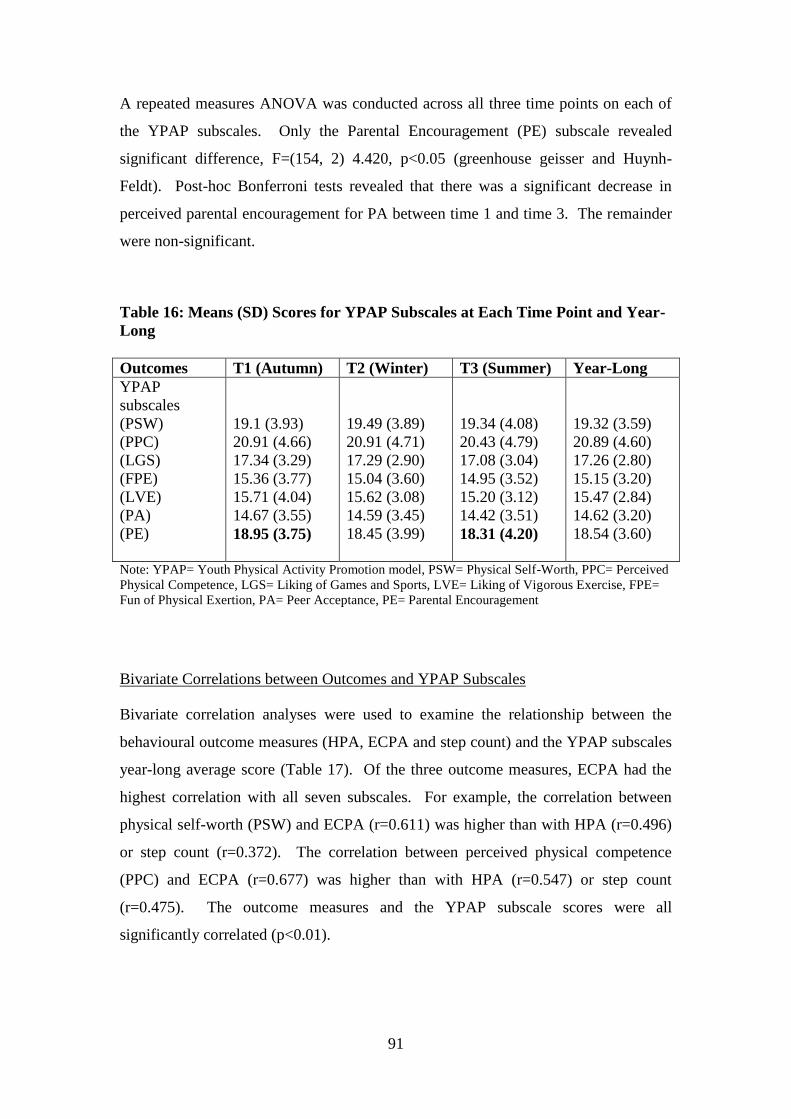
91
A repeated measures ANOVA was conducted across all three time points on each of
the YPAP subscales. Only the Parental Encouragement (PE) subscale revealed
significant difference, F=(154, 2) 4.420, p<0.05 (greenhouse geisser and Huynh-
Feldt). Post-hoc Bonferroni tests revealed that there was a significant decrease in
perceived parental encouragement for PA between time 1 and time 3. The remainder
were non-significant.
Table 16: Means (SD) Scores for YPAP Subscales at Each Time Point and Year-
Long
Outcomes T1 (Autumn) T2 (Winter) T3 (Summer) Year-Long
YPAP
subscales
(PSW)
(PPC)
(LGS)
(FPE)
(LVE)
(PA)
(PE)
19.1 (3.93)
20.91 (4.66)
17.34 (3.29)
15.36 (3.77)
15.71 (4.04)
14.67 (3.55)
18.95 (3.75)
19.49 (3.89)
20.91 (4.71)
17.29 (2.90)
15.04 (3.60)
15.62 (3.08)
14.59 (3.45)
18.45 (3.99)
19.34 (4.08)
20.43 (4.79)
17.08 (3.04)
14.95 (3.52)
15.20 (3.12)
14.42 (3.51)
18.31 (4.20)
19.32 (3.59)
20.89 (4.60)
17.26 (2.80)
15.15 (3.20)
15.47 (2.84)
14.62 (3.20)
18.54 (3.60)
Note: YPAP= Youth Physical Activity Promotion model, PSW= Physical Self-Worth, PPC= Perceived
Physical Competence, LGS= Liking of Games and Sports, LVE= Liking of Vigorous Exercise, FPE=
Fun of Physical Exertion, PA= Peer Acceptance, PE= Parental Encouragement
Bivariate Correlations between Outcomes and YPAP Subscales
Bivariate correlation analyses were used to examine the relationship between the
behavioural outcome measures (HPA, ECPA and step count) and the YPAP subscales
year-long average score (Table 17). Of the three outcome measures, ECPA had the
highest correlation with all seven subscales. For example, the correlation between
physical self-worth (PSW) and ECPA (r=0.611) was higher than with HPA (r=0.496)
or step count (r=0.372). The correlation between perceived physical competence
(PPC) and ECPA (r=0.677) was higher than with HPA (r=0.547) or step count
(r=0.475). The outcome measures and the YPAP subscale scores were all
significantly correlated (p<0.01).
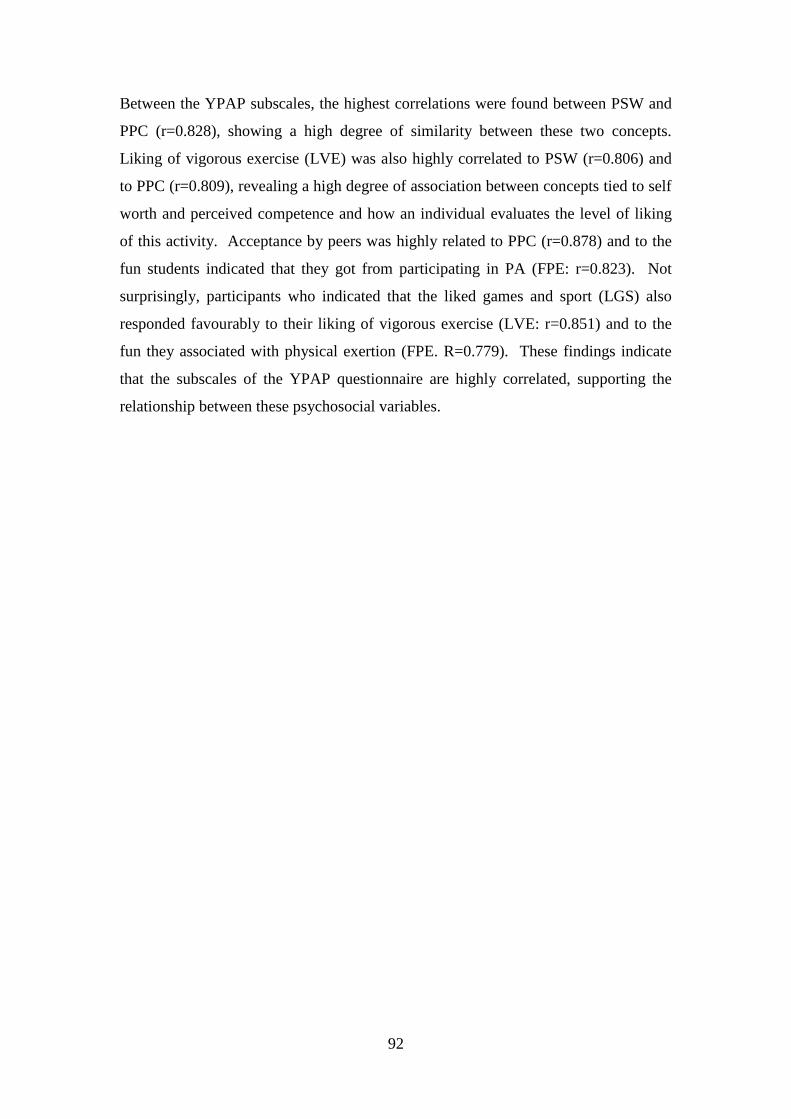
92
Between the YPAP subscales, the highest correlations were found between PSW and
PPC (r=0.828), showing a high degree of similarity between these two concepts.
Liking of vigorous exercise (LVE) was also highly correlated to PSW (r=0.806) and
to PPC (r=0.809), revealing a high degree of association between concepts tied to self
worth and perceived competence and how an individual evaluates the level of liking
of this activity. Acceptance by peers was highly related to PPC (r=0.878) and to the
fun students indicated that they got from participating in PA (FPE: r=0.823). Not
surprisingly, participants who indicated that the liked games and sport (LGS) also
responded favourably to their liking of vigorous exercise (LVE: r=0.851) and to the
fun they associated with physical exertion (FPE. R=0.779). These findings indicate
that the subscales of the YPAP questionnaire are highly correlated, supporting the
relationship between these psychosocial variables.
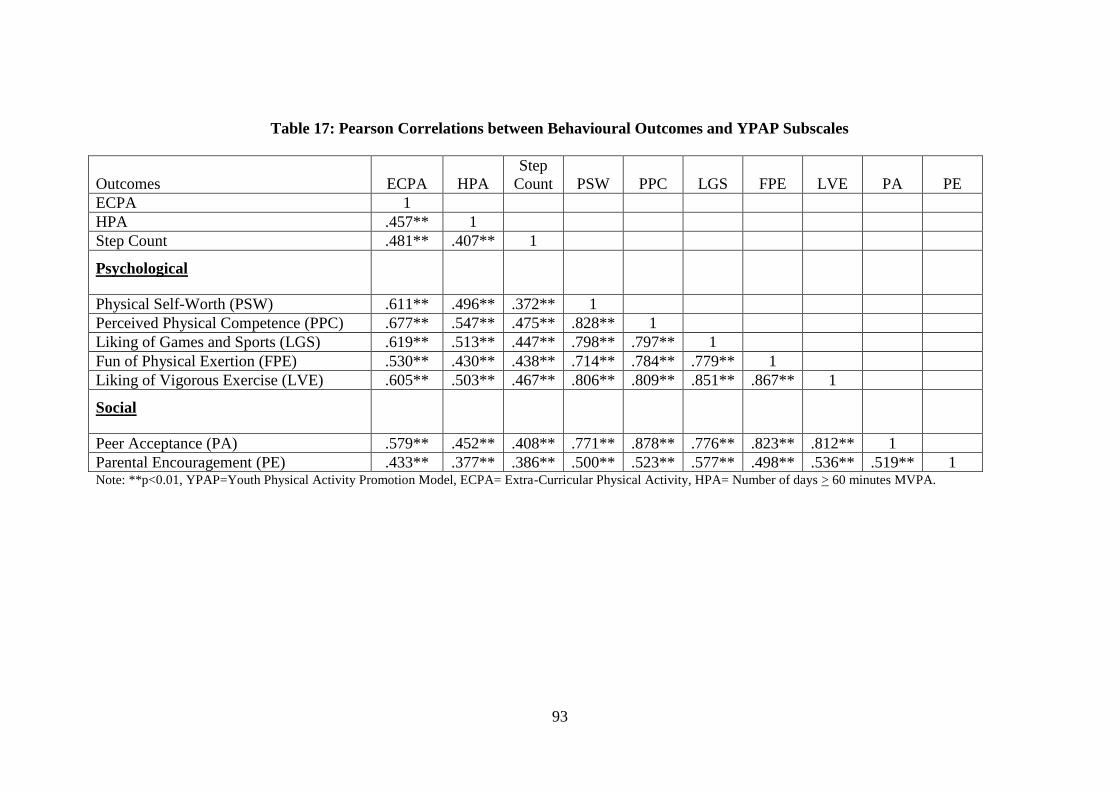
93
Table 17: Pearson Correlations between Behavioural Outcomes and YPAP Subscales
Outcomes
ECPA
HPA
Step
Count
PSW
PPC
LGS
FPE
LVE
PA
PE
ECPA 1
HPA .457** 1
Step Count .481** .407** 1
Psychological
Physical Self-Worth (PSW) .611** .496** .372** 1
Perceived Physical Competence (PPC) .677** .547** .475** .828** 1
Liking of Games and Sports (LGS) .619** .513** .447** .798** .797** 1
Fun of Physical Exertion (FPE) .530** .430** .438** .714** .784** .779** 1
Liking of Vigorous Exercise (LVE) .605** .503** .467** .806** .809** .851** .867** 1
Social
Peer Acceptance (PA) .579** .452** .408** .771** .878** .776** .823** .812** 1
Parental Encouragement (PE) .433** .377** .386** .500** .523** .577** .498** .536** .519** 1 Note: **p<0.01, YPAP=Youth Physical Activity Promotion Model, ECPA= Extra-Curricular Physical Activity, HPA= Number of days > 60 minutes MVPA.
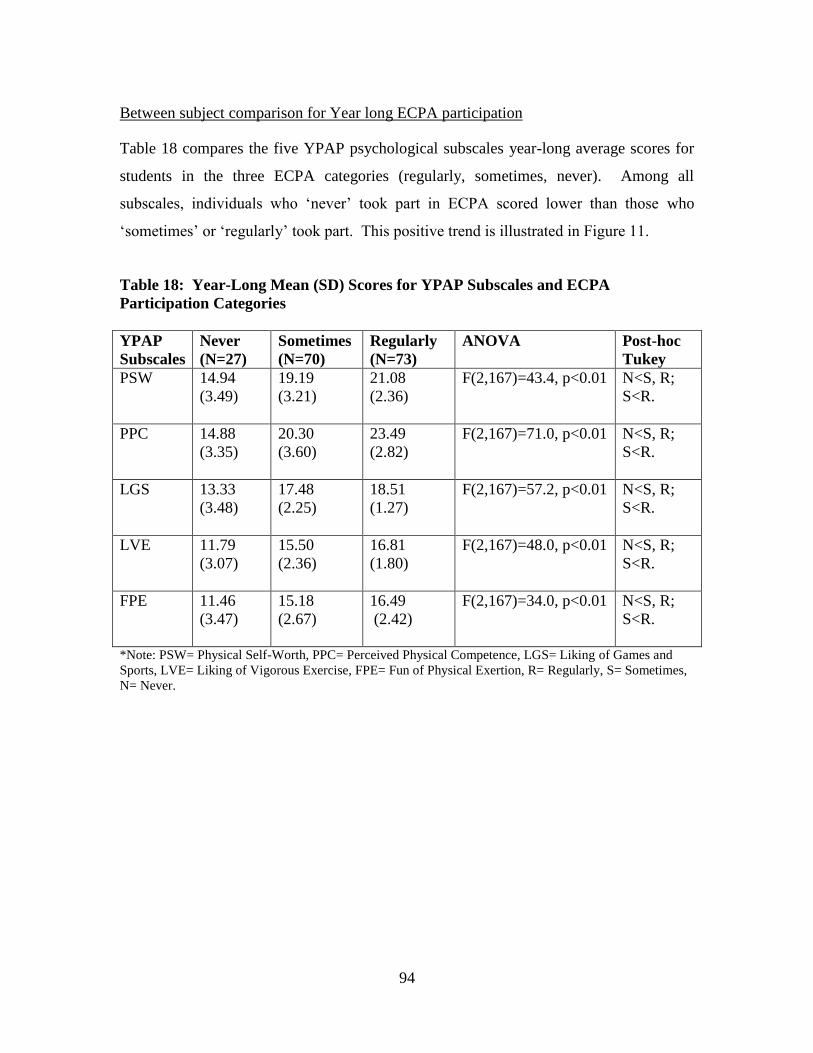
94
Between subject comparison for Year long ECPA participation
Table 18 compares the five YPAP psychological subscales year-long average scores for
students in the three ECPA categories (regularly, sometimes, never). Among all
subscales, individuals who ‘never’ took part in ECPA scored lower than those who
‘sometimes’ or ‘regularly’ took part. This positive trend is illustrated in Figure 11.
Table 18: Year-Long Mean (SD) Scores for YPAP Subscales and ECPA
Participation Categories
YPAP
Subscales
Never
(N=27)
Sometimes
(N=70)
Regularly
(N=73)
ANOVA
Post-hoc
Tukey
PSW 14.94
(3.49)
19.19
(3.21)
21.08
(2.36)
F(2,167)=43.4, p<0.01
N<S, R;
S<R.
PPC 14.88
(3.35)
20.30
(3.60)
23.49
(2.82)
F(2,167)=71.0, p<0.01
N<S, R;
S<R.
LGS 13.33
(3.48)
17.48
(2.25)
18.51
(1.27)
F(2,167)=57.2, p<0.01
N<S, R;
S<R.
LVE 11.79
(3.07)
15.50
(2.36)
16.81
(1.80)
F(2,167)=48.0, p<0.01
N<S, R;
S<R.
FPE 11.46
(3.47)
15.18
(2.67)
16.49
(2.42)
F(2,167)=34.0, p<0.01
N<S, R;
S<R.
*Note: PSW= Physical Self-Worth, PPC= Perceived Physical Competence, LGS= Liking of Games and
Sports, LVE= Liking of Vigorous Exercise, FPE= Fun of Physical Exertion, R= Regularly, S= Sometimes,
N= Never.
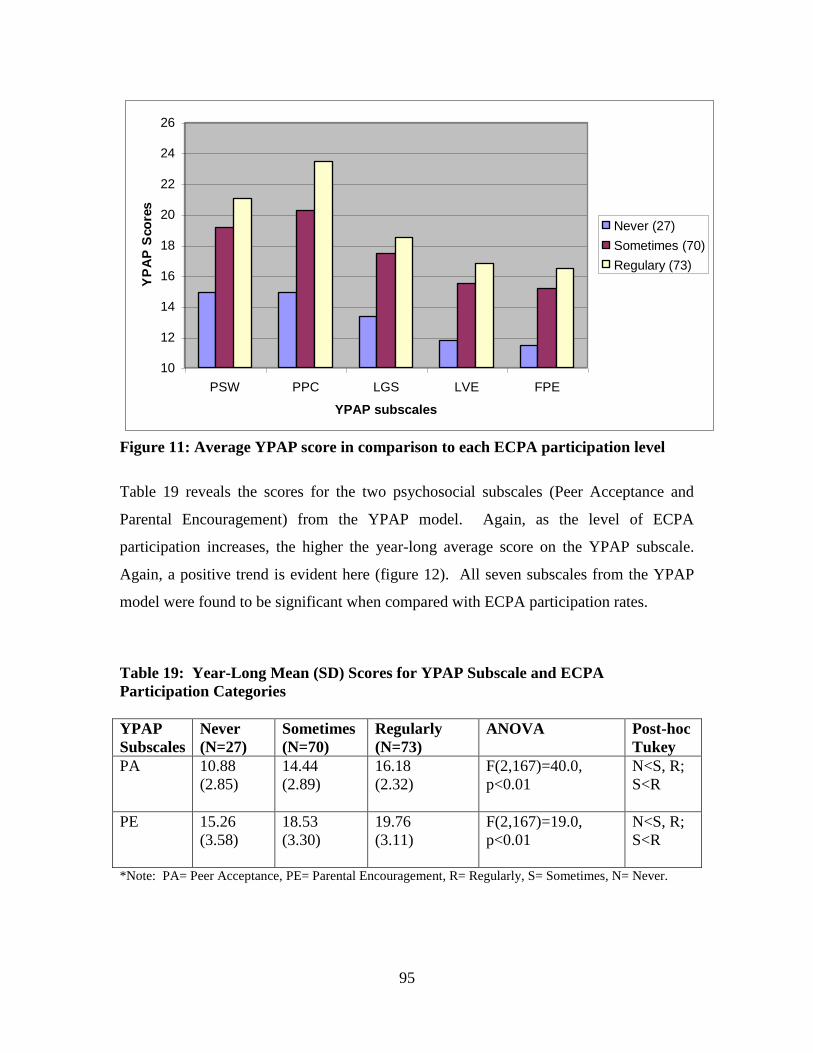
95
10
12
14
16
18
20
22
24
26
PSW PPC LGS LVE FPE
YPAP subscales
YP
AP
Sco
res
Never (27)
Sometimes (70)
Regulary (73)
Figure 11: Average YPAP score in comparison to each ECPA participation level
Table 19 reveals the scores for the two psychosocial subscales (Peer Acceptance and
Parental Encouragement) from the YPAP model. Again, as the level of ECPA
participation increases, the higher the year-long average score on the YPAP subscale.
Again, a positive trend is evident here (figure 12). All seven subscales from the YPAP
model were found to be significant when compared with ECPA participation rates.
Table 19: Year-Long Mean (SD) Scores for YPAP Subscale and ECPA
Participation Categories
YPAP
Subscales
Never
(N=27)
Sometimes
(N=70)
Regularly
(N=73)
ANOVA Post-hoc
Tukey
PA 10.88
(2.85)
14.44
(2.89)
16.18
(2.32)
F(2,167)=40.0,
p<0.01
N<S, R;
S<R
PE 15.26
(3.58)
18.53
(3.30)
19.76
(3.11)
F(2,167)=19.0,
p<0.01
N<S, R;
S<R
*Note: PA= Peer Acceptance, PE= Parental Encouragement, R= Regularly, S= Sometimes, N= Never.
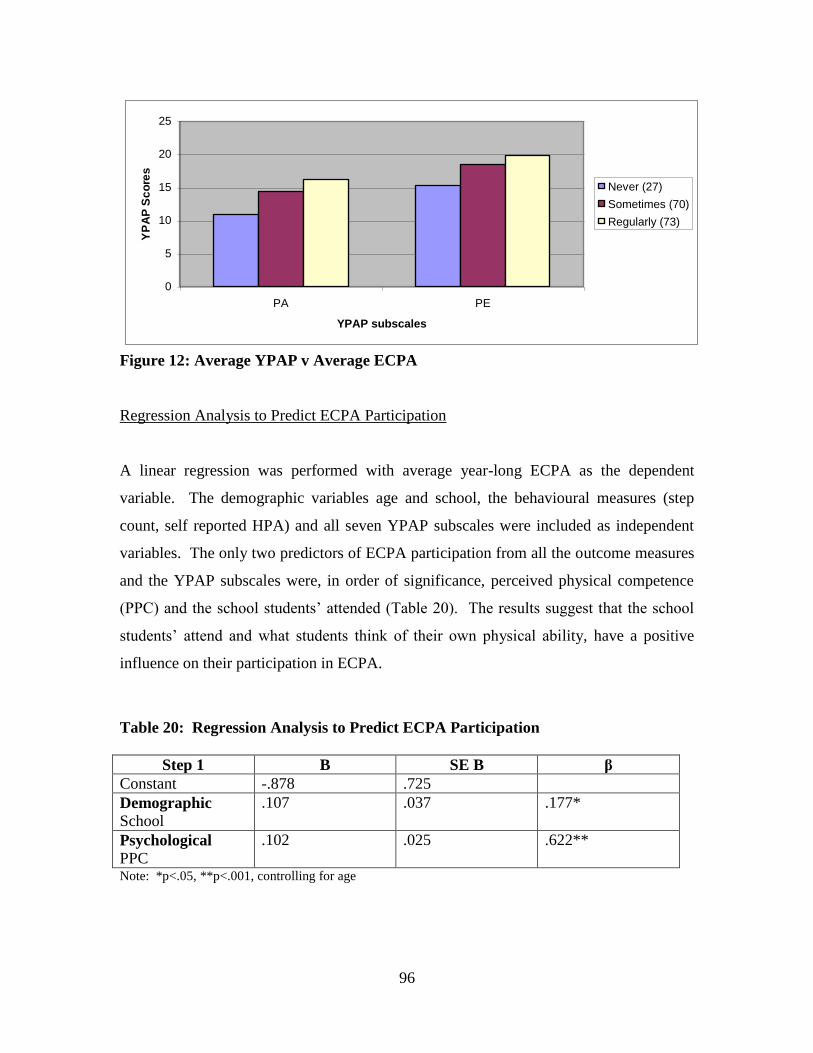
96
0
5
10
15
20
25
PA PE
YPAP subscales
YP
AP
Sc
ore
s
Never (27)
Sometimes (70)
Regularly (73)
Figure 12: Average YPAP v Average ECPA
Regression Analysis to Predict ECPA Participation
A linear regression was performed with average year-long ECPA as the dependent
variable. The demographic variables age and school, the behavioural measures (step
count, self reported HPA) and all seven YPAP subscales were included as independent
variables. The only two predictors of ECPA participation from all the outcome measures
and the YPAP subscales were, in order of significance, perceived physical competence
(PPC) and the school students’ attended (Table 20). The results suggest that the school
students’ attend and what students think of their own physical ability, have a positive
influence on their participation in ECPA.
Table 20: Regression Analysis to Predict ECPA Participation
Step 1 B SE B β
Constant -.878 .725
Demographic
School
.107 .037 .177*
Psychological
PPC
.102 .025 .622**
Note: *p<.05, **p<.001, controlling for age
97
4.4 Discussion on the Quantitative Data
4.4.1 Behavioural Data
Meeting Physical Activity Recommendations and Weekly HPA levels
i. Meeting PA recommendations
Regular physical activity (PA) in adolescence is important in developing their current and
future health. This present study found that only 14% of the participants (males, aged 12-
15 years) were meeting the current recommended PA guidelines for children and
adolescents of > 60 minutes MVPA daily (Department of Health and Children, 2009).
This means that 86% of adolescents were not getting enough regular PA to develop their
current or future health.
The Youth Risk Behaviour Surveillance survey (YRBS) in the US reported that only 18%
of students (aged 14-19 years) had participated in > 60 minutes of MVPA per day on
each of the previous seven days (Eaton and colleagues, 2009). A Health Survey for
England (2008) reported that 32% of males and 24% of females (aged 2-15 years) were
meeting the CMO (2004) recommendation of > 60 minutes of moderate PA daily, at that
time (National Health Service, NHS, 2011). The Scottish Health Survey, 2009 (Ormstan
et al., 2010) revealed very high figures of 75% and 68% of males and females (aged 2-
15) respectively, meeting the recommended guidelines, at that time, of 60 minutes
moderate PA daily. Findings from the 2009/2010 HBSC Europe survey showed that 23%
of 11 year olds met the guidelines of > 60 minutes MVPA daily (WHO, 2010), while
only 15% of 15 year olds met the guidelines (Currie et al., 2012).
Findings from the Take Part study (Woods et al., 2004) showed that 35% of students
(aged 15-17 years) were meeting the recommended > 60 minutes of MVPA 4 or more
days per week (the recommended amount of PA for this age group at that time). The
2006 ‘Health Behaviour in School-Aged Children (HBSC, Ireland) study reported that
27% of children and adolescents (aged 10-17 years) were meeting the recommended PA

98
guidelines (Nic Gabhainn et al., 2007). This figure has stayed fairly consistent as the
HSBC, Ireland (2010) study reported 25% of children and adolescents (aged 10-17 years)
were meeting the guidelines (Nic Gabhainn et al., 2012). The CSPPA study (Woods et
al., 2010) of Irish children and adolescents found that only 12% of the post-primary
students in the study (aged 12-18 years) were meeting the recommended PA guidelines of
> 60 minutes MVPA daily.
In terms of meeting the PA recommendations, the amount of males (aged 12-15 years)
meeting the guidelines (14%) is low. The figure, however, is fairly consistent with the
amount of adolescents meeting the guidelines in the US (18% of 14-19 year olds, Eaton
et al., 2009), Europe (15% of 15 year olds, Currie et al., 2012) and Ireland (12% of 12-18
year olds, Woods et al., 2010). The findings from the present study are difficult to
compare with figures from the UK, as recommended guidelines at the time were lower
than the present guidelines on PA. The low percentage of adolescents meting the
recommended > 60 minutes MVPA daily is cause for concern, worldwide, however, the
figures reported may be an indication that the guidelines need reviewing and raise the
question of how much PA is enough? The figures do highlight the importance of
providing PA opportunities for adolescents and the need to make them as attractive as
possible.
ii. Number of Days > 60 minutes MVPA
The findings from the present study showed that, on average, participants engaged in >
60 minutes MVPA on 4.98 days per week. In terms of year group in school, second years
students reported the highest number of days per week > 60 minutes MVPA (5.12),
followed by first years (5.02) and third years (4.77). The amount of students that were
participating in > 60 minutes of MVPA 4 days per week was 88%.
The Youth Risk Behaviour Surveillance survey (YRBS, Eaton et al., 2009) in the US
found that 45% of males (aged 14-19 years) participated in > 60 minutes of MVPA on 5
or more days in the previous 7. The Take Part study (Woods et al., 2004) reported that
42% of male students (aged 15-17 years) were engaged in > 60 minutes of MVPA 4 or
99
more days per week, while the 2006, HSBC Ireland study (Nic Gabhainn et al., 2007)
revealed that the amount of adolescents engaged in MVPA 4 or more times per week was
59% (aged 12-14 years) and 42% (aged 15-17 years). The 2010, HBSC Ireland study
(Nic Gabhainn et al., 2012) revealed that 51% of participants (aged 10-17 years) were
engaged in > 60 minutes of MVPA 4 or more days per week. The CSPPA study (Woods
et al., 2010) found that, on average, participants (aged 10-18 years) met the daily MVPA
guidelines on 4.0 days per week. The findings from the current study show that the
students had relatively high levels of PA, even if the number of students meeting the
recommended PA guidelines was low (14%). The amount of students engaging in > 60
minutes of MVPA 4 days per week was extremely high (88%). This compares
favourably with the amount of students engaging in > 60 minutes of MVPA 4 or more
days per week in other Irish studies, 42% of males from the Woods and colleagues (2004)
study, 51% from the HBSC Ireland, 2010 study (Nic Gabhainn et al., 2012) and 45%
from the CSPPA study (Woods et al., 2010). Again, the findings from the present study
highlight a positive PA outlook for the students involved. When comparing with these
other studies however, it must be noted that they cannot be directly compared due to the
other studies involving males and females, larger cohorts of students and a greater age
range. The figures from these studies show that large numbers of students are being
physically active every week, however, the low numbers meeting the recommended
guidelines (> 60 minutes of MVPA daily) give a more negative outlook on their PA
participation levels. Again, this asks the question of how much PA is enough for
adolescents?
iii. Age
The present study highlighted third years as the least active year group of the three (4.77
days of > 60 minutes of MVPA per week). Previous studies have found that a decrease in
PA levels of adolescents with an increase in age is typical (Biddle et al., 2005; European
Heart Network, 2001; Sallis et al., 2000; Van Der Horst et al., 2007).
The YRBS survey (Eaton et al., 2009) in the US found that there was a decrease in
students meeting PA guidelines with increasing age (9th
grade – 39.7%, 10th
grade –
100
39.3%, 11th
grade – 36%, 12th
grade – 31%). The ‘Scottish Health Survey, 2009
(Ormstan et al., 2010) also reported a decrease in PA with increasing age of children and
adolescents (aged 2-15 years) with 80% of male participants (aged 5-12 years) meeting
recommended PA guidelines, falling to 70% of males (aged 13-15 years).
In Ireland, a drop in adolescent PA participation with increasing age is also common.
The HBSC Ireland (2006) study (Nic Gabhainn et al., 2007) found a decrease in the
number of students getting > 4 days 60 minutes MVPA in the previous week ranging
from 64% (aged 10-11 years) down to 42% (aged 15-17 years). The more recent HBSC
Ireland (2010) study (Nic Gabhainn et al., 2012) again revealed a decrease in the number
of students getting > 4 days 60 minutes MVPA in the previous week falling from 62%
(aged 10-11 years) to 41% (aged 15-17 years). The CSPPA study (Woods et al., 2010)
found similar decreases in PA participation in adolescence with the amount of male
students meeting the PA guidelines dropping from 24% (aged 12-13 years) to 16% (aged
14-15 years) to just 7% (aged 16-18 years).
The decrease in the amount of adolescents physically active with increasing age is a
worrying trend and reflects the negative attitude of many adolescents towards physical
activity, as they get older. The most dramatic decrease in PA seems to come around the
15 years of age category. This would generally be students in third year of post-primary
school in Ireland. The present study is no different with third years reporting the lowest
average number of days (4.77) > 60 minutes of MVPA per week. First years reported
5.02 days of > 60 minutes of MVPA per week and second years were the most active,
recording 5.12 > 60 minutes of MVPA per week. The jump in PA participation in this
study from first to second year is uncommon, however, the difference is quite small. The
decrease in PA with increasing age in adolescence is significant and highlights the
importance of finding out why this drop-off in PA is so common. Future research needs
to investigate the attitudes and views of the students, particularly around the ages of 14
and 15 to find out what is causing the decrease in PA participation and what, if anything,
can be done about it. Focus group discussions should be the most productive method of
finding out the honest opinions of adolescents and the focus group discussions from the
101
present study into ECPA participation might provide some insight into adolescent males
attitudes to PA and barriers to involvement.
Comparisons across studies and countries should be interpreted cautiously due to
differences in cohort size, age range of participants, recommended amount of PA for
young people and measurement procedures. The need for a standardised adolescent PA
guideline is clear and would make comparisons across countries much easier. The
majority of the studies were self-report and the wide range of findings from the different
studies highlights the limitations of this PA measuring method. The studies were
predominantly cross-sectional as opposed to longitudinal. The present study is
longitudinal in nature and therefore, has the advantage of being able to track the PA
behaviour of adolescents over a period of time rather than a one off snapshot, providing
stronger validity to its findings. The standout trends are that levels of physical activity
decline in adolescence with increasing age and males tend to be more active than females
(Nic Gabhainn et al., 2007, 2012; Woods et al., 2010. A limitation of this study is the
focus on male adolescents’ only. However, more single gender studies need to be
undertaken to allow direct comparisons of studies that much easier. The discussion has
highlighted that adolescents’ PA levels are not that low, however, the recommended
guidelines of > 60 minutes MVPA daily seem to be out of reach for many. This may
suggest that the amount of PA that adolescents may be participating in on the days that
they are active is not being taken into account. This highlights one of the drawbacks to
self-report questionnaires where participants can only answer what they are asked.
Therefore, the need for objective measures, such as motion sensors, of PA in adolescence
or a combination of self-report and objective measures is clear. This present study looks
at a combination of self-report, objective and focus group discussion to identify accurate
and reliable information from adolescent males regarding PA and ECPA participation.
Pedometer Step Count
In the present study, participants recorded an average year-long daily step count of
11,891. This figure is well below the recommended cut-off point for males (aged 6-12
years) of 15,000 steps per day (Tudor-Locke et al., 2004). Canada’s Health and Physical
102
Activity Guide (2009) recommends a cut-point of 16,500 steps daily for boys and girls.
As cut-off points for adolescents have yet to be established, it is difficult to compare step
count results from this study to the recommendations. The best comparisons can be made
with studies that have measured the daily step counts of children and adolescents. The
Canadian Fitness and Lifestyle Research Institute randomly recruited N=11,669 children
and adolescents (aged 5-19 years) to take part in pedometer measurement. The study
found that males took 12,259 steps daily, while females took just 10,906 steps daily.
Abbott and Colleagues (2009) study of Australian children and adolescents (N=2,076,
aged 5-17 years) found that average weekday daily step count for Year 10 students who
walked to school was 13,592 for males and 12,109 for females. The study reported that
the figures decreased for students who got non-active transport to school. Dollman and
colleagues (2010) study with Australian children and adolescents (N=2,071, aged 5-16
years) reported that males (aged 5-12 years) had a daily step count average of 13,501 and
older males (aged 13-16 years) had an average daily step count of 11,150. The average
daily step count from the present study (11,891) compares quite favourably with the
averages from the other studies. Again, it is difficult to make direct comparisons due to
the differences in cohort size and the age range of students. The lack of an accurate
figure on how many steps is enough for adolescents makes a stronger case for a
combination of self-report and objective measures when assessing PA in adolescence.
Students in this study recorded a year-long average weekday (4 days, Monday-Thurs)
step count of 12,043, while the average weekend day (2 day average) step count was
11,781. The year-long average daily step count at Time 3 (Summer, 12,644) was
significantly higher than at Time 1 (11,171) and Time 2 (Winter, 11,685). In terms of
year groups, second year students had the highest year-long average daily step count
(12,526), followed by third years (11,800) and first years (11,081). The high number of
daily steps recorded from the second year students is consistent with the results from the
self-report > 60 minutes MVPA daily results showing second years as the most active
group. However, third year students reported higher daily step counts than first year
students, which is opposite to the number of days > 60 minutes MVPA weekly, where
first years (5.02) reported to be more active than third years (4.77).
103
Abbott and colleagues (2009) study found that weekend day step counts were lower for
year 10 students than week day step counts. Males recorded, on average, 12,168 steps
per day on the weekend and 13,952 on a weekday. Females recorded 12,109 steps on a
weekday and 10,787 steps on average, per day on the weekend. The Dollman and
colleagues (2010) study also reported higher average step counts by students on
weekdays than on weekend days. For males, 12,926 was the average step count for a
weekday and 11,793 for a weekend day. For females, the corresponding step counts were
11,031 and 10,179. The findings point to a higher level of steps taken by males than
females, which is in line with the self-report data that males are more active than females
in adolescence (Fahey et al., 2005; Nic Gabhainn et al., 2007/2012; Woods et al., 2010).
Tudor-Locke and colleagues (2004) do suggest that the cut points should decrease as
children move through adolescence, as adolescents decrease their PA participation as
they get older. The studies referred to in this discussion have been consistent with this
view (Abbott et al., 2009; Dollman et al., 2010). The present study shows found that, as
previously mentioned, that second years recorded the highest average daily step count,
followed by third years and then first years. This goes a little bit against normal step
count trends i.e. a decrease in step count with age, but it may be due to the study being
focussed on males only, and the small cohort of students involved. The findings from the
studies showed that the participants were more active on weekdays than weekend days.
Again, this may give strength to the notion that adolescents are less inclined to be active
on the weekends. If this is the case, it demonstrates how big an opportunity the school
day is in terms of getting adolescents physically active. This could come in the form of
more PE, a greater availability of ECPA or just generally promoting PA during the school
day.
The lack of clear step count cut-off point recommendations is an area of concern when
using pedometers to measure adolescent PA levels. Dollman and colleagues (2010)
alluded to this problem, reporting that no studies could be located that had proposed
pedometer step thresholds for older adolescents (>12 years). Given that various studies
have found that PA levels tend to decrease in young people as they move through
104
adolescence (Fahey et al., 2005; Nic Gabhainn et al., 2007; Woods et al., 2010), it is vital
that a recommended figure for daily step count in adolescence is identified.
In order to deal with the problem of reduced PA levels with increasing age in
adolescence, it must first be identified at what point the decrease begins. Cross-sectional
studies are useful guides for analysing step count in young people, but only at a particular
time. In terms of tracking the regular daily or weekly step counts of adolescents,
longitudinal studies are vital. To gain a greater insight into when the step count averages
begin to decrease in adolescence, longitudinal studies must become commonplace in this
research field. The strength of this study is that it measures the daily step count of
adolescent males across an entire academic year, giving a broader analysis of the PA
levels of students at different stages of the school year. Typically, time 3 (Summer)
recorded the highest average daily step count (12,644). The results from the study
suggest that students are relatively active throughout the year, yet a lack of clear
recommendations for this age group means this assumption is questionable.
In order to observe gender differences, a similar study to this present one needs to be
carried out with females to see how they would compare with males of a similar age (12-
15 years) in terms of daily step count and year group/age. Longitudinal research would
also be recommended with a cohort of adolescents over the course of their post-primary
school years to track step count levels with increasing age.
Extra-Curricular Physical Education (ECPA)
This section will discuss the role of ECPA in post-primary schools under the following
headings i) levels of ECPA participation ii) most popular ECPAs and iii) barriers to
ECPA participation.
Levels of Participation
This study has found that year-long participation levels in ECPA for this group of
students is high (84% at least once a week). This total included the majority of students
(43%) who reported to participate on a regular basis throughout the school year (> 2 per
105
week). These levels of ECPA engagement show a consistent pattern across the three time
points and all three year groups. The results are positive. In the UK, a ‘Young people
and sport in England’ survey (2002) reported that 72% of post-primary students were
participating in ECPA once or more per week (Sport England, 2003, b). The same study
also found a decrease in ECPA participation levels as students moved through
adolescence, 43% (years seven to nine, aged 11-14 years) to 35% (years ten to eleven,
aged14-16 years). A study in Wales the ‘Active young people’ survey (Sports Council
Wales, 2006) found that 67% of post-primary students were participating in ECPA once
or more per week. The same survey also reported a decrease in the amount of students
participating in ECPA with an increase in age. Smith and colleagues (2007) found that
among English, adolescent, male students (aged 15-16 years), 3% participated in ECPA
four or five times a week, 30% reported involvement three or four times a week, 40%
took part in ECPA twice a week, while 26% took part once a week. The results from the
UK are difficult to directly compare with the present study due to differences in gender,
age and cohort size and design methodology (cross-sectional versus longitudinal).
However, in terms of the number of students engaging in ECPA participation at least
once a week, the present study compares favourably.
From an Irish perspective, Fahey and colleagues (2005) reported that 22% of post-
primary students (male and female) never participated in ECPA. In the case of males
only, they found that 16% of students never participated. The CSPPA study (Woods et
al., 2010) findings also showed that 16% of post-primary students (males and females)
never participated in ECPA. However, in the case of male students only, the CSPPA
study found that only 11% never took part in ECPA. The present study findings (16%
non-participants) would indicate that this number has stayed consistent over the years.
However, the 11% of males from the CSPPA study is a low figure compared to the 16%
of non-participants from the present study. This difference among studies may be
explained by the focus of the current study on adolescents in disadvantaged schools or
due to the fact that the present study looked at only junior cycle, whereas, the Fahey and
colleagues (2005) and Woods and colleagues (2010) studies included both junior and
106
senior cycle students. Research has shown that children from disadvantaged backgrounds
are less likely to participate in community based PA or sport (Woods et al., 2010).
In terms of year groups, Fahey and colleagues (2005) found a decrease in students’
ECPA participation levels as they moved up through the years in post-primary school.
The non-participation levels for second and third years were 15% and 20% respectively.
The CSPPA study revealed a similar decrease with increasing year in school, as non-
participation levels were 12% (first year), 14% (second year) 18% (third year). The
current study showed varied non-participation levels in ECPA from first year (14%) to
second year (18%) to third year (16%). The first indications of a real increase in non-
participation are from second to third year in both the Fahey and colleagues (2005) study
(15% to 20%) and the CSPPA study (14 to 18%). This may be an area that could be
targeted for future research to see what it is that encourages more adolescents to be
involved in ECPA and PA at this stage of adolescence and to try and track the general
decline in PA participation as they get older. The decrease in adolescent ECPA
participation levels with an increase in age is consistent with many studies highlighting a
decrease in adolescents PA behaviour, as they get older (De Roiste and Dineen, 2005;
Sallis et al., 2000; Twisk, 2001; Van Der Horst et al., 2007). A challenge for
interpretation of the findings from the current study is the tendency by researchers to
report on adolescent PA rather than divide into males and female. Gender differences
exist in adolescent participation levels, females are known to be less active than males
(Fahey et al., 2005; Woods et al., 2010), so gender specific findings are necessary, for
both males and females in order to fully understand this cohort.
Most Popular ECPAs
The three most popular ECPAs participated in by students over the academic year were
football, basketball and Gaelic football. The findings showed that they were consistently
popular across throughout the whole year, being the top three at time 1 and time 2, and all
in the top four at time 3. These results highlight the domination of invasion games in on
offer to students in this study. The only ECPA that was not selected by any of the
students was dance. The fact that this study included male students only may be a
107
possible reason for this finding. Findings from ECPA studies and adolescents in the UK
are in line with the findings of the present study. The Sport England (2003b) survey
reported a domination of invasion games on offer in ECPA, with football (15%) and
netball (7%) the most frequently attended by males and females respectively. Smith and
colleagues also highlight the domination of invasion games in ECPA, reporting in their
study that the most widely played sports were, again, football (52%) and netball (24%).
The Women’s Sport and Fitness Foundation (WSFF, 2011) report focussed on why girls
in the UK (primary and post-primary) turn away from an active lifestyle. The report
showed that girls believed PE and school sport was dominated by traditional, competitive
sport and targeted the sport and talented students. The same report suggests that
traditional sport remains the focus of policy and delivery of PE in England.
Studies have shown that ECPAs in Irish post-primary schools are also dominated by
invasion games. Fahey and colleagues (2005) found that soccer (28%) and Gaelic
football (22%) were the most popular ECPAs for males and basketball (20%) and Gaelic
football (12%) were the most popular for females. The CSPPA study (Woods et al.,
2010) found similar results with a dominance again by invasion games in terms of ECPA
participation. The same study reported soccer (17%), Gaelic football (12%) and
basketball (9%) as the most popular for males. For females, basketball (14%), Gaelic
football (12%) and athletics (9%) were most popular. The domination of traditional,
invasion games correspond with the suggestion that PE in Irish post-primary schools is
also dominated by traditional, invasion games (Fahey et al., 2005; Woods et al., 2010).
Both studies alluded to the difference between what was on offer in PE classes and the
multi-activity approach outlined in the physical education syllabus (DES, 2003). The
studies made reference to the limited amount of exposure students have to possibly more
individual activities in PE such as dance and swimming. The finding of athletics as the
third most popular ECPA for girls in the CSPPA study (Woods et al., 2010) suggested
that the attraction of athletics might be due to the availability of individual events. The
present study found that athletics was the only PA that showed any real difference in
popularity during the school year (T1, 8%; T2, 8%; T3, 58%). This may be down to
108
athletics being a summer term PA, however, it may give an indication that boys who are
not keen on traditional games have an opportunity to engage in a more individual PA.
The findings from this present study and the Fahey and colleagues (2005) and Woods and
colleagues (2010) studies highlight the popularity of traditional, invasion game within
ECPA. It is within reason to suggest that the main ECPAs on offer in post-primary
schools are traditional, invasion games. This is an area that needs more attention. If
more of our adolescents are to become more physically active, by way of ECPA
participation, a greater variety of physical activities must be available to them. The
availability of invasion games in ECPA is obviously very important in terms of attracting
students to participate, but more opportunities in terms of less competitive, individual
physical activities may be a worthwhile experiment. This will, however, require more
time and effort from PE teachers in particular therefore, other members of school staff or
parents may need to get involved.
Barriers to ECPA participation
From the options given to the students who reported to never participate in ECPA (16%),
the most frequent reason given was ‘I don’t think I’m good enough’ (56%). This lack of
perceived competence was the most consistent reason given for a lack of ECPA
participation across all three time points throughout the academic year. Lack of
perceived competence was followed by ‘too lazy’ (20%), ‘lack of enjoyment’ (13%).
The other 11% of non-participants gave reasons such as ‘no time’, ‘have to get home’ and
‘not liking the particular ECPA’. The understanding of why students are not taking part
in ECPA is crucial in order to develop strategies to increase participation levels. A
comparison with barriers to PA and PE participation has been identified. In terms of
barriers, the Women’s Sport and Fitness Foundation report (WSFF, 2011; 1500 children
surveyed) found that the reasons were being put off sport and PA because of their
experiences of school sport and PE, not liking the activities they do in PE, too much
competition in PE and not feeling they had the skills to do well in sport. McCarthy and
Jones (2007) study on children (aged 7-12 years) concluded that one of the main non-
enjoyment sources of sport for came from demonstrating a lack of competence. Allender
109
and colleagues (2006) reviewed qualitative studies investigating an understanding of
participation in sport and PA in children and adults. This review concluded that self-
perception is incredibly important in motivating people to participate in all types of PA
(Allender et al., 2006). For adolescent females, the review revealed that barriers to
participation included negative experiences during school PA and PE, being unable to
demonstrate competency of a skill to peers in class also made people uncomfortable in
PE.
De Roiste and Dinneen (2005) looked at the participation patterns and preferences of
Irish adolescents in relation to PA. The questionnaire based study took place between
November 2004 and February 2005. The students involved (N=2260, 1022 males/971
females, aged 12-18 years) were from schools (N=51) all across the Republic of Ireland.
The findings showed a significant decline in sports involvement with age, however, with
participation rates dropping from 96% of 12 year olds to 77% of 18 year olds. The study
found that the most common reason for dropout from an activity was a loss of interest.
The same study also reported not liking the leader and not having a good enough skill
level as other reasons for dropout. Fahey and colleagues (2005) study found that a major
negative about sports participation for post-primary students was ‘being left out for not
being good enough’. One third of students either ‘minded this a lot/minded this a bit’.
Fahey et al. suggested that the risk of being excluded in sport is a major negative, from an
overall positive perception of sports participation. Woods and colleagues (2010) found in
the CSPPA study that the main reasons for male non-participation in PA were being
injured, time pressure and feelings of incompetence. For females, the reasons included
time pressure, feelings of incompetence and just not liking sport. The one barrier to non-
participation that crosses over all these studies and reviews is a lack of perceived
competence. This corresponds to the current study from the self-report questionnaire
results. The qualitative results will discuss the findings on the barriers to ECPA
participation from the focus group discussions with students who reported to ‘never’
participate in ECPA.
110
Examining The Relationship Between ECPA, HPA and Pedometer Step Count
Both self-report and objectively measured PA showed low numbers of children meeting
the current recommended PA guidelines for children and adolescents of > 60 minutes
MVPA daily (Department of Health and Children, 2009). This is a public health concern
as PA is related to current and future health (Department of Health and Children, Ireland,
2009; WHO, 2003). Activity patterns were consistent throughout the year, suggesting
that interventions need to be year-long, for example, targeting high frequency activities
like active school transport to increase daily minutes of PA (Department of Transport,
Smarter Travel, 2009) or by using structured exercise or sport opportunities such as
ECPA, to increase daily PA minutes in adolescents.
Results showed that HPA (> 60 minutes MVPA daily) and daily step count levels both
increased with an increasing participation rate in ECPA. Post-hoc Tukey tests revealed
that the students who regularly participated in ECPA had higher recorded HPA levels and
step count levels than those who only sometimes or never participated. This reveals the
potential value of ECPA participation in helping adolescents to achieve the recommended
daily PA guidelines (> 60 minutes MVPA) and shows that taking part in ECPA, even
once a week can have a significant, positive effect on their HPA levels. Recent studies
have found that being involved in ECPA increased the likelihood of adolescents meeting
the recommended daily PA guidelines (Silva et al., 2010; Woods et al., 2010). The
findings of the current study support this view.
4.4.2 Psychosocial Data
This section will discuss the relationship found between psychological well-being, as
measured by the YPAP model (Rowe et al. 2007; Welk, 1999) and the behavioural
outcomes of this study (ECPA, HPA, step count) over an academic year. The subscales
of the YPAP based questionnaire were highly correlated, this is expected as the factors
that influence participation in games and sport from a psychological perspective, for
example, physical self-worth and perceived physical competence have commonality.

111
Additionally, research has shown that children who perceive they are good at sport and
PA like it more (Allender et al., 2006; Hilland et al., 2011).
A Repeated measures ANOVA was conducted across all three time points on each of the
YPAP subscales over the year-long study period. No significance was found in any of
the subscales apart from perceived parental encouragement. This scale assessed how
children perceived the support they received from their parents for engagement in sport
and games over the duration of the school year. It was developed by Brustad (1996) who
believed in the importance of parent’s social support. Sallis and colleagues (2000)
review of studies into the correlates of PA reported that social support from parents was
strong in adolescents and suggested that parents still have a important role to play in the
PA behaviour of their teenagers, and should be supported by parents, verbally or
otherwise. Wenthe and colleagues (2009) looked at the relationship between YPAP
factors and MVPA in adolescent males and females. Family support demonstrated the
strongest and most consistent relationship with males and females MVPA. They suggest
the prominence of parental support as a PA behaviour factor. Friend support also had a
significant correlation with MVPA of the male students. In this study, perceived parental
encouragement for games and sport decreased over the duration of the study. The score
obtained at autumn was significantly lower than at summer time. The reasons for this are
unclear, and explanations were sought in the qualitative data collected by the participants
at this time (discussed in chapter 5). However, research suggests that parental
encouragement is important (Biddle et al., 2005; Van Der Horst et al., 2007). A possible
hypothesis might be that the current study raised expectations among the adolescent
males as to what their parents should be providing and hence their reported expectations
in light of no change from parents were evaluated less positively. A similar finding was
reported by Brown and colleagues (2013) in their KAPS study, an intervention targeting
the mediators of children’s PA. Future research needs to investigate the influence of data
collection and awareness raising exercises on child evaluation of parental encouragement.
Results formed a clear linear pattern showing that an increase in ECPA participation level
correlated with an increase in psychological well-being. In fact, participation in ECPA
112
was more highly correlated with the YPAP subscales than either step count or self-
reported HPA. This is probably due to the narrow range of variance in responses to
ECPA as opposed to any substantial difference. However, it does show that there is a
significant relationship, observed over a full academic year, between participation in
ECPA on a regular basis and an adolescent males’ psychological well-being. This pattern
was repeated across all five psychological subscales (perceived physical competence,
physical self-worth, liking of games and sports, liking of vigorous exercise, fun of
physical exertion) targeted from the YPAP model. It provides evidence that male
adolescents who participate in ECPA have a more positive evaluation of factors that may
affect their psychological well-being than those who do not participate.
Perceived physical competence has been identified as extremely important in maintaining
involvement in PA (Bandura, 1997; Fox, 2000; Horn and Harris, 2002). Studies have
shown that perceived physical competence was highest in adolescents who were the most
physically active (Paxton et al., 2008; Inchely et al., 2011; Telama et al., 2005). Higher
levels of physical self-worth have also been found to correlate with higher levels of PA in
youth (Altintas and Hulya Asci, 2008; Biddle et al., 1999; Inchely et al., 2011). It is
unsurprising that the two subscales of perceived physical competence and physical self-
worth are linked to higher ECPA participation levels in adolescence as they had a highly
significant between subscales correlation.
Enjoyment of ECPA participation was examined under the YPAP subscales, liking of
games and sports (LGS), liking of vigorous exercise (LVE) and fun of physical exertion
(FPE). The increase in all three subscales with an increase in ECPA participation levels
emphasises the enjoyment that some students experience in ECPA. Many studies
investigating PA in children and adolescents have identified enjoyment as one of the
most significant correlates (Biddle et al., 2005; DiLorenzo et al., 1998; McCarthy and
Jones, 2007). This will be further examined in chapter 5 under the qualitative data.
The link between a positive social well-being of the students in this study and higher
ECPA participation levels shows that the influence of peers and parents is significant in
113
their PA behaviour. Studies have shown that family support is positively associated with
PA in adolescents’ (Biddle et al., 2005; DiLorenzo et al., 1998; Gustafson and Rhodes,
2006; Sallis et al.2000; Van Der Horst et al. 2007). A study by Wenthe and colleagues
(2009) examining the relationship between factors of the YPAP model and MVPA in
adolescents found that of all the factors they looked at, family support showed the
strongest and most consistent relationship with male MVPA. The results from the
present findings support the research in linking parental influence and PA behaviour. A
positive association between peer involvement, peer support and adolescent PA has also
been identified in research (Sallis et al., 2000; Van Der Horst et al. 2007). The WSFF
(2011) report of N=1500 primary and post-primary school students highlighted the
importance of the social aspect of PA and that they would be more encouraged to take
part if their friends were active. Wenthe and colleagues (2009) found that peer support
showed a significant correlation with the MVPA of male participants. Sabiston and
Crocker (2008) found in a study with adolescents (N=902, aged 15-18 years) that
encouragement from significant others was associated with high sport values. This can
be related to PA and ECPA. The findings from this present study highlight the
importance of social influence to adolescents with levels of peer acceptance and parental
encouragement increasing as ECPA participation levels increased. The results are
significant as they show that participation in ECPA, even just once a week (sometimes),
can improve the social well-being of adolescent males (aged 12-15 years). The impact of
peer and parental influence on adolescent males will be also be further examined through
the qualitative data in chapter 5.
Overall, the results from this section of the present study support the YPAP model in that
the students who reported to regularly participate in ECPA would answer ‘yes’ to the two
questions of ‘is it worth it’ and ‘am I able’, as shown by their high psychological subscale
scores. The high scores for the reinforcing factors of peer acceptance and parental
encouragement indicate a positive influence on these students leading to a higher level of
ECPA participation. The students who reported to ‘never’ participate in ECPA recorded
the lowest scores across all seven subscales indicating that they would answer the
questions of ‘is it worth it’ and ‘am I able’ negatively. The influence of peers and parents

114
may be limited or may be negative, which could possibly lead to a lack of ECPA
participation.
Summary and Future Research Challenges
The challenge to future research is in identifying if any of these outcome variables are
stronger than the others. Future research needs to use complex multi-variate statistics
such as structural equation modelling in order to fully assess the impact of individual
concepts on physical activity behaviour. Also, future research must use theory in order to
test hypothesis. This study was guided by the YPAP model, but its lack of direction in
how each of the variables underpinning the relationship between the question ‘Is is worth
it?’ and the child’s PA behaviour made the distinction between the subscales difficult to
understand. The regression analysis showed that only two independent factors predicted
participation in ECPA, these were the school the students’ attended and the student’s
perceived physical competence (PPC). This result shows that students’ ECPA
participation level may depend on the school they are attending over and above numerous
of the subscales from the YPAP model. In other words, if few ECPA opportunities are
available in schools, then this barrier to non-participation is key.
In general, post-primary schools depend on the goodwill of teachers, in particular PE
teachers, to provide ECPAs. Therefore, it is important for schools to have an extra-
curricular school policy. The Department of Education and skills (2009) scheme to
reward schools for improving the standard of physical education and ECPA is the ‘Active
Schools Flag’ (www.activeschoolflag.ie). This, however, is optional and up to individual
schools to apply themselves for this flag. The provision of a pathway for children to link
with community volunteers, that link with local clubs or national governing bodies of
sport (NGBs) e.g. Football Association of Ireland (FAI), is important. The Lifelong
Involvement in Sport and Physical Activity (LISPA) model (Hughes et al., 2006), which
focussed on pathways to develop and promote lifelong participation in sport and PA. The
main pathway of the model in line with ECPA is the ‘long-term recreation pathway’.
This focuses on getting people involved in PA at a recreational level and helping them to
persist in an active way of living through active recreation and organised PA
115
opportunities. The LISPA document emphasises the importance of PE in schools in
promoting active lifestyles in children and adolescents’, however, there is no mention of
ECPA. This lack of acknowledgement of ECPA and its potential value to adolescents in
post-primary schools, through PA participation and possible improvement of
psychological well-being, highlights the need for ECPA to gain greater recognition.
The other main predictor of ECPA participation was perceived physical competence.
This was clearly identified by students as a factor influencing their involvement in ECPA.
Given the high correlation values between perceived physical competence and other
YPAP subscales, this is not surprising. However, this research does suggest that
perceived physical competence may be the key predictor of ECPA participation among
adolescent males (aged 12-15 years), or indeed general participation in PA. Perceived
competence has been shown in the research to be inextricably linked with positive PA
behaviour, and even more so in adolescence (Telama et al., 2005; Woods et al., 2010).
The fact that a lack of perceived competence has been highlighted in research as a major
barrier to PA participation only demonstrates the importance of adolescents’ perceived
physical competence in relation to PA participation (Allender et al., 2006; Fahey et al.,
2005).
This demonstrates that a lot of physical activities available to adolescents, particularly in
school, are ability based. The research suggests that if students feel they are not good
enough, they avoid PA or drop-out. In the case of ECPA in post primary schools, a
possible way of attracting more students to participate might be to eradicate the
competitive element to a certain degree or aim to make the activities more fun based
rather than the current format in the majority of cases, competitive, traditional sports
(Fahey et al., 2005; Smith et al., 2007; Woods et al., 2010). The results highlight the
pressure adolescents feel they are under in order to be physically competent at ECPA, if
they want to be involved. Due to the acknowledgement of PE as still being dominated by
traditional invasion games, ECPA is an opportunity to attract more students who may not
be of as good a sporting standard, but want to attend without the concern of perceiving
116
themselves not good enough to participate. This is a topic discussed in the qualitative
data chapter.
There is a need for research to establish if there is a key variable linked to PA
participation in adolescent males. For example, in this study, the students who had
higher levels of peer acceptance had higher levels of perceived physical competence, fun
of physical exercise and have a high liking for vigorous exercise. This finding
demonstrates a relationship between and possible importance of peer influence and PA
participation to adolescent males. The finding that perceived parental encouragement
was the only YPAP subscale to reveal a significant difference (decrease) over the
academic year suggests more research into this particular area may be worthwhile. This
may be down to the influence of parents on adolescent males PA participation decreasing
as adolescents increase in age. The actual reasons are unclear, yet the significant
decrease over the year is worth noting for future research into the influence of parents
and peers on adolescent males ECPA participation. Future research needs to move away
from correlations to more complex statistical models to improve our understanding in this
field.
The finding of the school student’s attended as one of only two predictors of ECPA
participation indicates the need for more research into what post-primary schools are
offering in terms of ECPA and how often are they available. The second predictor of
ECPA participation identified was the student’s perceived physical competence. This
indicates that adolescent males (aged 12-15 years) need to feel physically competent to
participate in ECPA and it is an area that needs to be researched with larger numbers of
adolescent males in post-primary schools to get a real insight into the influence of
perceived physical competence on ECPA participation. This may also provide an
indication of the importance of perceived physical competence on adolescent males’ PA
participation in general.
117
Strengths and Limitations
The quantitative data presented demonstrates the benefits of a longitudinal study in terms
of analysing the consistency of results. The three time points for data collection (autumn,
winter, summer) allow for an accurate measure of students PA and ECPA behaviour over
an entire academic year. The findings from the quantitative analysis showed a
consistency in the students’ responses giving greater strength to the year-long averages
for ECPA participation levels, weekly HPA, pedometer step count, etc. The verification
question on the level of PA students typically engaged in every week was consistent at
each time point, adding more strength to the validity of the PA results.
The self-report and objective measures used have limitations in that students’ need to be
trusted to put down honest figures for the amount of steps taken daily and to be accurate
in their estimation of the number of days they got > 60 minutes MVPA in the previous
week or on a typical week. The pedometers could also be an incentive to take more steps
than they normally would. While this is a positive for the students, it is not necessarily
good for the study itself, as the steps taken may be higher than would normally be the
case. The study was also limited in that after time 1, the full cohort of students (N=64)
from one of the schools involved were excluded from pedometer step count measuring
for times 2 and 3. This was due to the high number of students (n=20+) from this
particular school not returning pedometers and diaries at time 1. Another weakness of
the study is that it is based on males only. A similar cohort of same age females from
similar disadvantaged backgrounds would be valuable to assess any similarities or
differences in PA and ECPA levels and impact on psychological well-being. The
qualitative chapter will allow for the comparison of results between quantitative and
qualitative findings from the study and provide support for the findings from this chapter.
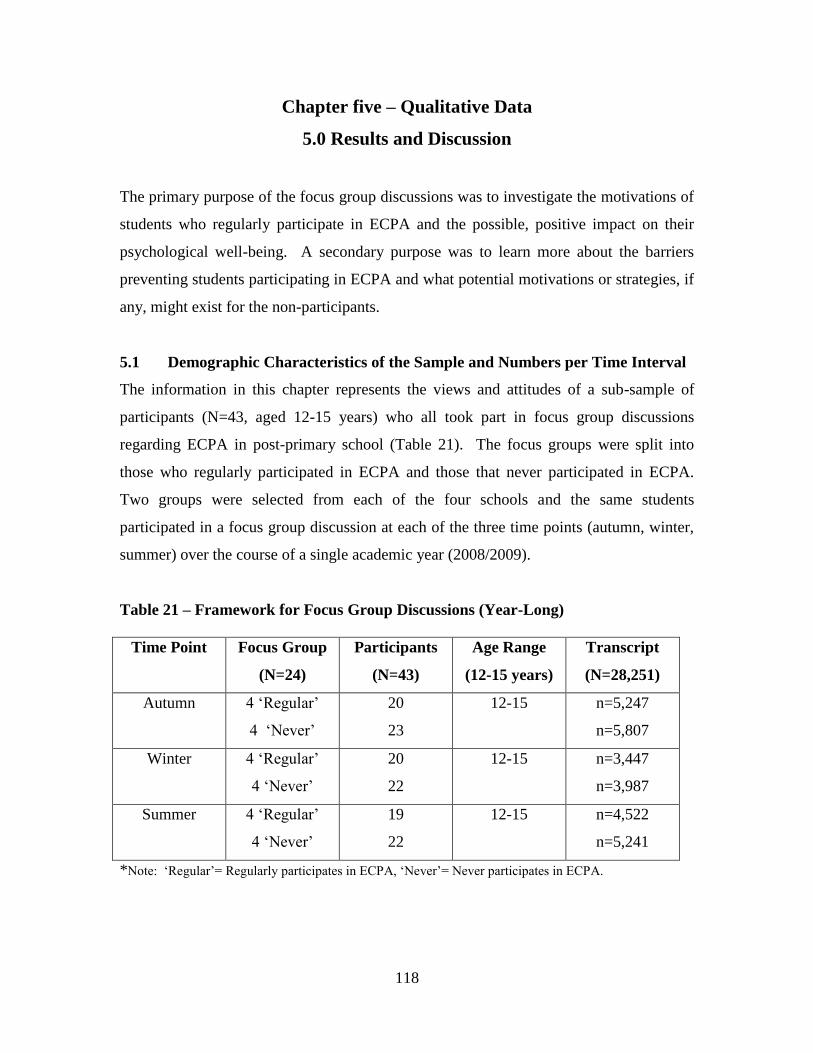
118
Chapter five – Qualitative Data
5.0 Results and Discussion
The primary purpose of the focus group discussions was to investigate the motivations of
students who regularly participate in ECPA and the possible, positive impact on their
psychological well-being. A secondary purpose was to learn more about the barriers
preventing students participating in ECPA and what potential motivations or strategies, if
any, might exist for the non-participants.
5.1 Demographic Characteristics of the Sample and Numbers per Time Interval
The information in this chapter represents the views and attitudes of a sub-sample of
participants (N=43, aged 12-15 years) who all took part in focus group discussions
regarding ECPA in post-primary school (Table 21). The focus groups were split into
those who regularly participated in ECPA and those that never participated in ECPA.
Two groups were selected from each of the four schools and the same students
participated in a focus group discussion at each of the three time points (autumn, winter,
summer) over the course of a single academic year (2008/2009).
Table 21 – Framework for Focus Group Discussions (Year-Long)
Time Point Focus Group
(N=24)
Participants
(N=43)
Age Range
(12-15 years)
Transcript
(N=28,251)
Autumn 4 ‘Regular’
4 ‘Never’
20
23
12-15 n=5,247
n=5,807
Winter 4 ‘Regular’
4 ‘Never’
20
22
12-15 n=3,447
n=3,987
Summer 4 ‘Regular’
4 ‘Never’
19
22
12-15 n=4,522
n=5,241
*Note: ‘Regular’= Regularly participates in ECPA, ‘Never’= Never participates in ECPA.
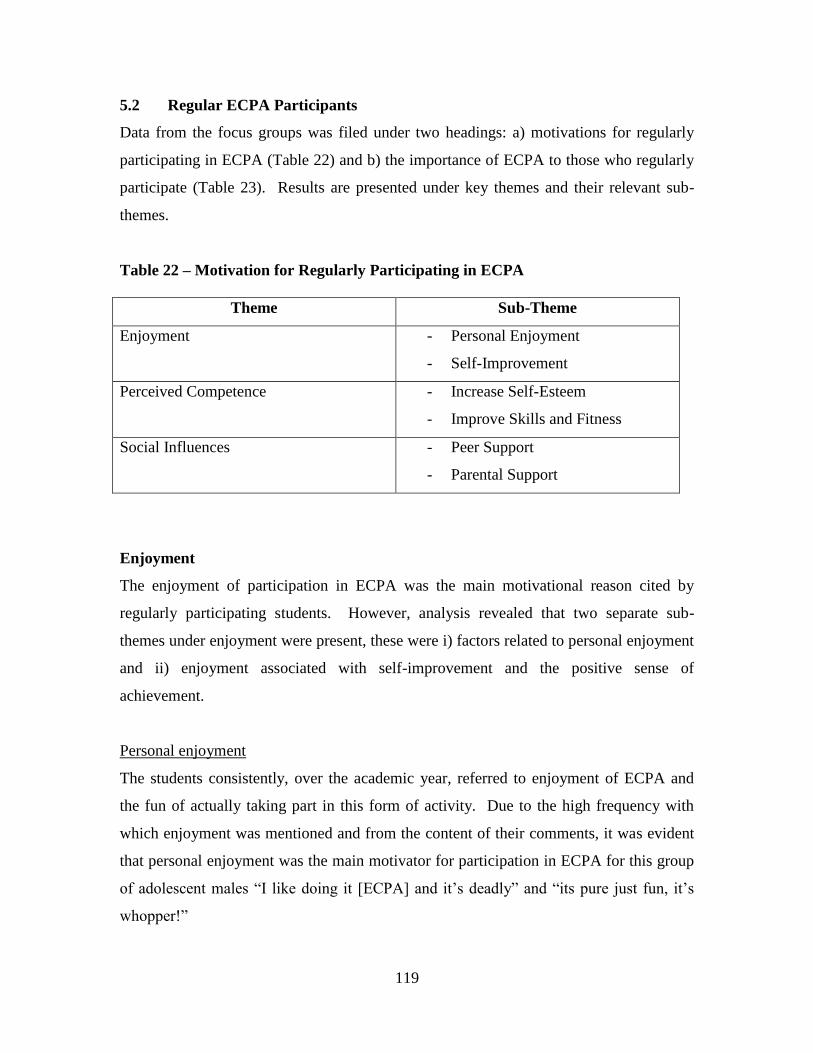
119
5.2 Regular ECPA Participants
Data from the focus groups was filed under two headings: a) motivations for regularly
participating in ECPA (Table 22) and b) the importance of ECPA to those who regularly
participate (Table 23). Results are presented under key themes and their relevant sub-
themes.
Table 22 – Motivation for Regularly Participating in ECPA
Theme Sub-Theme
Enjoyment - Personal Enjoyment
- Self-Improvement
Perceived Competence - Increase Self-Esteem
- Improve Skills and Fitness
Social Influences - Peer Support
- Parental Support
Enjoyment
The enjoyment of participation in ECPA was the main motivational reason cited by
regularly participating students. However, analysis revealed that two separate sub-
themes under enjoyment were present, these were i) factors related to personal enjoyment
and ii) enjoyment associated with self-improvement and the positive sense of
achievement.
Personal enjoyment
The students consistently, over the academic year, referred to enjoyment of ECPA and
the fun of actually taking part in this form of activity. Due to the high frequency with
which enjoyment was mentioned and from the content of their comments, it was evident
that personal enjoyment was the main motivator for participation in ECPA for this group
of adolescent males “I like doing it [ECPA] and it’s deadly” and “its pure just fun, it’s
whopper!”
120
Wankel (1993) describes enjoyment as a positive effective or emotional state, which
reflects feelings such as pleasure, liking and fun. Scanlon’s Youth Sport Commitment
model (1993) has enjoyment of sport at its core. The study of sport in children suggests
that sport enjoyment is linked to intrinsic achievement, aswell as intrinsic non-
achievement, such as movement and excitement (Scanlon et al., 1993). Berger and
colleagues (2007) suggest that intrinsic sources are the most important sources of
enjoyment, which include improving physical skills and experiencing fun. Research has
previously defined ‘having fun’ and ‘enjoyment of PA’ as main motivations why children
and adolescents engage in PA (Allender et al., 2006; Crocker et al., 2004; MacNamara
2011; Mulvihill et al., 2000). The findings from this study support this view.
Hashim and colleagues (2008) published a study ‘Validating the Youth Sport Enjoyment
Construct in High School Physical Education’ to try to develop and validate a
questionnaire related to PE enjoyment. The study involved students (N=324, 48%
males/52% females) from 3 public high schools in Western Australia. The students (aged
13 years) from grades eight, nine and ten, completed a 37-item self-report questionnaire
based around the Youth Sport Enjoyment model (Scanlan and Lewthwaite, 1986). The
study found that all factors measured correlated positively with PE enjoyment. The
factors included physical competence, peer interaction and parental encouragement. The
study was based around PE enjoyment, yet the results could also be linked to PA and
ECPA enjoyment. McCarthy and Jones (2007) study ‘A Qualitative Study of Sport
Enjoyment in the Sampling Years’ looked at children (aged 7-12 years) and their
enjoyment of sport. The study sampled a total cohort of students (N=55, 22 males/23
females) who participated in organised sport in central England. The participants were
involved in focus group discussions. Among the main sources of enjoyment they
highlighted were perceived competence, social involvement and friendships.
Tannehill and colleagues (2011) identified experiencing fun as one of the most important
motivators for children and adolescents (male and female) to be physically active. For
boys, fun of PE in school was linked to games where they could compete and all invasion
games. It has been suggested that children and adolescents who experience feelings of
121
enjoyment from participation in sport may be connected to continued participation in
sport and PA (Berger et al., 2007; McPhail et al., 2011; Scanlon et al., 1993; Weiss et al.,
2001). In a study of post-primary students’ attitudes and perceived purposes of PE in
school, Wang and colleagues (2008) reported that students who experienced high
enjoyment of PE had high intentions to be physically active. This may be similarly
applied to ECPA enjoyment. Some studies have shown that PE enjoyment is positively
associated with ECPAs (Sallis et al. 1999; Trost et al. 1997). This demonstrates the
potential of ECPA as an avenue for helping adolescents to enjoy PA, therefore,
encouraging them to be physically active on a more regular basis.
Self-improvement
The students, through reference to self-improvement also portrayed their enjoyment of
ECPA. This sub-theme of enjoyment revealed that within the achievement situation of
sport, the opportunity for self-improvement in terms of personal skill and ability “to keep
good at football or something if you were doing it [ECPA] ... to improve your ability and
skill” and also in terms of improving personal fitness levels and its consequent impact on
health “just to get better at all sports and to stay fit” were a source of enjoyment and
positive motivation for sustained engagement by adolescent males (aged 12-15 years) in
ECPA.
Enjoyment is associated with feelings of mastery, which in turn increase motivation
(Harter, 1978, 1981). This is supported by Scanlon et al. (1993) who linked enjoyment
with intrinsic achievement, which included perception of mastery in sport. Both these
theories can be linked to McCarthy and Jones (2007) focus group sport study with
children (aged 8-12 years), which demonstrated that mastery processes were an important
part of their sport enjoyment. For example, students in their study referred to the
enjoyment of making tackles and scoring goals in football or hitting the ball well in golf.
Wankel and Sefton (1989) also suggested that the child’s perception of whether they
performed well or not is connected to their having fun and enjoyment or not. In terms of
ECPA, mastery processes could come in the form of providing of opportunities that

122
promote achievement, related to developing skills during training, practice and
competition, in order to increase enjoyment. Children and adolescents enjoy taking part
in sporting activities where they feel skilled and competent (Babkess and Weiss, 1999).
Perceived Competence
Another positive, psychological theme that emerged from the regular ECPA participation
focus group discussions was that of perceived competence. Students spoke about
participation in ECPA making them feel that they were good at physical activities, that
they could be as good as anyone else and this has led to them being accepted as part of a
team.
Increased self-esteem
This positive assessment of perceived competence was seen to have a positive effect on
their self-esteem. The students felt that participating in ECPA developed their
confidence and made them believe in themselves more. This was evident in comments
such as; “It [ECPA participation] makes ya believe that you can do more”, and “it [ECPA
participation] makes ya feel you’re as good as everyone else”, “I enjoy it … It raises me
self-esteem”. Their comments also suggested that when they were selected for the school
team, or even just a team in the extra-curricular training sessions, or if their team won a
competition, this made them feel good about themselves “If ya win a medal it can shoot
your confidence right up” and “yea when ya get picked [for a team] it helps your
confidence”.
The comments from these students support previous research suggesting that there is a
positive correlation between improvement in self-esteem and feelings of self-worth from
enjoyable PA participation (Biddle and Assare, 2011; Hallal et al., 2006; Fox, 2000;
Sonstroem, 1997). Altintas and Hulya Asci (2008) found that physically active males
and females (aged 11-14 years) scored higher on almost all subscales of physical self-
esteem than their less active counterparts. This is similar to findings from a longitudinal
study (Inchley et al., 2011) of Scottish adolescent’s (aged 11-15 years), which looked at
physical self-perceptions with PA. Results showed that perceived competence and

123
physical self-worth was associated with PA, showing that adolescents who feel able to
perform well within a sports context were more active. However, perceived competence
showed a decrease with increasing age in adolescence, particularly for females. Hilland
and colleagues (2009) study into the PE predisposition scale with students in Northwest
England (aged 12-14 years) suggested that if PE provides opportunities for increased
perceptions of competence and confidence, then children are more likely to enjoy their
experiences and maintain motivation. Wang and colleagues (2008) study reported that
adolescent students perceived that one of the purposes of PE was to increase their self-
esteem. This portrays a positive student view of PE, which can be linked to ECPA.
Adolescence is a period where students look towards their peers for a sense of belonging
as they try and cope with a changing environment, which has an important role in
contributing to feelings of self-worth and coping with identity concerns (Berndt, 1989,
Harter 1990). Scanlon and Lewthwaite (1986) referred to the importance of being part of
a team and the feeling of affiliation for sport enjoyment. MacPhail and colleagues (2008)
findings from a study with children (N=70, aged 9-11 years) involved in a 16 week ‘sport
education programme’ support this theory. The sport education model encompasses six
features characteristic of sport including a season of practice and competition, team
affiliation for the two terms, an event day, formal competitions, scoring and record
keeping and a festivity feature for social enhancement (Siedentop et al., 1998). From
interviews conducted throughout the 16 week programme, MacPhail and colleagues
(2008) reported the students’ sense of belonging, learning and building friendships, from
being affiliated to a team, all of which increased enjoyment levels making them feel good
about themselves. Being part of a team, or even just feeling like you were part of a team
in ECPA was a confidence builder for the students in this present study.
Improved fitness and skills
Perceived competence was also portrayed in the focus groups through a reference to
improved fitness levels and skill developments. According to Allender and colleagues
(2006), self-perception is extremely important in motivating people to participate in all
types of PA. In response to why they participate in ECPA, one student responded; “yea
124
it’s good and ya improve like or get on a team”. Another student commented that “your
skills are improving and maybe your fitness so ya feel better about yourself”.
These comments support previous findings that perceived physical competence and
perceived importance of being fit or good at sports were among the main correlates of
adolescents’ PA (Inchely et al., 2011; Strong et al., 2005; Telama et al., 2005). Paxton
and colleagues (2004) study on perceived competence and PA in youth (aged 9-14 years)
reported that when perceptions of competence increased, so did activity levels. Hilland
and colleagues (2009) also found a strong, positive link between perceived PE worth and
skill level in PE. A study by Telama and Pieron (2005) also suggested that young people
who show a high level of perceived competence also have a positive attitude towards
school and PE. Weiss (1996) and Welk (1999) suggested that when youth perceive
themselves as being good at an activity, they increase their attraction to this activity and
will do it more often. In this study, the views of the students show that their perceived
competence increases through participation in ECPA, thus making ECPA valuable to
them, and indirectly, potentially influencing their attitude (Telama and Pieron, 2005),
their activity levels (Hilland et al., 2009; Paxton et al., 2008). This highlights the
importance of adolescents being made feel they are competent at ECPA, whatever their
ability level, in order to encourage more students to participate on a regular basis.
Social Influences
The third main theme that emerged from the regular ECPA participation groups was the
social aspect to involvement. The main sub-themes identified were peer and parental
support.
Peer Support
The students reported being with friends as another main attraction of ECPA
participation. When asked why ECPA was attended regularly, one student replied
“Having a laugh with your mates”. Other students felt that the presence of friends made
ECPA more enjoyable “Being there with your mates is deadly cos ya have better crack”.
125
Tannehill and collegues (2011) qualitative research, which included several focus group
discussions with Irish children and adolescents found that post-primary males and
females all referred to being with friends as a major reason for participating in PA.
Allen’s (2003) research found that that sport participation provided older children (aged >
12 years) with an opportunity to satisfy their need to belong, this is also found in the
current study as indicated by this student’s quote “you’re communicating with more
fellas, making more friends, helps ya at talking and ya get associated with people better”.
McCarthy and Jones (2007) focus group study with children (aged 7-12 years) identified
themes of social involvement and social recognition of competence when sourcing
enjoyment of PA. Social interaction and support from peers have previously been
positively associated with PA in youth (Van Der Horst et al. 2007; Biddle et al. 2005;
Sallis et al. 2000). This social interaction has been previously identified by Berger and
colleagues (2007) who suggested that adolescents try to do what their peers do and that
they have similar desires and values “some people [friends] just encourage ya to go
because like ... its [ECPA] fun and they probably think that you’ll like it ... and maybe
they won’t have to go home on their own like ...”.
This support from peers also has the potential to make ECPA more enjoyable for
participants and/or improve students’ perceived competence in their physical ability, thus
making ECPA participation more attractive. Allen (2003) stated that older children are
more strongly influenced by peers in sport than younger children (aged < 12years) and
that encouragement, social involvement and friendships are important sources of sport
enjoyment.
Parental Support
Another social aspect linked to regular ECPA participation is the influence of parents.
Two of the main ways adolescents reported that their parents supported their participation
in ECPA revolved around parental approval and parental encouragement.
126
Parental Approval
Parental approval was the main aspect of parental support that came across from students
in response to the question regarding parental/guardian encouragement of their ECPA
participation in school. The comments were generally very positive regarding parental
support and it was obvious that students’ appreciated and valued this support. The
comments included “They like to see ya having fun, enjoying yourself” and “they want
ya doing something ya enjoy, so you’re not being lazy or sitting around”. Certain
comments highlighted how the students could identify that their parents wanted the best
for them and were looking out for them; “They know you’re not losing from it [ECPA
participation], better than hanging around on the streets or whatever”.
Focus group studies have found positive associations between socially significant others
(including parents) and PA participation (Tannehill et al., 2011; McCarthy and Jones,
2007). Family support has been consistently associated with PA in youth in reviews of
quantitative studies (Biddle et al., 2005; Van Der Horst et al., 2007). Similarly, social
interaction has been consistently associated with PA in reviews of studies (Allender et
al., 2006). Again, most of the reports have been investigating cross-sectional studies. A
longitudinal study of children and adolescents found that family and social support were
important correlates of PA in youth (DiLorenzo, 1998). More longitudinal studies are
needed to identify possible changes in adolescents’ perception of their parents support
and its value, as they move through adolescence.
Verbal Encouragement
The regular ECPA participants also mentioned verbal encouragement from parents and it
was clear that this was important to the students and made them feel more positive about
themselves. Comments included; “Me Da goes to me matches and me Ma encourages
me” and “I get encouraged to go … me Da an all, he gets me inta everything”. Some
comments also showed that verbal encouragement from parents may have a positive
influence on the students’ perceived competence in ECPA; “yea my Da does tell me to go
if you want to go ... that you will improve your skills and that you will get better”.
127
Brustad (1996) stated that children who are exposed to strong parental support have a
higher level of perceived competence than children who receive less parental support.
McElroy (2002) also suggested that parental factors could have an effect on children and
adolescents’ PA participation by having an influence on their perceived competence.
McCarthy and Jones (2007) qualitative study reported that children’s (aged 7-12 years)
feelings of self-worth were enhanced by verbal and non-verbal support from parents.
Parental approval and verbal encouragement were the main sources of parental support
for the students in these focus groups. The students’ belief that their parents wanted them
to participate and wanted the best for them was a positive influence on their participation.
This highlights how influential parents can be in terms of their children’s participation in
PA, and ECPA in school. Post-primary schools need to make parents aware of ECPA on
offer in schools on and highlight how parents can play a major role in encouraging their
children to participate and potentially, benefit from it. There was no mention of other
types of parental support such as parental modelling or logistic support in the focus group
discussions. Parental modelling relates to the PA behaviour or the sedentary behaviour of
parents. Logistic support refers to the provision of transportation to PA opportunities
(Smith and Biddle, 2008).
Another theme that emerged from the discussions was the importance students placed on
ECPA participation.
Table 23 – The Importance of ECPA to those who Regularly Participate
Theme Sub-Theme
Importance of ECPA to Students - Making School More
Appealing
- Improved Attendance/Effort
in Class
Importance of EPCA to Students
The view of school life without ECPA was quite a negative one for many students,
demonstrating how positive these students feel about ECPA in school. When asked if
128
having no ECPAs available would affect their school life, one student summed up the
general view of many regular participants “all u’d do would be come into school and do
your work, you might not do it, then you’d get in trouble ... Got nothing to look forward
to ... Nothing after school and all”.
The main sub-themes from the discussions were making school more appealing, and an
improvement in attendance rate and effort in class.
Making School More Appealing
It was clear from many comments throughout the focus group discussions that ECPA was
valued by students and made school more appealing for many. When asked about the
importance of ECPA in school and how it might affect them if there were no ECPA,
students responded with comments such as “School can be so boring, sports (ECPA) can
make it interesting”, “it’s the best thing about school”. It also gave some students
something to look forward to during the school day “Like if you’re in trouble and maybe
ye had a bad day in school, ya can still look forward to after school stuff [ECPA] ...
That’s if your let!” and “if you are involved then you always have something to look
forward too”.
Motivation to Attend School and Make More of an Effort in Class
ECPA participation was seen as being a motivational factor for some students’ to actually
attend school more often and make more of an effort in class. One student explained
that; “Sometimes the only thing getting ya up out of bed is the thought of the sport
[ECPA] … and the tournaments”. Others suggested, “there would be nothing to look
forward to in a few weeks time or contests ... it [ECPA] gives ya the motivation to get
your work done to get out to the football” and “it [ECPA] keeps ya going in class ...
Thinking that later on like ya will be out on the field or doing table-tennis or whatever”
Some students also made reference to positive encouragement from peers to make sure
they were in school to attend ECPAs “yea, when like people are not going in, like oh I’m
staying off, but then, they say there’s training on … I have to go in”. Others suggested
129
that the threat of not being allowed participate in ECPA due to mis-behaviour or lack of
work done in class was motivating them to try harder in class “cos it [ECPA] motivates
ya to do better ... cos ya can’t do the sports if your misbehaving in class ... like, ya don’t
have to be smart, ya just have to do what you are asked, if ya do that, ya get to go out”,
“if ya don’t do your work ya can’t get out there and do it [ECPA]”, “some people might
mess all the time aswell if there was none [ECPA] .. At least with extra-curricular ya
have something to behave for”.
These comments provide useful information that demonstrates how important the
opportunity to participate in ECPA during or after school may be as a method of
improving student behaviour, student attendance and student commitment at school.
They also link in with the previous point on how ECPA can make school more appealing
for these students. An OECD report on ‘Equity and quality in education, supporting
disadvantaged students and schools (2012) revealed that students from low socio-
economic background were twice as likely to be low performers, implying that personal
or social circumstances are obstacles to achieving their educational potential. Across
OECD countries, 20% of young adults on average dropping out before finalising upper
secondary education. In Ireland, students from low socio-economic backgrounds are 2.4
times more likely to be low performers than their peers with high socio-economic status.
Students whose parents have low economic attainment have twice as high a risk of low
performance and boys are more at risk of low performance than girls. The report makes
numerous recommendations and proposals in order to try and decrease drop-out and
improve completion numbers. There is no mention of sport, physical education or ECPA
in school in the report. Latest reports from the ongoing ESRI ‘Growing up in Ireland’
study (Layte and McCrory, 2011) reveal that adolescents (aged 13 years) from low socio-
economic backgrounds were less likely to be involved in organised sporting activities
than those from higher socio-economic backgrounds.
This current study has students from low socio-economic backgrounds at its core. The
views from the students who regularly attend ECPA highlight the potential of PA in
school, as an incentive to actually be in school and to try harder in class. It demonstrates
130
their perception of how important ECPA participation is to them in school and the
difference it can make to their school experience. Previous research has concluded that
PA can lead to higher academic achievement in school (Strong et al., 2005; WHO, 2003).
According to Shephard (1996) increased PA levels may be related to increased self-
esteem in adolescent’s, which could be expected to increase classroom behaviour and
academic performance. A study by Coe and colleagues (2006) also found that higher
grades were associated with vigorous physical activity. Shephard (1996) also suggested
that PA during the school day, with an emphasis on PE, may lead to increased arousal,
reduced boredom, increased attention span and increased concentration. These positive
psychological effects have the potential to improve classroom behaviour and possibly
increase learning capacity. Biddle and Asare (2011) revealed that many studies have
highlighted a possible link between the integration of PA in the school system in order to
help young people learn better and reduce the likelihood of negative classroom
behaviours. The comments from the students in these focus groups provide support for
these theories. Finn (1989) suggested that participation in ECPA gives students an
alternative route through which students having academic difficulties can maintain
contact with the school environment. ECPA, as a viable opportunity for adolescent’s to
be physically active in post primary school, has the potential to positively affect the
attitude students have towards school and study. This highlights more potential benefits
of ECPA participation in schools, whereby improvements to student discipline,
attendance and academic achievement could be realistic outcomes. This could be most
effective in schools that cater for students from socially and economically disadvantaged
communities, such as the four involved in this particular study.
Overall, the main motivations for ECPA participation, which emerged from these focus
groups, were enjoyment, perceived competence and social factors. These factors are in
line with the quantitative findings, which found that regular ECPA participants scored
higher on all seven YPAP model based subscales than those students who never
participated in ECPA. When these views from the regular ECPA participants are related
to the YPAP model (Welk, 1999) to gauge adolescent PA behaviour, a positive picture
emerges. It is clear that under the pre-disposing factor labelled ‘is it worth it?” the
131
answer is a resounding yes, as they constantly refer to enjoyment of participation, and
even go so far as stating that it motivates them to behave in class in order to ensure they
could take part in ECPA. Under the pre-disposing factor labelled ‘am I able’, the positive
reference to perceived competence from the regular ECPA participant’s shows that the
answer here is also positive. Regarding the enabling factors from the model (Welk,
1999), the regular participants are more likely to be physically active than the students
who never participate due to a higher perceived competence in themselves, which
supports the YPAP model. This present study did not investigate the ‘access’ or
‘environment’ variables under the enabling factor of the model, however, there was
control for ECPA by ensuring that it was offered in each of the four schools.
The positive social theme that emerged from the regular ECPA participants in relation to
both peer and parental support provides back up for the YPAP model in terms of
reinforcing factors being an important influence on PA behaviour. Family and peer
influence are both variables under the reinforcing component of the model. The model
suggests that the more positive the peer and parental support is, the more likely it is that
children and adolescents will be involved in PA. The views of the regular ECPA
participants suggest this to be the case. Students referred to being with friends as a major
motivation for ECPA participation.
5.3 Barriers to ECPA Participation
Data from the focus groups with students who never participated in ECPA were filed
under two headings: a) barriers to ECPA participation (Table 24) and b) the importance
of ECPA to those who never participate (Table 25). Results are presented under key
themes and their relevant sub-themes.
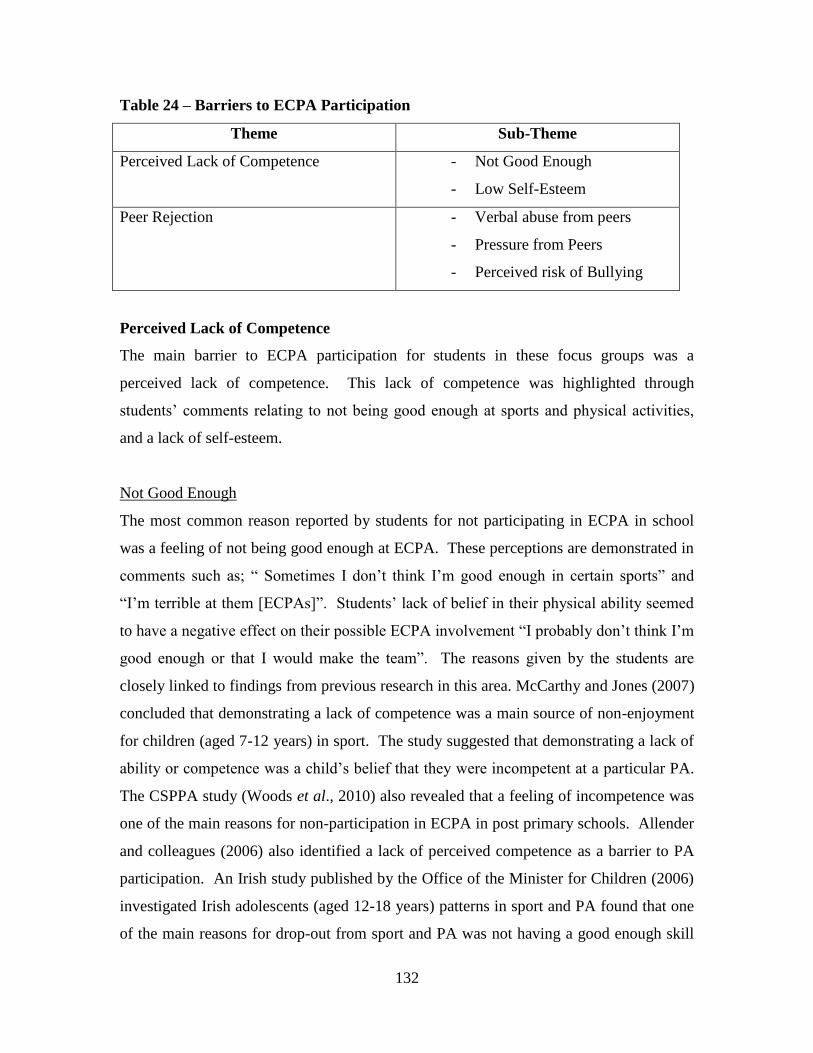
132
Table 24 – Barriers to ECPA Participation
Theme Sub-Theme
Perceived Lack of Competence - Not Good Enough
- Low Self-Esteem
Peer Rejection - Verbal abuse from peers
- Pressure from Peers
- Perceived risk of Bullying
Perceived Lack of Competence
The main barrier to ECPA participation for students in these focus groups was a
perceived lack of competence. This lack of competence was highlighted through
students’ comments relating to not being good enough at sports and physical activities,
and a lack of self-esteem.
Not Good Enough
The most common reason reported by students for not participating in ECPA in school
was a feeling of not being good enough at ECPA. These perceptions are demonstrated in
comments such as; “ Sometimes I don’t think I’m good enough in certain sports” and
“I’m terrible at them [ECPAs]”. Students’ lack of belief in their physical ability seemed
to have a negative effect on their possible ECPA involvement “I probably don’t think I’m
good enough or that I would make the team”. The reasons given by the students are
closely linked to findings from previous research in this area. McCarthy and Jones (2007)
concluded that demonstrating a lack of competence was a main source of non-enjoyment
for children (aged 7-12 years) in sport. The study suggested that demonstrating a lack of
ability or competence was a child’s belief that they were incompetent at a particular PA.
The CSPPA study (Woods et al., 2010) also revealed that a feeling of incompetence was
one of the main reasons for non-participation in ECPA in post primary schools. Allender
and colleagues (2006) also identified a lack of perceived competence as a barrier to PA
participation. An Irish study published by the Office of the Minister for Children (2006)
investigated Irish adolescents (aged 12-18 years) patterns in sport and PA found that one
of the main reasons for drop-out from sport and PA was not having a good enough skill
133
level (De Roiste and Dinneen, 2005). The ongoing ESRI ‘Growing up in Ireland’
longitudinal study (Layte and McCrory, 2011) found that the main reason given by
thirteen-year-old students who did not participate in PA on a regular basis was ‘I’m no
good at games’.
Allender and colleagues (2006) reported that being unable to demonstrate competency of
skills to peers was a discouraging factor for adolescents in physical education. Fahey and
colleagues (2005) reported that the one aspect of sport that a majority of students did not
like was getting left out because you are not good enough. The risk of feeling excluded
in sport stands out as a widespread negative concern in what otherwise is a generally
positive picture. He also alludes to a group of students who are interested in sport but are
not good at it, and suffer the indignity and discouragement of being left out of teams or
games because they are not seen as being good enough, an experience that causes more
concern to students in second-level schools than any other possible negative aspects of
sport he looked at (Fahey et al., 2005).
Low Self-Esteem
The students’ perceived lack of competence was also highlighted through comments
related to low self-esteem. The following reply from a student in response to why they
do not participate in ECPA highlight their perceived lack of ability and the consequent
impact this can have on their mental health “Yeah, i crack easily under peer pressure, so
if I’m not good at the sport and i have the ball, I’d probably just panic”. The fear of
failure and nervousness that this student commented on, highlight a perceived lack of
competence from students. A study by Telama and colleagues (2005) investigating the
physical activity levels of students (12-15 years) found that the least active group had low
perceived physical competence and their attitude towards PE was negative. The
quantitative results from the present study show that the students who never participate in
ECPA score lower on the psychological well-being subscales of perceived physical
competence and physical self-worth than the students who regularly or sometimes
participate. The quantitative results, alongside the qualitative findings here go some way
to highlighting the lack of self-esteem in some students who never participate in ECPA.
134
Peer Rejection
The second main theme under barriers to ECPA participation was peer rejection. This is
the lack of support these students feel they receive from their peers in terms of ECPA
participation. The main sub-themes that were developed under peer rejection were verbal
abuse from peers, pressure from peers and bullying.
Verbal abuse from Peers
Verbal abuse from peers seemed to have a real impact on the ECPA participation levels
of these students. Comments from students illustrated just how influential verbal abuse
from peers could be in terms of ECPA participation; “if im not good enough and then the
people that are there are pressurising ya and slagging ya, thats the reason i dont go”. The
comments highlight how the students here feel that they are not part of the group or part
of the team. There is n sense of belonging for them in ECPA. This is in stark contrast to
the views of the regular participants who gave ‘being with friends’ as one of their main
motivations for participating in ECPA. This verbal abuse from peers shows that students
feel they must have a level of physical competency in order to attend ECPA. This is
something that needs attention in schools. Again, the quantitative findings match up with
students who never participate in ECPA scoring lower on perceived physical competence
and physical self-worth than those students who sometimes or regularly participate,
showing the strength of these results from different methods of measurement.
Pressure from Peers
In this case, certain peers made the students feel uncomfortable at ECPAs “yea messers
and guys who when you want to try something will pressure you to give them the ball”.
Others suggested that they nearly could not make a mistake for fear of pressure from
regular participants “yea like if you make a mistake they give out to ya”. Some
comments even hinted at pressure from their own friends in terms of participating, “cos if
my friends told me not to go then i would feel that i wasn’t good enough”. These views
from students correspond with a study by O’Dea (2003) that reported negative pressure
from peers as a barrier to PA participation.
135
Bullying
According to Collins and colleagues (2004), bullying has become a major issue in school
life and can have an impact on the students’ social, emotional, psychological and
educational development. Some of the comments from students regarding reasons for not
taking part in ECPAs suggested that one or more individuals made participation an
unpleasant experience, as one student noted “there are certain lads who do certain sports
who completely ruin it for everyone else”. Other comments indicate that bullying is a
factor involved in non-participation for some students “When you are going to it [ECPA]
and you make somebody mad, they could push you and all and you wouldn’t really like
that stuff”. Comments such as this suggest that these students may wish to attend, yet are
being discouraged from engaging in ECPAs due to factors such as bullying. Some
students showed a fear of bullying starting in ECPAs and possibly carrying on into the
classroom or around the school;
“if you went to a certain sport and there were people there who were really good at it and
really competitive and you were terrible, they might start picking on ya and slagging ya,
maybe even for the rest of the year”.
This comment shows how influenced students are by peers, and how the threat of further
bullying, over a longer period could further reduce the possibility of these students
participating in ECPA. Overall, the theme of peer rejection has been identified as a very
influential one. The views from students highlight just how much they are concerned by
what peers do and say.
When the views from the students who never participated in ECPA are related to the
YPAP model (Welk, 1999) to gauge adolescent PA behaviour, a less positive picture
emerges than that of the regular ECPA participation groups. Under the pre-disposing
factor labelled ‘is it worth it?” the answer to the question is negative, as they made
reference to many barriers to participation including a perceived lack of competence and
peer rejection. Under the pre-disposing factor labelled ‘am I able’ from the model, the
answer is no, due to these students highlighting, again, their lack of perceived
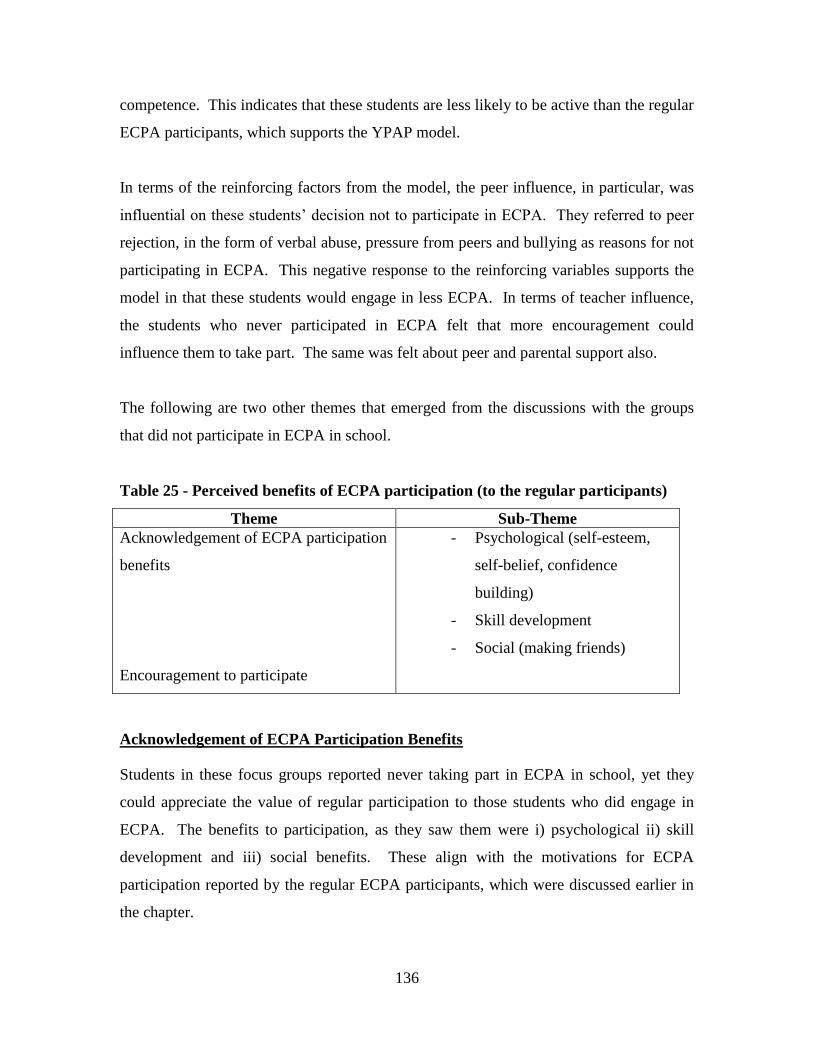
136
competence. This indicates that these students are less likely to be active than the regular
ECPA participants, which supports the YPAP model.
In terms of the reinforcing factors from the model, the peer influence, in particular, was
influential on these students’ decision not to participate in ECPA. They referred to peer
rejection, in the form of verbal abuse, pressure from peers and bullying as reasons for not
participating in ECPA. This negative response to the reinforcing variables supports the
model in that these students would engage in less ECPA. In terms of teacher influence,
the students who never participated in ECPA felt that more encouragement could
influence them to take part. The same was felt about peer and parental support also.
The following are two other themes that emerged from the discussions with the groups
that did not participate in ECPA in school.
Table 25 - Perceived benefits of ECPA participation (to the regular participants)
Theme Sub-Theme
Acknowledgement of ECPA participation
benefits
Encouragement to participate
- Psychological (self-esteem,
self-belief, confidence
building)
- Skill development
- Social (making friends)
Acknowledgement of ECPA Participation Benefits
Students in these focus groups reported never taking part in ECPA in school, yet they
could appreciate the value of regular participation to those students who did engage in
ECPA. The benefits to participation, as they saw them were i) psychological ii) skill
development and iii) social benefits. These align with the motivations for ECPA
participation reported by the regular ECPA participants, which were discussed earlier in
the chapter.
137
Psychological
In response to the question of did they believe the regular participants benefited from
attending, one student commented that “ People who take part regularly can build up self-
belief that they can do it [ECPA]”. Another student felt that, “if they [regular
participants] get complimented a lot it would raise their self-esteem”. They could also
identify a greater level of confidence in them “ya can tell, even when you hang around
with them, how confident they are”.
Skill development
The suggestion that the students who regularly participated in ECPA would improve their
skill development was regularly linked with higher confidence levels, “You would be
getting better at the sports and once you improve you build confidence ... I think if you
scored a goal or something, that makes ya feel good about yourself”. This highlights the
students’ view that with improved ability comes greater self-confidence.
Social
The students also made reference to the positive benefit of getting on with people better,
“Because when you are doing something [ECPA] you could, like when you are not
getting on with people you could get on better with them during that sport”. They could
recognise that ECPAs were a chance to get to know other students better, even ones they
did not get on with previously.
This recognition of the benefits of regular ECPA participation is positive and shows that
there is potential to attract more students to participate. The students who never
participate provide enough information to show that they know that participation can be
beneficial, the key is to actually get them attending in order to gain from ECPA
engagement.
Encouragement to Participate in ECPA from Peers, Parents and Teachers
When asked what could possibly make them attend ECPA, students referred to more
encouragement from significant others (parents, peers and teachers) as a possible
138
motivational factor in attracting them to ECPA. One student suggested, “if they
[parents] give you belief then you will go and you can reach your goal”. In terms of peer
encouragement, a student reported that it would “make you feel that you were good at the
sport … give ya a bit of a confidence boost”. Also on peers, a student suggested that “if
they say you are good enough to go, then you will believe and you might go”. Others felt
that the presence of friends would be a positive factor for participation, “Having friends
with you because they’ll encourage you”. When asked about more encouragement from
teachers, the response was a resounding yes.
Again, this highlights the fact that many students who do not take part in ECPA may be
encouraged to do so in the future. It also demonstrates how much of a positive influence
peers, parents and teachers can potentially be in affecting students participation in ECPA.
Teacher influence needs to be investigated in research.
5.4 Summary of Qualitative Data Analysis
Overall, the regular ECPA participants were motivated to attend by enjoyment, perceived
competence in themselves and by social influences. The comparison with the literature
shows that the views of these adolescent males are typical with findings from previous
research into this area. Another theme that emerged from the regular participation groups
was that of the importance they placed on ECPA participation in school. This positive
perception of ECPA was making school a more enjoyable experience for students and
giving them something to look forward too. This suggests that if more students
participate in ECPA, then schools could potentially reap the potential benefits of lower
absenteeism rates and higher levels of effort inside the classroom. This could in turn,
lead to improved academic performance from students, as highlighted in various studies
(Coe et al., 2006; Shephard, 1996). This could be particularly valuable for students from
disadvantaged backgrounds such as those involved in this study.
The main barriers to ECPA that emerged from focus group discussions with the students
who never participated in ECPA were a perceived lack of competence and peer rejection.
The perceived lack of competence finding is in line with previous investigations into PA
139
behaviour (McCarthy and Jones, 2007) and ECPA participation (Fahey et al., 2005;
Woods et al., 2010). One major positive to come from discussions with the students who
never participate in ECPA was their appreciation of the benefits of ECPA participation to
those that regularly attended. This indicates that the potential is certainly there to
encourage these students to get involved. If they can acknowledge the potential benefits
of participation to those that do participate regularly, then there is an opportunity to
encourage them to attend. As already mentioned, one of their suggestions as to what
might make them participate was more encouragement from significant others (peers,
parents, teachers). This demonstrates how a positive attitude from significant people in
their lives could benefit them and help to overcome the major barrier of a lack of
perceived competence.
The qualitative data highlighted here is in line with much of the quantitative data
discussed in chapter four. The themes that emerged form the regular ECPA participation
focus groups and the focus group students that never participated in ECPA backed up the
quantitative findings. Themes of perceived competence, enjoyment and social influences
as motivators for participation, support the high scores that were reported under the
psychological and psychosocial YPAP model subscales for the regular ECPA
participants. Themes of a lack of perceived competence and peer rejection as barriers to
ECPA participation support the lower scores reported under the psychological and
psychosocial YPAP model subscales from the students who never participate in ECPA.
This emphasises the value of the mixed method approach to data collection research in
this study.
Strengths and Limitations
Many studies into PA behaviour in adolescents are cross-sectional (Altintas and Hulya
Asci, 2008; Fahey et al., 2005; Smith et al., 2007; Sabiston and Crocker, 2008). This is a
limitation in regards to what we can predict from adolescents as they increase in age.
Longitudinal studies need to be the focus of attention in research to assess students’
attitudes to ECPA and their participation levels in it. One of the strengths of this study
was the longitudinal approach and finding out students’ views on ECPA and participation

140
levels at three time points throughout the academic year. The findings from the focus
group discussions showed that the students were consistent in their views and attitudes
towards ECPA over the whole year. The combination of qualitative and quantitative
research methods used in this research improves the validity of results. More qualitative
research with adolescents is required if real insights to what they think about PA and
ECPA are to be attained. A weakness in this study is that it only included males; there is
a need to replicate this study amongst females. Additionally, future longitudinal studies
over a number of years, particularly throughout adolescence would be worthwhile to
assess trends over a longer period and potentially finding a way of combating the
reduction in PA, as students get older.
141
Chapter Six
6.0 Conclusions and Recommendations
6.1 Implications of the Study
The first aim of the study was to explore the ECPA participation levels of a cohort of
post-primary school, Irish adolescent males (aged 12-15 years) from disadvantaged
backgrounds. The majority of the students were involved in ECPA on a regular (> 2
times a week) basis (43%). The second highest cohort was the sometimes (once a week)
group (41%). Only 16% of the students reported to never take part in ECPA in school.
This is a positive finding, highlighting the large percentage of students (84%) that avail
of ECPA on a weekly basis.
The second aim of the study was to assess PA levels in terms of HPA (> 60 minutes
MVPA daily) and daily pedometer step count. The vast majority of students (86%) did
not meet the recommended PA guidelines for children and young people (> 60 minutes
MVPA daily, DOHC, 2009). The average amount of days per week students achieved >
60 minutes MVPA was 4.98 (+ 1.21). This may have negative consequences for their
current and future health. The average daily step count over the academic year was
11,981 (+ 3385). This average is well below the closest age group (males, 6-12 years)
daily step count guidelines of 15,000 steps per day. At present, there are no official step
count guidelines for adolescents. The study found that the higher the level of ECPA
participation, the higher the average daily step count and the average number of days per
week students achieved > 60 minutes MVPA. These results highlight the potential value
of ECPA participation as a source of increasing the PA levels of adolescent males.
A third aim of this study was to investigate the possibility of regular ECPA participation
being linked to a positive psychological well-being. This was examined by using a
combination of quantitative (self-report questionnaire and pedometer step count) and
qualitative (focus groups) measures. The quantitative data revealed that the higher the
ECPA participation level, the higher the YPAP model based subscale scores. Therefore,
the students who participated in ECPA on a regular basis had the highest scores for
142
perceived physical competence, physical self-worth, liking of games and sports, fun of
physical exertion and liking of vigorous exercise. The students who reported to never
participate in ECPA had the lowest YPAP subscale scores. These findings again show
the potential positive impact on the psychological well-being of adolescent males from
regular participation in ECPA.
The final aim of the study was to try and understand the motivations and barriers to
participation in ECPA for students. The focus group discussions with students who
regularly participated in ECPA found that the main motivations for taking part were
‘enjoyment’, ‘perceived competence’ and ‘to be with mates’. The qualitative findings for
this group supported the quantitative data, which showed that the regular ECPA
participants recorded the highest levels of psychological well-being on the YPAP based
subscales. This particular group indicated how much value they placed on ECPA and
how important it was as part of school life. They felt that it encouraged them to make
more of an effort in class and, in some cases, even attend school for fear of not being
allowed take part due to mis-behaviour or lack of attendance. This is hugely important
given that these students are from socially and economically disadvantaged communities.
The students who reported to never participate in ECPA gave a ‘lack of perceived
competence’ and ‘peer rejection’ as the main barriers to their lack of involvement. This
reference to a lack of perceived competence correlated with the quantitative data where
56% of the students who reported to never participate in ECPA, gave ‘not being good
enough’ as the main reason. These qualitative findings also supported the quantitative
data, which showed that the students who never participated in ECPA scored lowest on
all YPAP based subscales. These students could, however, recognise the benefits of
ECPA participation to those students that regularly participated. They acknowledged
their higher levels of confidence, making more friends and their improvement in sporting
skills. This shows that there is potential to encourage these students to take part in ECPA
more often. If they can identify the benefits of participation to the regular ECPA
participants, then it must be possible that they would like to benefit from taking part also.
This group suggested that more encouragement form significant others (parents, peers,
143
teachers) may entice them to engage more in ECPA. This highlights the importance of
significant others in the PA behaviour of adolescent males and demonstrates how much
of an influence they can be.
The only two predictors of ECPA participation from the outcome measures and the
YPAP based subscales were the school students attended and perceived physical
competence. This highlights the importance of what post-primary schools are offering
for ECPA, how often they are available and the importance a school places on ECPA.
Students can only participate in ECPAs if they are available to them. Perceived physical
competence has been shown from these results to be extremely important to adolescent
males. The findings highlight that many adolescent males need to feel that they are
physically competent in order to participate. This may be an indication that ECPA has its
main focus on competition and that it possibly only caters for students with more
physically ability.
Overall, the hypothesis of the study, guided by the YPAP model, was proven as students
who participated in ECPA on a more regular basis recorded a higher step count, a higher
level of HPA (> 60 minutes MVPA) and had a higher level of psychological well-being
than those students who never participated in ECPA. The longitudinal approach and
mixed method design of this study, which produced a triangulation of results from self-
report questionnaires, pedometers and focus groups adds strength to the validity of these
findings. It also demonstrates that ECPA participation may actually depend on what
school students attend and how physically competent they perceive themselves to be.
6.2 Future Research Recommendations
This study has highlighted the need for further investigation into the PA behaviour of
adolescents and the impact participation can have on their psychological well-being. The
following recommendations could assist in improving our understanding of adolescent
PA behaviour and attitudes towards PA and ECPA.
144
This study has shown the value of pedometers as an effective measure of PA
levels in adolescents. In order to establish if adolescents are achieving the correct
number of steps daily, then clear recommended guidelines need to be established
for this age group. At the moment, it is very unclear as to how many steps
adolescents should be taking daily to achieve health benefits. There are
recommendations for children (males, aged 6-12 years, > 15,000 steps daily) and
for adults (aged >18 years, 10,000 steps daily, Tudor-Locke et al, 2004), however,
no official guidelines exist for adolescents (aged 12-18 years). This demands
attention and will decrease the value of pedometers as an accurate PA measuring
tool until clear guidelines are made available. We know that children and
adolescents are recommended to engage in > 60 minutes MVPA daily, however,
to improve the accuracy and effectiveness of using pedometers, we need clear,
accurate recommendations for the number of steps adolescents should be taking
on a daily basis.
The majority of studies investigating PA behaviour in adolescents are cross-
sectional. In order to effectively track the PA and ECPA behaviour of
adolescents, a longitudinal approach to research needs to be encouraged. This is
vital with adolescents, as research trends have shown that PA, PE and ECPA
participation levels decrease with an increase in age during adolescence. A
strength of this present study was that assessment was carried longitudinally over
a full academic year, however, a longitudinal assessment over a number of years
may provide more of an understanding as to why and when adolescents begin to
decrease their PA and ECPA levels of participation.
Future studies in this area need to use a mixed quantitative/qualitative design in
order to produce a clear and accurate set of results relating to adolescents and
their participation levels in and attitude towards ECPA and PA. The combination
of self-report questionnaires, objective measures (pedometers) and focus group
discussions will allow researchers to check for consistency in findings. The focus
group discussions have the potential to be of most importance. Focus group
145
discussions have the potential to provide a real insight to the honest views and
attitudes of adolescents on PA and ECPA that may not so accessible via self-
report measures alone.
In order for ECPA to become more effective, post-primary schools must
acknowledge the value of an ECPA programme. ECPA needs to become part of
school policy, alongside PE in the promotion of PA for post-primary school
students. Schools have the best opportunity to reach the largest number
adolescents for the most amount of time during the week throughout the academic
year. This is a window for opportunity. With many schools not allocating the
recommended 120 minutes of PE per week for all post-primary students, and
many others not even having a fully qualified PE teacher on the staff, ECPA in
schools can provide opportunities for students to get physically active during the
school day. Schools and principles need to need to acknowledge the availability
of ECPA programmes and encourage teachers, other than just the PE staff, to get
involved in organising or supervising ECPAs at lunchtimes or after school. The
findings from the present study show that more students participating in ECPA
could potentially be to the benefit of schools in terms of students having an
improved psychological well-being, working harder in class, lower absenteeism
rates and increasing the appeal of school. These potential benefits could be
particularly important for ‘DEIS’ schools such as the ones involved in the present
study.
Teachers, in particular PE teachers, have a huge role to play in the promotion of
ECPA in post-primary schools. PE teachers have greatest access to students’ time
in relation to PA, therefore their role is crucial. To go alongside PE programmes,
ECPA needs to be available to all students in post-primary schools. The research
shows that PE programmes are still dominated by competitive, team games and
ECPA seems to follow suit. The regular ECPA participants in this study
highlighted the importance of ECPA participation to them, demonstrating the
value of ECPA to many students. However, the students who reported never
146
participating in ECPA reported a lack of competence as the main barrier to
participation. This suggests that the emphasis of ECPA in school is on
competition. Therefore, PE teachers need to ensure that some of the ECPAs on
offer are based around fun, enjoyment and just getting physically active to
encourage more students to get involved. There is a place for the more
competition based ECPAs, as the number of regular participants from this study
showed, however, to meet the needs of the students who are less competent at PA,
a greater variation in ECPA needs to be available. For those that just want to be
active or feel part of something within PA in school, in-house tournaments or
non-competitive lunchtime or after school ECPAs could be organised. To achieve
this, more teachers, other than just the PE staff in schools will need to make
themselves available to help organise, run or supervise ECPAs. PE teachers could
also look for support from local sports clubs, sports development officers or local
sports partnerships to increase the amount of ECPA they are able to offer all
students in schools. The present study found the school students attended was one
of only two factors that predicted participation in ECPA. This emphasises how
important a role PE teachers have in organising ECPA programmes and finding
the support to actually run them.
Another potentially important initiative for PE teachers to get their school
involved in is the ‘Active Schools Flag’. This Department of Education and
Skills initiative (2009) looks to reward those schools showing a strong
commitment to PE and ECPA. The flag, however, is extremely difficult to
achieve, highlighted by the fact that so few post-primary schools have been
awarded the flag. The Department should be looking at making this flag more
achievable for schools, rather than putting it out of most schools reach. One of
the biggest difficulty schools have in meeting the criteria to obtain the flag is the
requirement that all students in post-primary school receive at least 120 minutes
of PE per week. Research has shown that many schools in Ireland are not
allocating this amount of time for junior or senior cycle students. If the 120
minutes of PE per week are not achieved, ECPAs in schools or any other PA
147
promotion are not even taken into consideration. The amount of ECPA on offer
in schools should be acknowledged, even if the amount of PE allocated is not the
required amount. Schools should be rewarded for giving their students
opportunities to be physically active and promoting a physically active lifestyle.
This is something the Department of Education and Skills in Ireland need to have
a closer look at.
Overall, the PE teacher has a vital role to play in the promotion of PA in the post-
primary school setting. The focus of ECPAs, competitive or not, should be on
providing an enjoyable, friendly atmosphere for students, in which everyone
participating can be made feel welcome and competent in their own physical
ability, whatever their level of physical ability may be. This could potentially
assist in the continuation of adolescent’s participation in PA going into adulthood.
The importance of the PE teachers influence on the PA behaviour of adolescents
should not be underestimated and more research needs to target PE teachers and
their role in getting adolescents in schools physically active, particularly for
students from disadvantaged areas.
Parents also have an important role to play in the promotion of ECPA
participation for adolescents. The results from this study showed that the regular
ECPA participants were influenced by positive support from parents. Parents
need to be made aware of the positive role that they can play in the PA behaviour
of their children. They could be encouraged to volunteer their help in supervising
after school ECPAs or just by verbally encouraging their children to take part in
ECPA, regardless of their ability in it. Positive support, as highlighted by regular
ECPA participants, can have a huge bearing on adolescents ECPA participation
levels and on their psychological well-being.
Other recommendations for future research from this study would be to repeat the
same study again, except with females of the same age. This would allow
comparisons to be made between levels of PA, ECPA, impact on psychological
148
well-being and motivations and barriers to ECPA participation. Again, this would
aid our understanding of adolescents’ attitudes towards PA and ECPA from a
female point of view. The present study was also a relatively small cohort of
students from only four schools. Future research would need to investigate the
relationship between ECPA participation and the psychological well-being of
students from all over Ireland to get a clear picture of the impact of ECPA
participation on adolescents in this country. A larger age range of students (aged
12-18 years) would also be worthwhile given the research trends of a decrease in
adolescents PA levels as they increase in age.
Overall, the study has brought attention to the possible value of ECPA participation to
adolescent males (aged 12-15 years) in post-primary schools. The low levels of research
into ECPA in post-primary schools and its potential impact on adolescents highlight the
lack of value placed on ECPA in this country. The findings from this study have shown
it is an area worth investigating further. The results show that even sometimes (once a
week) participation in ECPA can be beneficial to adolescent males in terms of daily PA
levels and their psychological well-being. The results also highlight barriers to
participation in the form of a lack of perceived physical competence and peer rejection.
The main recommendation from this study is that ECPA can play a crucial role in the
promotion of PA for adolescent males (aged 12-15 years) from disadvantaged
communities. ECPA must gain more recognition and schools/PE teachers need to foster
a motivational climate in ECPAs where enjoyment of participation, friendship and
competence are emphasised. This study supports continued efforts in promoting the
importance and value of ECPA in post-primary schools.
149
References
Abbott, R.A., Macdonald, D., Nambiar, S. and Davies, P.S.W. (2009). The association
between walking to school, daily step counts and meeting step targets in 5-17 year old
Australian children. Pediatric Exercise Science, 21, 520-532.
Alexander, L.M., Inchely, J., Todd, J., Currie, D., Cooper, A.R., Currie, C. (2005). The
broader impact of walking to school among adolescents: seven-day accelerometry based
study. British Medical Journal, 331, 1061.
Allen, J.B. (2003). Social motivation in youth sport. Journal of Sport and Exercise
Psychology, 25, 551-567.
Allender, S., Cowburn, G. and Foster, C. (2006). Understanding participation in sport
and physical activity among children and adults: a review of qualitative studies. Health
Education Research, 21(6), 826-835.
Altintas, A. and Asci, F.H. (2008). Physical self-esteem of adolescents with regard to
physical activity and pubertal status. Pediatric Exercise Science, 20, 142-156.
Atkin, A.J., Gorely, T., Biddle, S.J.H., Marshall, S.J. and Cameron, N. (2008). Critical
hours: Physical activity and sedentary behaviour of adolescents after school. Pediatric
Exercise Science, 20, 446-456.
Babkes, M.L. and Weiss, M.R. (1999). Parental influence on cognitive and affective
responses in children’s competitive soccer participation. Pediatric Exercise Science, 11,
44-62.
Badami, R., Mousavi, M.V., Wulf, G. and Namazizadeh, M. (2011). Feedback after
good versus poor trials affects intrinsic motivation, Research Quarterly for Exercise and
Sport, 82(2), 360-364.
150
Bailey, R. (2005). Evaluating the relationship between physical education, sport and
social inclusion. Educational Review, 57(1), 71-88.
Bailey, R. and Dismore, H. (2006). A review of research on the nature and function of
sport pedagogy 2004-2005. International Journal of Physical Education, 4, 144-148.
Bandura, A. (1997). Self-efficacy: The exercise of control. American Journal of Health
Promotion, 12, 8-12.
Bass, D. and Cale, L. (1999). Promoting physical activity through the extra-curricular
programme. European Journal of Physical Education, 4(1), 45-64.
Bassett, D.R.J., Ainsworth, B.E., Legett, S.R., Mathien, C.A., Main, J.A., Hunter, D.C.,
et al. (1996). Accuracy of five electronic pedometers for measuring distance walked.
Medicine and Science in Sports and Exercise, 28, 1071-1077.
Baumgartner, T.A., Jackson, A.S., Maher, M.T. and Rowe, D.A. (2007) Measurement for
Evaluation, in Physical Education and Exercise Science, New York: McGraw-Hill.
Belton, S. and MacDonncha, C. (2010). Reliability and validity of a new physical
activity self-report measure for younger children. Measurement in Physical Education
and Exercise Science, 14(1), 15-28.
Belton, S., Brady, P., Meegan, S. and Woods, C. (2010). Pedometer step count and BMI
of Irish primary school children, aged 6-9 years. Preventive Medicine, 50, 189-192.
Berger, B.G., Pargman, D. and Weinberg, R.S. (2007). Foundations of Exercise
Psychology, 2nd
Edition, USA: Sheridan Books.
151
Berndt, T.J. (1989) Obtaining support from friends during childhood and adolescence. In
D.Belle (ed), Children’s social network and social support, p.308-331, New York, John
Wiley.
Biddle, S. and Mutrie, N. (2001). Psychology of Physical Activity. London: Routledge.
Biddle, S., Fox, K. and Boutcher, S. (2000). Physical and Psychological Well-Being,
London: Routledge.
Biddle, S., Sallis, J. and Cavill, N. (1998). Young and Active – Young People and Health
Enhancing Physical Activity – Evidence and Implications. London: Health Education
Authority.
Biddle, S.J.H. (1999). The motivation of pupils in physical education. In C. Hardy and
M. Mawer (eds), Learning and teaching in physical education (pp. 105-125), London:
Farmer Press.
Biddle, S.J.H. and Asare, M. (2011). Physical activity and mental health in children and
adolescents: a review of reviews. British Journal of Sports Medicine, 45, 886-895.
Biddle, S.J.H., Whitehead, S.H., O’Donovan, T.M. and Nevill, M.E. (2005). Correlates
of participation in physical activity for adolescent girls: A systematic review of recent
literature. Journal of Physical Activity and Health, 2, 423-434.
Blair, S.N., Clark, D.G., Cureton, K.J. et al. (1989). Exercise and fitness in childhood:
implications for a lifetime of health. In: C.V. Gisolfi, D.R. Lamb. (eds). Perspectives in
exercise science and sports medicine, New York: McGraw-Hill, 314, 605-613.
152
Blanskby, B.A. and Whipp, P. (2004). Healthy mind in a healthy body: Engaging young
people in physical activity through school health and physical education. In R. Galbally
(Ed.) Healthy minds, healthy bodies, healthy nation: Connecting education and health,
34-42, Melbourne, Australian College of Educators.
Brown, H.L., Salmon, J., Pearson, N. and Hume, C. (2013). KAPS: An intervention
targeting the mediators of children’s physical activity. A paper resented at ISBNPA,
may, 2013,p.121.
Bruner, M.W., Chad, K.E., Beattie-Flath, J.A., Humbert, M.L., Verrall, T.C., Vu, L. and
Muhajarine, N. (2009). Examination of physical activity in adolescents over the school
year. Pediatric Exercise Science, 21, 421-435.
Brustad, R.J. (1993). Who will go out and play? Parental and psychological influences
on children’s attraction to PA. Pediatric Exercise Science, 5(3), 210-223.
Brustad, R.J. (1996). Attraction to physical activity in urban schoolchildren: Parental
socialisation and gender influences. Research Quarterly for Exercise and Sport, 67 (3),
316-323.
Cale, L. (2000). Physical activity promotion in secondary schools. European Physical
Education Review, 6 (1), 71-90.
Cale, L. and Harris, J. (2005) Exercise and young people, issues, implications and
initiatives. New York: Palgrave Macmillan.
Calfas, K.J. and Taylor, W.C. (1994). Effects of physical activity on psychological
variables in adolescents. Pediatric Exercise Science, 6: 406-423.
Canadian Fitness and Lifestyle Research Institute (2009). Kids can PLAY! Activity
levels of Canadian children and youth, Ottawa.
153
Capel, S. (1997). Learning to teach physical education in the secondary school.
London: Routledge.
Carson, V. and Spence, J.C. (2010). Seasonal variation in physical activity among
children and adolescents: A Review. Pediatric Exercise Science, 22, 81-92.
Casperson, C.J., Powell, K.E. and Christensen, G.M. (1985). Physical activity, exercise
and physical fitness: Definitions and distinctions for health-related research. Public
Health Reports, 100, 126-131.
Cavill, N., Biddle, S.J.H. and Sallis, J.F. (2001). Health enhancing physical activity for
young people: Statement of the United Kingdom expert consensus conference. Pediatric
Exercise Science, 13, 12-25.
Central Statistics Office (2006). Census of population, 2006, volume 12, travel to work.
School and college. Available at www.cso.ie.
Children and young People - The importance of physical activity. European Heart
Health Initiative, December, 2001.
Cleland, V., Venn, A., Fryer, J., Dwyer, T. and Blizzard, L. (2005). Parental exercise is
associated with children’s extra-curricular sports participation and cardiorespiratory
fitness: A cross-sectional study. International Journal of Behavioural Nutrition and
Physical Activity, 2(3).
Coe, D.P., Pivarnik, M., Womak, C.J., Reeves, M.J. and Malina, R.M. (2006). Effect of
physical education and activity levels on academic achievement in children. Medicine
and Science in Sports and Exercise, 38(8), 1515-1519.
Cohen, L. and Manion, L. (1994). Research methods in Education, 4rth Edition.
London:Routledge.
154
Collins, K., McAlreavy, G. and Adamson, G. (2004). Bullying in schools: A Northern
Ireland study. School of Psychology, University of Ulster.
Cooper, A.R., Page, A.S., Foster, L.J., Qahwaji, D. (2003). Commuting to school: Are
children who walk more physically active? American Journal of Preventative Medicine,
25(4), 273-276.
Corbin, C.B. and Pangrazi, R.P. (2003). Guidelines for appropriate physical activity for
elementary school children. Reston, VA: NASPE.
Cox, R.H (2002) Sport Psychology, concepts and applications, 5th
Edition. New York:
McGraw-Hill.
Craig, C.L., Cameron, C., Griffiths, J.M. and Tudor-Locke, C. (2010). Descriptive
epidemiology of youth pedometer-determined physical activity: CANPLAY. Medicine
and Science in Sports and Exercise, 42, (9), 1639-1643.
Creswell, J. W. and Plano Clark, V. L. (2007). Designing and conducting mixed methods
research. Thousand Oakes, California: Sage.
Crocker, P., Hoar, S., McDonough, M., Kowalski, K. and Niefer, C. (2004). Emotional
experience in youth sport. In M. Weiss (ed), Developmental sport and exercise
psychology: A lifespan perspective (pp. 197-222). Morgantown WV: Fitness Information
Technology.
Crocker, P.R., Eklund, R.C. and Kowalski, K.C. (2000). Children’s physical activity and
physical self-perceptions. Journal of Social Sciences, 18 (6): 383-394.
Crouter, S.E., Schneider, P.L., Karabulut, M. and Bassett, D.R. (2003). Validity of 10
electronic pedometers for measuring steps, distance, and energy cost. Medicine and
Science in Sports and Exercise, 35, 1455-1460.
155
Currie, C. (2012). Social determinants of health and well-being among young people.
Health behaviour in school-aged children (HBSC) study: International report from the
2009/2010 survey. Copenhagen, WHO regional office for Europe.
Curtner-Smith, M., Sofo, S., Chouinard, J. and Wallace, S. (2007) Health-promoting
physical activity and extra-curricular sport. European Physical Education Review,
13(2), 131-144.
De Roiste, A. and Dineen, J. (2005). Young Peoples views about opportunities, barriers
and supports to recreation and leisure: A research report by Cork Institute of Technology
on behalf of the National Children’s Office. Dublin: National Children’s Office.
Department of Education and Skills (2009). Available at www.education.ie.
Department of Health (2004). At least 5 a week: Evidence on the impact of physical
activity and its relationship to health – A report by the Chief Medical Officer, London.
Department of Health and Children (2005). Obesity: The Policy Changes. Report of the
National Taskforce on Obesity, Dublin: The Stationary Office.
Department of Health and Children (2009). Get Ireland active: The national guidelines
on physical activity for Ireland. Dublin, Health Service Executive.
Department of Health and Children (2010) Health in Ireland, Key Trends, Brunswick
Press Ltd.
Department of Health and Children, State of the Nation’s Children, December, 2010,
Government Publications, Dublin.
Department of Health and Science (2003). Junior Cycle Physical Education. Dublin:
The Stationery Office.
156
Department of Transport (2009). Smarter Travel: A Sustainable Transport Future. A
New Transport Policy for Ireland 2009-2020. Dublin, Government Publications Office.
DiLorenzo, T.M., Stucky-Ropp, R.C., Vander Wal, J.S. and Gotham, H.J. (1998).
Determinants of exercise among children. II. A longitudinal analysis. Preventive
Medicine, 27(3), 470-477.
Dollman, J., Olds, T.S., Esterman, A. and Kupke, T. (2010). Pedometer Step Guidelines
in Relation to Weight Status Among 5-16 Year Old Australians, Pediatric Exercise
Science, 22, 288-300.
Eaton, D.K. (2009). Youth risk behaviour surveillance survey. Centres for Disease
Control and Prevention. United States.
European Heart Network (2001). Children and young people – The importance of
physical activity. Brussels, Belgium: published in the context of the European Heart
Health Initiative.
Fahey, T., Delaney, L. and Gannon, B. (2005). School children and sport in Ireland.
Dublin: Economic and Social Research Institute.
Fairclough, S.J. (2003). Physical activity levels during key stage 3 physical education.
British Journal of Teaching Physical Education, 34, 40-45.
Fairclough, S.J. and Stratton, G. (2006). Effects of a physical education intervention to
improve student physical activity levels. Physical Education and Sport Pedagogy, 11(1),
29-44.
Finn, J.D. (1989). Withdrawing from school. Review of Educational Research, 59(2),
117-142.
157
Fisher, A., Grant, S., Kelly, L.A., Montgomery, C., Paton, J.Y., Reilly, J.J. and
Fox, K.R. (1997). The physical self and processes in self-esteem development. The
physical self: From motivation to well-being, Champaign, IL: Human Kinetics.
Fox, K.R. (2000). Self-esteem, self-perceptions and exercise. International Journal of
Sport Psychology, 31, 228-240.
Green, K. and Hardman, K. (2005). Physical Education – Essential Issues, London: Sage
Publications.
Gustafson, S.L. and Rhodes, R.E. (2006). Parental correlates of physical activity in
children and early adolescents. Sports Medicine, 36, 79-97.
Hallal, P.C., Victoria, C.G., Azevedo, M.R. and Wells, J.C.K. (2006). Adolescent
physical activity and health: A systematic review. Sports Medicine, 36(12): 1019-1030.
Hardman, K. (2007). Current situation and prospects for physical education in the
European union. Available at www.europarl.europa.eu.
Harter, S. (1978). Effective Motivation Reconsidered: Toward A Developmental Model.
Human Development, 21, 34-64.
Harter, S. (1981). The development of competence motivation in the mastery of
cognitive and physical skills: Is there still a place for joy? In C.H. Nadeau (ed),
Psychology of motor behaviour and sport (pp. 3-29). Champaign, IL: Human Kinetics.
Harter, S. (1985). Manual for the self-perception profile for children. Denver, CO:
University of Denver.
158
Harter, S. (1990) Self and identity development, in Feldman, S.S. and Elliott, G.R. (eds).
At the threshold: The developing adolescent, 352-387, Cambridge: Harvard University
Press.
Hashim, H., Grove, R. and Whipp, P. (2008). Validating the youth sport enjoyment
construct in high school physical education. Research Quarterly for Exercise and Sport,
79(2), 183-194.
Hendry, L. (1989). The influence of adults and peers on adolescent lifestyles and leisure-
styles, in Hurrelman, K. and Engel, U. (eds), The social world of adolescents, New York:
Walter De Gruyter.
Hendry, L., Shucksmith, J., Love J. and Glendinning, A. (1993). Young Peoples Leisure
and Lifestyles, London: Routledge.
Heyward, V. (2010). Advances in Fitness Assessment and Exercise Prescription, 6th
Edition. USA: Burgess Publishing Company.
Hiland, T.A., Stratton, G., Vinson, D. and Fairclough, S. (2009). The physical education
predisposition scale: Preliminary development and validation. Journal of sports sciences,
27(14), 1555-1563.
Hilland, T.A., Ridgers, N.D., Stratton, G. and Fairclough, S.J. (2011). Associations
between selected demographic, biological, school environmental and physical education
based correlates, and adolescent physical activity. Pediatric Exercise Science, 23, 61-71.
Hopper, B. (2005). Confronting one’s own demons. Exploring the needs of non-
specialist primary initial teacher trainees in PE. The British Journal of Teaching Physical
Education, 36(1), 6-10.
159
Horn, N.J. and Harris, A. (2002). Perceived competence in young athletes: Research
findings and recommendations for coaches and parents. In F.L. Smoll and R.E. Smith
(eds), Children and Youth in Sport: A Biopsychosocial Perspective, 2nd
edition, pp. 435-
464, Dubuque, IW: Kendall-Hunt.
Hughes, A.M., Keane, S., Lyons, D., Quinn, S. and McPhail, A. (2006). Lifelong
Involvement in Sport and Physical Activity: The LISPA Model. The Irish Sports
Council. Available at www.irishsportscouncil.ie.
Inchley, J., Kirby, J. and Currie, C. (2011). Longitudinal changes in physical self-
perceptions and associations with physical activity during adolescence. Pediatric
Exercise Science, 23, 237-249.
Institute of Youth Sport (1999). The Girls in Sport Project, Loughborough, England:
IYS.
Irish Universities Nutrition Alliance (2008). National Teens Food Survey. Available at
www.iuna.net.
Jago, R., Macdonald-Wallis, K., Thompson, J.L., Page, A.S., Brockman, R. and Fox,
K.R. (2011). Better with a buddy: Influence of best friends on children’s physical
activity. Medicine and Science in Sports and Exercise, 43(2), 259-265.
Kimiecik, J.C. and Horn, T.S. (1998). Parental beliefs and children’s moderate to
vigorous physical activity. Research Quarterly for Exercise and Sport, 69(2), 163-175.
Kirk, D. (2005). Physical education, youth sport and lifelong participation: The
importance of early learning experiences. European Physical Education Review, 11(3),
239-255.
160
Kremer, J., Trew, K. and Ogle, S. (2000). Young Peoples Involvement in Sport. London:
Routledge.
Layte, R. and McCrory, C. (2011). The Growing up in Ireland report: A national
longitudinal study of children. Department for Children and Youth Affairs, Dublin:
Government Publications.
Lincoln, Y. S. and Guba, E. G. (1985). Establishing trustworthiness. In Y. S. Lincoln and
E. G. Guba (Eds.), Naturalistic Inquiry (3rd ed., pp. 289-331). Sage Publications.
Lowry, R., Wechsler, H., Kann, L. and Collins, J.L. (2001). Recent trends in
participation in physical education among U.S. high school students. Journal of School
Health, 71(4), p.145-152.
Lubans, D.R., Morgan, P.J., Callister, R. and Collins, C.E. (2009). Effects of integrating
pedometers, parental materials and email support within an extracurricular school sport
intervention. Journal of Adolescent Health, 44, 176-183.
Luikkonen, J., Vanden Auwelle, Y., Vereijken, B., Alfermann, D., Theodorakis, Y.
(2007). Psychology for Physical Educators, 2nd
edition, USA: Human Kinetics.
Lunn, P., Layte, R. and Watson, D. (2007). The Irish Sports Monitor: First Annual
Report. Dublin: Economic and Social Research Institute and The Irish Sports Council.
MacNamara, A., Collins, D., Bailey, R., Toms, M., Ford, P. and Pearce, G. (2011).
Promoting lifelong physical activity and high level performance: realising an achievable
aim for physical education. Physical Education and Sport Pedagogy, 16(3), 265-278.
MacPhail, A. (2011). Youth voices in PE and sport: What are they telling us and what do
they say they need? In K. Armour (ed), Sport Pedagogy: An Introduction for Teaching
and Coaching, pp.105-115, London: Prentice Hall.

161
MacPhail, A. and Halbert, J. (2005). The implementation of a revised physical education
syllabus in Ireland: Circumstances, rewards and costs. European Physical Education
Review, 11(3), 287-308.
MacPhail, A., Gorely, T., Kirk, D. and Kinchin, G. (2008). Children’s experiences of fun
and enjoyment during a season of sport education. Research Quarterly for Exercise and
Sport, 79(3), 344-355.
Marsh, H.W. (1990). Self-Description Questionnaire 1 (SDQ1) Manual. Sydney:
University of Australia.
McAuley, E., Duncan, T.E. and Tammen, V.V. (1989). Psychometric properties of the
intrinsic motivation inventory in a competitive sport setting: A confirmatory factor
analysis. Research Quarterly for Exercise and Sport, 60, 48-58.
McCarthy, P.J. and Jones, M.V. (2007). A qualitative study of sport enjoyment in the
sampling years. The sport psychologist, 21, 400-416.
McCormack, G.R., Rutherford, J., Giles-Corti, B., Tudor-Locke, C. and Bull, F. (2011).
BMI -Referenced cut-points for recommended daily pedometer-determined steps in
Australian children and adolescents. Research Quarterly for Exercise and Sport,
American Alliance for Health, Physical Education, Recreation and Dance, 82(2), 162-
167.
McElroy, M. (2002). Resistance to Exercise: A Social Analysis of Inactivity.
Champaign, IL: Human Kinetics.
McNamara, A., Collins, D., Bailey, R., Toms, M., Ford, P. and Pearce, G. (2011).
Promoting lifelong physical activity and high level performance: realising an achievable
aim for physical education. Physical Education and Sport Pedagogy, 16 (3), 265-278.
162
McNeill, M. and Wang, C.K.J. (2005). Psychological profiles of elite sports players in
Singapore. Psychology of Exercise and Sport, 6, 117-128.
Merriam, S.B. (1998). Qualitative research and case study applications in education, 2nd
edition, San-Francisco: Jossey-Bass.
Moore, J.B., Mitchell, N.G., Bibeau, W.S. and Bartholomew, J.B. ( 2011) Effects of a
12-Week Resistance Exercise Programme on Physical-Perceptions in College Students.
Research Quarterly for Exercise and Sport, American Alliance for Health, Physical
Education, Recreation and Dance, vol.82, No.2., pp.291-301.
Moore, J.B., Mitchell, N.G., Bibeau, W.S. and Bartholomew, J.B. (2011). Effects of a 12
week resistance program on physical self-perceptions in college students. Research
Quarterly for Exercise and Sport, 82(2), 291-301.
Morgan, C.F., Graser, S.V. and Pangrazi, R.P. (2008). A prospective study of
pedometer-determined physical activity and physical self-perceptions in children.
Research Quarterly for Exercise and Sport, 79(2), 133-140.
Motl, R.W., Birnbaum, A.S., Kubik, M.Y. and Dishman, R.K. (2004). Naturally
occurring changes in physical activity are inversely related to depressive symptoms
during early adolescence. Psychosomatic Medicine, 66 (3): 336-352.
Motl, R.W., Dishman, R.K., Saunders, R., Dowda, M., Felton, G. and Russell, R.P.
(2001). Measuring enjoyment of physical activity in adolescent girls. American Journal
of Preventative Medicine, 21(2), 110-116.
Mulvihill, C., Rivers, K. and Aggleton, P. (2000). Physical activity ‘at our time’.
London, Health Education Authority.
163
Murtagh, E.M. and Murphy, M.H. (2011). Active travel to school and physical activity
levels of Irish primary schoolchildren. Pediatric Exercise Science, 23, 230-236.
Mutrie, N. and Parfitt, G. (1998). Physical activity and its link with mental, social and
moral health in young people. In: S. Biddle, J. Sallis and N. Cavill (eds). Young and
active? Young people and health-enhancing physical activity: evidence and implications,
London: Health Education Authority, 49-68.
National Health Service (2008). Statistics on obesity, physical activity and diet: England.
The Information Centre, Lifestyles Statistics. Available at www.aso.org.uk.
National Heart Alliance (2006). Building young hearts: Physical activity, young people
and the physical environment. Dublin: Irish Heart Foundation.
National Heart Alliance (2010). Building young hearts: Physical activity, young people
and the physical environment. Dublin: Irish Heart Foundation.
Nic Gabhainn, S., Gavin, A., Kelly, C. and Molcho, M. (2012). The Irish Health
Behaviour in school-aged children (HBSC) study 2010. Dublin: Department of Health.
Nic Gabhainn, S., Kelly, C. and Molcho, M. (2007). HSBC Ireland 2006: National
Report of the 2006 Health Behaviour in School-aged Children in Ireland 2006. Dublin,
Department of Health and Children.
Nic Gabhainn, S., Kelly, C. and Molcho, M. (2009). Health Behaviour in School-aged
Children (HBSC) Ireland 2006, Middle childhood study: Socio-demographic patterns in
the health behaviours, health outcomes and social contexts of young people’s health.
Dublin: Department of Health.
164
O’Dea, J.A. (2003). Why do kids eat healthful food? Perceived benefits of and barriers
to healthful eating and physical activity among children and adolescents. Journal of Diet
Association, 103, 497-504.
O’Sullivan -Ryan, M. (2008). Children, young people and physical activity - An
overview, national council for exercise and fitness, national fitness news, 10(6), 11-13.
Ogden, C. and Carroll, M. (2010). Prevalence of obesity among children and
adolescents; US Trends 1963-1965 Through 2007-2008, CDC.
OECD (2012). Equity and Quality in Education: Supporting disadvantaged students and
schools. Spotlight report: Ireland, available at www.oecd.org/edu/equity.
Ormston, R. (2010). Physical activity, in: The Scottish Health Survey, 2009, vol 1,
chapter 6, C. Bromley, L. Given and R. Ormston (eds). Edingburgh: Main Report. The
Scottish Government, 2010.
Panter, J., Jones, A., Van Sluijs, E. and Griffin, S. (2011). The Influence of distance to
school on the associations between active commuting and physical activity. Pediatric
Exercise Science, 23, 72-86.
Pate, R.R., Davis, M.G., Robinson, T.N., Stone, E.J., McKenzie, T.L., Young, J.C. et al.
(2006). Promoting physical activity in children and youth, Circulation, 114, 1214-1224.
Paxton, R.J., Nigg, C., Motl, R.W., Yamashita, M., Chung, R., Battista, J. and Chang, J.
(2008). Physical activity enjoyment scale short form - Does it fit for children? Research
Quarterly for Exercise and Sport, 79(3), 423-427.
Penney, D. and Harris, J. (1997). Extra-curricular physical education: More of the same
for the more able. Sport, Education and Society, 2 (1), 41-54.
165
Pieron, M., Cloes, M., Delfosse, C. and Ledent, M. (1996). An investigation of the
effects of daily physical education in kindergarden and elementary schools. European
Physical Education Review, 2, 116-132.
Pieron, M., Delfosse, C., Ledent, M. And Cloes, M. (2001). Motivation of
schoolchildren for physical education, comparison of high and low achievers. University
of Liege: AIESEP.
Pratt, M., Macera, C.A. and Blanton, C. (1999). Levels of physical activity and inactivity
in children and adults in the United States: Current evidence and research issues.
Medicine and Science in Sports and Exercise, 31, 526-533.
Prochaska, J., Sallis, J., Slyman, D. and McKenzie, T. (2003). A longitudinal study of
children’s enjoyment of physical education. Pediatric Exercise Science, 15, 170-178.
Prochaska, J.J., Sallis, J.F. and Long, B. (2001). A physical activity screening measure
for use with adolescents in primary care. Archives of Pediatric and Adolescent
Medicine, 155, 554-559.
Riddoch, C. (1998). Relationship between physical activity and health in young people,
in S. Biddle, J. Sallis and N. Cavill (eds) Young and active? Young People and Health
Enhancing Physical Activity: Evidence and Implications, 17-48, London: Health
Education Authority.
Riddoch, C.J., Anderson, L.B., Wedderkopp, N., Harrow, M., Klasson-Heggeboe, L.,
Sardinah, L.B., Cooper, A.R. and Ekelund, U. (2004). Physical activity levels and
patterns of 9 and 15 year old European children. Medicine and Science in Sports and
Exercise, 36, 86-92.
166
Rittenhouse, M., Salvey, S.J. and Barkley, J.E. (2011). The Effect of Peer Influence on
the Amount of Physical Activity Performed in 8-12 Year Old Boys. Pediatric Exercise
Science, 23, 49-60.
Rowe, D.A., Raedeke, T.D., Wiersma, L.D. and Mahar, M.D. (2007). Investigating the
youth physical activity promotion model: Internal structure and external validity evidence
for a potential measurement model. Pediatric Exercise Science, 19, 420-435.
Sabiston, C.M. and Crocker, P.R.E. (2008). Exploring self-perceptions and social
influences as correlates of adolescent leisure-time physical activity. Journal of Sport and
Exercise Psychology, 30, 3-22.
Sacheck, J.M., Nelson, T., Ficker, L., Kafka, T., Kuder, J. and Economos, C.D. (2011).
Physical activity during soccer and its contribution to physical activity recommendations
in normal weight and overweight children. Pediatric Exercise Science, 23, 281-292.
Sallis, J., Prochaska, J.J., Taylor, W., Hill, J. and Geraci, J. (1999). Correlates of physical
activity in a national sample of girls and boys in grades four through twelve. Health
Psychology, 410-415.
Sallis, J.F. 1991. Self-Report measures of children’s physical activity. Journal of School
Health, 61, 215-219.
Sallis, J.F. and McKenzie, T.L. (1991). Physical education’s role in public health.
Research Quarterly for Exercise and Sport, 62, 124-137.
Sallis, J.F., Condon, S.A., Goggin, K.J., Roby, J.J., Kolody, B. and Alcaraz, J.E. (1993).
The development of self-administered physical activity surveys for 4th
grade students.
Research Quarterly for Exercise and Sport, 64, 25-31.
167
Sallis, J.F., Prochaska, J.J. and Taylor, W.C. (2000). A review of correlates of physical
activity of children and adolescents, Medicine and Science in Sports and Exercise, 32(5),
963-975.
Scanlon, T.K. and Lewthwaite, R. (1986). Social psychology aspects of competition for
male youth sports participants: IV. Predictors of enjoyment. Journal of Sport
psychology, 8, 25-35.
Scanlon, T.K., Carpenter, P.J., Lobel, M. and Simons J.P. (1993). Sources of enjoyment
for youth sport athletes. Pediatric Exercise Science, 5, 275-292.
Schmalz, D.L., Deane, G.D., Birch, L.L. And Davison, K.K. (2007). A longitudinal
assessment of the links between physical activity and self-esteem in early adolescent non-
Hispanic females. Journal of Adolescent Health, 41, 559-565.
Schneider, P.L., Crouter, S.E., Lukajic, O. and Bassett, D.R. (2003). Digital pedometers:
Checking calibration prior to use in research. Medicine and Science in Sports and
Exercise, 35 (Suppl.1), S299.
Scottish Executive (2003). Let’s make Scotland more active – A strategy for physical
activity. Edinburgh: The Stationary Office.
Shephard, R.J. (1996). Habitual physical activity and academic performance. Nutrition
Review, 54, 32-36.
Shephard, R.J. and Trudeau, F. (2000). The legacy of physical education: Influences on
adult lifestyle. Pediatric Exercise Science, 12, 34-50.
Siedentop, D. (1998). What is sport education and how does it work? Journal of
physical education, recreation and dance, 69(4), 18-20.
168
Silva, P., Sousa, M., Aires, L., Seabra, A., Ribeiro, J., Welk, G. and Mota, J. (2010).
Physical activity patterns in Portuguese adolescents: The contribution of extra-curricular
sports. European Physical Education Review, 16, 171.
Sirad, J.R, and Pate, R.R. (2001). Physical activity assessment in children and
adolescents, review article, Sports Medicine (Auckland), 31(6), p.439-454.
Smith, A. and Biddle, S. (2008). Youth physical activity and sedentary behaviour,
challenges and solutions. Human Kinetics: USA.
Smith, A., Thurston, M., Lamb, K. and Green, K. (2007) Young peoples participation in
national curriculum physical education: A study of 15-16 yr olds in North-West England
and North-East Wales. European Physical Education Review, 13(2), 165-194.
Smith, A., Thurston, M., Lamb, K. and Green, K. (2007) Young peoples participation in
extra-curricular physical education: A study of 15-16 yr olds in Northwest England and
North-East Wales. European Physical Education Review, 13(3), 339-368.
Smith, A.L. (1999). Perceptions of peer relationships and physical activity participation
in early adolescence. Journal of Sport and Exercise Psychology, 21(4), 329-350.
Sonstroem, R.J. (1997). The physical self-system: A mediator of exercise and self-
esteem. In K.R. Fox (ed), The physical self: From motivation to well-being (pp3-26).
Champaign, IL: Human Kinetics.
Sport England (2003b). Young People and Sport in England, 2002. London: Sport
England.
Sports Council for Wales (2006). Active Young People: Sports Update No. 58. Cardiff:
Sports Council for Wales.
169
State of the Nation’s Children, Department of Health and Children, December 2010.
Dublin: Government Publications.
Strong, W.B., Malina, R.M., Blimkie, C.J.R., Daniels, C.J.R., Dishman, R.K., Gutin, B.
et al. (2005). Evidence based physical activity for school-age youth. The Journal of
Pediatrics, 146 (6), 732-737.
Tannehill, D., McPhaill, A., Walsh, J. and Woods, C. (2011). What young people say
about physical activity: The children’s sport participation and physical activity study
(CSPPA). University of Limerick.
Tashakkori, A. and Teddlie, C. (2003). Handbook of mixed methods in social and
behavioural research. Thousand Oaks, California: Sage.
Taylor, W.C., Blair, S.N., Cummings, S.S., Wun, C.C. and Malina, R.M. (1999).
Childhood and adolescent physical activity patterns and adult physical activity. Medical
Science and Sports Exercise, 31, 118-123.
Telamo, R., Nupponen, H. and Pieron, M. (2005). Physical activity among young people
in the context of lifestyle. European Physical Education Review, 11(2), 115-135.
Tortolero, S.R., Taylor, W.C. and Murray, N.G. (2000). Physical activity, physical
fitness and social, psychological and emotional health, in N.Armstrong and W. Van
Machelen (eds) Pediatric Exercise and Medicicne, Oxford: Oxford University Press.
Trost, S., Pate, R., Saunders, D., Ward, M., Dowda, W. and Felton, G. (1997). A
prospective study of the determinants of physical activity in rural fifth grade children.
Preventative Medicine, 26, 257-263.
170
Trost, S.C., Pate, R.R. and Sallis, J.F. (2002). Age and gender differences in objectivity
measured physical activity in youth. Medicine and Science in Sports and Exercise, 34,
350-355.
Trost, S.G., Pate, R.R., Ward, D.S., Saunders, R. and Riner, W. (1999). Correlates of
objectively measured physical activity in preadolescent youth. American Journal of
Preventive Medicine, 17(2), 120-126.
Trost, S.G. (2007). State of the art reviews: Measurement of physical activity in children
and adolescents. American Journal of Lifestyle Medicine, 1, 299.
Trudeau, F. and Shephard, R.J. (2005). Contribution of school programmes to physical
activity levels and attitudes in children and adults. Sports Medicine, 35(2), 89-105.
Tudor-Locke, C., Hatano, Y., Pangrazi, R. and Kang, M. (2008). Revisiting – How many
steps are enough. Medical Science and Sports Exercise, 40, 537-543.
Tudor-Locke, C., Pangrazi, R., Corbin, C.B., Rutherford, W.J., Vincent, S.D., Raustorp,
A., Tomson, L. and Cuddihy, T. (2004). BMI referenced standards for recommended
pedometer-determined steps/day in children. Preventive Medicine, 38, 857-864.
Twisk, J.W.R. (2001). Physical activity guidelines for children and adolescents: A
critical review. Sports Medicine, 31 (8), 617.
US Department of Health and Human Services (1996). Physical activity and health: a
report from the Surgeon General, Atlanta, Georgia: National Centre for Chronic Disease
Prevention and Health Promotion.
US Department of Health and Human Services (2008). Physical Activity Guidelines for
Americans. Washington DC: US Department of Health and Human Services.
171
Usher, R. (1996). A critique of the neglected epistemological assumptions of educational
research, in Scott, D. And Usher, R. (eds), Understanding educational research, London:
Routledge.
Van Der Horst, K., Chin A. Paw, M.J., Twisk, J.W.R. And Van Mechelen, W. (2007). A
brief review on correlates of physical activity and sedentariness in youth. Medicine and
Science in Sports and Exercise, 39(8), 1241-1250.
Vanden Auwelle, Y., Bakker, F., Biddle, S., Durand, M., Seiler, R. (1999) Psychology for
Physical Educators, Human Kinetics: USA.
Wallhead, T.L., Hagger, M. and Smith, D.T. (2010) Sport education and extracurricular
sport participation: An examination using the trans-contextual model of motivation.
Research Quarterly for Exercise and Sport, 18(4), 442-455.
Wang, C.K., Lim, B.S.C., Alpin, N.G., Chia, Y.M.H., McNeil, M. And Tan, W.K.C.
(2008) Students’ attitudes and perceived purposes of physical education in Singapore:
Perspectives from a 2x2 achievement goal framework. European Physical Education
Review, 14(1), 51-70.
Wang, C.K.J. and Biddle, S.J.H. (2001). Young peoples motivational profiles in physical
activity: A cluster analysis. Journal of Sport and Exercise Psychology, 23, 1-22.
Wang, C.K.J. and Koh, T.H.M. (2006). Sport ability beliefs, self-determination and
beliefs about the purposes of physical education among Singaporean potential preservice
teachers. Asian Journal of Exercise and Sports Science, 3, 25-34.
Wankel, L. and Sefton, J. (1989). A season-long investigation of fun in youth sports.
Journal of sport and exercise psychology, 11, 355-366.
172
Wankel, L.M. (1993). The importance of enjoyment to adherence and psychological
benefits from physical activity. International Journal of Sport Psychology, 24, 151-169.
Warburton, V. and Spray, C. (2008) Motivation in physical education across the primary-
secondary school transition. European Physical Education Review, 14(2), 157-178.
Ward, D.S., Saunders, R.P. and Pate, R.R. (2007). Physical Activity Interventions in
Children and Adolescents, Human Kinetics: USA.
Weiss, M. (1996). Motivating kids in physical activity. President’s Council on Physical
Fitness and Sports Research Digest, 3(11), 1-7.
Weiss, M., Kimmel, L. and Smith, A. (2001). Determinants of sport commitment among
junior tennis players: Enjoyment as a mediating variable. Pediatric Exercise Science,
13, 131-144.
Welk, G.J. (1999) The Youth Physical Activity Promotion Model: A conceptual bridge
between theory and practice, Quest, 51 (1), 5-23.
Welk, G.J. (2002) Physical Activity Assessments for Health Related Research, Human
Kinetics: USA.
Welk, G.J., Corbin, C.B. and Dale, D. (2000) Measurement issues for the assessment of
physical activity in children. Research Quarterly for Exercise and Sport, 71, 59-73.
Welk, G.J., Differding, J.A., Thompson, R.W., Blair, S.N., Dziura, J. and Hart, P. (2000).
The utility of the digi-walker step counter to assess daily physical activity patterns.
Medicine and Science in Sports and Exercise, 32, S481-S488.
173
Wenthe, P.J., Janz, K.F. and Levy, S.M. (2009). Gender similarities and differences in
factors associated with adolescent moderate-vigorous physical activity. Pediatric
Exercise Science, 21, 291-304.
Welk, G.J. and Wood, K. (2000). Physical activity assessments in physical education: A
practical review of instruments and their use in the curriculum. Journal of Physical
Education, Recreation and Dance, 71(1), 30-40.
West, P. and Sweeting, H. (1997). Lost souls and rebels: a challenge to the assumption
that low self-esteem and unhealthy lifestyles are related. Health Education, 5, 161-167.
West, P., Sweeting, H. and Leyland, A. (2004). School effects on pupils’ health
behaviours: evidence in support of the health promoting school. Health Education,
19(3), 261-291.
Whitehead, J.R. (1995). A study of children’s physical self-perceptions using an adapted
physical self-perception profile questionnaire. Pediatric Exercise Science, 7 (2): 132-
151.
Whitehead, S. And Biddle, S. (2008). Adolescent girls’ perceptions of physical activity -
A focus group study. European Physical Education Review, 14(2), 243 - 262.
Williamson, A. (2005). Fundamental movement skills and habitual physical activity in
young children. Medicine and Science in sports and exercise, 37, 4, 684-688.
Women’s Sport and Fitness Foundation (2011). Changing the game for girl’s survey.
Institute of youth sport, Loughborough University, Institute of Youth Sport.
Woods, C., Meegan, S., Brady, P. and Belton, S. (2008). Evaluation of the ‘Be active,
learn and have fun’- A report prepared, School of Health and Human Performance,
Dublin City University.
174
Woods, C., Nelson, N., O’Gorman, D. and Moyna, N. (2007). The Take Part Study,
Physical Activity for Teenagers, A Report for the Midlands Area, School of Human
Health and Performance, Dublin City University.
Woods, C.B., Nelson, N.M., O’Gorman, D.J., Foley, E. and Moyna, N.M. (2004). The
take part study (Physical activity research for teenagers). A report for the East Coast
Area Health Board, Centre for Sport Science and Health, Dublin City University.
Woods, C.B., Nelson, N.M., O’Gorman, D.J., Foley, E. and Moyna, N.M. (2009). The
take part study (Physical activity research for teenagers): Rationale and methods.
Journal of Physical Activity and Health, 6, 170-177.
Woods, C.B., Tannehill, D., Quinlan, A., Moyna, N. and Walsh, J. (2010). The
Children’s Sport Participation and Physical Activity Study (CSPPA) Research Report
No.1. School of Health and Human Performance, Dublin City University and The Irish
Sports Council, Dublin, Ireland.
World Health Organisation (2003). Health and development through physical activity
and sport. Geneva, Switzerland: WHO Document Production Services.
World Health Organisation (2006). Physical activity and health in Europe: Evidence for
action. Denmark, Regional offices for Europe, WHO Document Production Services.
World Health Organisation (2010). Global recommendations on physical activity for
health. Geneva, Switzerland:WHO Document Production Services.

175
Appendices
176
Appendix A:
Oral Presentation
177
Belton, S.J.; Prior, P. (2010). Do we need extra-curricular physical activities in
schools?
The research explores the impact of extra-curricular physical activity participation on
self-esteem and physical activity enjoyment in Junior Cycle boys. The study also
examines the reasons why students do or do not get involved in extra-curricular physical
activity. In total, 174 Junior Cycle students (12-15yr old boys) from four City of Dublin
Vocational Education Committee (CDVEC) schools took part in this research. The
longitudinal study was carried out over the course of one school year and the data was
collected at three separate time intervals. The students completed a questionnaire based
around the ‘Youth Physical Activity Promotion’ model (Welk, 1999) and wore a
pedometer for seven consecutive days. A sub-sample of students from each school also
took part in focus group interviews at three separate time intervals throughout the same
school year. Preliminary results show that students who regularly participate in extra-
curricular physical activities have higher step count, higher levels of self-esteem and have
a greater enjoyment of physical activity. Students who are not regularly participating in
extra-curricular physical activities have lower step counts and lower levels of self-esteem.
Interview data shows that those who regularly participate in extra-curricular physical
activity highlighted enjoyment as their key motivator. Those who did not regularly
participate indicated a variety of different reasons for their non-regular participation. The
study highlights the value of participation in extra-curricular activities in Junior Cycle
boys. The results are showing the positive impact on students that regularly participate in
terms of raising their self-esteem and their enjoyment of physical activity. The analysis
of results is still ongoing, but the researcher would like to share the current findings at
this point with other PE teachers to highlight the positive impact that extra-curricular
physical activity can have on our students.
178
Appendix B:
Poster Presentation
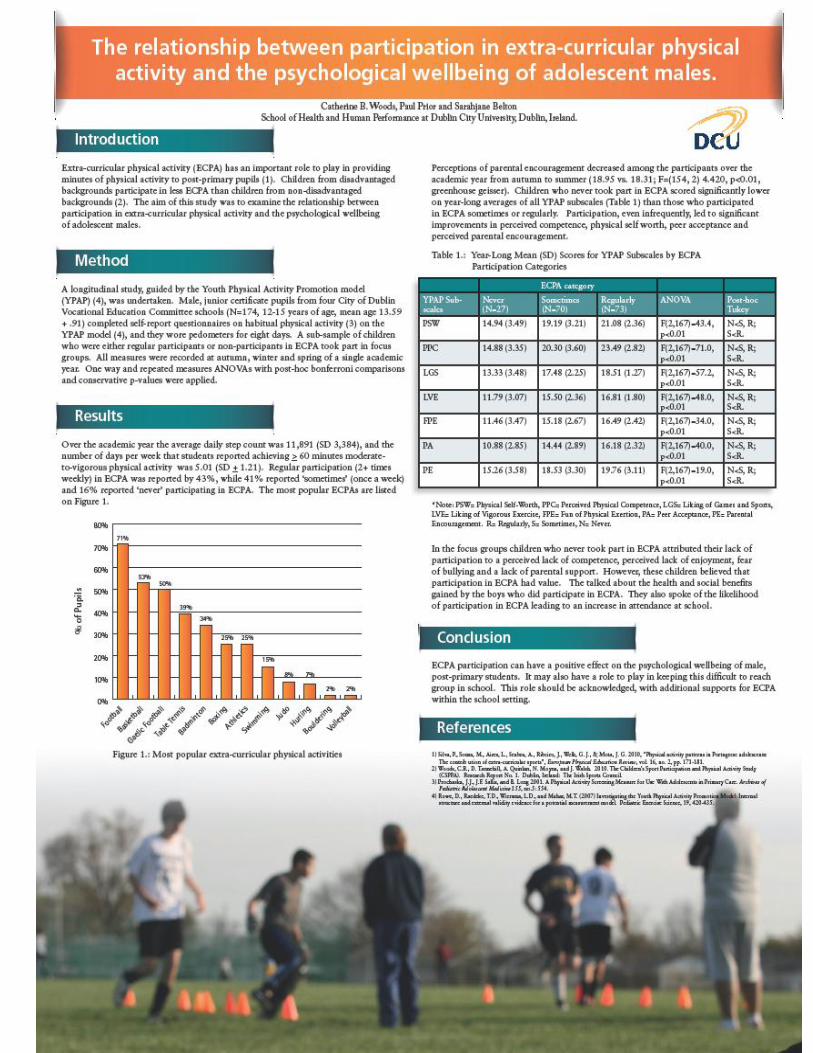
179
180
Appendix C:
School Recruitment Letter
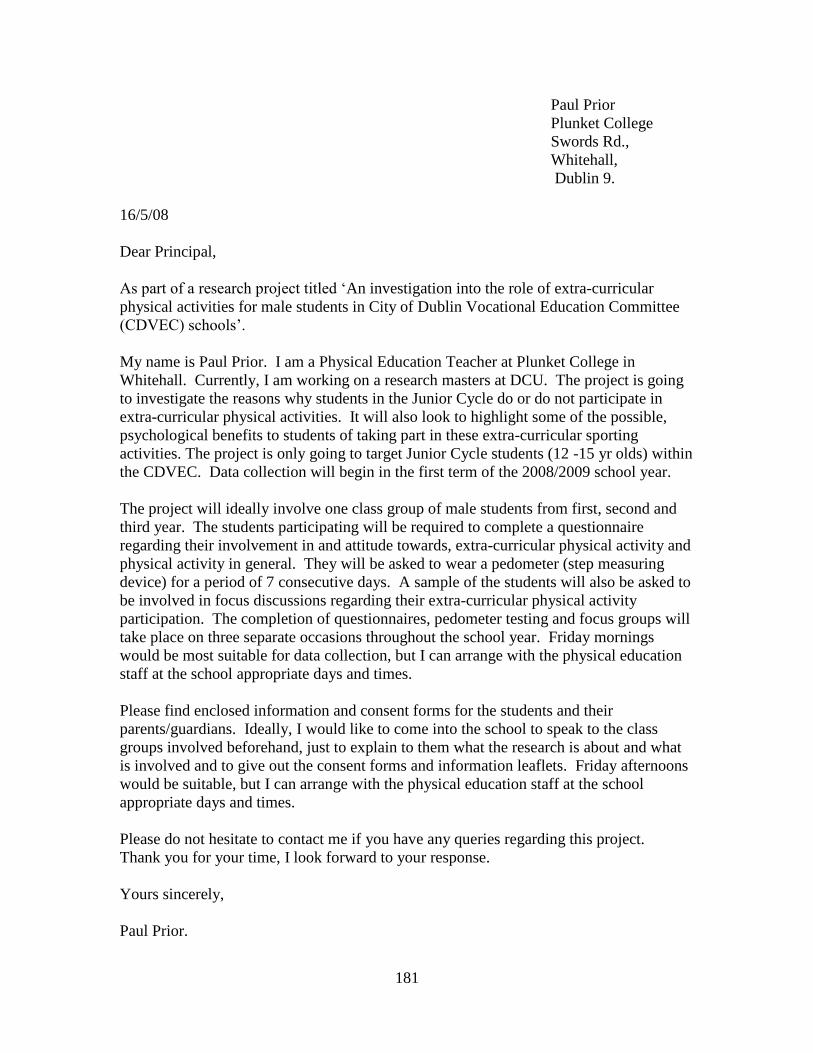
181
Paul Prior
Plunket College
Swords Rd.,
Whitehall,
Dublin 9.
16/5/08
Dear Principal,
As part of a research project titled ‘An investigation into the role of extra-curricular
physical activities for male students in City of Dublin Vocational Education Committee
(CDVEC) schools’.
My name is Paul Prior. I am a Physical Education Teacher at Plunket College in
Whitehall. Currently, I am working on a research masters at DCU. The project is going
to investigate the reasons why students in the Junior Cycle do or do not participate in
extra-curricular physical activities. It will also look to highlight some of the possible,
psychological benefits to students of taking part in these extra-curricular sporting
activities. The project is only going to target Junior Cycle students (12 -15 yr olds) within
the CDVEC. Data collection will begin in the first term of the 2008/2009 school year.
The project will ideally involve one class group of male students from first, second and
third year. The students participating will be required to complete a questionnaire
regarding their involvement in and attitude towards, extra-curricular physical activity and
physical activity in general. They will be asked to wear a pedometer (step measuring
device) for a period of 7 consecutive days. A sample of the students will also be asked to
be involved in focus discussions regarding their extra-curricular physical activity
participation. The completion of questionnaires, pedometer testing and focus groups will
take place on three separate occasions throughout the school year. Friday mornings
would be most suitable for data collection, but I can arrange with the physical education
staff at the school appropriate days and times.
Please find enclosed information and consent forms for the students and their
parents/guardians. Ideally, I would like to come into the school to speak to the class
groups involved beforehand, just to explain to them what the research is about and what
is involved and to give out the consent forms and information leaflets. Friday afternoons
would be suitable, but I can arrange with the physical education staff at the school
appropriate days and times.
Please do not hesitate to contact me if you have any queries regarding this project.
Thank you for your time, I look forward to your response.
Yours sincerely,
Paul Prior.
182
Appendix D:
Plain Language Statement
Parent Consent Form
Child Consent Form

183
DUBLIN CITY UNIVERSITY
Plain Language Statement Title: An investigation into the role of extra-curricular physical activities for male students in City of Dublin Vocational Education Committee schools (CDVEC)
Principal Investigator: Dr. Sarahjane Belton. Contact: 01 7007393 or [email protected] University Department: School of Health and Human Performance
Involvement in the Research Study
The information gathered in this study will have an important role to play in helping us to understand why Junior Cycle boys do and do not participate in extra curricular physical activity.
Participants will be required to complete a questionnaire regarding their involvement in, and attitude towards, extra-curricular physical activity and physical activity generally. They may be involved in focus group interviews regarding their extra-curricular physical activity. They will also be asked to wear a pedometer for a period of 7 consecutive days. A pedometer is a device, which measures the amount of steps taken over a period of time. The pedometers will be supplied by the research team. The completion of questionnaires and the pedometer testing will take place on three separate occasions throughout the school year.
No one has to take part if they do not want to; participation is voluntary. You or your child may withdraw from the Research Study at any point. There will be no penalty for withdrawing before all stages of the Research Study have been completed. There will be no risk to participants from involvement in this study.
Confidentiality is very important; participants’ identity, or other personal information, will not be revealed or published. You will be given an ID number under which all personal information will be stored in a secure file at DCU. Only the researchers will have access to the information.
If you have concerns about this study and wish to contact an independent person,
Please contact:
The Secretary, Dublin City University, Research Ethics Committee,
c/o Office of the Vice-President for Research, Dublin City University, Dublin 9. Tel
01-7008000
184
Dublin City University
Parent Consent Form
Title: An investigation into the role of extra-curricular physical activities for male
students in City of Dublin Vocational Education Committee schools (CDVEC)
School: School of Health and Human Performance
Principal Investigator: Dr. Sarahjane Belton contact email: [email protected]
This study aims to identify reasons why male Junior Cycle students do or do not
take part in extra-curricular physical activities and to highlight the psychological
benefits to those who do
This study also aims to identify the activity levels of these students and to identify
inactivity and the reasons for it
Please complete the following (Circle Yes or No for each question)
Have you read or had read to you the Plain Language Statement? Yes/No
Do you understand the information provided? Yes/No
Do you understand what is required of your child as a participant? Yes/No
Have you had an opportunity to ask questions and discuss this study? Yes/No
Have you received satisfactory answers to all your questions? Yes/No
I understand that if I allow my child to take part in this study:
He will be completing questionnaires relating to his involvement in extra-
curricular physical activity and physical activity outside of school. He will also
need to wear a pedometer device for 7 consecutive days that will measure his
levels of physical activity and may be involved in focus group interviews
regarding extra-curricular participation. This will be done three times in this
school year.
He may withdraw from the Research Study at any point and there will be no
penalty for withdrawing before all stages of the Research Study have been
completed.
Confidentiality is an important issue in this project. Participant’s identity, or
other personal information, will not be revealed or published. Subjects will be
given an ID number under which all personal information will be stored in a
secure file and saved in password protected file in a computer at DCU. Only the
researchers will have access to the data.
185
I have read and understood the information in this form. My questions and concerns have
been answered by the researchers, and I have a copy of this consent form. Therefore, I
consent to allow my child to take part in this research project.
Parents Signature: ……………………………………………..
Name in Block Capitals: ……………………………………………..
Child’s Name in Block Capitals: ……………………………………………..
Witness: ……………………………………………..
Date: ……………………………………………..
186
DUBLIN CITY UNIVERSITY
Child Consent Form Title: An investigation into the role of extra-curricular physical activities for male
students in City of Dublin Vocational Education Committee schools (CDVEC)
Department: School of Health and Human Performance
Principal Researcher: Dr. Sarahjane Belton contact email: [email protected]
If I decide to take part in this research study I understand that:
I will be completing questionnaires and taking part in interviews where I will answer questions about taking part in extra-curricular physical activity and physical activity outside of school. I will also need to wear a pedometer device for 7 consecutive days that will measure my levels of physical activity. This will be done three times during this school year.
I know that I can stop taking part in the Research Study at any point and
that there will be no consequence for stopping before all stages of the Research Study have been finished.
I know that confidentiality is very important in this project. My identity, or
other personal information, will not be given to anyone. I will be given an ID number and all my personal information will be stored in a secure password protected file in a computer at DCU. Only the researchers will be able to get this data.
I have read and understood the information in this form. My questions have been answered by the researchers, and I have a copy of this consent form. Therefore, I consent to take part in this research project
Signature: _________________________________________
Witness: _________________________________________
Date: _________________________________________
187
Appendix E:
Physical Activity Questionnaire

188
Physical
Activity
Questionnaire
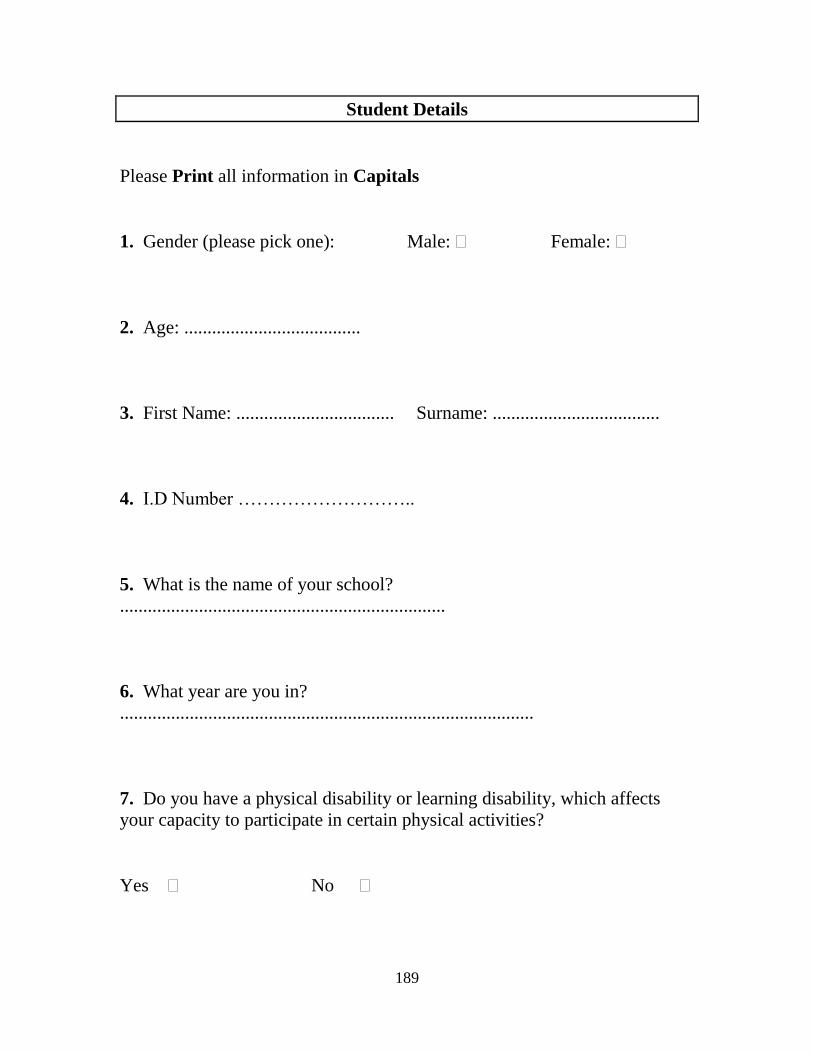
189
Student Details
Please Print all information in Capitals
1. Gender (please pick one): Male: Female:
2. Age: ......................................
3. First Name: .................................. Surname: ....................................
4. I.D Number ………………………..
5. What is the name of your school?
......................................................................
6. What year are you in?
.........................................................................................
7. Do you have a physical disability or learning disability, which affects
your capacity to participate in certain physical activities?
Yes No

190
Section 1: Physical Activity
Physical Activity is any body movement.
It can be done at different levels of effort:
Moderate Effort makes your heart rate and breathing rate faster than normal. You
may also sweat a little. Brisk walking and jogging are good examples.
Vigorous Effort makes your heart rate much faster and you have to breathe deeper
and faster than normal. You will probably sweat. Playing football or squash are
good examples.
Physical activity includes:
Exercise Weight training, aerobics, jogging, dancing, etc.
Sports Hurling, Football, Athletics, Swimming, etc.
General Brisk walking e.g. to school, mowing the lawn, cycling to school, etc.
Please try to think carefully and be as accurate as possible with your answers. For these
two next questions, add up all the time you spend in physical activity each day.
Remember: only include activities of either moderate or vigorous effort.
Q.1. Over the past 7 days, on how many days were you physically active for a total
of at least 60 minutes per day? Please circle one number.
0 days 1 2 3 4 5 6 7 days
Q.2. Over a typical or usual week, on how many days are you physically active for
a total of at least 60 minutes per day? Please circle one number.
0 days 1 2 3 4 5 6 7 days
Q.3. During the last 12 months, how many team or individual sports or activities
did you participate in on a competitive level?
None
1 activity
2 activities
3 activities
4 or more activities
What activities did you compete in?
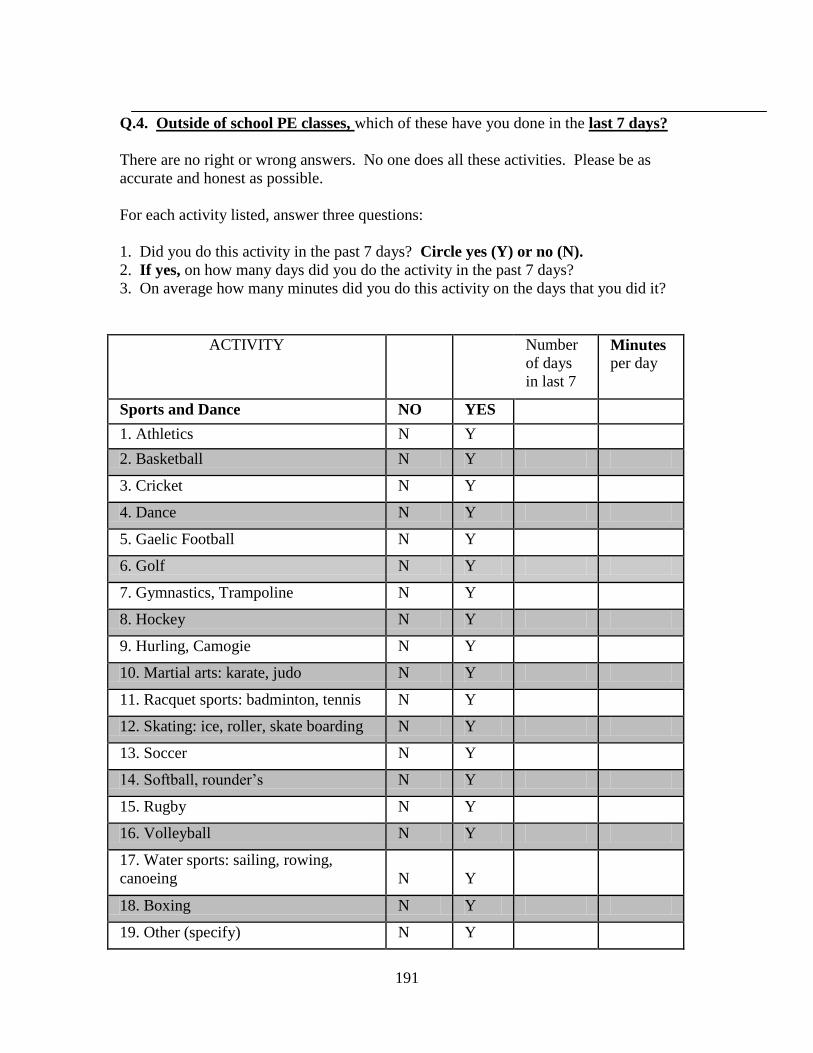
191
Q.4. Outside of school PE classes, which of these have you done in the last 7 days?
There are no right or wrong answers. No one does all these activities. Please be as
accurate and honest as possible.
For each activity listed, answer three questions:
1. Did you do this activity in the past 7 days? Circle yes (Y) or no (N).
2. If yes, on how many days did you do the activity in the past 7 days?
3. On average how many minutes did you do this activity on the days that you did it?
ACTIVITY
Number
of days
in last 7
Minutes
per day
Sports and Dance NO YES
1. Athletics N Y
2. Basketball N Y
3. Cricket N Y
4. Dance N Y
5. Gaelic Football N Y
6. Golf N Y
7. Gymnastics, Trampoline N Y
8. Hockey N Y
9. Hurling, Camogie N Y
10. Martial arts: karate, judo N Y
11. Racquet sports: badminton, tennis N Y
12. Skating: ice, roller, skate boarding N Y
13. Soccer N Y
14. Softball, rounder’s N Y
15. Rugby N Y
16. Volleyball N Y
17. Water sports: sailing, rowing,
canoeing
N
Y
18. Boxing N Y
19. Other (specify) N Y

192
Exercise
NO YES Number
of days
in last 7
Minutes
per day
20. Push-ups, sit-ups, jumping jacks N Y
21. Jogging N Y
22. Skipping N Y
23. Swimming Laps N Y
24. Walking for exercise N Y
25. Other (specify) N Y
General Physical Activities
NO YES Number
of days
in last 7
Minutes per day
26. Bicycling N Y
27. Hiking N Y
28. Walking to get places N Y
29. Water play: in pool, lake, or ocean N Y
30. Outdoor chores: mowing, raking,
gardening
N
Y
31. Indoor chores: mopping,
vacuuming, sweeping
N
Y
32. Other N Y
Q.5. Looking back on all your answers, was the amount of physical activity you did in
the last 7 days typical of the amount that you would normally do?
Please tick one box
Yes No, I usually do more No, I usually do less
If no, why was this week unusual?
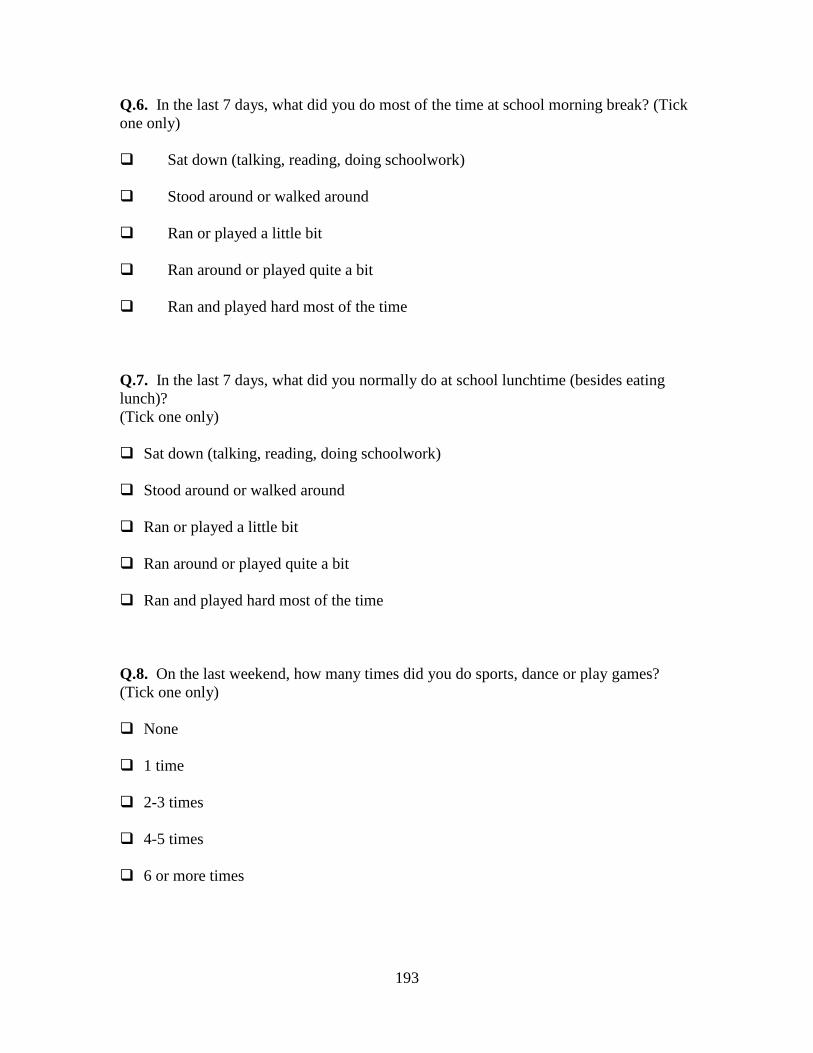
193
Q.6. In the last 7 days, what did you do most of the time at school morning break? (Tick
one only)
Sat down (talking, reading, doing schoolwork)
Stood around or walked around
Ran or played a little bit
Ran around or played quite a bit
Ran and played hard most of the time
Q.7. In the last 7 days, what did you normally do at school lunchtime (besides eating
lunch)?
(Tick one only)
Sat down (talking, reading, doing schoolwork)
Stood around or walked around
Ran or played a little bit
Ran around or played quite a bit
Ran and played hard most of the time
Q.8. On the last weekend, how many times did you do sports, dance or play games?
(Tick one only)
None
1 time
2-3 times
4-5 times
6 or more times
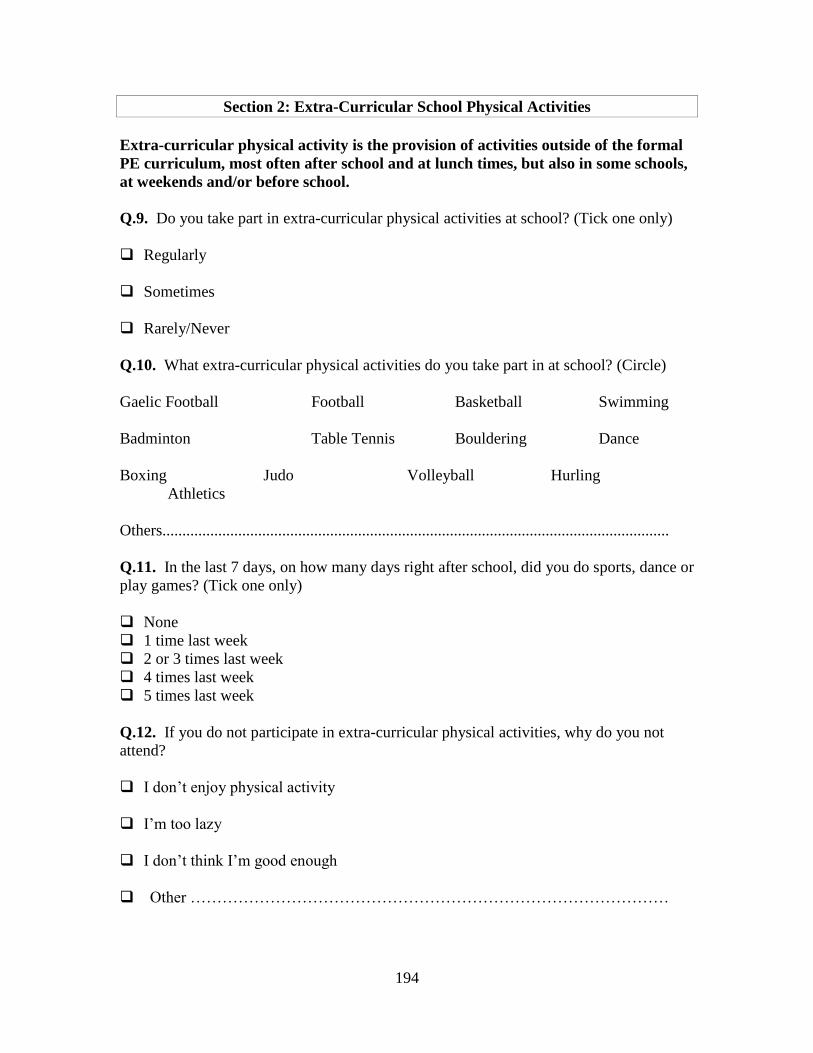
194
Section 2: Extra-Curricular School Physical Activities
Extra-curricular physical activity is the provision of activities outside of the formal
PE curriculum, most often after school and at lunch times, but also in some schools,
at weekends and/or before school.
Q.9. Do you take part in extra-curricular physical activities at school? (Tick one only)
Regularly
Sometimes
Rarely/Never
Q.10. What extra-curricular physical activities do you take part in at school? (Circle)
Gaelic Football Football Basketball Swimming
Badminton Table Tennis Bouldering Dance
Boxing Judo Volleyball Hurling
Athletics
Others...............................................................................................................................
Q.11. In the last 7 days, on how many days right after school, did you do sports, dance or
play games? (Tick one only)
None
1 time last week
2 or 3 times last week
4 times last week
5 times last week
Q.12. If you do not participate in extra-curricular physical activities, why do you not
attend?
I don’t enjoy physical activity
I’m too lazy
I don’t think I’m good enough
Other ………………………………………………………………………………
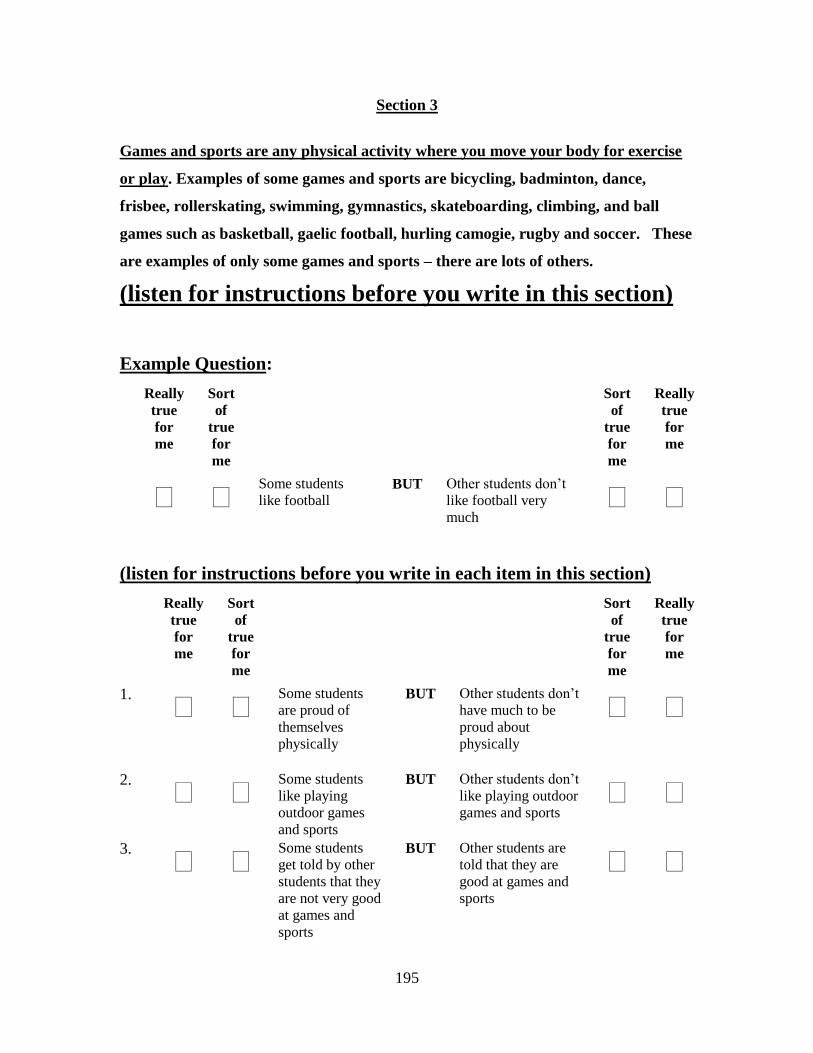
195
Section 3
Games and sports are any physical activity where you move your body for exercise
or play. Examples of some games and sports are bicycling, badminton, dance,
frisbee, rollerskating, swimming, gymnastics, skateboarding, climbing, and ball
games such as basketball, gaelic football, hurling camogie, rugby and soccer. These
are examples of only some games and sports – there are lots of others.
(listen for instructions before you write in this section)
Example Question:
Really
true
for
me
Sort
of
true
for
me
Sort
of
true
for
me
Really
true
for
me
Some students
like football BUT Other students don’t
like football very
much
(listen for instructions before you write in each item in this section)
Really
true
for
me
Sort
of
true
for
me
Sort
of
true
for
me
Really
true
for
me
1.
Some students
are proud of
themselves
physically
BUT Other students don’t
have much to be
proud about
physically
2.
Some students
like playing
outdoor games
and sports
BUT Other students don’t
like playing outdoor
games and sports
3.
Some students
get told by other
students that they
are not very good
at games and
sports
BUT Other students are
told that they are
good at games and
sports
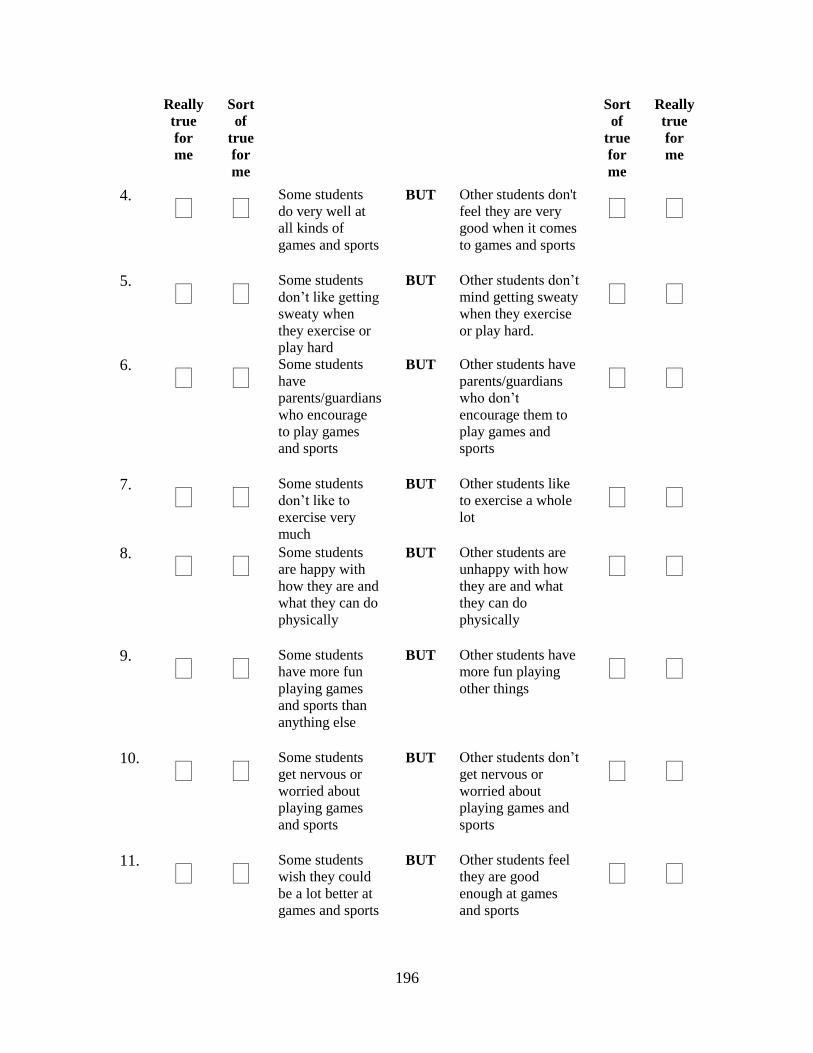
196
Really
true
for
me
Sort
of
true
for
me
Sort
of
true
for
me
Really
true
for
me
4.
Some students
do very well at
all kinds of
games and sports
BUT Other students don't
feel they are very
good when it comes
to games and sports
5.
Some students
don’t like getting
sweaty when
they exercise or
play hard
BUT Other students don’t
mind getting sweaty
when they exercise
or play hard.
6.
Some students
have
parents/guardians
who encourage
to play games
and sports
BUT Other students have
parents/guardians
who don’t
encourage them to
play games and
sports
7.
Some students
don’t like to
exercise very
much
BUT Other students like
to exercise a whole
lot
8.
Some students
are happy with
how they are and
what they can do
physically
BUT Other students are
unhappy with how
they are and what
they can do
physically
9.
Some students
have more fun
playing games
and sports than
anything else
BUT Other students have
more fun playing
other things
10.
Some students
get nervous or
worried about
playing games
and sports
BUT Other students don’t
get nervous or
worried about
playing games and
sports
11.
Some students
wish they could
be a lot better at
games and sports
BUT Other students feel
they are good
enough at games
and sports
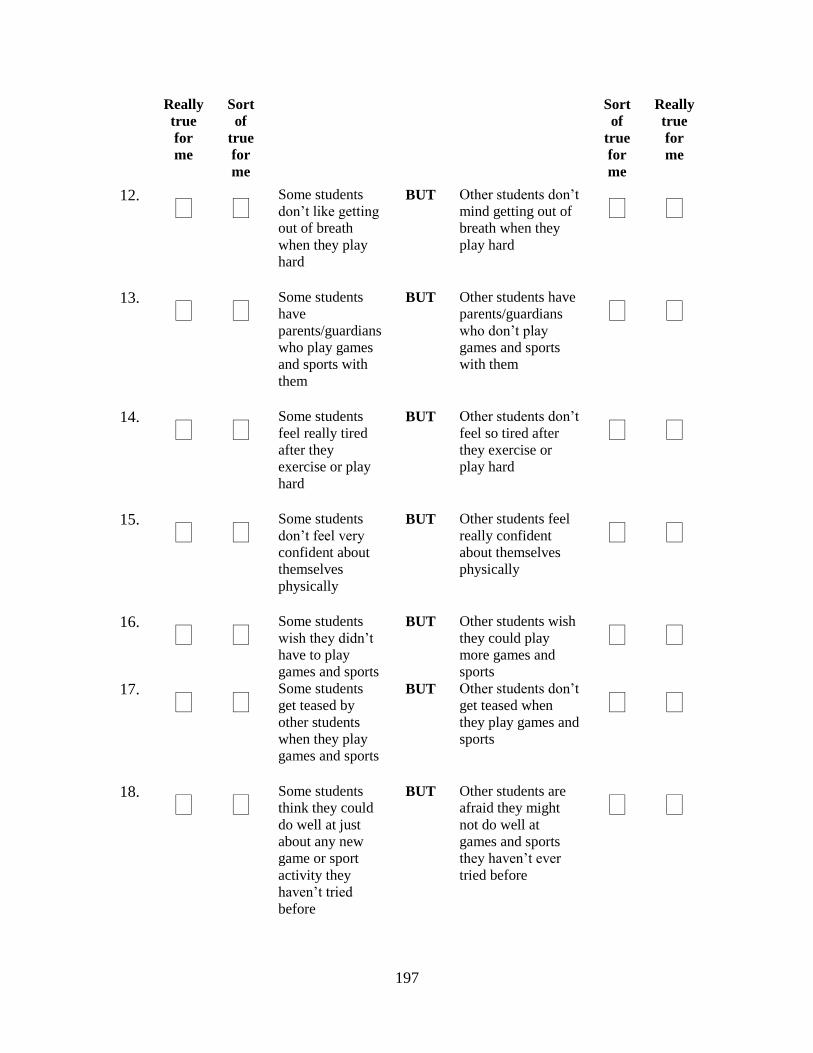
197
Really
true
for
me
Sort
of
true
for
me
Sort
of
true
for
me
Really
true
for
me
12.
Some students
don’t like getting
out of breath
when they play
hard
BUT Other students don’t
mind getting out of
breath when they
play hard
13.
Some students
have
parents/guardians
who play games
and sports with
them
BUT Other students have
parents/guardians
who don’t play
games and sports
with them
14.
Some students
feel really tired
after they
exercise or play
hard
BUT Other students don’t
feel so tired after
they exercise or
play hard
15.
Some students
don’t feel very
confident about
themselves
physically
BUT Other students feel
really confident
about themselves
physically
16.
Some students
wish they didn’t
have to play
games and sports
BUT Other students wish
they could play
more games and
sports
17.
Some students
get teased by
other students
when they play
games and sports
BUT Other students don’t
get teased when
they play games and
sports
18.
Some students
think they could
do well at just
about any new
game or sport
activity they
haven’t tried
before
BUT Other students are
afraid they might
not do well at
games and sports
they haven’t ever
tried before
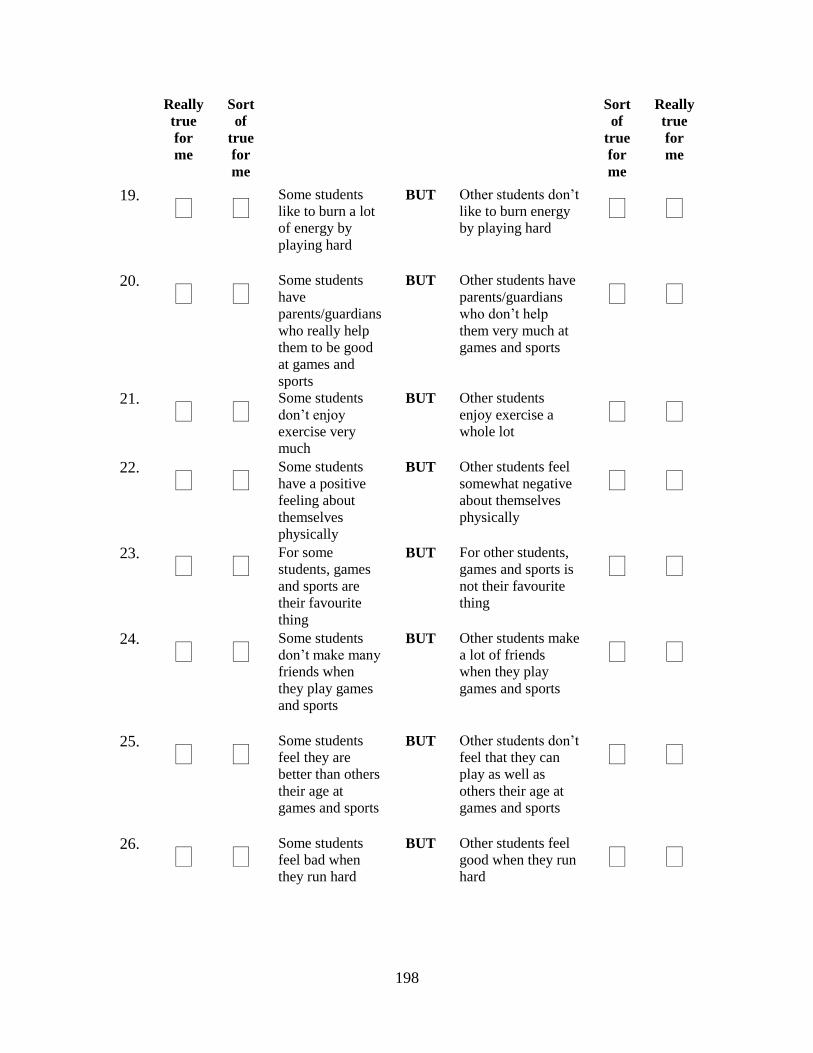
198
Really
true
for
me
Sort
of
true
for
me
Sort
of
true
for
me
Really
true
for
me
19.
Some students
like to burn a lot
of energy by
playing hard
BUT Other students don’t
like to burn energy
by playing hard
20.
Some students
have
parents/guardians
who really help
them to be good
at games and
sports
BUT Other students have
parents/guardians
who don’t help
them very much at
games and sports
21.
Some students
don’t enjoy
exercise very
much
BUT Other students
enjoy exercise a
whole lot
22.
Some students
have a positive
feeling about
themselves
physically
BUT Other students feel
somewhat negative
about themselves
physically
23.
For some
students, games
and sports are
their favourite
thing
BUT For other students,
games and sports is
not their favourite
thing
24.
Some students
don’t make many
friends when
they play games
and sports
BUT Other students make
a lot of friends
when they play
games and sports
25.
Some students
feel they are
better than others
their age at
games and sports
BUT Other students don’t
feel that they can
play as well as
others their age at
games and sports
26.
Some students
feel bad when
they run hard
BUT Other students feel
good when they run
hard
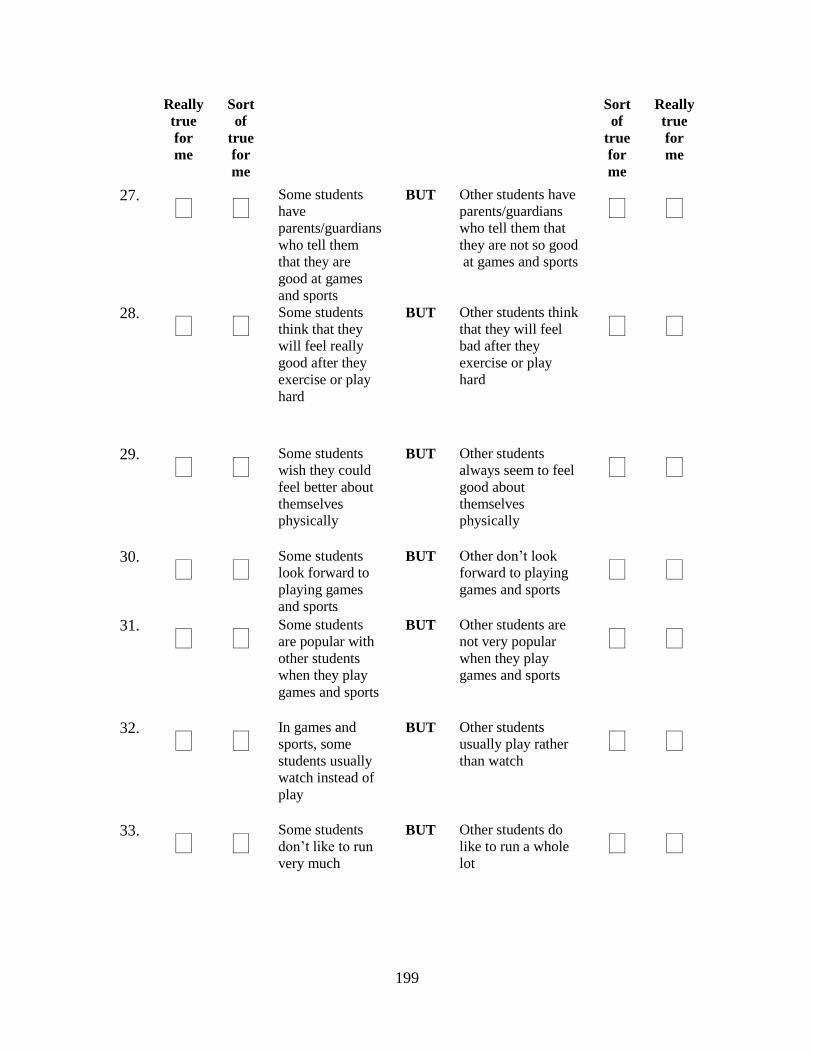
199
Really
true
for
me
Sort
of
true
for
me
Sort
of
true
for
me
Really
true
for
me
27.
Some students
have
parents/guardians
who tell them
that they are
good at games
and sports
BUT Other students have
parents/guardians
who tell them that
they are not so good
at games and sports
28.
Some students
think that they
will feel really
good after they
exercise or play
hard
BUT
Other students think
that they will feel
bad after they
exercise or play
hard
29.
Some students
wish they could
feel better about
themselves
physically
BUT Other students
always seem to feel
good about
themselves
physically
30.
Some students
look forward to
playing games
and sports
BUT Other don’t look
forward to playing
games and sports
31.
Some students
are popular with
other students
when they play
games and sports
BUT Other students are
not very popular
when they play
games and sports
32.
In games and
sports, some
students usually
watch instead of
play
BUT Other students
usually play rather
than watch
33.
Some students
don’t like to run
very much
BUT Other students do
like to run a whole
lot
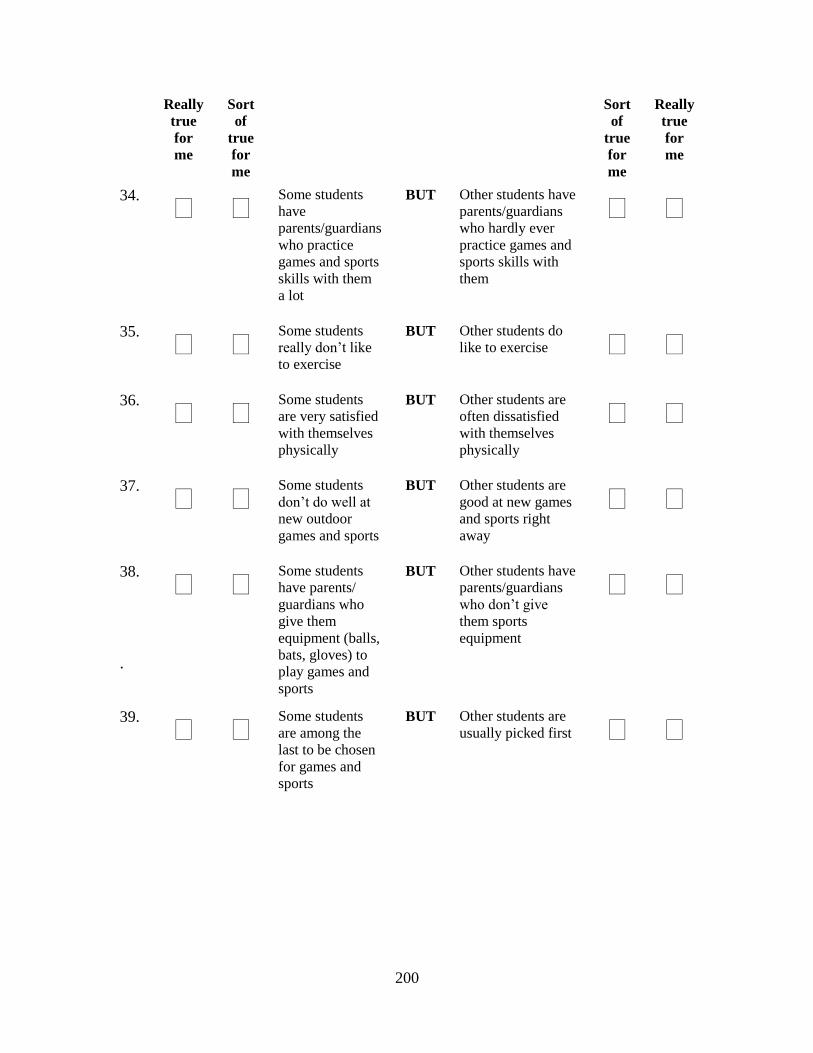
200
Really
true
for
me
Sort
of
true
for
me
Sort
of
true
for
me
Really
true
for
me
34.
Some students
have
parents/guardians
who practice
games and sports
skills with them
a lot
BUT Other students have
parents/guardians
who hardly ever
practice games and
sports skills with
them
35.
Some students
really don’t like
to exercise
BUT Other students do
like to exercise
36.
Some students
are very satisfied
with themselves
physically
BUT Other students are
often dissatisfied
with themselves
physically
37.
Some students
don’t do well at
new outdoor
games and sports
BUT Other students are
good at new games
and sports right
away
38.
.
Some students
have parents/
guardians who
give them
equipment (balls,
bats, gloves) to
play games and
sports
BUT
Other students have
parents/guardians
who don’t give
them sports
equipment
39.
Some students
are among the
last to be chosen
for games and
sports
BUT Other students are
usually picked first
201
Appendix F:
Physical Activity Diary/Pedometer Recording
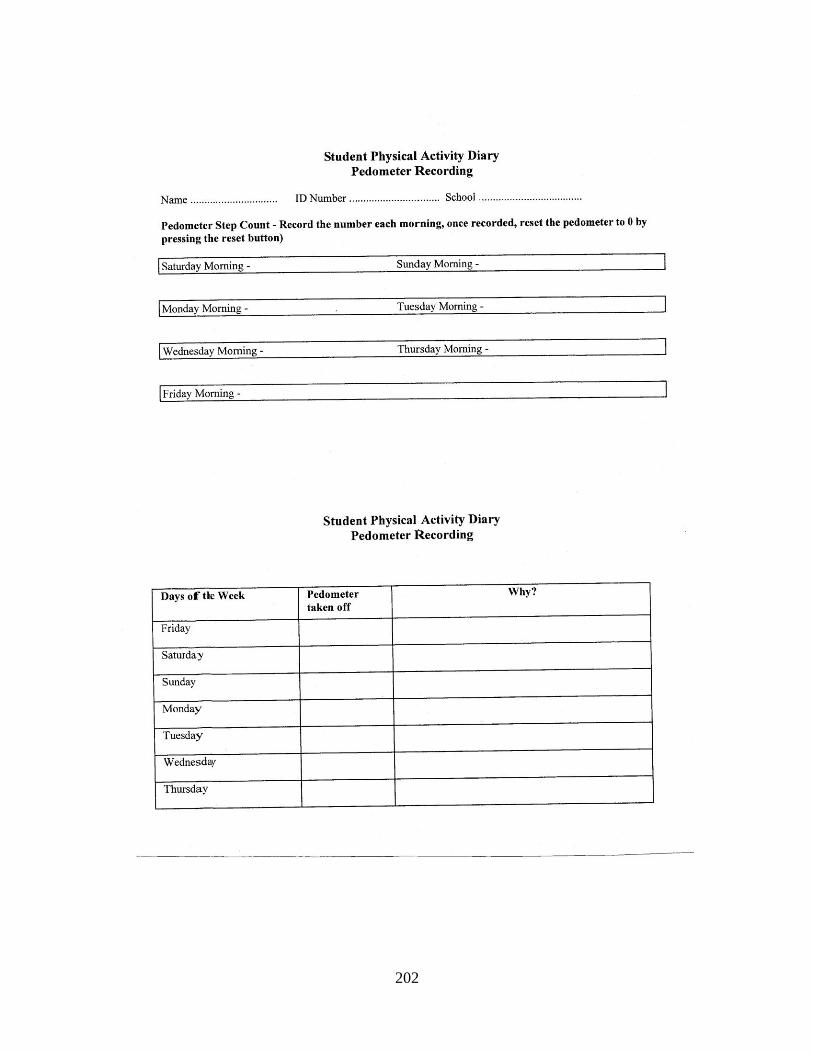
202
203
Appendix G:
Focus Groups
Raw Data/Themes and Sub-Themes
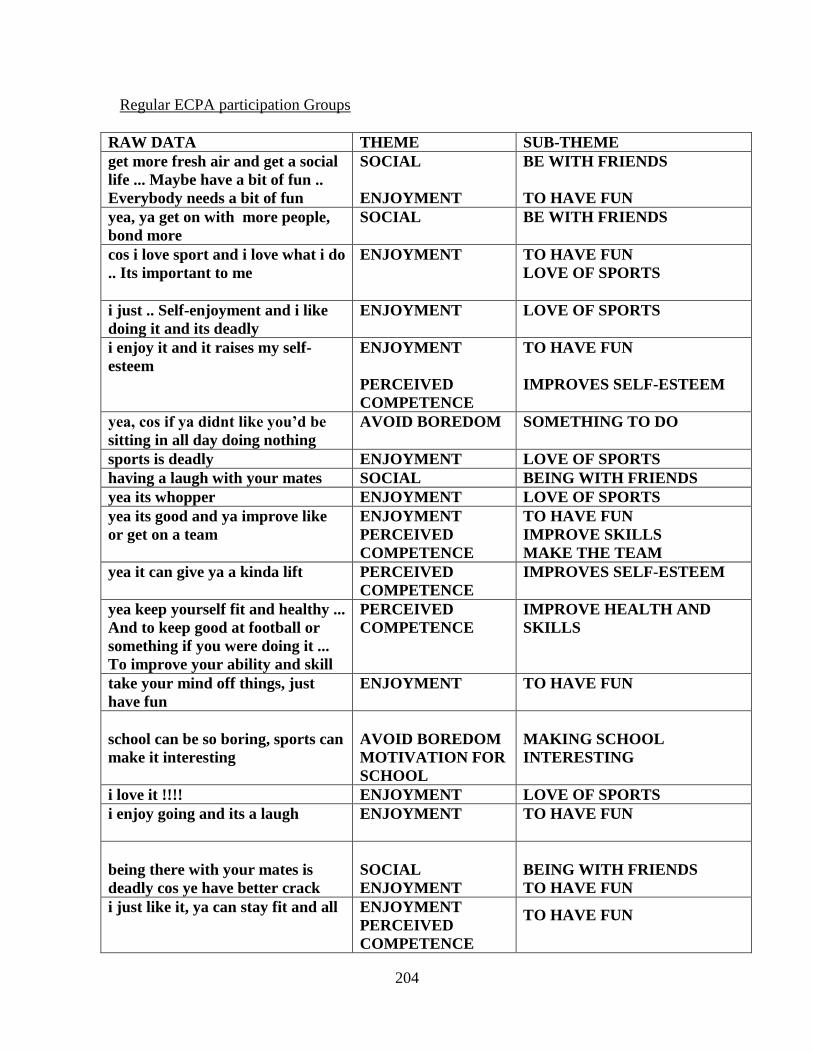
204
Regular ECPA participation Groups
RAW DATA THEME SUB-THEME
get more fresh air and get a social
life ... Maybe have a bit of fun ..
Everybody needs a bit of fun
SOCIAL
ENJOYMENT
BE WITH FRIENDS
TO HAVE FUN
yea, ya get on with more people,
bond more
SOCIAL BE WITH FRIENDS
cos i love sport and i love what i do
.. Its important to me
ENJOYMENT TO HAVE FUN
LOVE OF SPORTS
i just .. Self-enjoyment and i like
doing it and its deadly
ENJOYMENT LOVE OF SPORTS
i enjoy it and it raises my self-
esteem
ENJOYMENT
PERCEIVED
COMPETENCE
TO HAVE FUN
IMPROVES SELF-ESTEEM
yea, cos if ya didnt like you’d be
sitting in all day doing nothing
AVOID BOREDOM SOMETHING TO DO
sports is deadly ENJOYMENT LOVE OF SPORTS
having a laugh with your mates SOCIAL BEING WITH FRIENDS
yea its whopper ENJOYMENT LOVE OF SPORTS
yea its good and ya improve like
or get on a team
ENJOYMENT
PERCEIVED
COMPETENCE
TO HAVE FUN
IMPROVE SKILLS
MAKE THE TEAM
yea it can give ya a kinda lift PERCEIVED
COMPETENCE
IMPROVES SELF-ESTEEM
yea keep yourself fit and healthy ...
And to keep good at football or
something if you were doing it ...
To improve your ability and skill
PERCEIVED
COMPETENCE
IMPROVE HEALTH AND
SKILLS
take your mind off things, just
have fun
ENJOYMENT TO HAVE FUN
school can be so boring, sports can
make it interesting
AVOID BOREDOM
MOTIVATION FOR
SCHOOL
MAKING SCHOOL
INTERESTING
i love it !!!! ENJOYMENT LOVE OF SPORTS
i enjoy going and its a laugh ENJOYMENT TO HAVE FUN
being there with your mates is
deadly cos ye have better crack
SOCIAL
ENJOYMENT
BEING WITH FRIENDS
TO HAVE FUN
i just like it, ya can stay fit and all ENJOYMENT
PERCEIVED
COMPETENCE
TO HAVE FUN

205
TO IMPROVE FITNESS
yea we do all sports .. Its deadly ENJOYMENT TO HAVE FUN
i just really love me sport ENJOYMENT LOVE OF SPORTS
to get better and feel good PERCEIVED
COMPETENCE IMPROVE SELF-ESTEEM
yea fitter and have a laugh PERCEIVED
COMPETENCE
ENJOYMENT
TO IMPROVE FITNESS
TO HAVE FUN
its fun and to be with me mates ENJOYMENT
SOCIAL
TO HAVE FUN
BE WITH FRIENDS
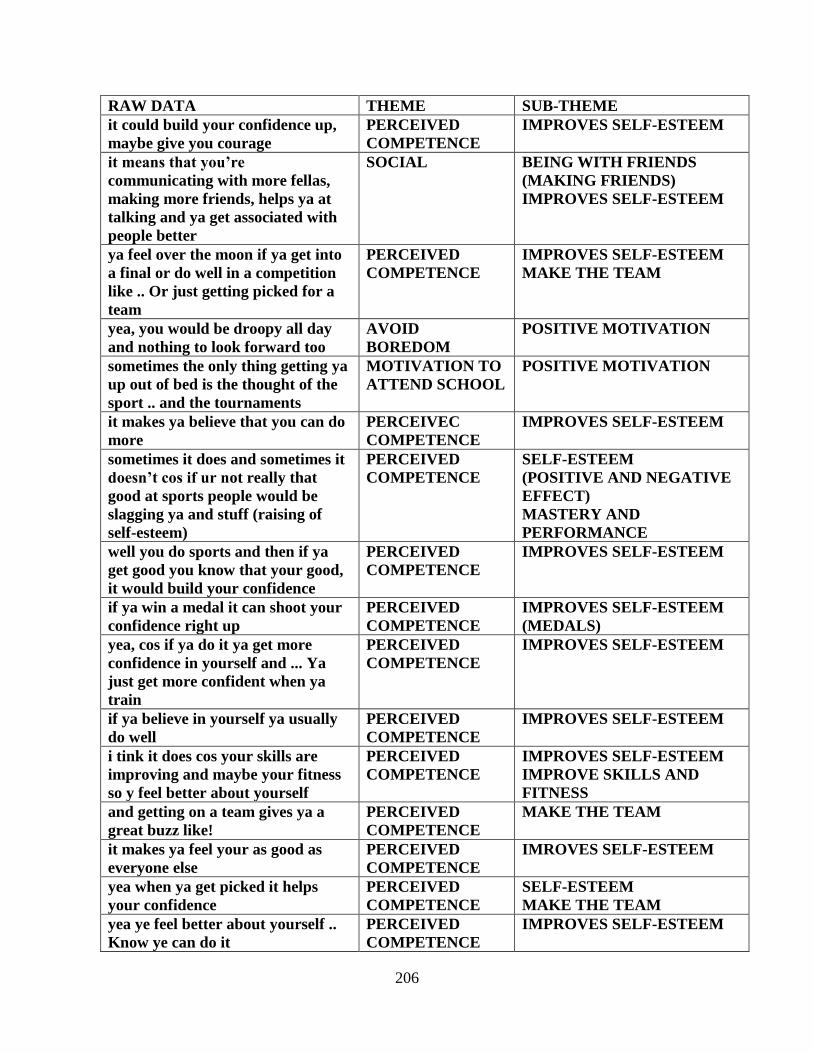
206
RAW DATA THEME SUB-THEME
it could build your confidence up,
maybe give you courage
PERCEIVED
COMPETENCE
IMPROVES SELF-ESTEEM
it means that you’re
communicating with more fellas,
making more friends, helps ya at
talking and ya get associated with
people better
SOCIAL
BEING WITH FRIENDS
(MAKING FRIENDS)
IMPROVES SELF-ESTEEM
ya feel over the moon if ya get into
a final or do well in a competition
like .. Or just getting picked for a
team
PERCEIVED
COMPETENCE
IMPROVES SELF-ESTEEM
MAKE THE TEAM
yea, you would be droopy all day
and nothing to look forward too
AVOID
BOREDOM
POSITIVE MOTIVATION
sometimes the only thing getting ya
up out of bed is the thought of the
sport .. and the tournaments
MOTIVATION TO
ATTEND SCHOOL
POSITIVE MOTIVATION
it makes ya believe that you can do
more
PERCEIVEC
COMPETENCE
IMPROVES SELF-ESTEEM
sometimes it does and sometimes it
doesn’t cos if ur not really that
good at sports people would be
slagging ya and stuff (raising of
self-esteem)
PERCEIVED
COMPETENCE
SELF-ESTEEM
(POSITIVE AND NEGATIVE
EFFECT)
MASTERY AND
PERFORMANCE
well you do sports and then if ya
get good you know that your good,
it would build your confidence
PERCEIVED
COMPETENCE
IMPROVES SELF-ESTEEM
if ya win a medal it can shoot your
confidence right up
PERCEIVED
COMPETENCE
IMPROVES SELF-ESTEEM
(MEDALS)
yea, cos if ya do it ya get more
confidence in yourself and ... Ya
just get more confident when ya
train
PERCEIVED
COMPETENCE
IMPROVES SELF-ESTEEM
if ya believe in yourself ya usually
do well
PERCEIVED
COMPETENCE
IMPROVES SELF-ESTEEM
i tink it does cos your skills are
improving and maybe your fitness
so y feel better about yourself
PERCEIVED
COMPETENCE
IMPROVES SELF-ESTEEM
IMPROVE SKILLS AND
FITNESS
and getting on a team gives ya a
great buzz like!
PERCEIVED
COMPETENCE
MAKE THE TEAM
it makes ya feel your as good as
everyone else
PERCEIVED
COMPETENCE
IMROVES SELF-ESTEEM
yea when ya get picked it helps
your confidence
PERCEIVED
COMPETENCE
SELF-ESTEEM
MAKE THE TEAM
yea ye feel better about yourself ..
Know ye can do it
PERCEIVED
COMPETENCE
IMPROVES SELF-ESTEEM
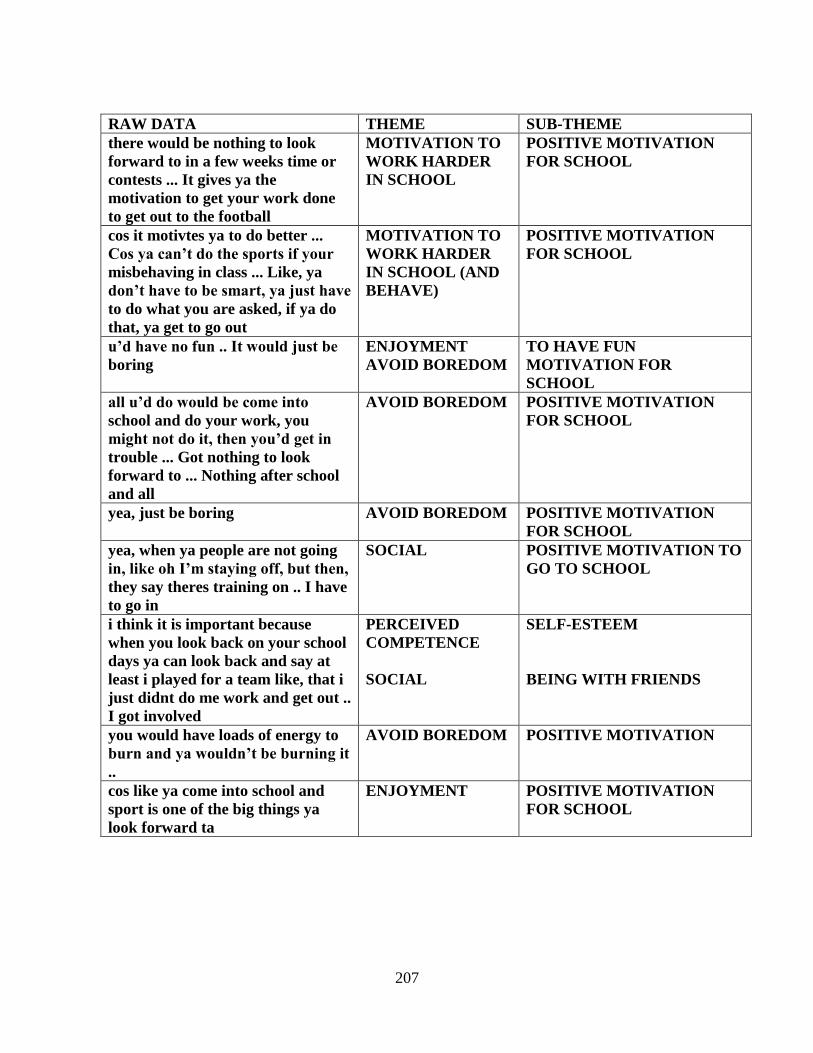
207
RAW DATA THEME SUB-THEME
there would be nothing to look
forward to in a few weeks time or
contests ... It gives ya the
motivation to get your work done
to get out to the football
MOTIVATION TO
WORK HARDER
IN SCHOOL
POSITIVE MOTIVATION
FOR SCHOOL
cos it motivtes ya to do better ...
Cos ya can’t do the sports if your
misbehaving in class ... Like, ya
don’t have to be smart, ya just have
to do what you are asked, if ya do
that, ya get to go out
MOTIVATION TO
WORK HARDER
IN SCHOOL (AND
BEHAVE)
POSITIVE MOTIVATION
FOR SCHOOL
u’d have no fun .. It would just be
boring
ENJOYMENT
AVOID BOREDOM
TO HAVE FUN
MOTIVATION FOR
SCHOOL
all u’d do would be come into
school and do your work, you
might not do it, then you’d get in
trouble ... Got nothing to look
forward to ... Nothing after school
and all
AVOID BOREDOM
POSITIVE MOTIVATION
FOR SCHOOL
yea, just be boring AVOID BOREDOM POSITIVE MOTIVATION
FOR SCHOOL
yea, when ya people are not going
in, like oh I’m staying off, but then,
they say theres training on .. I have
to go in
SOCIAL POSITIVE MOTIVATION TO
GO TO SCHOOL
i think it is important because
when you look back on your school
days ya can look back and say at
least i played for a team like, that i
just didnt do me work and get out ..
I got involved
PERCEIVED
COMPETENCE
SOCIAL
SELF-ESTEEM
BEING WITH FRIENDS
you would have loads of energy to
burn and ya wouldn’t be burning it
..
AVOID BOREDOM POSITIVE MOTIVATION
cos like ya come into school and
sport is one of the big things ya
look forward ta
ENJOYMENT POSITIVE MOTIVATION
FOR SCHOOL
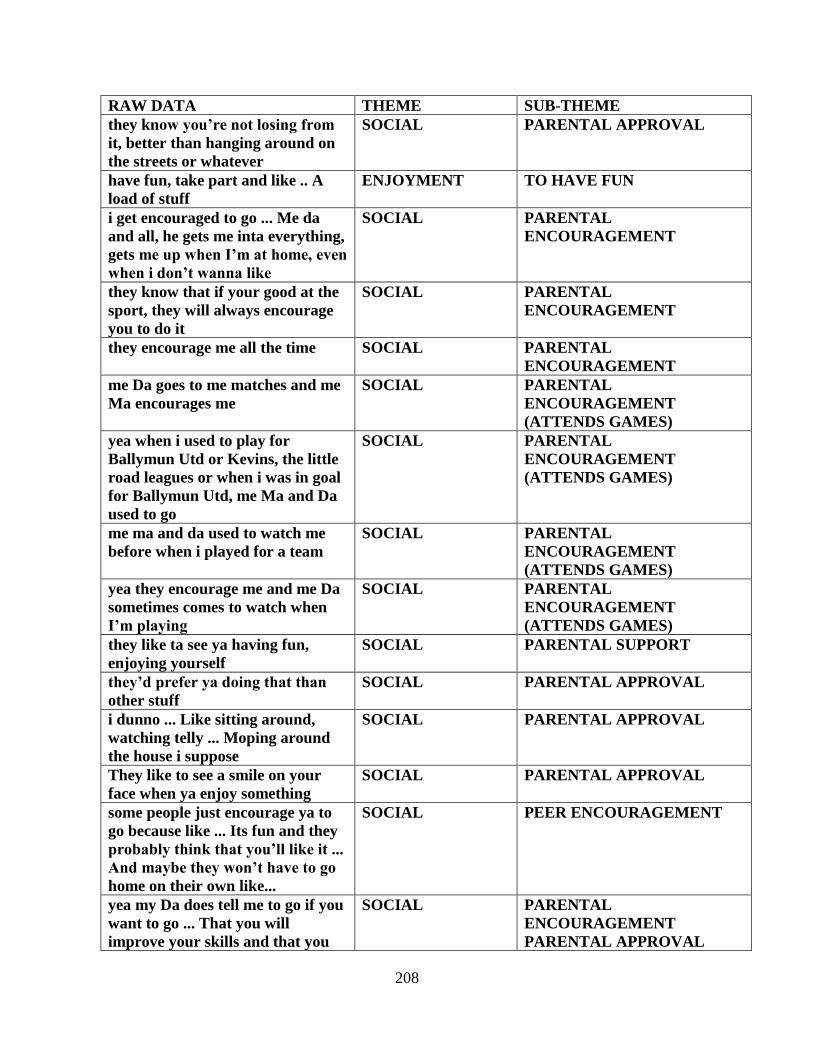
208
RAW DATA THEME SUB-THEME
they know you’re not losing from
it, better than hanging around on
the streets or whatever
SOCIAL
PARENTAL APPROVAL
have fun, take part and like .. A
load of stuff
ENJOYMENT TO HAVE FUN
i get encouraged to go ... Me da
and all, he gets me inta everything,
gets me up when I’m at home, even
when i don’t wanna like
SOCIAL PARENTAL
ENCOURAGEMENT
they know that if your good at the
sport, they will always encourage
you to do it
SOCIAL PARENTAL
ENCOURAGEMENT
they encourage me all the time SOCIAL PARENTAL
ENCOURAGEMENT
me Da goes to me matches and me
Ma encourages me
SOCIAL PARENTAL
ENCOURAGEMENT
(ATTENDS GAMES)
yea when i used to play for
Ballymun Utd or Kevins, the little
road leagues or when i was in goal
for Ballymun Utd, me Ma and Da
used to go
SOCIAL PARENTAL
ENCOURAGEMENT
(ATTENDS GAMES)
me ma and da used to watch me
before when i played for a team
SOCIAL PARENTAL
ENCOURAGEMENT
(ATTENDS GAMES)
yea they encourage me and me Da
sometimes comes to watch when
I’m playing
SOCIAL PARENTAL
ENCOURAGEMENT
(ATTENDS GAMES)
they like ta see ya having fun,
enjoying yourself
SOCIAL PARENTAL SUPPORT
they’d prefer ya doing that than
other stuff
SOCIAL PARENTAL APPROVAL
i dunno ... Like sitting around,
watching telly ... Moping around
the house i suppose
SOCIAL PARENTAL APPROVAL
They like to see a smile on your
face when ya enjoy something
SOCIAL PARENTAL APPROVAL
some people just encourage ya to
go because like ... Its fun and they
probably think that you’ll like it ...
And maybe they won’t have to go
home on their own like...
SOCIAL PEER ENCOURAGEMENT
yea my Da does tell me to go if you
want to go ... That you will
improve your skills and that you
SOCIAL PARENTAL
ENCOURAGEMENT
PARENTAL APPROVAL
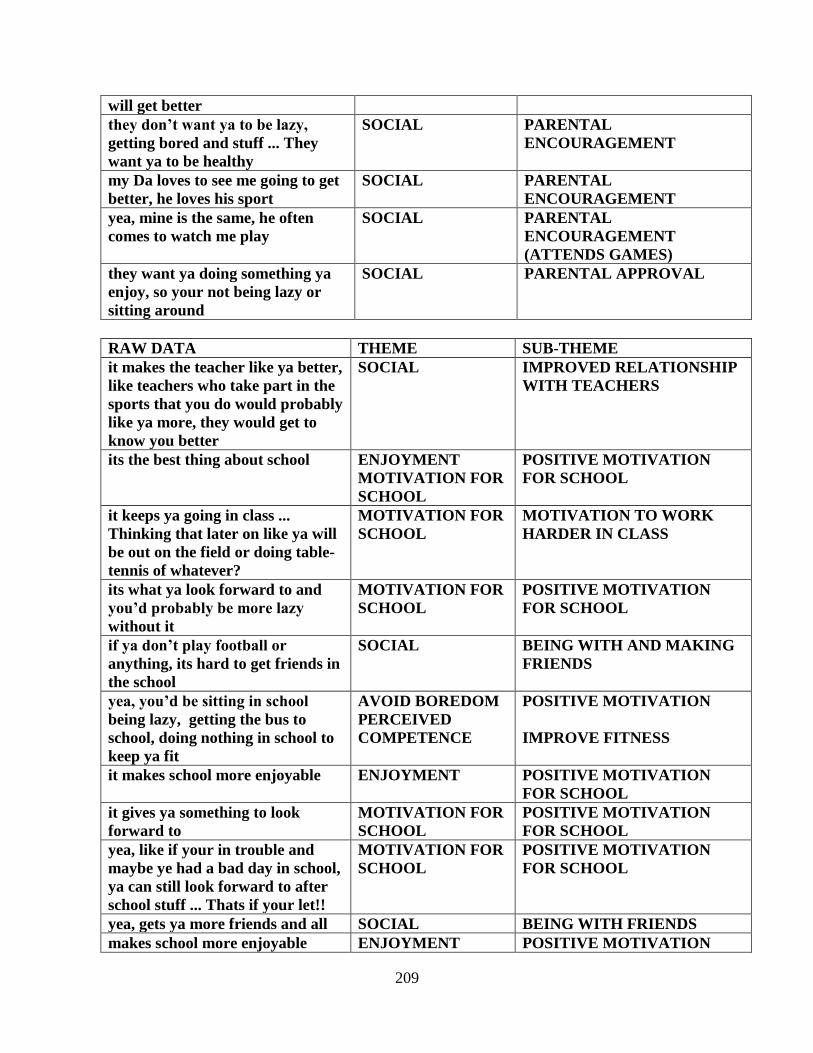
209
will get better
they don’t want ya to be lazy,
getting bored and stuff ... They
want ya to be healthy
SOCIAL PARENTAL
ENCOURAGEMENT
my Da loves to see me going to get
better, he loves his sport
SOCIAL PARENTAL
ENCOURAGEMENT
yea, mine is the same, he often
comes to watch me play
SOCIAL PARENTAL
ENCOURAGEMENT
(ATTENDS GAMES)
they want ya doing something ya
enjoy, so your not being lazy or
sitting around
SOCIAL PARENTAL APPROVAL
RAW DATA THEME SUB-THEME
it makes the teacher like ya better,
like teachers who take part in the
sports that you do would probably
like ya more, they would get to
know you better
SOCIAL IMPROVED RELATIONSHIP
WITH TEACHERS
its the best thing about school ENJOYMENT
MOTIVATION FOR
SCHOOL
POSITIVE MOTIVATION
FOR SCHOOL
it keeps ya going in class ...
Thinking that later on like ya will
be out on the field or doing table-
tennis of whatever?
MOTIVATION FOR
SCHOOL
MOTIVATION TO WORK
HARDER IN CLASS
its what ya look forward to and
you’d probably be more lazy
without it
MOTIVATION FOR
SCHOOL
POSITIVE MOTIVATION
FOR SCHOOL
if ya don’t play football or
anything, its hard to get friends in
the school
SOCIAL BEING WITH AND MAKING
FRIENDS
yea, you’d be sitting in school
being lazy, getting the bus to
school, doing nothing in school to
keep ya fit
AVOID BOREDOM
PERCEIVED
COMPETENCE
POSITIVE MOTIVATION
IMPROVE FITNESS
it makes school more enjoyable ENJOYMENT POSITIVE MOTIVATION
FOR SCHOOL
it gives ya something to look
forward to
MOTIVATION FOR
SCHOOL
POSITIVE MOTIVATION
FOR SCHOOL
yea, like if your in trouble and
maybe ye had a bad day in school,
ya can still look forward to after
school stuff ... Thats if your let!!
MOTIVATION FOR
SCHOOL
POSITIVE MOTIVATION
FOR SCHOOL
yea, gets ya more friends and all SOCIAL BEING WITH FRIENDS
makes school more enjoyable ENJOYMENT POSITIVE MOTIVATION
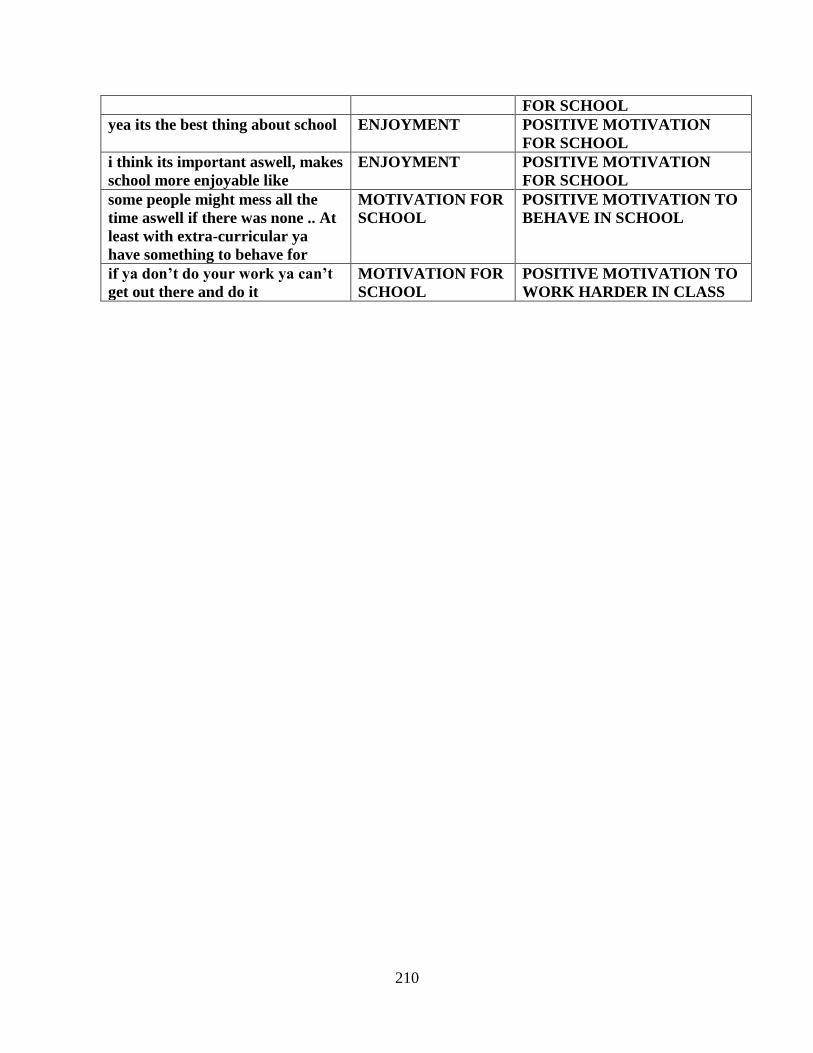
210
FOR SCHOOL
yea its the best thing about school ENJOYMENT POSITIVE MOTIVATION
FOR SCHOOL
i think its important aswell, makes
school more enjoyable like
ENJOYMENT POSITIVE MOTIVATION
FOR SCHOOL
some people might mess all the
time aswell if there was none .. At
least with extra-curricular ya
have something to behave for
MOTIVATION FOR
SCHOOL
POSITIVE MOTIVATION TO
BEHAVE IN SCHOOL
if ya don’t do your work ya can’t
get out there and do it
MOTIVATION FOR
SCHOOL
POSITIVE MOTIVATION TO
WORK HARDER IN CLASS
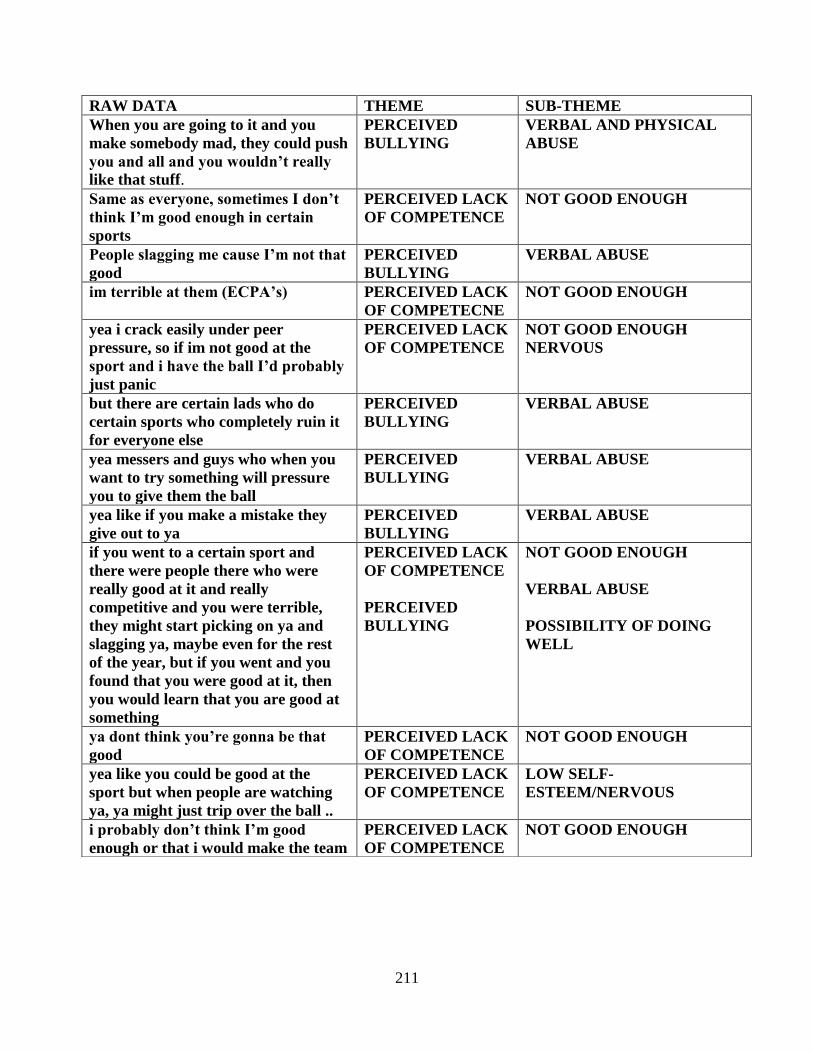
211
RAW DATA THEME SUB-THEME
When you are going to it and you
make somebody mad, they could push
you and all and you wouldn’t really
like that stuff.
PERCEIVED
BULLYING
VERBAL AND PHYSICAL
ABUSE
Same as everyone, sometimes I don’t
think I’m good enough in certain
sports
PERCEIVED LACK
OF COMPETENCE
NOT GOOD ENOUGH
People slagging me cause I’m not that
good
PERCEIVED
BULLYING
VERBAL ABUSE
im terrible at them (ECPA’s) PERCEIVED LACK
OF COMPETECNE
NOT GOOD ENOUGH
yea i crack easily under peer
pressure, so if im not good at the
sport and i have the ball I’d probably
just panic
PERCEIVED LACK
OF COMPETENCE
NOT GOOD ENOUGH
NERVOUS
but there are certain lads who do
certain sports who completely ruin it
for everyone else
PERCEIVED
BULLYING
VERBAL ABUSE
yea messers and guys who when you
want to try something will pressure
you to give them the ball
PERCEIVED
BULLYING
VERBAL ABUSE
yea like if you make a mistake they
give out to ya
PERCEIVED
BULLYING
VERBAL ABUSE
if you went to a certain sport and
there were people there who were
really good at it and really
competitive and you were terrible,
they might start picking on ya and
slagging ya, maybe even for the rest
of the year, but if you went and you
found that you were good at it, then
you would learn that you are good at
something
PERCEIVED LACK
OF COMPETENCE
PERCEIVED
BULLYING
NOT GOOD ENOUGH
VERBAL ABUSE
POSSIBILITY OF DOING
WELL
ya dont think you’re gonna be that
good
PERCEIVED LACK
OF COMPETENCE
NOT GOOD ENOUGH
yea like you could be good at the
sport but when people are watching
ya, ya might just trip over the ball ..
PERCEIVED LACK
OF COMPETENCE
LOW SELF-
ESTEEM/NERVOUS
i probably don’t think I’m good
enough or that i would make the team
PERCEIVED LACK
OF COMPETENCE
NOT GOOD ENOUGH
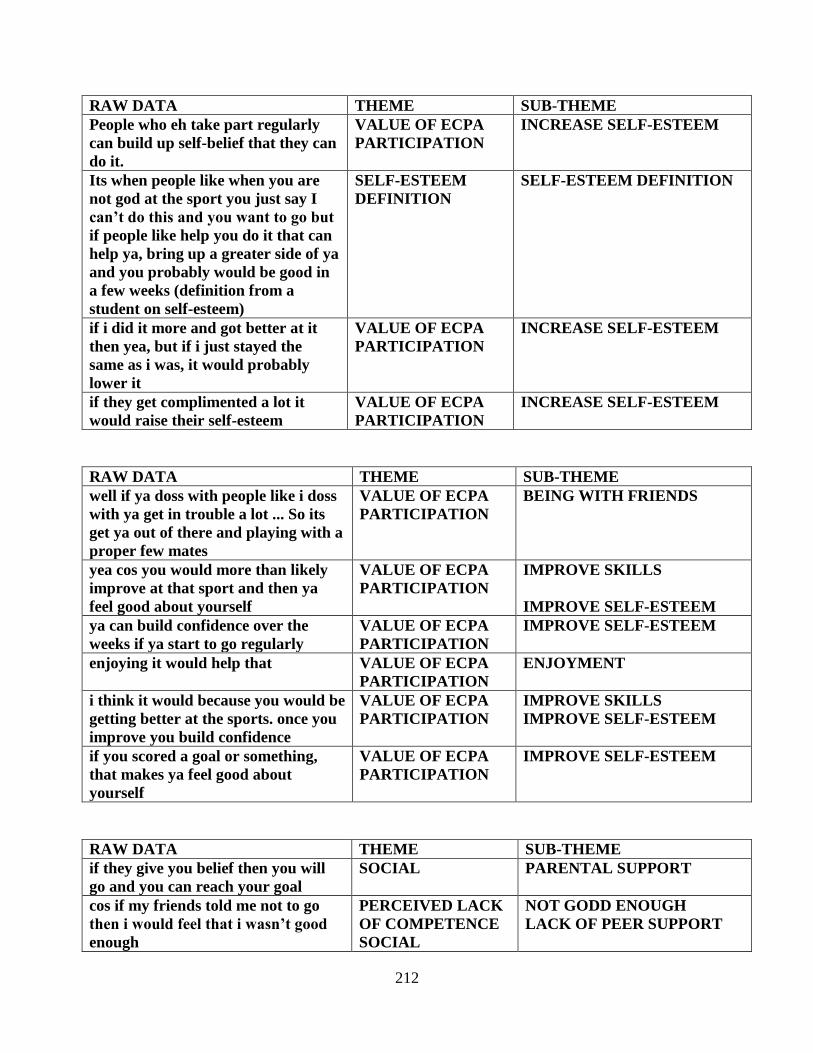
212
RAW DATA THEME SUB-THEME
People who eh take part regularly
can build up self-belief that they can
do it.
VALUE OF ECPA
PARTICIPATION
INCREASE SELF-ESTEEM
Its when people like when you are
not god at the sport you just say I
can’t do this and you want to go but
if people like help you do it that can
help ya, bring up a greater side of ya
and you probably would be good in
a few weeks (definition from a
student on self-esteem)
SELF-ESTEEM
DEFINITION
SELF-ESTEEM DEFINITION
if i did it more and got better at it
then yea, but if i just stayed the
same as i was, it would probably
lower it
VALUE OF ECPA
PARTICIPATION
INCREASE SELF-ESTEEM
if they get complimented a lot it
would raise their self-esteem
VALUE OF ECPA
PARTICIPATION
INCREASE SELF-ESTEEM
RAW DATA THEME SUB-THEME
well if ya doss with people like i doss
with ya get in trouble a lot ... So its
get ya out of there and playing with a
proper few mates
VALUE OF ECPA
PARTICIPATION
BEING WITH FRIENDS
yea cos you would more than likely
improve at that sport and then ya
feel good about yourself
VALUE OF ECPA
PARTICIPATION
IMPROVE SKILLS
IMPROVE SELF-ESTEEM
ya can build confidence over the
weeks if ya start to go regularly
VALUE OF ECPA
PARTICIPATION
IMPROVE SELF-ESTEEM
enjoying it would help that VALUE OF ECPA
PARTICIPATION
ENJOYMENT
i think it would because you would be
getting better at the sports. once you
improve you build confidence
VALUE OF ECPA
PARTICIPATION
IMPROVE SKILLS
IMPROVE SELF-ESTEEM
if you scored a goal or something,
that makes ya feel good about
yourself
VALUE OF ECPA
PARTICIPATION
IMPROVE SELF-ESTEEM
RAW DATA THEME SUB-THEME
if they give you belief then you will
go and you can reach your goal
SOCIAL PARENTAL SUPPORT
cos if my friends told me not to go
then i would feel that i wasn’t good
enough
PERCEIVED LACK
OF COMPETENCE
SOCIAL
NOT GODD ENOUGH
LACK OF PEER SUPPORT
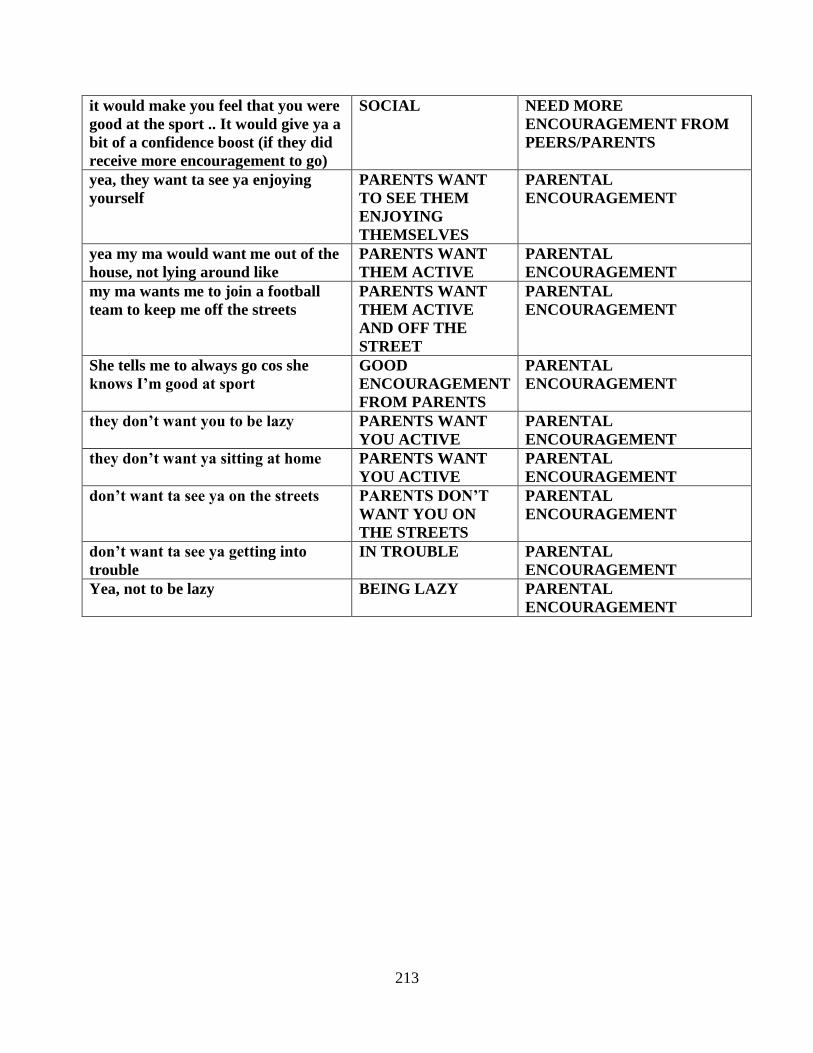
213
it would make you feel that you were
good at the sport .. It would give ya a
bit of a confidence boost (if they did
receive more encouragement to go)
SOCIAL NEED MORE
ENCOURAGEMENT FROM
PEERS/PARENTS
yea, they want ta see ya enjoying
yourself
PARENTS WANT
TO SEE THEM
ENJOYING
THEMSELVES
PARENTAL
ENCOURAGEMENT
yea my ma would want me out of the
house, not lying around like
PARENTS WANT
THEM ACTIVE
PARENTAL
ENCOURAGEMENT
my ma wants me to join a football
team to keep me off the streets
PARENTS WANT
THEM ACTIVE
AND OFF THE
STREET
PARENTAL
ENCOURAGEMENT
She tells me to always go cos she
knows I’m good at sport
GOOD
ENCOURAGEMENT
FROM PARENTS
PARENTAL
ENCOURAGEMENT
they don’t want you to be lazy PARENTS WANT
YOU ACTIVE
PARENTAL
ENCOURAGEMENT
they don’t want ya sitting at home PARENTS WANT
YOU ACTIVE
PARENTAL
ENCOURAGEMENT
don’t want ta see ya on the streets PARENTS DON’T
WANT YOU ON
THE STREETS
PARENTAL
ENCOURAGEMENT
don’t want ta see ya getting into
trouble
IN TROUBLE PARENTAL
ENCOURAGEMENT
Yea, not to be lazy BEING LAZY PARENTAL
ENCOURAGEMENT


![format and rationale - DORAS - DCUdoras.dcu.ie/4530/1/ESAI_2009t[6].pdf · ESAI 2009t[6].ppt Author: justinrami Created Date: 4/8/2009 12:03:59 PM](https://img.pdfslide.us/doc/110x75/5ca58bde88c993af5d8ba454/format-and-rationale-doras-6pdf-esai-2009t6ppt-author-justinrami-created.jpg)