Embed Size (px)
Citation preview
Homicide by Neighborhood: Mapping New York City’s Violent Crime Drop
Preeti Chauhan and Lauren Kois
Research and Evaluation Center July 2012

THE AUTHORSPreeti Chauhan is a faculty member at John Jay College of Criminal Justice, City University of
New York (CUNY) and a faculty research fellow with the Research and Evaluation Center at John
Jay College. She received her Ph.D. in clinical psychology from the University of Virginia and
completed her clinical internship at New York Presbyterian Hospital/Weill Cornell Medical College.
Her research focuses on the intersection of neighborhood and individual level risk factors for
homicide, antisocial behavior, and substance use and how these risk factors contribute to race/
ethnic differences in negative outcomes.
Lauren Kois is a doctoral student of clinical forensic psychology at John Jay College of Criminal
Justice and the Graduate Center, City University of New York (CUNY). She is a 2011 graduate of
New York University’s Graduate School of Arts and Sciences Master of Arts in psychology with a
forensic emphasis. Her research focuses on multicultural issues in the area of psychology and
law, such as immigration, acculturation, criminal behavior, and their associations to outcomes in
forensic assessments, and how race, ethnicity, and neighborhoods influence psychopathological
outcomes.
ACKNOWLEDGEMENTSThe Rudin Foundations of New York City provided support for this report. Additional support was
provided by grant #5P20MD006118-03 from the National Institute on Minority Health and Health
Disparities. Any views expressed here are those of the authors and do not necessarily reflect the
policies of the Department of Health and Human Services or those of John Jay College of Criminal
Justice. The authors wish to thank Sandro Galea and Kenneth Tardiff for providing the data
and Melissa Tracy for calculating rates and proportions for the precincts. Lastly, the authors are
grateful to Richard Rosenfeld for his comments on an earlier draft of the report.
RECOMMENDED CITATIONChauhan, Preeti and Lauren Kois (2012). Homicide by Neighborhood: Mapping New York City’s
Violent Crime Drop. New York, NY: Research and Evaluation Center, John Jay College of Criminal
Justice, City University of New York.

TABLE OF CONTENTS
Summary 1The Crime Decline of the 1990s 2 Misdemeanor Policing: Theory and Research 3 Drug Markets: Theory and Research 6
Methods 9Results 11 Gun-Related Homicides 11 Misdemeanor Policing and Homicide Rates 14 Drug Markets 16
Conclusions 20References 23
Appendix A 27

SUMMARY |The United States, and New York City (NYC) in particular, experienced falling rates of violent crime beginning in the 1990s. For two decades, researchers, scholars, and policymakers interested in the NYC crime decline have attempted to pinpoint causes of the downward trend. Discovering the causes of the city’s crime drop may lead to important lessons for the city itself and may influence policy and practice throughout the state, nation, and perhaps other countries.
Researchers have suggested a host of mechanisms that may explain the dramatic decline in violence, but two factors—misdemeanor policing and the transformation of drug markets—continue to receive the most attention. This report focuses on these factors in relation to gun-related homicide rates. Specifically, it describes and maps precinct-level relationships between misdemeanor policing, drug markets, and gun-related homicide rates from 1990 to 1999 in NYC. While some precincts demonstrate theoretically expected patterns, others do not. An increase in misdemeanor policing is related to a decrease in homicide in some, but not all, precincts. Similarly, a decrease in drug use (measured by accidental deaths with toxicology reports positive for cocaine and drug arrest rates) is not consistently related to homicide decline. Notably, cocaine consumption demonstrates more theoretically consistent relationships relative to drug arrest rates.
Overall, there is substantial heterogeneity in the social processes associated with the decline in violent crime. A few select precincts may be responsible for driving aggregate level trends. Future investigations may be able to develop a more nuanced understanding of the complex systems of crime reduction if they consider micro level, geospatial analyses, in addition to multivariate analyses.
01

THE CRIME DECLINE OF THE 1990S |The existence of the 1990s crime drop is indisputable and well documented by researchers at the national level and in New York City (Blumstein and Wallman 2006; Karmen 2000; Zimring 2006). Crimes across all categories from homicide and robbery to larceny and motor vehicle theft declined in record numbers (Travis and Waul 2002). Researchers cite a host of factors as possible reasons for the decline including, but not limited to: falling alcohol consumption (Cerdá et al. 2010; Parker and Cartmill 1998; Parker and Rebhun 1995), reductions in gun availability (Blumstein 1995a, 1995b; Blumstein and Rosenfeld 1998; Blumstein, Rivara, and Rosenfeld 2000; Blumstein and Wallman 2006) and rising incarceration (Corman and Mocan 2005; Rosenfeld 2006; Spelman 2006; Zimring 2006). Most likely, of course, crime rates fell due to a combination of many factors, rather than a single one. Two factors, however, continue to receive the most theoretical and empirical attention—especially in NYC: an increase in misdemeanor policing and the transformation of crack cocaine markets (Baumer, Lauritsten, Rosenfeld, and Wright 1998; Blumstein 1995a; 1995b; Cerdá et al. 2009; 2010; Kelling and Bratton 1998; Kelling and Sousa 2001; Messner et al. 2007; Rosenfeld, Fornango, and Rengifo 2007; Wilson and Kelling 1982).
The falling crime rates seen in NYC during the 1990s were not unique and largely mirrored national trends. Declining homicide rates were observed in cities across the country with some cities, such as Boston and San Diego experiencing greater decreases than those experienced in NYC (Karmen 2000). Researchers report that homicide rates in NYC declined, but not at rates that could be considered exceptional relative to other cities, either in the 1990s (Fagan, Zimring, and Kim 1998; Rosenfeld, Fornango, and Baumer 2005) or when considering cyclical patterns in NYC and other major cities from 1976 to 1998 (Joanes 2000). Notably, post-2000 NYC continues to boast a falling rate of violent crime, with Zimring (2011) arguing that the city’s crime decline is twice as large and more sustained than national trends.
This report synthesizes theoretical and empirical research on the influence of misdemeanor policing and drug markets on homicide rates in NYC from 1990 to 1999. It also maps, by NYPD police precincts, the prevalence of misdemeanor policing (rates of misdemeanor
02

arrests), drug markets (drug arrests and the proportion of accidental deaths with toxicology reports positive for cocaine), and gun-related homicides. The goal of the analysis is to clarify the sometimes contradictory findings of research related to the role of misdemeanor policing and drug markets on homicide rates in NYC and to determine whether divergent trends within the city might help to shed light on the findings of multivariate studies that utilize more statistically rigorous techniques. As contemporary research begins to address the post-2000 crime decline in NYC (Rosenfeld and Fornango 2011; Zimring 2011), this report highlights the information that might be gained from conducting micro-level, geospatial analyses which can complement city level analyses (Zimring 2011) as well as multivariate precinct-level analyses (Rosenfeld and Fornango 2011).
MISDEMEANOR POLICING: THEORY AND RESEARCH
In 1993, the Mayor of New York City implemented a “quality of life” initiative discussed by Wilson and Kelling (1982). This set the stage for a law enforcement agenda based on the idea of “broken windows,” which posits that minor infractions such as graffiti, panhandling, and public urination create physical disorder which, when left unchecked, gives the impression that crime is tolerated. It follows that aggressively punishing minor crimes increases physical and social order and creates a perceived intolerance of crime, thereby lowering the rate of serious crime.
03 The goal of The analysis is To clarify The someTimes conTradicTory findings of research relaTed To The role of misdemeanor policing and drug markeTs on homicide raTes in nyc and To deTermine wheTher divergenT Trends wiThin The ciTy mighT help To shed lighT on The findings of mulTivariaTe sTudies ThaT uTilize more sTaTisTically rigorous Techniques.

While acting as the Chief of the NYC Transit Police, William Bratton used this policing approach to address crime levels in the NYC subway system with gains being greater than expected (Kelling and Bratton 1998). When Bratton became NYPD commissioner in 1994, he applied this form of policing city-wide. In addition to “broken windows” policing, this type of policing is now commonly known as misdemeanor policing, and also order maintenance policing, zero tolerance policing, and quality of life policing.
A significant body of research concerning misdemeanor policing has burgeoned in the past two decades and continues to examine the influence of this type of policing on crime in the 1990s and beyond. Using monthly data from 1974 to 1999, Corman and Mocan (2005) failed to find a relationship between misdemeanor policing and serious crimes including homicides. This study accounted for some relevant city-level covariates (i.e., felony arrests, police size, unemployment, minimum wage, and age composition), but only measured trends for the city as a whole and did not include a valid comparison group. To address this limitation, other studies used police precincts as the unit of analyses, thereby allowing for a within-city comparison. Kelling and Sousa (2001), for example, examined the impact of misdemeanor policing on violent crimes, including homicide, from 1989 to 1998. In their analysis, misdemeanor policing was significantly related to decreases in violent crime, after controlling for the population of young males, unemployment, and the prevalence of cocaine related incidents. However, this study compared “changes” in violent crimes to absolute levels of misdemeanor arrests, rather than “changes” in misdemeanor arrests.
Expanding on Kelling and Sousa’s (2001) methodology, Harcourt and Ludwig (2006) accounted for additional covariates including precinct-level poverty, additional socio-demographics, and levels of police personnel. When considering these additional factors, misdemeanor policing was no longer significantly related to violent crimes. The authors highlighted the need: (1) to account for relevant covariates, especially at the appropriate level of aggregation (i.e., precinct-level versus borough-level) and (2) to model “changes” (e.g., relative increases or decreases) in predictors and outcomes, rather than using absolute levels of either.
04

Rosenfeld and his colleagues (2007) examined the impact of order-maintenance policing (measured by arrest rates for misdemeanors and ordinance violations) on robbery and homicide rates from 1988 to 2001. The authors accounted for several socio-demographic factors (e.g., race/ethnicity, socioeconomic disadvantage, residential instability, and the percentage of immigrants among the local population) and crime-relevant covariates at the precinct level, including misdemeanor complaints, the number of police officers, the ratio of imprisonments per felony arrests, and deaths from cocaine overdoses. They found that order-maintenance policing explained four percent of the reduction in robbery rates and ten percent of the reduction in homicide rates. In their study, the impact of misdemeanor policing on robbery and homicide rates can be described as modest at best. The authors note that the decline in homicides and robberies started before order-maintenance policing was implemented in 1994 and would have, most likely, occurred without it. However, they believe that order-maintenance policing may have accelerated the rate of the decline.
Similarly, Messner and colleagues (2007) looked at the role of misdemeanor policing, socio-demographic variables (i.e., sex, age, race, and employment status) and several crime-relevant variables on changes in homicide and robbery rates in NYC from 1990 to 1999. Misdemeanor policing was influential in the decline of gun-related homicides and robbery, but not in non-gun homicides. These findings are congruent with other research indicating that trends in gun-related homicides are distinct relative to non-gun homicides (Fagan et al. 1998).
Using the same data, Cerdá and colleagues (2009; 2010) examined patterns of misdemeanor policing on gun-related homicides at an aggregate level and among three distinct age groups (ages 15-24, ages 25-34, and age 35 and older). Using change scores for both outcomes and predictors and after accounting for a host of socio-demographic and crime-relevant covariates at the precinct level, they found that misdemeanor policing was associated with a decrease in gun-related homicides at an aggregate level (Cerdá et al. 2009). When disaggregating the data by age, they found that misdemeanor policing was only influential in homicides involving victims age 35 and older. Initially, misdemeanor policing appeared to be relevant for victims between the ages of 25 and 34, but the effects dissipated
05

after accounting for additional covariates. The results indicated that misdemeanor policing did not influence the very type of crime that declined the most during the 1990s–homicides involving victims between the ages of 15 and 24.
Lastly, Chauhan and colleagues (2011), using the same approach as Cerdá and colleagues (2009; 2010) examined race/ethnic specific homicide trends among White, Black, and Hispanic victims. They found no relationship between misdemeanor policing and homicide rates across race/ethnicity. There are several possible explanations for the variation in research findings across demographic groups. First, Cerdá and colleagues used misdemeanor arrests and ordinance violations to capture misdemeanor policing whereas Chauhan and colleagues used only misdemeanor arrests. Second, to calculate stable homicide rates, Chauhan and colleagues considered only precincts with at least 5,000 persons of White, Black, or Hispanic race/ethnicity for their race/ethnic-specific models. As such, the precincts that were included in the analyses for Black homicides—the ones with the largest decline—generally had fewer homicides for younger age groups, an age group less likely to be influenced by misdemeanor policing. At an aggregate level, it seems that misdemeanor policing influences homicide rates, but the impact varies by type of homicide (i.e., gun-related), age, and race/ethnicity. The influence of misdemeanor policing may also vary by type of precinct.
DRUG MARKETS: THEORY AND RESEARCH
Goldstein, Brownstein, and Ryan (1992) suggest three ways in which drugs are related to homicides, specifically, and crime in general—psychopharmacologically (e.g., reduced inhibition), economically (e.g., money to purchase drugs) and systemically (e.g., illicit markets, robberies ending in death of drug dealers, territory disputes). Most homicides in the 1980s were systemic in nature and related to drug market activity rather than drug use (Goldstein et al. 1992; Tardiff and Gross 1986).
Blumstein (1995a; 1995b) proposes a systemic mechanism by which drug markets, particularly crack cocaine markets, may have contributed to the 1990s crime decline. The use of crack cocaine rapidly expanded from 1984 to 1986 (Johnson, Golub, and Fagan 1995) and competition for highly lucrative areas created turf wars
06

among crack cocaine dealers. These wars led to an acquisition of guns as a means of self-protection among both dealers and the broader community. Not surprisingly, this created an increase in gun-related crimes. However, as demand for crack cocaine decreased throughout the 1990s and drug markets began moving off the streets into more private spaces, crime began to decline. Notably, the transformation of drug markets was not specific to crack cocaine, as even heroin markets went from distribution in public spaces to underground places using delivery services, beeper services, and house connections located in less public, private spaces (Wendel and Curtis 2000).
Historically, crime increases were linked to drugs and/or drug markets. The NYC homicide peaks in 1972, 1979, and 1991 mirrored the drug epidemics of heroin, powder cocaine, and crack cocaine, respectively (Fagan et al. 1998; Johnson, Golub, and Dunlap 2006). Karmen (2000) argued that the decline in the crack epidemic was the crucial turning point for the decline in NYC homicides. Others argued that reductions in drug markets could not explain the larger than normal reductions in NYC crime, especially given that hospital discharge rates for cocaine overdoses were the same in the 1990s as the 2000s (Smith and Bratton 2001; Zimring 2006). Zimring (2011) reconciled these differences and stated that NYC won the war on drug violence but not the war on drugs. The crime drop coincided with a shift in the way drug markets operated rather than with a decline in drug use.
Several studies examined increases and decreases in drug use and drug markets and their association with violent crime. Cocaine was present in less than five percent of Manhattan homicide victims in 1981, whereas in 1991 and 1992, cocaine alone, or in conjunction with alcohol, was present in 72 percent of homicide victims (Tardiff and Gross 1986; Tardiff et al. 1995). By the late 1999s, homicide victims positive for cocaine fell by 13 percent (Tardiff et al. 2005).
07 hisTorically, crime increases were linked To drugs and/or drug markeTs. The nyc homicide peaks in 1972, 1979, and 1991 mirrored The drug epidemics of heroin, powder cocaine, and crack cocaine, respecTively.

Using a multivariate approach with city-wide data, Corman and Mocan (2000) found that greater drug use was associated with robbery and burglary rates, but not with rates of homicide. Similarly, Kelling and Sousa (2001) found no association between drug use and a composite measure of violent crime (i.e., murder, rape, robbery, and felonious assault). However, they used police precincts as the unit of analysis for crime outcomes but used borough-level hospital discharge data for drug use. Using proxies at the borough-level for specific precinct outcomes may be misleading. This is a major limitation that calls into question their null findings.
Rosenfeld and colleagues (2007) as well as Messner and colleagues (2007), relied on precinct-level indicators and reported that an increase in cocaine consumption (measured by accidental death positive for cocaine) resulted in higher homicide rates. In support of Blumstein’s (1995a; 1995b) hypothesis, Cerdá and colleagues (2010) found that higher cocaine consumption was related to higher homicide rates for victims between the ages of 15 and 24 and victims over age 35, with the influence being larger for 15–24 year-olds. Given that the decrease in homicide victimization was the most significant for victims between the ages of 15 and 24, their findings suggested that drug markets played a rather large role in homicide decline. Curtis (1988) described this trend using ethnographic data. He reported how younger cohorts in NYC who witnessed and experienced the devastating consequences of drugs (particularly crack cocaine) on their own families and neighborhoods subsequently rejected the use of hard drugs. These younger New Yorkers appeared to favor marijuana (Johnson et al. 2006), which has a more calming effect and fewer addictive properties.
Chauhan and colleagues (2011) found an association between cocaine consumption (measured by accidental deaths occurring with toxicology tests that were positive for cocaine) and Black homicide victims, but no such relationship for White and Hispanic victims. This is consistent with the notion that illegal drug markets had disproportionate effects on Black Americans in the 1990s (Blumstein 1995a and 1995b; Blumstein and Rosenfeld 1998; SAMHSA 1995). On the other hand, drug arrest rates were not associated with homicide rates across categories of race and ethnicity. Cocaine consumption and drug arrest rates may capture different constructs. The theoretically congruent results for cocaine consumption suggest that this might be a powerful indicator of drug activity relative to drug arrests, which may be less relevant to drug activity and more closely related to law enforcement of drug activity.
08

Overall, the movement of the distribution of illicit drugs, particularly crack cocaine, from public drug markets to private, more discreet selling appears to be associated with decreasing homicides. The influence seems to be the greatest for youth between ages 15 and 24 and for Blacks – the demographic groups most likely to be victims of homicide in the 1990s. The transformation of youth culture and reduced use of crack among younger generations may have decreased the influence of crack cocaine markets, but the relationship between drug markets and homicides in different areas of the city is unknown.
Crime rates undoubtedly declined in the 1990s, however, research on misdemeanor policing and drug markets does not identify clear associations between these factors and the crime drop. This report explores these multivariate relationships and uses micro level, geospatial data to examine the relationships between these two factors and their associations with NYC homicides at the local precinct level. The analysis is limited to homicides because they are measured most credibly and reliably (Lauristen and Schuam 2005; Zimring 2011).
METHODS | Data for this report were collected from three sources: the Office of the Chief Medical Examiner (OCME) of NYC, the NYC Police Department (NYPD) and New York State Department of Criminal Justice Services (DCJS). Police precincts served as the unit of analysis. Given that policing strategies are managed at the precinct level, this is the most suitable unit for capturing the impact of police enforcement practices. New York City has 76 police precincts. In this analysis, precincts 33 and 34 are treated as one precinct (they were split in 1994). In addition, the Central Park Precinct (Precinct 22) is excluded because it is non-residential (Cerdá et al. 2009; 2010; Chauhan et al. 2011; Messner et al. 2007).
HOMICIDE. All cases of homicides from 1990 to 1999 were identified through standard manual review and abstraction of OCME medical files in all cases of deaths attributed to unnatural causes. The OCME data include all homicide deaths in NYC, thereby limiting sampling bias. The same person held the office of NYC Chief Medical Examiner throughout the 1990s, and the classification of cases, toxicology, policies, and
09

other aspects of the OCME remained the same over the study period. The OCME investigators used the decedent’s medical history, the circumstances and environment of the death, autopsy findings, and laboratory data, to attribute the cause of death to each case reviewed. Data regarding cause of death, circumstances of death (including use of a gun), and toxicology were collected from the OCME files by trained abstractors using standard protocol and data collection forms. Annual gun-related homicide rates (per 100,000 populations) were calculated using data from the 1990 and 2000 Census. The total annual precinct population was estimated through linear interpolation for the years between Census population estimates of 1990 and 2000 (Cerdá et al. 2009; 2010; Chauhan et al. 2011; Messner et al. 2007).
This report focuses on incidents of gun-related homicides because the two types of homicides — gun vs. non-gun — demonstrate distinctive trends over the decade (Fagan et al. 1998; Messner et al. 2007) and both misdemeanor policing and drug markets are empirically linked to gun-related, rather than non-gun homicides (Blumstein 1995a; Blumstein and Rosenfeld 1998; Messner et al. 2007).
MISDEMEANOR POLICING. The NYPD provided data on all misdemeanor arrests by precinct from 1990 to 1999 to represent misdemeanor policing. This report calculates arrest rates per 10,000 people.
DRUG MARKETS. To capture drug activity, two different indicators are used — cocaine consumption and drug arrests.
10 This reporT focuses on incidenTs of gun-relaTed homicides because The Two Types of homicides — gun vs. non-gun — demonsTraTe disTincTive Trends over The decade and boTh misdemeanor policing and drug markeTs are empirically linked To gun-relaTed, raTher Than non-gun homicides.

Using the OCME data, a proxy for cocaine consumption is estimated as the annual percentage of accidental deaths with toxicology results positive for cocaine from 1990 to 1999 (Cerdá et al. 2009; 2010; Chauhan et al. 2011; Messner et al. 2007).
For drug arrests, New York State Criminal Justice Services (DCJS) data are used to calculate drug arrests per 10,000 people from 1990 to 1999 based on the number of arrests for controlled illicit substances per precinct (Ousey and Lee 2004; Storm and MacDonald 2007). To capture more severe drug activity such as crack cocaine markets, marijuana arrests are excluded from the analyses.
RESULTS | GUN-RELATED HOMICIDES
As shown in Figure 1, New York City experienced a steep decline in gun-related homicides from 1990 to 1999 (Fagan et al. 1998; Karmen 2000; Zimring 2006). Consistent with previous research and data from official records (e.g., NYPD homicide data), homicide rates peaked in 1991 with a mean of 22 homicides per 100,000 people, and fell to a low of slightly more than 4 per 100,000 in 1998. The decade ended with the homicide rate just under 5 (4.75) per 100,000 people.
While homicide rates declined throughout the city, a small number of NYPD precincts helped to drive city-wide homicide rates throughout the decade. Figure 2 represents gun-related homicides at three distinct time points – 1990, 1995, and 1999. In 1990, 19 precincts (23 percent) experienced a homicide rate of more than 31 victims per 100,000 people. Concentrations of gun-related homicides occurred in the Northern Manhattan, Bronx and the Flatbush/Crown Heights areas of Brooklyn. Most areas in Manhattan did not experience such high homicide rates.
By 1995, rates decreased significantly, with only four precincts experiencing gun-related homicide rates of 31 or more per 100,000 people. In some precincts, especially in the Bronx, Brooklyn, and Manhattan, homicide rates fell by approximately 50 percent. By the end of the decade, no precincts had gun-related homicide rates of 31
11

or more per 100,000 people. In fact, all but two precincts experienced gun-related homicide rates lower than 15 per 100,000 people. Rates in all areas of Manhattan and the Bronx were below this threshold.
Despite the drop in homicides, three precincts maintained high homicide rates throughout the decade - Ocean Hill/Brownsville in Brooklyn, East Bronx and West Hamilton Heights in Manhattan (Table 1). Between 1990 and 1999, nine precincts experienced decreases in gun-related homicides of at least 40 per 100,000 people. Large decreases were observed in: (1) Mott Haven/Melrose, (2) Harlem, (3) West Hamilton Heights, (4) Bruckner/Bridgewater Street, (5) East Bronx, (6) Belmont, (7) Morrisanna, (8) West Soho/Battery Park, and (9) Bushwick (see Appendix A).
Three precincts did not follow the dominant trend. Homicide rates increased in Richmond Hill (0.88 in 1990; 1.40 in 1999), Midtown East (2.73 in 1990; 3.94 in 1999) and Chelsea (2.50 in 1990; 4.99 in 1999). These increases should be interpreted with caution, however, given that such low base rates can change more quickly and be more unstable in relative terms.
12
0
5
10
15
20
25
1990 1991 1992 1993 1994 1995 1996 1997 1998 1999
Homicides per 100,000 residents
Figure 1
Gun-Related Homcides in New York City Plummeted in the 1990s.
Source: New York City Office of the Chief Medical Examiner (OCME).

13 Figure 2
Gun-Related Homicides by New York Police Department (NYPD) Precinct.
0–15 31–4516–30 46–60 61–75
Legend: Gun-Related Homcides per 100,000 Residents
Source: New York City Office of the Chief Medical Examiner (OCME).
Table 1
Top 10 NYPD Precincts for Homicide Rates in 1990, 1995 and 1999.
Source: New York City Office of the Chief Medical Examiner (OCME).
Precinct Neighborhood 7 Lower East Side
25 Marcus Garvey
28 Harlem
30 West Hamilton Heights
40 Mott Haven/Melrose
41 Bruckner/Bridgewater Street
42 Morrisanna
44 East Bronx
46 West Bronx
47 North Bronx
73 Ocean Hill/Brownsville
75 East New York
77 North Crown Heights
79 West Bedford Stuyvesant
81 East Bedford Stuyvesant
83 Bushwick
88 Clinton Hill/Fort Greene
23158
4
67
10
9
351
68
7
10
9
42
3
610
9
158
42
7
Rank Among the Top 10 Precincts
1990 19991995

MISDEMEANOR POLICING AND HOMICIDE RATES
Similar to the observed variation in homicide rates, precincts varied considerably in the rate and growth of misdemeanor arrests during the decade. Figure 3 illustrates gun-related homicides per 100,000 people for the entire city (i.e., 74 precincts) and each precinct’s respective rate of misdemeanor arrests per 10,000 in 1990, 1995, and 1999. While gun-related homicides were at their highest in the earlier part of the 1990s, misdemeanor arrest rates were at their lowest. After implementing the quality of life initiative, misdemeanor policing increased with a peak in 1996 (515 misdemeanor arrests per 10,000 people) and then decreased slightly at the end of the decade (465 misdemeanor arrests per 10,000 people).
Several notable precinct-level trends were observed in misdemeanor arrests and homicide rates. By 1999 misdemeanor arrests in the vast majority of precincts rose from 1995, and at times, rates tripled from 1990. The highest levels of misdemeanor arrests occurred in Manhattan, regardless of homicide rates. Indeed, Midtown South and Midtown North were consistently the top two precincts for misdemeanor arrests (see Table 2). In 1995 three of the top ten homicide precincts also had the highest misdemeanor arrests (i.e., Marcus Garvey, Harlem, and Ocean Hill/Brownsville). The same pattern was observed in four precincts in 1999 (i.e., Lower East Side, East New York, West Hamilton Heights, and Mott Haven/Melrose). This suggests that there are still six to seven precincts that had high levels of homicides but did not have equally high rates of misdemeanor arrests.
Although not reflected in absolute numbers, the greatest increases in misdemeanor arrests from 1990 to 1999 occurred in Marcus Garvey followed by West Hamilton Heights, Wave Hill/Van Corldandt, Mott Haven/Melrose and Bruckner/Bridgewater (See Appendix A). Three of these five precincts experienced significant reductions in homicides (40 or more deaths per 100,000 from 1990 to 1999) and two did not. Lastly, from 1990 to 1999, Bushwick, East Bronx and West Soho/Battery Park reported decreases in misdemeanor arrests as well as significant reductions in homicide rates.
In sum, the NYC precincts with the highest homicide rates did not necessarily have the highest levels of misdemeanor arrests, either in absolute levels or in relative increases. Similarly, precincts that
14
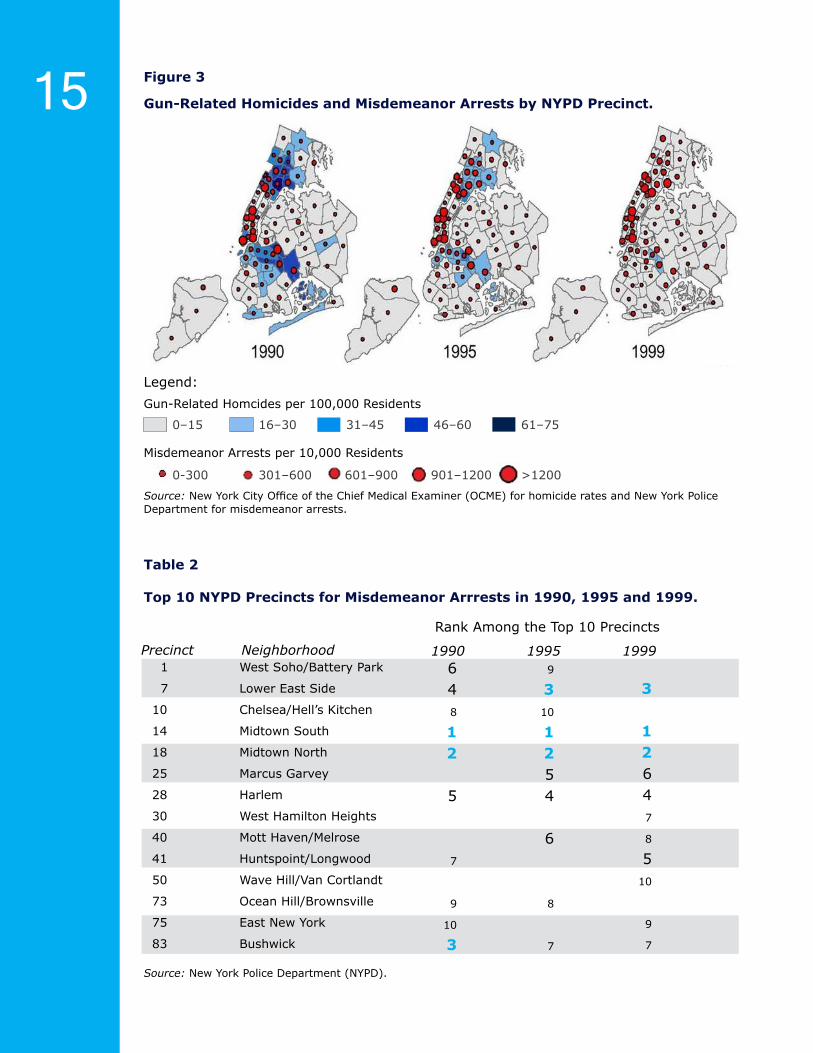
15 Figure 3
Gun-Related Homicides and Misdemeanor Arrests by NYPD Precinct.
Source: New York City Office of the Chief Medical Examiner (OCME) for homicide rates and New York Police Department for misdemeanor arrests.
Misdemeanor Arrests per 10,000 Residents
0-300 601–900301–600 901–1200 >1200
Table 2
Top 10 NYPD Precincts for Misdemeanor Arrrests in 1990, 1995 and 1999.
Source: New York Police Department (NYPD).
Precinct Neighborhood 1 West Soho/Battery Park
7 Lower East Side
10 Chelsea/Hell’s Kitchen
14 Midtown South
18 Midtown North
25 Marcus Garvey
28 Harlem
30 West Hamilton Heights
40 Mott Haven/Melrose
41 Huntspoint/Longwood
50 Wave Hill/Van Cortlandt
73 Ocean Hill/Brownsville
75 East New York
83 Bushwick
648
12
5
7
9
10
3
9
310
12 54
6
8
7
Rank Among the Top 10 Precincts
1990 19991995
3
12 647
8
510
9
7
0–15 31–4516–30 46–60 61–75
Legend: Gun-Related Homcides per 100,000 Residents

experienced significant reductions in homicides did not necessarily report increasing misdemeanor arrests. Some areas reported both falling rates of arrests and declining homicides.
DRUG MARKETS
The percentage of accidental deaths involving toxicology reports that are positive for cocaine is often used as an indicator of illegal drug markets. At a city-wide level, the percentage of accidental deaths positive for cocaine went from an all-time high of 11 percent in 1993 to a low of 5 percent in 1999 — a reduction of more than 50 percent. As shown in Figure 4, no precincts experienced more than 31 percent of accidental deaths positive for cocaine in 1991. The deaths that did occur were not concentrated in one area but were dispersed across the five boroughs. In 1995, six precincts (i.e., West Bronx, Marcus Garvey, Manhattanville, Harlem, Midtown South and East Hamilton Heights) had rates above 31 percent and these deaths were predominantly in Northern Manhattan and West Bronx. By 1999, however, cocaine consumption was drastically lower throughout the city, with 46 precincts experiencing no such deaths positive for cocaine consumption. The outlier was Marcus Garvey, where 66 percent of all accidental deaths were positive for cocaine toxicology. Several Bronx precincts continued to report higher rates of accidental deaths with positive cocaine toxicology as compared to the rest of NYC, however, these rates were somewhat tamed relative to 1995. Only the West Bronx remained in the top ten precincts highest for cocaine consumption throughout the decade.
Three of the top ten homicide precincts also had the highest cocaine consumption in 1995 (i.e., Marcus Garvey, Harlem, and West Bronx; see Table 3). Only West Hamilton Heights had high rates of cocaine consumption and homicide rates by 1999. Five precincts (i.e., Marcus Garvey, Rockaway, East Bronx, West Hamilton Heights, and South Crown Heights; see Appendix A) experienced relative increases of more than 10 percent in cocaine consumption from 1990 to 1999. Of these, the East Bronx and West Hamilton Heights experienced reductions in homicide rates. In other words, drug activity increased even as homicide rates were declining. Harlem, on the other hand, experienced the most dramatic decline in cocaine consumption (27%) while reporting the second highest reduction in homicide rates (see Appendix A). Morisanna, Belmont, and Mott Haven/Melrose followed the same pattern, with the largest reductions in cocaine-positive accidental deaths and the largest reductions in homicide rates.
16

Drug arrest rates, another indicator of drug market activity, followed a similar pattern to misdemeanor arrests. The arrest rate for drugs peaked in 1995 at 140 per 10,000 people, growing from a low of 90 arrests per 10,000 people in 1992. Rates at the start of the decade (125 per 10,000) and the end of the decade (112 per 10,000) were remarkably similar. As shown in Figure 5, six precincts (i.e., Lower East Side, Midtown North, Marcus Garvey, Midtown South, Harlem, and Mott Haven/Melrose) had more than 400 drug arrests per 10,000 in 1995; and only two were experiencing these high rates of arrest in 1999 (West Hamilton Heights and Harlem; see Table 4). Across the decade, the Lower East Side, Midtown South, Marcus Garvey, Harlem, and West Hamilton Heights had consistently high drug arrest rates (see Table 4).
In 1995, four of the top ten precincts for drug arrests were also in the top ten precincts for homicide (i.e., Marcus Garvey, Harlem, West Hamilton Heights, and West Bronx). Three precincts followed this pattern in 1999 (i.e., West Hamilton Heights, and Lower East Side). In terms of changes, only East Bronx demonstrated the theoretically expected pattern — a decrease in drug arrests and a decrease in homicide rates. In general, changes in rates were less consistent than absolute numbers.
17 Figure 4
Gun-Related Homicides and Accidental Deaths Positive for Cocaine by Precinct.
Source: New York City Office of the Chief Medical Examiner (OCME).
Percent of Accidental Deaths Positive for Cocaine Toxicology0-15 31–4516–30 46–60 61-75
0–15 31–4516–30 46–60 61–75
Legend: Gun-Related Homcides per 100,000 Residents

18 Table 3
Top 10 NYPD Precincts for Cocaine Consumption in 1990, 1995 and 1999.
Source: New York Police Department (NYPD).
Precinct Neighborhood
Rank Among the Top 10 Precincts
1990 19991995 5 Chinatown
7 Lower East Side
14 Midtown South
24 Upper West Side
25 Marcus Garvey
26 Manhattanville
28 Harlem
30 West Hamilton Heights
32 East Hamilton Heights
34 Washington Heights
40 Mott Haven/Melrose
42 Morrisanna
43 South Bronx
44 East Bronx
46 West Bronx
47 North Bronx
69 Canarsie
71 South Crown Heights
77 North Crown Heights
88 Clinton Hill/Fort Greene
100 Rockaway
103 Jamaica
2
139
4
6
5
7
8
10
10
5
234
6
17
9
8
5
7
1
8
10
4
32
9
6

19 Figure 5
Gun-Related Homicides and Drug Arrests, by NYPD Precinct.
Source: New York City Office of the Chief Medical Examiner (OCME) for homicide rates and New York State Department of Criminal Justice Services for drug arrests.
Table 4
Top 10 NYPD Precincts for Drug Arrests in 1990, 1995 and 1999.
Source: New York State Department of Criminal Justice Services (DCJS).
Precinct Neighborhood 5 Chinatown
7 Lower East Side
14 Midtown South
18 Midtown North
23 Upper East Side/East Harlem
25 Marcus Garvey
28 Harlem
30 West Hamilton Heights
32 East Hamilton Heights
40 Mott Haven/Melrose
41 Huntspoint/Longwood
44 East Bronx
46 West Bronx
48 Belmont
9
124
358
610
7
Rank Among the Top 10 Precincts
1990 19991995
1427
358
69
10
48
32157
9
10
6
Drug Arrests per 10,000 Residents
0-100 201–300101–200 301–400 >400
0–15 31–4516–30 46–60 61–75
Legend: Gun-Related Homcides per 100,000 Residents
19

CONCLUSIONS | The City of New York experienced drastic reductions in homicide during the 1990s. The causes of the decline are still debated. Two potential influences—increases in misdemeanor policing and the declining market for crack cocaine—have received considerable theoretical and empirical attention in relation to the decline. This report presents geospatial analyses and attempts to disentangle the heterogeneity that exists within NYC for these two factors. The analysis focuses on precincts at the extreme end of the continuum for variables of interest to illustrate within-city differences. Results are mixed, demonstrating both theoretically expected and unexpected patterns in relation to homicide decline. The analyses further suggest that one quarter of NYPD precincts were responsible for driving the overall decrease in homicide rates. Examining homicide trends for the entire city may mask substantial within city differences.
NYC police precincts experienced significant variations in absolute and relative increases in misdemeanor policing over the decade of the 1990s. The variations were not consistent with expected changes in homicide. There may be several potential explanations for the difference in precinct-level trends. For example, the quality-of-life initiative, though city-wide, may have been implemented in varying degrees with some high-crime areas receiving a higher “dose” of the initiative than other high-crime areas. In addition, higher rates of misdemeanor arrests may have curbed higher level crimes in some precincts, but this association did not occur in other areas. Finally, other serious crimes (e.g., robbery) may have occurred in selected precincts without the expected level of lesser infractions. That is, more people may have been arrested for felonies rather than misdemeanors.
These results shed light on previous studies. The modest relationship between misdemeanor policing and homicide rates may be explained by the fact that not all high crime areas uniformly received misdemeanor policing. This further explains why effects dissipate when broken down by age and race. Moreover, some precincts that did not experience a significant “dose” of misdemeanor policing still experienced significant reductions in homicides, which suggests that other factors were influential in lowering crime rates. Thus,
20

multivariate models must include other relevant covariates (e.g., cocaine consumption). This would be consistent with previous research suggesting that crime was on the decline before the implementation of misdemeanor policing (Rosenfeld et al. 2007) and that New York City’s crime decline was similar to changes in other geographical locations that did not employ such policing techniques (Beckett and Godoy 2010; Joanes 2000; Karmen 2000).
With regard to drug markets, two proxy measures in this study— drug arrests and cocaine-positive accidental deaths—seem to capture different aspects of drug market activity and demonstrate different relationships. Previous studies using precinct-level analyses confirm the association between cocaine consumption and gun related homicides, Black homicides and youth homicides (Cerdá et al. 2010; Chauhan et al. 2011; Messner et al. 2007; Rosenfeld et al. 2007). As with misdemeanor arrests, some precincts are consistent with the multivariate findings, while other are not. Homicide patterns are not always consistent with the expected influences of cocaine consumption. Thus, other social processes may have been instrumental in lowering homicides. Lastly, although cocaine consumption behaved in theoretically expected ways in some precincts in this analysis and in previous studies, it may still be a poor indicator for crack cocaine consumption and crack cocaine drug markets.
With regard to drug arrests, the findings of this study are not consistent with theory regarding drug market activity. This may be because drug arrests are more linked to drug policing than actual drug market activity. Drug markets likely influence policing and vice versa in several precincts, and drug arrest rates may be more sensitive to this relationship relative to cocaine consumption.
Overall, these results suggest, as with the aggregated level analyses, that there is no single causal mechanism responsible for the homicide decline in NYC. The results expand on previous work, however, and indicate that certain factors were more influential in some precincts than in others. Misdemeanor policing, for instance, appeared to play a more prominent role in the homicide decline for West Hamilton Heights, while cocaine consumption likely did not, given that it actually increased across the decade for this precinct. Conversely, Harlem was likely more influenced by drug activity than misdemeanor policing. Lastly, Belmont and Mott Haven/Melrose were likely influenced by both factors.
21

While these results in no way supersede multivariate models that account for demographic and criminogenic covariates, they provide greater insight into the sometimes contradictory results found in the research literature. The results highlight that city-level trends can lead to biased results given that they often mask within-city differences. Moreover, a few precincts may be driving the city-wide and multivariate results (i.e., Harlem, Mott Haven/Melrose and Marcus Garvey). Future multivariate research should test whether the results are sustained when highly influential precincts (i.e., outliers) are removed from causal models. Indeed as research progresses on New York’s post-2000 crime decline (Rosenfeld and Fornango 2011; Zimring 2011), investigators should examine whether their results are driven by a few select precincts. Disentangling within-city differences may provide critical insight into the effects of precinct-specific mechanisms and shed light on the complex social processes that affect homicide rates specifically and crime generally.
22

REFERENCES |
Baumer, Eric, Janet L. Lauristen, Richard Rosenfeld, and Richard Wright (1998). The influence of crack cocaine on robbery, burglary, and homicide rates: A cross-city, longitudinal analysis. Journal of Research on Crime and Delinquency, 35(3), 316-340.
Beckett, Katherine and Angelina Godoy (2010). A tale of two cities: A comparative analysis of quality of life initiatives in New York and Bogotá. Urban Studies, 47(2), 277-301.
Blumstein, Alfred (1995a). Violence by young people: Why the deadly nexus? National Institute of Justice Journal, 229, 2-9.
Blumstein, Alfred (1995b). Youth violence, guns, and the illicit-drug industry. Journal of Criminal Law and Criminology, 86(1), 10-36.
Blumstein, Alfred, Frederick P. Rivara, and Richard Rosenfeld (2000). The rise and decline of homicide – and why. Annual Review of Public Health, 21, 505-541.
Blumstein, Alfred, and Richard Rosenfeld (1998). Explaining recent trends in U.S. homicide rates. Journal of Criminal Law and Criminology, 88(4), 1175-1216.
Blumstein, Alfred, and Joel Wallman (Editors) (2006). The Crime Drop in America (Revised Edition). New York, NY: Cambridge University Press.
Cerdá, Magdalena, Steven F. Messner, Melissa Tracy, David Vlahov, Emily Goldmann, Kenneth Tardiff, and Sandro Galea (2010). Investigating the effect of social changes on age-specific gun-related homicide rates in New York City during the 1990s. American Journal of Public Health, 100(6), 1107-1115.
Cerdá, Magdalena, Melissa Tracy, Steven F. Messner, David Vlahov, Kenneth Tardiff, and Sandro Galea (2009). Misdemeanor policing, physical disorder, and gun-related homicide: A spatial analytic test of “broken windows” theory. Epidemiology, 20(4), 533-541.
Chauhan, Preeti, Magdalena Cerdá, Steven F. Messner, Melissa Tracy, Kenneth Tardiff, and Sandro Galea (2011). Race/Ethnic-specific homicide rates in New York City: Evaluating the impact of broken windows policing and crack cocaine markets. Homicide Studies, 15(3), 268-290.
23

Corman, Hope, and Naci Mocan. (2005). Carrots, sticks and broken windows. Journal of Law and Economics, 48, 235-266.
Corman, Hope, and Naci Mocan (2000). A time-series analysis of crime, deterrence, and drug abuse in New York City. American Economic Review, 90, 584-604.
Curtis, Richard (1998). The improbable transformation of inner-city neighborhoods: Crime, violence, drugs, and youth in the 1990s. Journal of Criminal Law and Criminology, 88, 1233-1276.
Fagan, Jeffrey, Frank E. Zimring, and June Kim (1998). Declining homicide in New York City: a tale of two trends. Journal of Criminal Law & Criminology, 88, 1277-1324.
Goldstein, Paul J., Henry H. Brownstein, and Patrick J. Ryan (1992). Drug-related homicide in New York: 1984-1988. Crime & Delinquency, 38, 459-476.
Harcourt, Bernard E., and Jens Ludwig (2006). Broken windows: New evidence from New York City and a five city social experiment. University of Chicago Law Review, 73, 271-320.
Joanes, Ana (2000). Does the New York City Police Department deserve credit for the decline in the New York City’s homicide rates? A cross-city comparison of policing strategies and homicide rates. Columbia Journal of Law and Social Problems, 33, 265-311.
Johnson, Bruce D., Andrew Golub, and Eloise Dunlap (2006). The rise and decline of hard drugs, drug markets, and violence in inner-city New York. In Alfred Blumstein and Joel Wallman (Editors), The Crime Drop in America (pp. 164-206). New York, NY: Cambridge University Press.
Johnson, Bruce D., Andrew Golub, and Jeffrey Fagan. (1995). Careers in crack, drug use, drug distribution, and nondrug criminality. Crime & Delinquency, 41, 275-295.
Karmen, Andrew. (2000). New York murder mystery: the true story behind the crime crash of the 1990s. New York, NY: NYU Press.
Kelling, George L., and William J. Bratton (1998). Declining crimes rates: Insiders’ view of the New York City story. Journal of Criminal Law and Criminology, 88, 1217-1232.
24

Kelling, George L., and William H. Sousa (2001). Do police matter? An analysis of the impact of New York City’s police reform. Manhattan Institute Civic Report, 22, 1-20.
Lauritsen, Janet L., and Robin J. Schaum (2005). Crime and victimization in the three largest metropolitan areas, 1980-98 (Technical Report 208075).
Messner, Steven F., Sandro Galea, Kenneth J. Tardiff, Melissa Tracy, Angela Bucciaelli, Tinka M. Piper, Victoria Frye, and David Vlahov (2007). Policing, drugs, and the homicide decline in the New York City in the 1990s. Criminology, 45, 385-410.
Ousey, Graham C., and Matthew R. Lee (2004). Investigating the connections between race, illicit drug markets, and lethal violence, 1984-1997. Journal of Research on Crime and Delinquency, 41, 352-383.
Parker, Robert N., and Randi S. Cartmill (1998). Alcohol and homicide in the United States 1934-1995: Or one reason why U.S. rates of violence may be going down. Journal of Criminal Law and Criminology, 88, 1369-1398.
Parker, Robert N., and Linda-Anne Rebhun (1995). Alcohol & Homicide: A Deadly Combination of Two American Traditions. Albany, NY: State University of New York Press.
Rosenfeld, Richard (2006). Patterns in adult crime: 1980-1995. In Alfred Blumstein and Joel Wallman (Editors), The Crime Drop in America (pp. 130-136). New York, NY: Cambridge University Press.
Rosenfeld, Richard and Robert Fornango (2011, September). Assessing the impact of stop, question, and frisk on crime rates. Presented at the Understanding the Crime Decline in New York City Conference. New York, NY: John Jay College of Criminal Justice.
Rosenfeld, Richard, Robert Fornango, and Eric Baumer (2005). Did CEASEFIRE COMPSTAT, and EXILE Reduce Homicide? Criminology & Public Policy, 4, 419-449.
Rosenfeld, R., Robert Fornango, and Andres R. Rengifo (2007). The impact of order-maintenance policing on New York City Homicide and Robbery Rates: 1988-2001. Criminology, 45, 355-384.
Spelman, William (2006). The limited importance of prison expansion. In Alfred Blumstein and Joel Wallman (Editors), The Crime Drop in America (pp. 97-129). New York, NY: Cambridge University Press.
25

Smith, Dennis C., and William J. Bratton (2001). Performance management in New York City: Compstat and the revolution in police management. In Dall W. Forsythe (Editor), Quicker, Better, Cheaper: Managing Performance in American Government (pp. 453-482). Albany, NY: Rockefeller Institute Press.
Storm, Kevin J., and John M. MacDonald (2007). The influence of social and economic disadvantage on racial patterns in youth homicide over time. Homicide Studies, 11, 50-69.
Substance Abuse and Mental Health Services Administration (SAMHSA) (1995).Office of Applied Studies, National Household Survey on Drug Abuse Advance Report #18.
Tardiff, Kenneth and Elliot M. Gross (1986). Homicides in New York City. Bulletin of the New York Academy of Medicine, 62, 413.426.
Tardiff, Kenneth, Peter M. Marzuk, Andrew C. Leon, Charles S. Hirsch, Marina Stajic, Laura Portera, and Ancy Hartwell. (1995). A profile of homicides on the streets and in the homes of New York City. Public Health Reports, 110(1), 13-17.
Tardiff, Kenneth, Zachary Wallace, Melissa Tracy, Tinka Markham Piper, David Vlahov, and Sandro Galea. (2005). Drug and Alcohol Use as Determinants of New York City Homicide Trends from 1990 to 1998. Journal of Forensic Science, 50, 1-5.
Travis, Jeremy, and Michelle Waul (2002). Reflections on the crime decline: Lessons for the future? Proceedings from the Urban Institute Crime Decline Forum. Washington, DC: Urban Institute.
Wendel, Travis, and Richard Curtis (2000). The heraldry of heroin: “Dope stamps” and the dynamics of drug markets in New York City. Journal of Drug Issues, 30(2), 225-259.
Wilson, James Q., and George L. Kelling (1982). Broken windows: The police and neighborhood safety. Atlantic Monthly, 249, 29-38.
Zimring, Franklin E. (2006). The Great American Crime Decline. New York, NY: Oxford University Press.
Zimring, Franklin E. (2011). The City that Became Safe: New York’s Lessons for Urban Crime and its Control. New York, NY: Oxford University Press.
26

27Homicides1. Mott Haven/Melrose (40th) 2. Harlem (28th) 3. West Hamilton Heights (30th) 4. Bruckner/Bridgewater Street (41st) 5. East Bronx (44th) 6. Belmont (48th) 7. Morrisanna (42nd) 8. West Soho/Battery Park (1st) 9. Bushwick (83rd) 10. West Bronx (46th)
Appendix A
NYPD Precincts with the Most Change in Variables of Interest: 1990-1999.
Misdemeanor Arrests1. Marcus Garvey (25th)2. West Hamilton Heights (30th) 3. Wave Hill/Van Cortlandt (50th)4. Mott Haven/Melrose (40th) 5. Bruckner/Bridgewater Street (41st) 6. Belmont (48th) 7. East Hamilton Heights (32nd) 8. Washington Heights (34th)9. Clinton Hill/Fort Green (88th)10. Astoria (114th)
Decreased Cocaine Consumption1. Harlem (28th)2. Canarsie (69th) 3. Crown Heights (77th)4. Morrisanna (42nd)5. Jamaica (103rd) 6. Midtown North (18th) 7. Belmont (48th) 8. Marine Park (63rd) 9. Park Slope (78th) 10. Mott Haven/Melrose (40th)
Decreased Drug Arrests1. Lower East Side (7th) 2. Midtown South (14th) 3. Chinatown (5th) 4. Midtown North (18th)5. East Bronx (44th) 6. East Village/Alphabet City (9th)7. East Elmhurst (115th) 8. Jamaica (103rd) 9. South Ozone Park/Jamaica (113th)10. Central Brooklyn (70th)

Research and Evaluation CenterA Member of the Research Consortium of
John Jay College of Criminal Justice, City of University of New York555 West 57th Street , Suite 605 | New York, NY 10019
212-237-8302 | www.johnjayresearch.org | [email protected]
The Research and Evaluation Center at John Jay College of Criminal Justice, City University of New York, is an applied research organization established in 1975 to provide members of the academic community of John Jay College with opportunities to respond to the research needs of justice practitioners in New York City, New York State, and the nation. The Center operates under the supervision of the Office for the Advancement of Research at John Jay College of Criminal Justice.