Embed Size (px)
Citation preview
URBP/ENVS-179 and URBP-278: Introduction to GIS Applications for Urban Planning, Spring Semester 2012 H O M E W O R K A Page 1 of 27
Homework A What is GIS? What is ArcGIS?
Exploring Facets of Urban Sustainability with Web-Based Maps and ArGIS.com
URBP/ENVS-179 and URBP-278: Introduction to GIS Applications for Urban Planning | Spring Semester 2012
This assignment has two parts, and the second part has a number of subsections. Please be sure to skim the entire assignment before proceeding. Thanks!
Learning Objectives By completing this assignment, students will be able to:
Define Geographic Information Systems (GIS) and the components of ArcGIS 10 software
Explain how maps convey geographic information
List and describe core terms associated with ArcGIS 10 software
Clearly define some of the facets of urban sustainability including access to healthy food, income disparities, unemployment rates, and access to healthcare providers
Describe examples of solutions being undertaken by contemporary cities that have embraced the principles of urban sustainability
Demonstrate effective use of ArcGIS.com, a free, browser-based mapping application, for the exploration of urban sustainability by contrasting demographic and mobility qualities of urban neighborhoods in San Francisco
Materials Needed Mac or PC workstation with internet connectivity (ideally, broadband speed) and video/audio capabilities
Web browser (e.g. Internet Explorer, Safari, Chrome) Ability to print to a color printer
Due Date: February 13, 2012 at 4:00 p.m.
Materials to Submit on the Due Date Cover sheet with your name, assignment number and title, due date, course number, and instructor name.
The cover may include a graphic (drawing, photo, sketch, etc.) that illustrates the theme of the assignment. Well-written and proofread answers to the grey-boxed Part 1 questions listed on page 3.
Well-written and proofread answers to the grey-boxed Part 2 questions listed on pages 8-27. Grading Criteria
Content and writing quality of answers to Part 1 questions (20 points) Content and writing quality of answers to Part 2 questions (70 points) Overall quality of assignment submission (see “Model Homework Assignment” on course wiki) (10 points)
Assignment Part 1: Foundational Reading Start by reading a few of the topics contained within the web-based ArcGIS Resource Center.
To access the Help files, open a web browser Use Google to search for “ArcGIS 10 Desktop Help” Click on the first link in the Google search results, then expand the “ArcGIS 10 Desktop Help” link, as shown
below1.
1 A similar Help system is accessible from within the ArcGIS 10 software – the advantage of the web-based version is that it is frequently updated by Esri staff
URBP/ENVS-179 and URBP-278: Introduction to GIS Applications for Urban Planning, Spring Semester 2012 H O M E W O R K A
Page 2 of 27
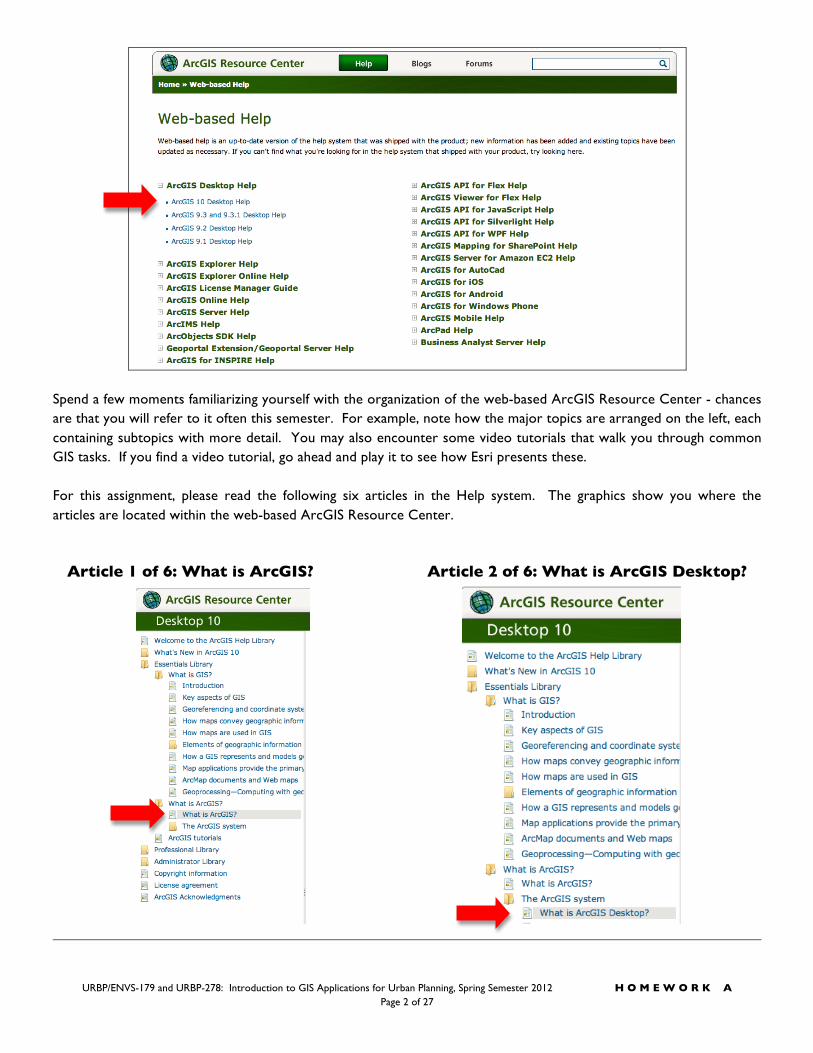
Spend a few moments familiarizing yourself with the organization of the web-based ArcGIS Resource Center - chances are that you will refer to it often this semester. For example, note how the major topics are arranged on the left, each containing subtopics with more detail. You may also encounter some video tutorials that walk you through common GIS tasks. If you find a video tutorial, go ahead and play it to see how Esri presents these. For this assignment, please read the following six articles in the Help system. The graphics show you where the articles are located within the web-based ArcGIS Resource Center.
Article 1 of 6: What is ArcGIS? Article 2 of 6: What is ArcGIS Desktop?
URBP/ENVS-179 and URBP-278: Introduction to GIS Applications for Urban Planning, Spring Semester 2012 H O M E W O R K A Page 3 of 27
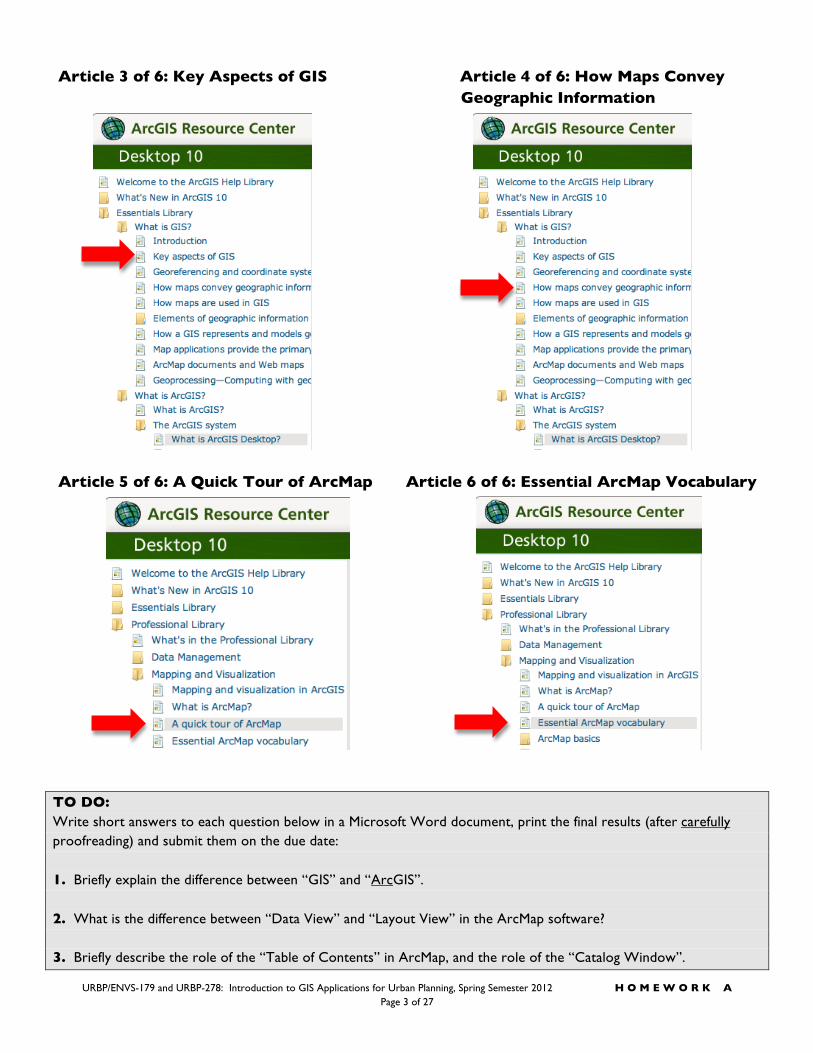
Article 3 of 6: Key Aspects of GIS Article 4 of 6: How Maps Convey Geographic Information
Article 5 of 6: A Quick Tour of ArcMap Article 6 of 6: Essential ArcMap Vocabulary
TO DO: Write short answers to each question below in a Microsoft Word document, print the final results (after carefully proofreading) and submit them on the due date: 1. Briefly explain the difference between “GIS” and “ArcGIS”. 2. What is the difference between “Data View” and “Layout View” in the ArcMap software? 3. Briefly describe the role of the “Table of Contents” in ArcMap, and the role of the “Catalog Window”.
URBP/ENVS-179 and URBP-278: Introduction to GIS Applications for Urban Planning, Spring Semester 2012 H O M E W O R K A
Page 4 of 27
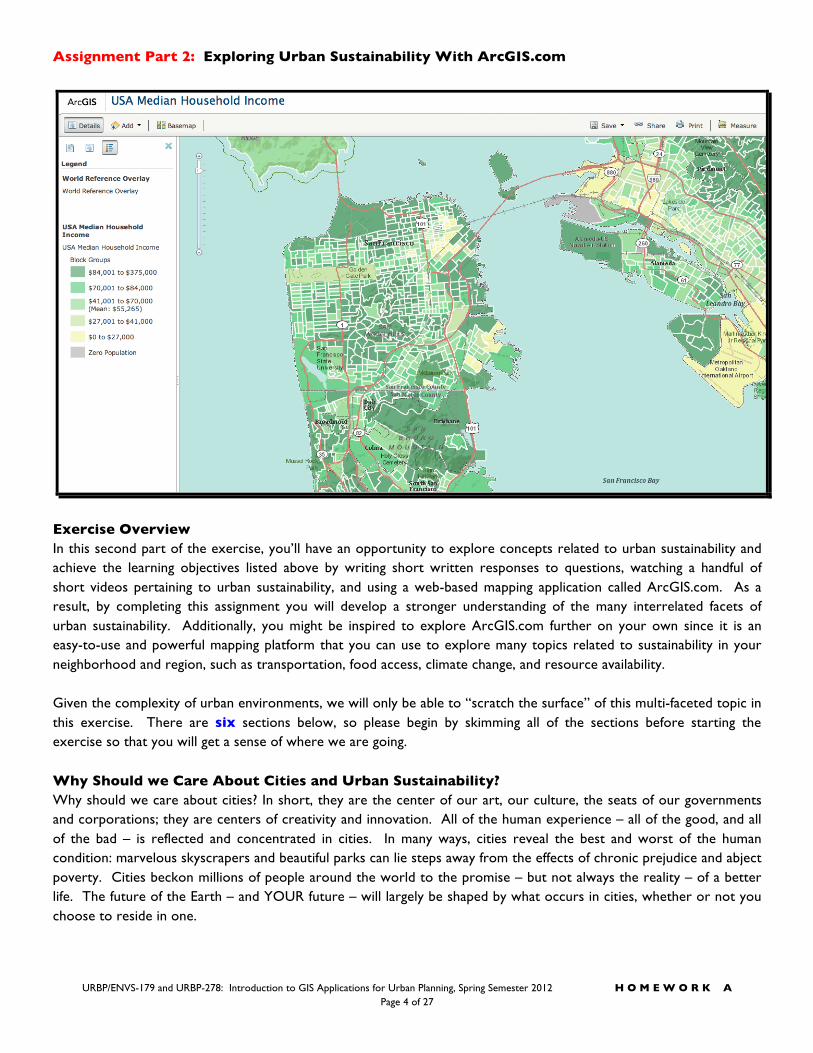
Assignment Part 2: Exploring Urban Sustainability With ArcGIS.com
Exercise Overview In this second part of the exercise, you’ll have an opportunity to explore concepts related to urban sustainability and achieve the learning objectives listed above by writing short written responses to questions, watching a handful of short videos pertaining to urban sustainability, and using a web-based mapping application called ArcGIS.com. As a result, by completing this assignment you will develop a stronger understanding of the many interrelated facets of urban sustainability. Additionally, you might be inspired to explore ArcGIS.com further on your own since it is an easy-to-use and powerful mapping platform that you can use to explore many topics related to sustainability in your neighborhood and region, such as transportation, food access, climate change, and resource availability. Given the complexity of urban environments, we will only be able to “scratch the surface” of this multi-faceted topic in this exercise. There are six sections below, so please begin by skimming all of the sections before starting the exercise so that you will get a sense of where we are going. Why Should we Care About Cities and Urban Sustainability? Why should we care about cities? In short, they are the center of our art, our culture, the seats of our governments and corporations; they are centers of creativity and innovation. All of the human experience – all of the good, and all of the bad – is reflected and concentrated in cities. In many ways, cities reveal the best and worst of the human condition: marvelous skyscrapers and beautiful parks can lie steps away from the effects of chronic prejudice and abject poverty. Cities beckon millions of people around the world to the promise – but not always the reality – of a better life. The future of the Earth – and YOUR future – will largely be shaped by what occurs in cities, whether or not you choose to reside in one.
URBP/ENVS-179 and URBP-278: Introduction to GIS Applications for Urban Planning, Spring Semester 2012 H O M E W O R K A Page 5 of 27
More than half of the world’s population now lives in cities, and each of those cities is both a prodigious consumer of resources from the outside and a sizable repository of embedded energy. As a general rule, individuals living in urban centers consume fewer resources than those living in suburban or periurban areas (those surrounding formal urban areas), but this is not fixed. As major sinks of resources and sources of pollution and waste, and the site of large flows of people, goods and vehicles, it is important to understand the “logics” of urban areas—locations, growth, industry, construction, building operations, homes, streets, water, power, wastes and so on—as well as the needs and desires of the people who live there2. As recently as 1800, less than three percent of the world lived in cities and most people lived their lives without ever seeing one. Today, on the other hand, Earth is an urban planet and humans have become an urban species. By 2050, it is predicted that more than two-thirds of us will live in cities. This incredibly rapid explosion in the growth of cities forces us to ask questions such as “how big could, or should, cities get?” or “what are the major problems that cities must face now, and in the future?” or “how can cities grow and change in a manner that meets the needs of present generations equitably, without compromising the needs of future generations?” It is this last question that forces us to think about the sustainability of cities and that is the focus of this exercise. When we think about all of the possible components of urban sustainability – and, since the term sustainability encompasses a vast array of topics, one can easily create a lengthy list! – we could take into account urban transportation, economic inequities, environmental degradation, access to food, and many other topics, as depicted in Figure 1 below. One powerful and revealing tool that we can use to explore this wide variety of topics is maps. On one map we can display many bits of information simultaneously. Think of a foldable road map that you might have in your car – on such a map you’d find different types of roads (freeways, local streets), water features (rivers, oceans), city and town names, and more. Maps have been used for centuries to capture the complexity of cities on paper as a tool to assist with navigation and urban analysis. Since the 1970s, the ability to create digital maps has given urban analysts a new and powerful tool to create customized maps that integrate many more layers of information such as aerial photographs, complex environmental systems, and data collected from satellites.
2 Working Manuscript, “Handbook to Social and Ecological Sustainability”; The SEED Working Group at UC-Santa Cruz, 2011. Ronnie Lipschutz, editor.
URBP/ENVS-179 and URBP-278: Introduction to GIS Applications for Urban Planning, Spring Semester 2012 H O M E W O R K A
Page 6 of 27
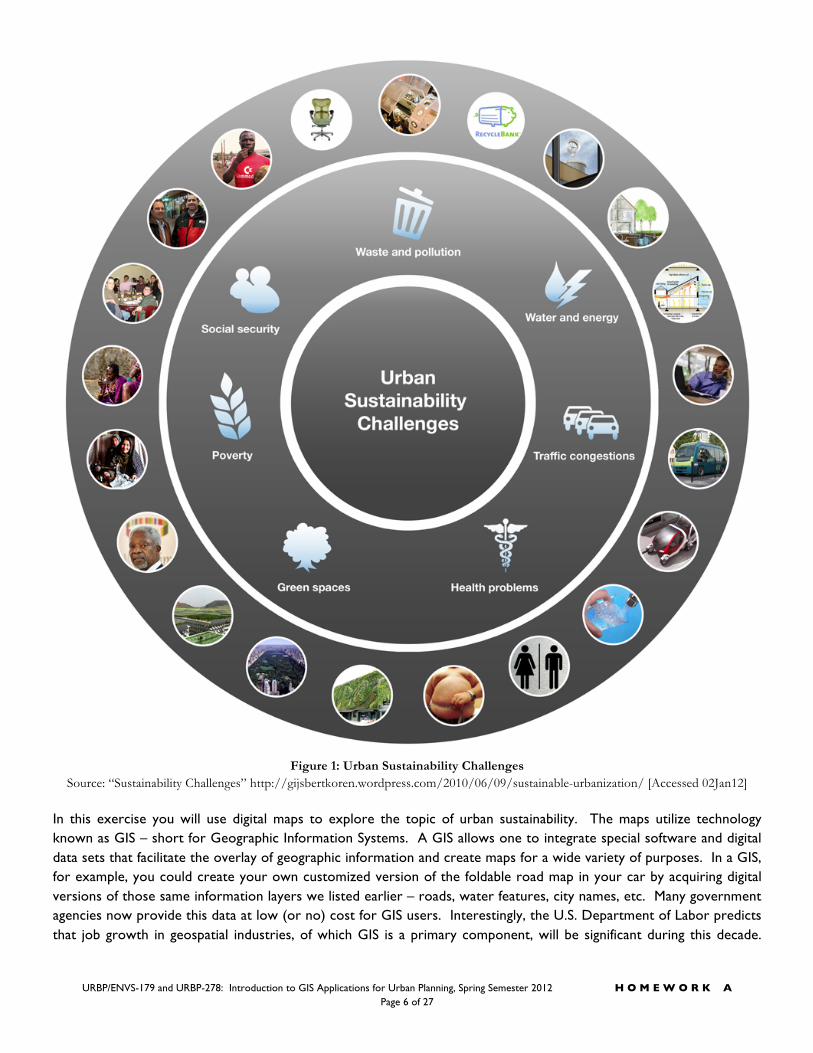
Figure 1: Urban Sustainability Challenges
Source: “Sustainability Challenges” http://gijsbertkoren.wordpress.com/2010/06/09/sustainable-urbanization/ [Accessed 02Jan12] In this exercise you will use digital maps to explore the topic of urban sustainability. The maps utilize technology known as GIS – short for Geographic Information Systems. A GIS allows one to integrate special software and digital data sets that facilitate the overlay of geographic information and create maps for a wide variety of purposes. In a GIS, for example, you could create your own customized version of the foldable road map in your car by acquiring digital versions of those same information layers we listed earlier – roads, water features, city names, etc. Many government agencies now provide this data at low (or no) cost for GIS users. Interestingly, the U.S. Department of Labor predicts that job growth in geospatial industries, of which GIS is a primary component, will be significant during this decade.
URBP/ENVS-179 and URBP-278: Introduction to GIS Applications for Urban Planning, Spring Semester 2012 H O M E W O R K A Page 7 of 27
The ability to produce accurate maps, to understand geographic relationships, and interpret maps correctly is a core skill for those seeking a career in this industry. In this exercise, you’ll use a web-based version of GIS produced by a California company called Esri (Environmental Systems Research Institute). They have developed a powerful, free, and easy-to-use web site called ArcGIS.com that enables anyone to make their own customized GIS map. By the end of this exercise you, too, will have produced a series of maps to explore facets of urban sustainability. Let’s get started by learning more about this topic.
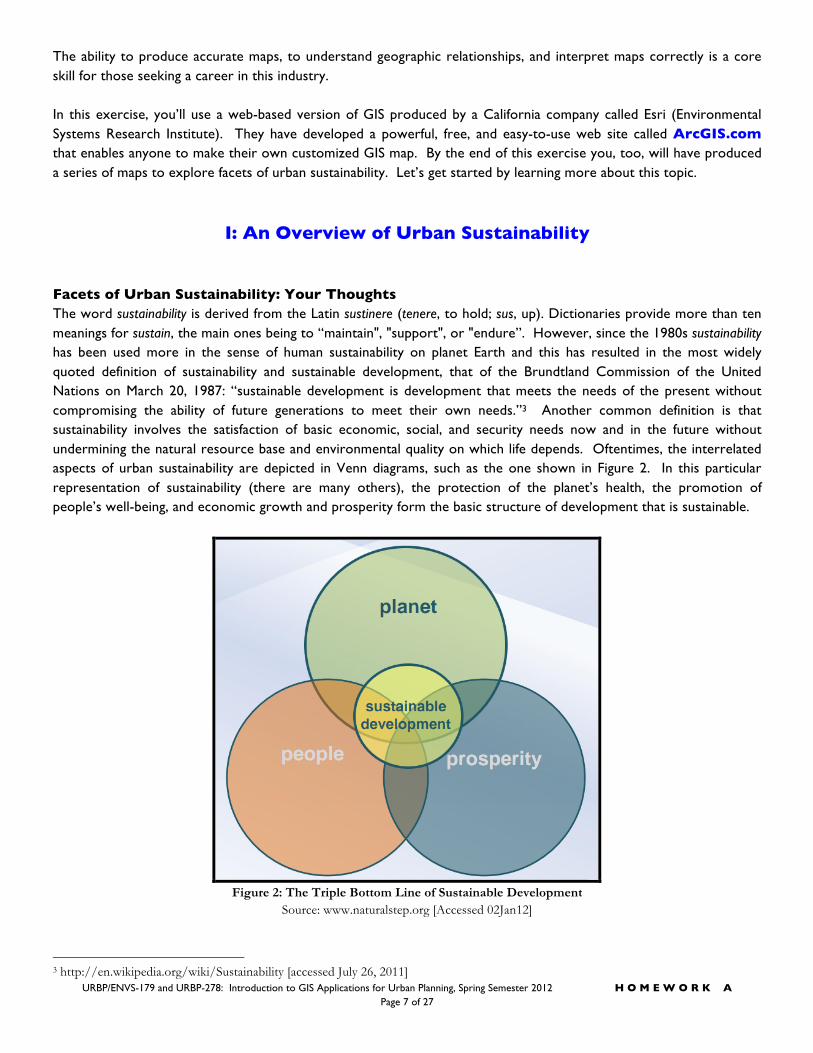
I: An Overview of Urban Sustainability Facets of Urban Sustainability: Your Thoughts The word sustainability is derived from the Latin sustinere (tenere, to hold; sus, up). Dictionaries provide more than ten meanings for sustain, the main ones being to “maintain", "support", or "endure”. However, since the 1980s sustainability has been used more in the sense of human sustainability on planet Earth and this has resulted in the most widely quoted definition of sustainability and sustainable development, that of the Brundtland Commission of the United Nations on March 20, 1987: “sustainable development is development that meets the needs of the present without compromising the ability of future generations to meet their own needs.”3 Another common definition is that sustainability involves the satisfaction of basic economic, social, and security needs now and in the future without undermining the natural resource base and environmental quality on which life depends. Oftentimes, the interrelated aspects of urban sustainability are depicted in Venn diagrams, such as the one shown in Figure 2. In this particular representation of sustainability (there are many others), the protection of the planet’s health, the promotion of people’s well-being, and economic growth and prosperity form the basic structure of development that is sustainable.
Figure 2: The Triple Bottom Line of Sustainable Development
Source: www.naturalstep.org [Accessed 02Jan12]
3 http://en.wikipedia.org/wiki/Sustainability [accessed July 26, 2011]
URBP/ENVS-179 and URBP-278: Introduction to GIS Applications for Urban Planning, Spring Semester 2012 H O M E W O R K A
Page 8 of 27
TO DO: Prepare one Microsoft Word document to capture all of your answers as you complete pages 8-27 of this assignment Anywhere where you are prompted in a grey box like this to provide a response, please list your response on your answer sheet. Based on the definitions above, your other coursework, and your own experiences, what do YOU think are the three greatest challenges that modern cities face in terms of fostering long-term urban sustainability? - Write a short title for each challenge (e.g. “Air Pollution”) - Include at least three sentences for each challenge that explains your reasoning for selecting these challenges
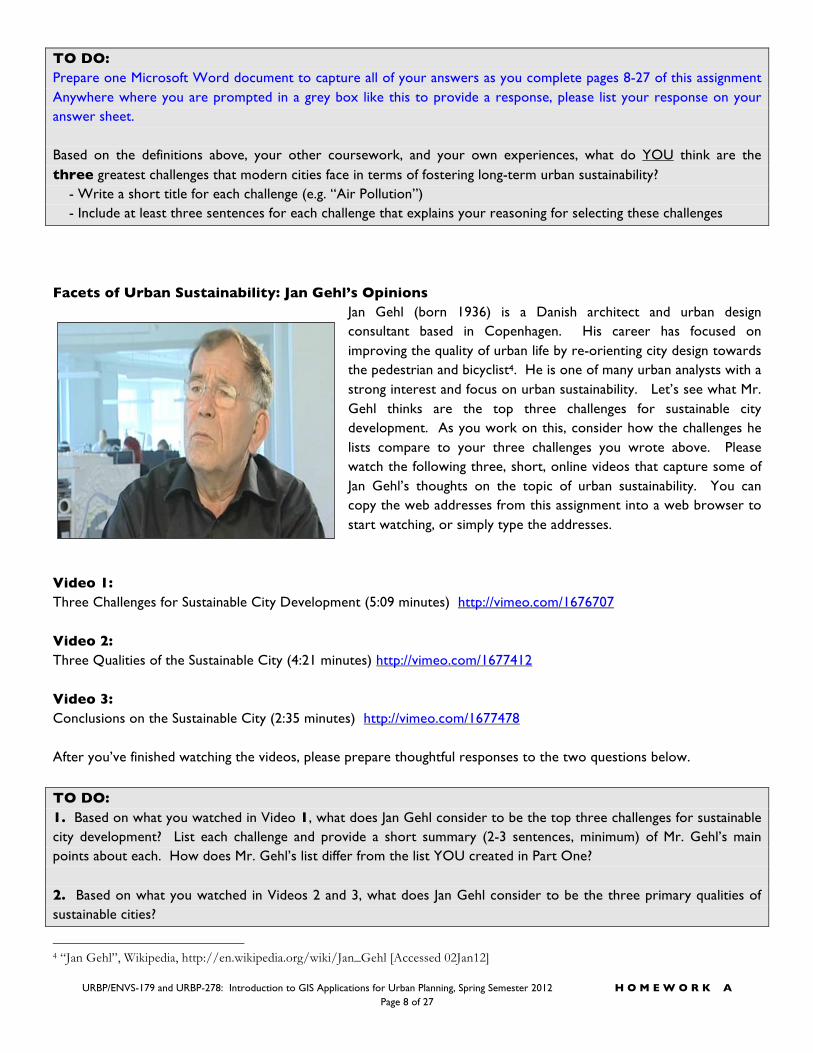
Facets of Urban Sustainability: Jan Gehl’s Opinions
Jan Gehl (born 1936) is a Danish architect and urban design consultant based in Copenhagen. His career has focused on improving the quality of urban life by re-orienting city design towards the pedestrian and bicyclist4. He is one of many urban analysts with a strong interest and focus on urban sustainability. Let’s see what Mr. Gehl thinks are the top three challenges for sustainable city development. As you work on this, consider how the challenges he lists compare to your three challenges you wrote above. Please watch the following three, short, online videos that capture some of Jan Gehl’s thoughts on the topic of urban sustainability. You can copy the web addresses from this assignment into a web browser to start watching, or simply type the addresses.
Video 1: Three Challenges for Sustainable City Development (5:09 minutes) http://vimeo.com/1676707 Video 2: Three Qualities of the Sustainable City (4:21 minutes) http://vimeo.com/1677412 Video 3: Conclusions on the Sustainable City (2:35 minutes) http://vimeo.com/1677478 After you’ve finished watching the videos, please prepare thoughtful responses to the two questions below.
TO DO: 1. Based on what you watched in Video 1, what does Jan Gehl consider to be the top three challenges for sustainable city development? List each challenge and provide a short summary (2-3 sentences, minimum) of Mr. Gehl’s main points about each. How does Mr. Gehl’s list differ from the list YOU created in Part One? 2. Based on what you watched in Videos 2 and 3, what does Jan Gehl consider to be the three primary qualities of sustainable cities?
4 “Jan Gehl”, Wikipedia, http://en.wikipedia.org/wiki/Jan_Gehl [Accessed 02Jan12]
URBP/ENVS-179 and URBP-278: Introduction to GIS Applications for Urban Planning, Spring Semester 2012 H O M E W O R K A Page 9 of 27
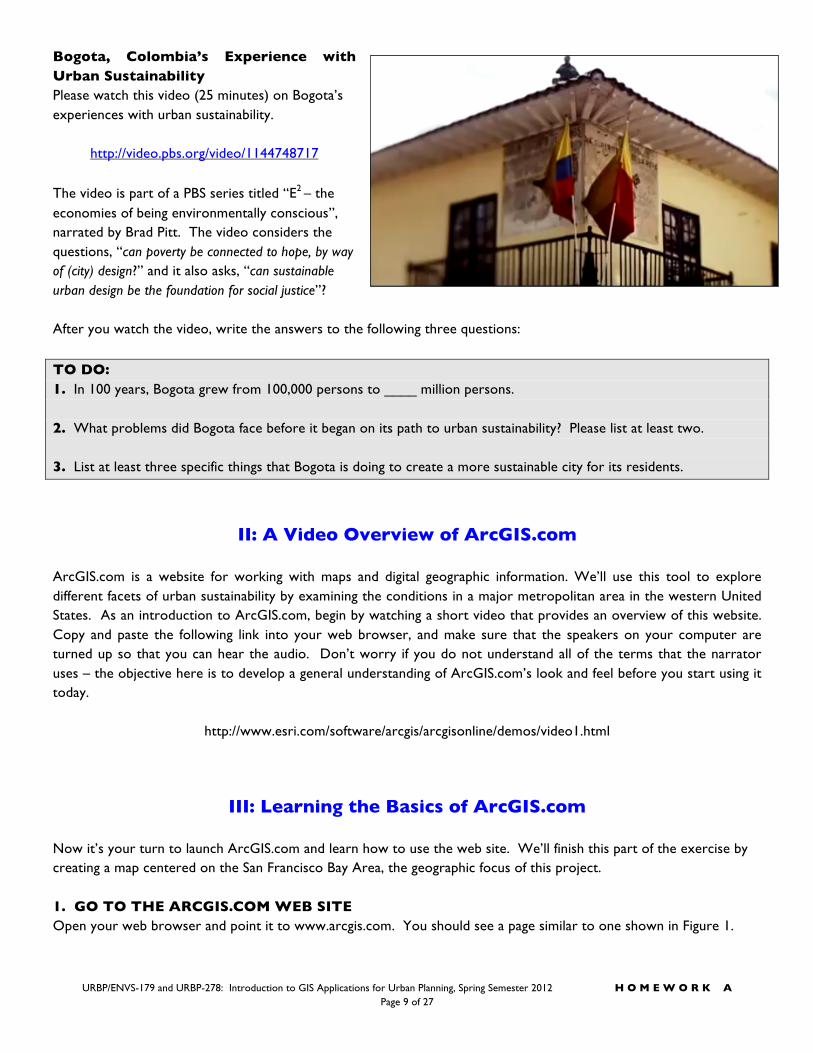
Bogota, Colombia’s Experience with Urban Sustainability Please watch this video (25 minutes) on Bogota’s experiences with urban sustainability.
http://video.pbs.org/video/1144748717
The video is part of a PBS series titled “E2 – the economies of being environmentally conscious”, narrated by Brad Pitt. The video considers the questions, “can poverty be connected to hope, by way of (city) design?” and it also asks, “can sustainable urban design be the foundation for social justice”? After you watch the video, write the answers to the following three questions:
TO DO: 1. In 100 years, Bogota grew from 100,000 persons to ____ million persons. 2. What problems did Bogota face before it began on its path to urban sustainability? Please list at least two. 3. List at least three specific things that Bogota is doing to create a more sustainable city for its residents.
II: A Video Overview of ArcGIS.com
ArcGIS.com is a website for working with maps and digital geographic information. We’ll use this tool to explore different facets of urban sustainability by examining the conditions in a major metropolitan area in the western United States. As an introduction to ArcGIS.com, begin by watching a short video that provides an overview of this website. Copy and paste the following link into your web browser, and make sure that the speakers on your computer are turned up so that you can hear the audio. Don’t worry if you do not understand all of the terms that the narrator uses – the objective here is to develop a general understanding of ArcGIS.com’s look and feel before you start using it today.
http://www.esri.com/software/arcgis/arcgisonline/demos/video1.html
III: Learning the Basics of ArcGIS.com
Now it’s your turn to launch ArcGIS.com and learn how to use the web site. We’ll finish this part of the exercise by creating a map centered on the San Francisco Bay Area, the geographic focus of this project. 1. GO TO THE ARCGIS.COM WEB SITE Open your web browser and point it to www.arcgis.com. You should see a page similar to one shown in Figure 1.
URBP/ENVS-179 and URBP-278: Introduction to GIS Applications for Urban Planning, Spring Semester 2012 H O M E W O R K A
Page 10 of 27
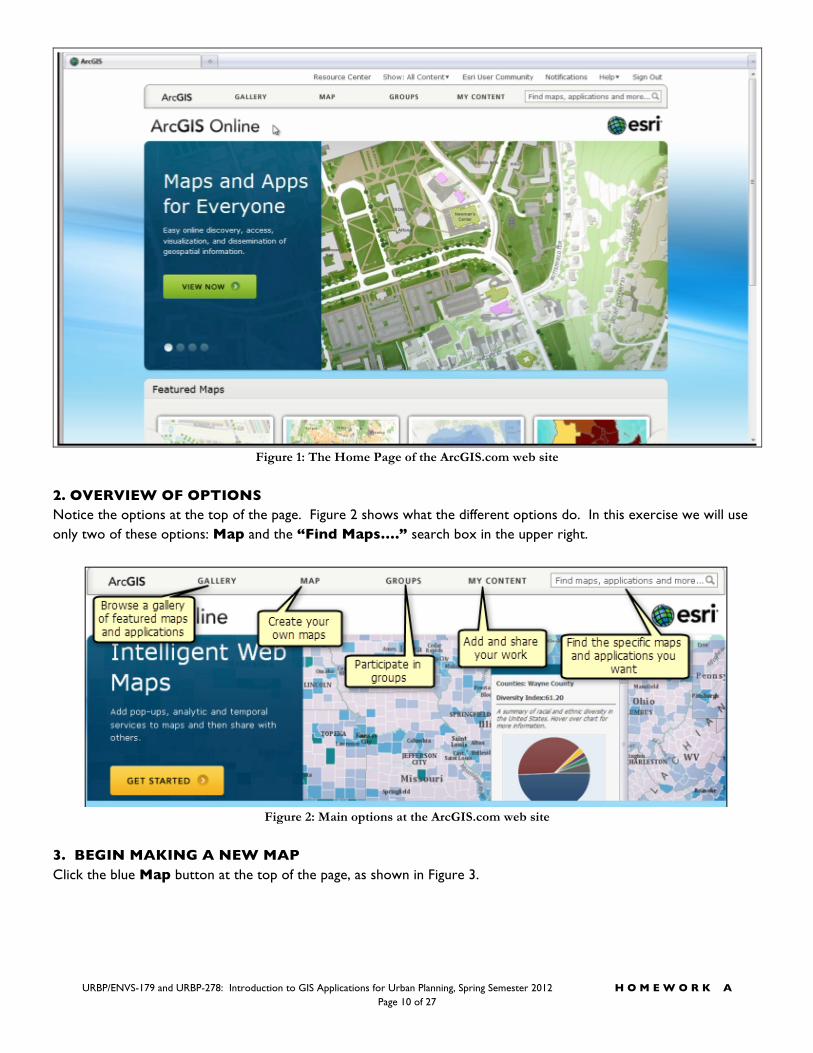
Figure 1: The Home Page of the ArcGIS.com web site
2. OVERVIEW OF OPTIONS Notice the options at the top of the page. Figure 2 shows what the different options do. In this exercise we will use only two of these options: Map and the “Find Maps….” search box in the upper right.
Figure 2: Main options at the ArcGIS.com web site
3. BEGIN MAKING A NEW MAP Click the blue Map button at the top of the page, as shown in Figure 3.
URBP/ENVS-179 and URBP-278: Introduction to GIS Applications for Urban Planning, Spring Semester 2012 H O M E W O R K A Page 11 of 27
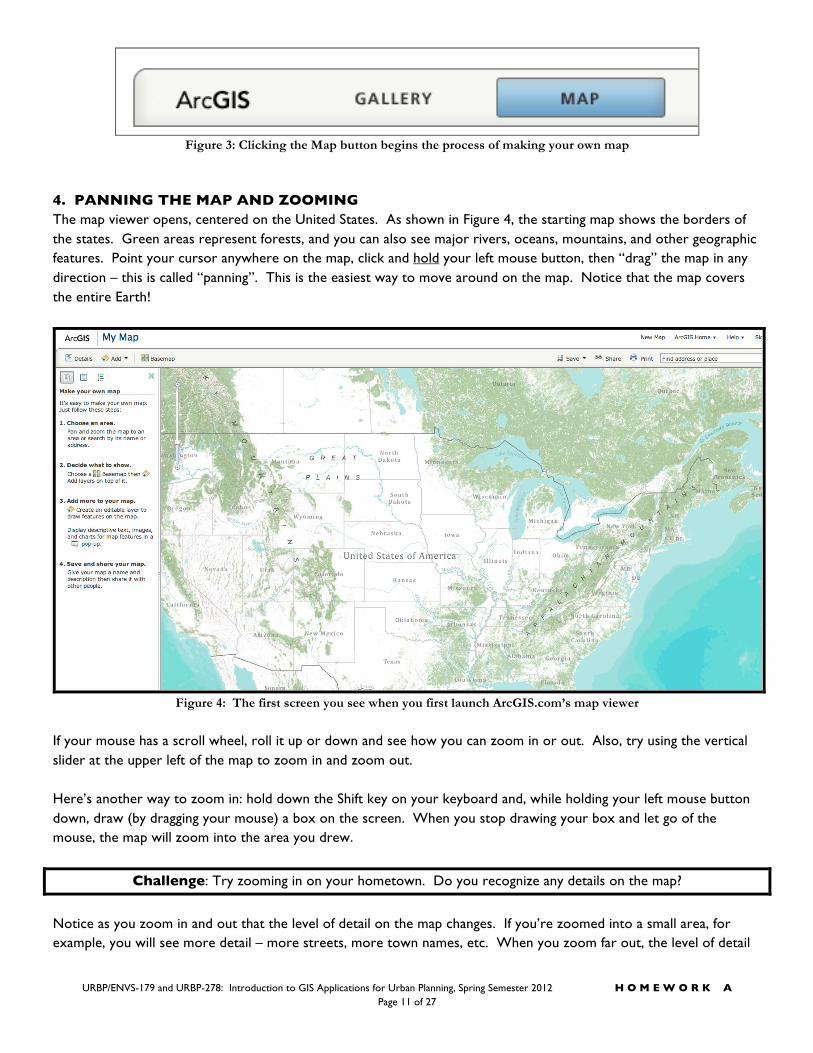
Figure 3: Clicking the Map button begins the process of making your own map
4. PANNING THE MAP AND ZOOMING The map viewer opens, centered on the United States. As shown in Figure 4, the starting map shows the borders of the states. Green areas represent forests, and you can also see major rivers, oceans, mountains, and other geographic features. Point your cursor anywhere on the map, click and hold your left mouse button, then “drag” the map in any direction – this is called “panning”. This is the easiest way to move around on the map. Notice that the map covers the entire Earth!
Figure 4: The first screen you see when you first launch ArcGIS.com’s map viewer
If your mouse has a scroll wheel, roll it up or down and see how you can zoom in or out. Also, try using the vertical slider at the upper left of the map to zoom in and zoom out. Here’s another way to zoom in: hold down the Shift key on your keyboard and, while holding your left mouse button down, draw (by dragging your mouse) a box on the screen. When you stop drawing your box and let go of the mouse, the map will zoom into the area you drew.
Challenge: Try zooming in on your hometown. Do you recognize any details on the map?
Notice as you zoom in and out that the level of detail on the map changes. If you’re zoomed into a small area, for example, you will see more detail – more streets, more town names, etc. When you zoom far out, the level of detail
URBP/ENVS-179 and URBP-278: Introduction to GIS Applications for Urban Planning, Spring Semester 2012 H O M E W O R K A
Page 12 of 27
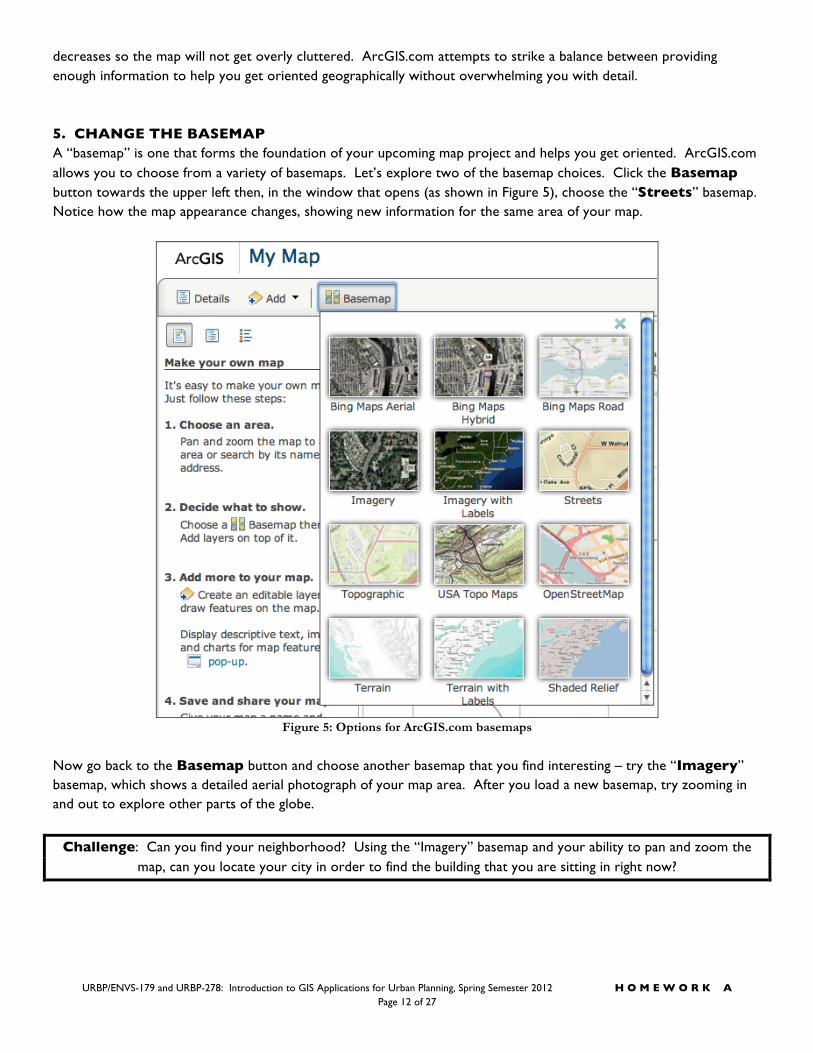
decreases so the map will not get overly cluttered. ArcGIS.com attempts to strike a balance between providing enough information to help you get oriented geographically without overwhelming you with detail. 5. CHANGE THE BASEMAP A “basemap” is one that forms the foundation of your upcoming map project and helps you get oriented. ArcGIS.com allows you to choose from a variety of basemaps. Let’s explore two of the basemap choices. Click the Basemap button towards the upper left then, in the window that opens (as shown in Figure 5), choose the “Streets” basemap. Notice how the map appearance changes, showing new information for the same area of your map.
Figure 5: Options for ArcGIS.com basemaps
Now go back to the Basemap button and choose another basemap that you find interesting – try the “Imagery” basemap, which shows a detailed aerial photograph of your map area. After you load a new basemap, try zooming in and out to explore other parts of the globe.
Challenge: Can you find your neighborhood? Using the “Imagery” basemap and your ability to pan and zoom the map, can you locate your city in order to find the building that you are sitting in right now?
URBP/ENVS-179 and URBP-278: Introduction to GIS Applications for Urban Planning, Spring Semester 2012 H O M E W O R K A Page 13 of 27
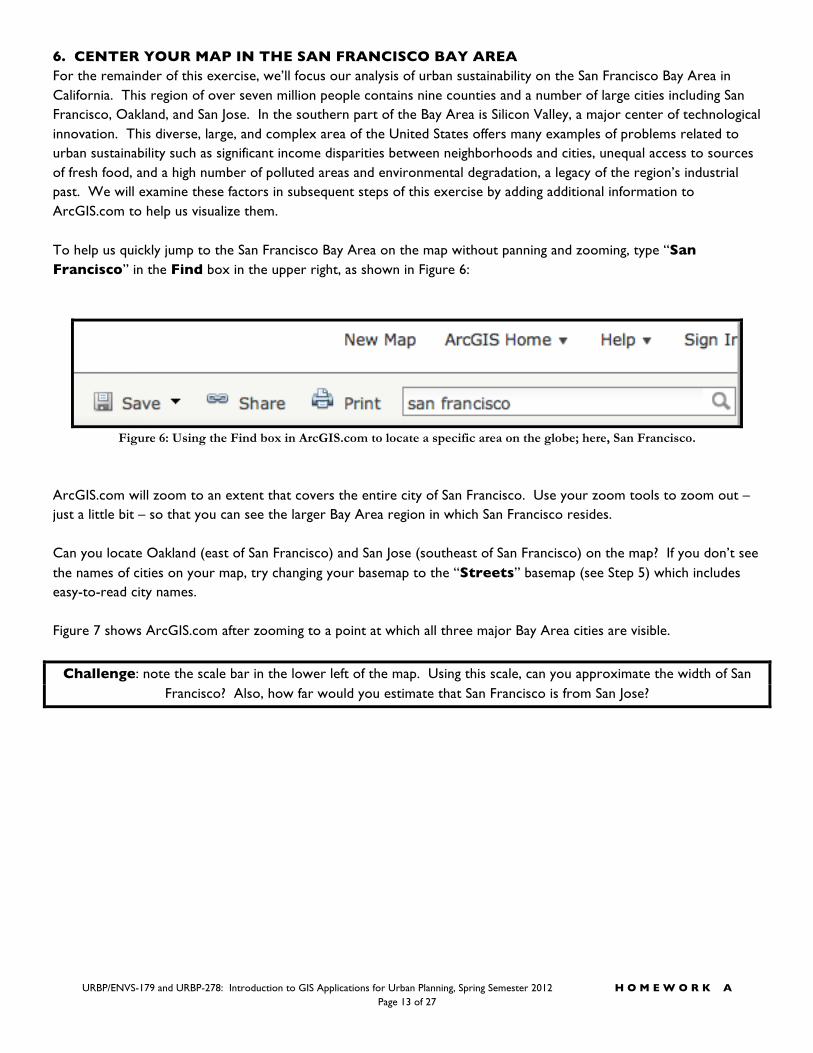
6. CENTER YOUR MAP IN THE SAN FRANCISCO BAY AREA For the remainder of this exercise, we’ll focus our analysis of urban sustainability on the San Francisco Bay Area in California. This region of over seven million people contains nine counties and a number of large cities including San Francisco, Oakland, and San Jose. In the southern part of the Bay Area is Silicon Valley, a major center of technological innovation. This diverse, large, and complex area of the United States offers many examples of problems related to urban sustainability such as significant income disparities between neighborhoods and cities, unequal access to sources of fresh food, and a high number of polluted areas and environmental degradation, a legacy of the region’s industrial past. We will examine these factors in subsequent steps of this exercise by adding additional information to ArcGIS.com to help us visualize them. To help us quickly jump to the San Francisco Bay Area on the map without panning and zooming, type “San Francisco” in the Find box in the upper right, as shown in Figure 6:
Figure 6: Using the Find box in ArcGIS.com to locate a specific area on the globe; here, San Francisco.
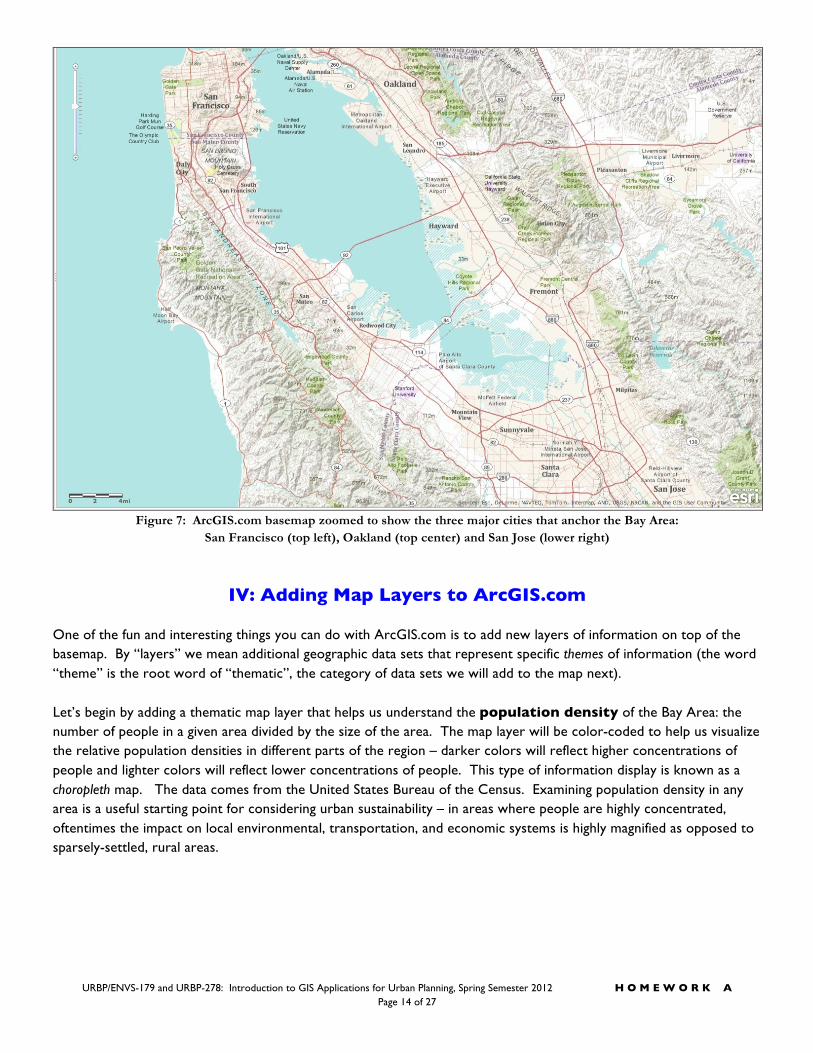
ArcGIS.com will zoom to an extent that covers the entire city of San Francisco. Use your zoom tools to zoom out – just a little bit – so that you can see the larger Bay Area region in which San Francisco resides. Can you locate Oakland (east of San Francisco) and San Jose (southeast of San Francisco) on the map? If you don’t see the names of cities on your map, try changing your basemap to the “Streets” basemap (see Step 5) which includes easy-to-read city names. Figure 7 shows ArcGIS.com after zooming to a point at which all three major Bay Area cities are visible.
Challenge: note the scale bar in the lower left of the map. Using this scale, can you approximate the width of San Francisco? Also, how far would you estimate that San Francisco is from San Jose?
URBP/ENVS-179 and URBP-278: Introduction to GIS Applications for Urban Planning, Spring Semester 2012 H O M E W O R K A
Page 14 of 27
Figure 7: ArcGIS.com basemap zoomed to show the three major cities that anchor the Bay Area:
San Francisco (top left), Oakland (top center) and San Jose (lower right)
IV: Adding Map Layers to ArcGIS.com One of the fun and interesting things you can do with ArcGIS.com is to add new layers of information on top of the basemap. By “layers” we mean additional geographic data sets that represent specific themes of information (the word “theme” is the root word of “thematic”, the category of data sets we will add to the map next). Let’s begin by adding a thematic map layer that helps us understand the population density of the Bay Area: the number of people in a given area divided by the size of the area. The map layer will be color-coded to help us visualize the relative population densities in different parts of the region – darker colors will reflect higher concentrations of people and lighter colors will reflect lower concentrations of people. This type of information display is known as a choropleth map. The data comes from the United States Bureau of the Census. Examining population density in any area is a useful starting point for considering urban sustainability – in areas where people are highly concentrated, oftentimes the impact on local environmental, transportation, and economic systems is highly magnified as opposed to sparsely-settled, rural areas.
URBP/ENVS-179 and URBP-278: Introduction to GIS Applications for Urban Planning, Spring Semester 2012 H O M E W O R K A Page 15 of 27
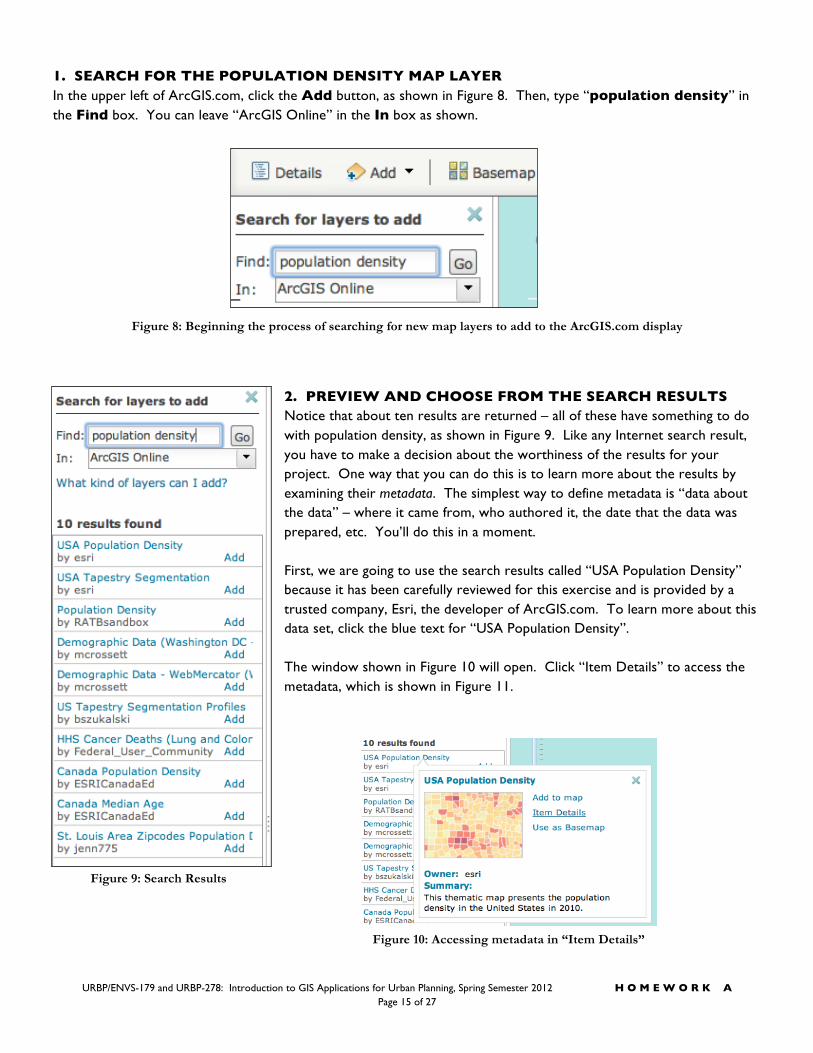
1. SEARCH FOR THE POPULATION DENSITY MAP LAYER In the upper left of ArcGIS.com, click the Add button, as shown in Figure 8. Then, type “population density” in the Find box. You can leave “ArcGIS Online” in the In box as shown.
Figure 8: Beginning the process of searching for new map layers to add to the ArcGIS.com display
2. PREVIEW AND CHOOSE FROM THE SEARCH RESULTS Notice that about ten results are returned – all of these have something to do with population density, as shown in Figure 9. Like any Internet search result, you have to make a decision about the worthiness of the results for your project. One way that you can do this is to learn more about the results by examining their metadata. The simplest way to define metadata is “data about the data” – where it came from, who authored it, the date that the data was prepared, etc. You’ll do this in a moment. First, we are going to use the search results called “USA Population Density” because it has been carefully reviewed for this exercise and is provided by a trusted company, Esri, the developer of ArcGIS.com. To learn more about this data set, click the blue text for “USA Population Density”. The window shown in Figure 10 will open. Click “Item Details” to access the metadata, which is shown in Figure 11.
Figure 9: Search Results
Figure 10: Accessing metadata in “Item Details”
URBP/ENVS-179 and URBP-278: Introduction to GIS Applications for Urban Planning, Spring Semester 2012 H O M E W O R K A
Page 16 of 27
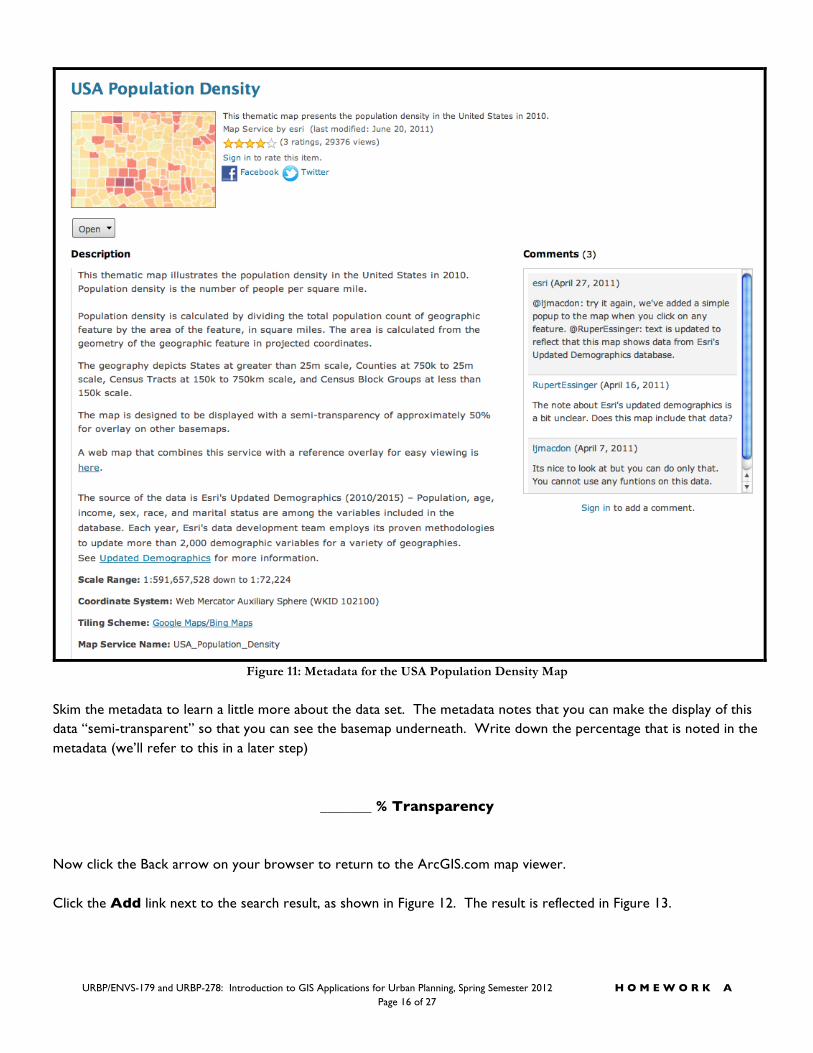
Figure 11: Metadata for the USA Population Density Map
Skim the metadata to learn a little more about the data set. The metadata notes that you can make the display of this data “semi-transparent” so that you can see the basemap underneath. Write down the percentage that is noted in the metadata (we’ll refer to this in a later step)
_______ % Transparency
Now click the Back arrow on your browser to return to the ArcGIS.com map viewer. Click the Add link next to the search result, as shown in Figure 12. The result is reflected in Figure 13.
URBP/ENVS-179 and URBP-278: Introduction to GIS Applications for Urban Planning, Spring Semester 2012 H O M E W O R K A Page 17 of 27
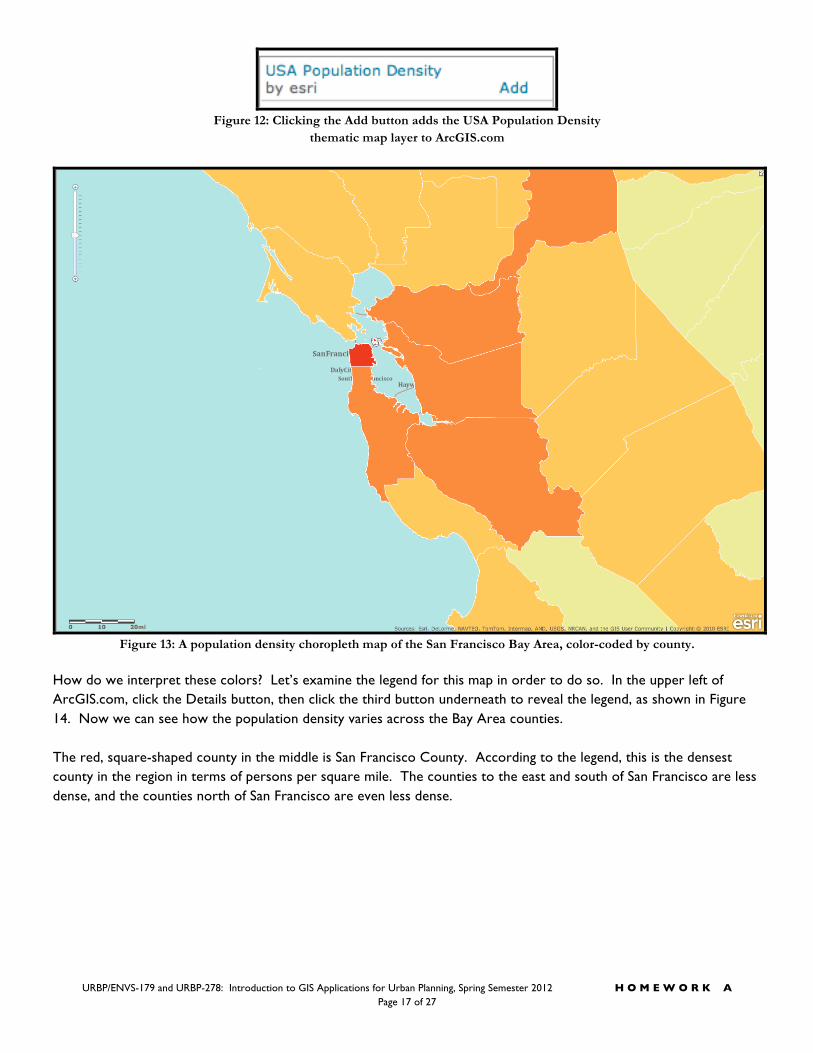
Figure 12: Clicking the Add button adds the USA Population Density
thematic map layer to ArcGIS.com
Figure 13: A population density choropleth map of the San Francisco Bay Area, color-coded by county.
How do we interpret these colors? Let’s examine the legend for this map in order to do so. In the upper left of ArcGIS.com, click the Details button, then click the third button underneath to reveal the legend, as shown in Figure 14. Now we can see how the population density varies across the Bay Area counties. The red, square-shaped county in the middle is San Francisco County. According to the legend, this is the densest county in the region in terms of persons per square mile. The counties to the east and south of San Francisco are less dense, and the counties north of San Francisco are even less dense.
URBP/ENVS-179 and URBP-278: Introduction to GIS Applications for Urban Planning, Spring Semester 2012 H O M E W O R K A
Page 18 of 27
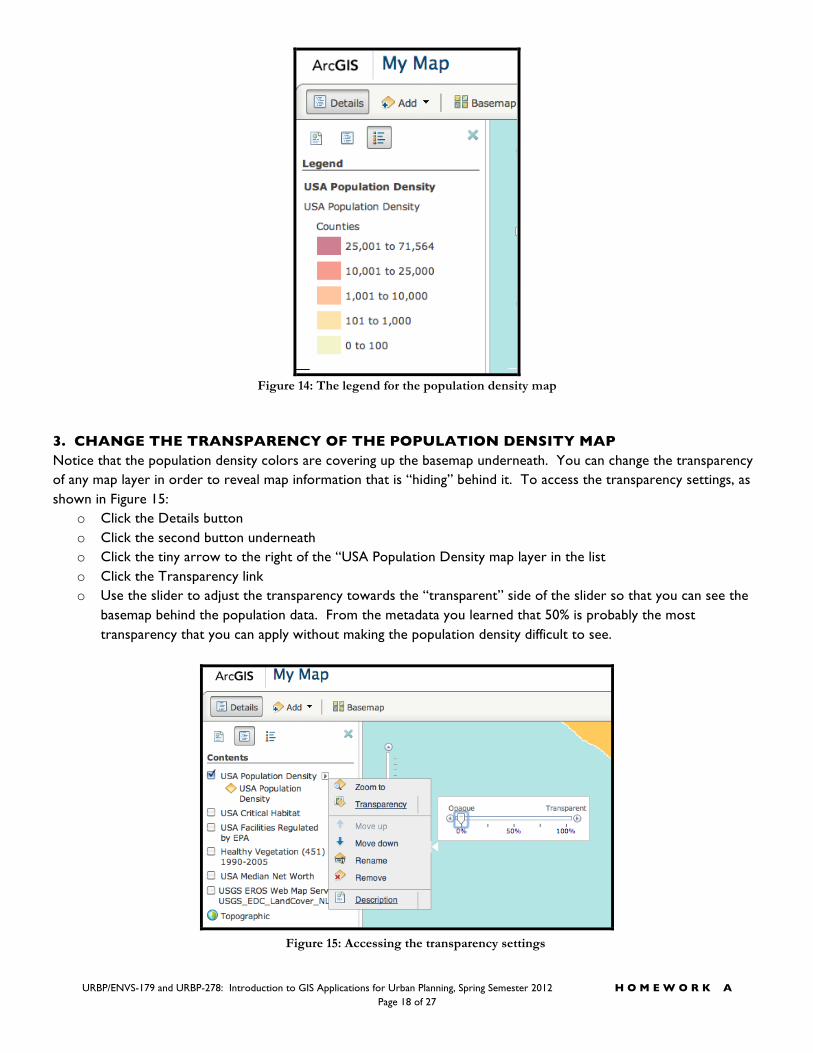
Figure 14: The legend for the population density map
3. CHANGE THE TRANSPARENCY OF THE POPULATION DENSITY MAP Notice that the population density colors are covering up the basemap underneath. You can change the transparency of any map layer in order to reveal map information that is “hiding” behind it. To access the transparency settings, as shown in Figure 15:
o Click the Details button o Click the second button underneath o Click the tiny arrow to the right of the “USA Population Density map layer in the list o Click the Transparency link o Use the slider to adjust the transparency towards the “transparent” side of the slider so that you can see the
basemap behind the population data. From the metadata you learned that 50% is probably the most transparency that you can apply without making the population density difficult to see.
Figure 15: Accessing the transparency settings
URBP/ENVS-179 and URBP-278: Introduction to GIS Applications for Urban Planning, Spring Semester 2012 H O M E W O R K A Page 19 of 27
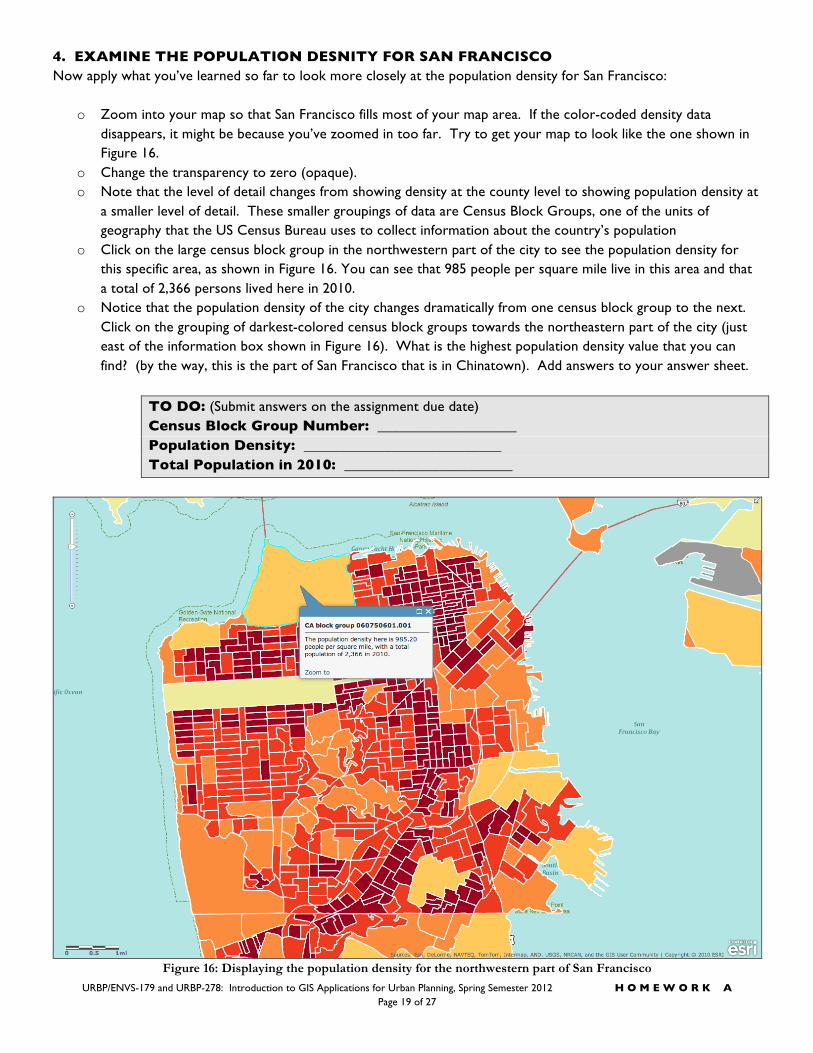
4. EXAMINE THE POPULATION DESNITY FOR SAN FRANCISCO Now apply what you’ve learned so far to look more closely at the population density for San Francisco:
o Zoom into your map so that San Francisco fills most of your map area. If the color-coded density data disappears, it might be because you’ve zoomed in too far. Try to get your map to look like the one shown in Figure 16.
o Change the transparency to zero (opaque). o Note that the level of detail changes from showing density at the county level to showing population density at
a smaller level of detail. These smaller groupings of data are Census Block Groups, one of the units of geography that the US Census Bureau uses to collect information about the country’s population
o Click on the large census block group in the northwestern part of the city to see the population density for this specific area, as shown in Figure 16. You can see that 985 people per square mile live in this area and that a total of 2,366 persons lived here in 2010.
o Notice that the population density of the city changes dramatically from one census block group to the next. Click on the grouping of darkest-colored census block groups towards the northeastern part of the city (just east of the information box shown in Figure 16). What is the highest population density value that you can find? (by the way, this is the part of San Francisco that is in Chinatown). Add answers to your answer sheet.
TO DO: (Submit answers on the assignment due date) Census Block Group Number: ___________________ Population Density: ___________________________ Total Population in 2010: _______________________
Figure 16: Displaying the population density for the northwestern part of San Francisco
URBP/ENVS-179 and URBP-278: Introduction to GIS Applications for Urban Planning, Spring Semester 2012 H O M E W O R K A
Page 20 of 27
Congratulations! You have just completed a number of important steps:
o You opened ArcGIS.com and selected a basemap from a variety of choices o You learned how to pan and zoom on the map o You discovered that you could type a location into the Find box to quickly zoom to any area o You learned how to add thematic data to ArGIS.com by searching for population density o You examined the metadata (data about the data) for your selected data set o You saw that the level of map detail changes as you zoom in and out o You learned that you can change the transparency of any map layer to see underlying ones more clearly o You learned that by clicking on the map, more information is revealed about the data in a little popup window
Accessing digital geographic information so quickly and easily opens the door to all sorts of exciting analytical possibilities, especially when you consider that there are hundreds of data sets to choose from, all of which can be added to your map just like you did already. In the not so distant past, before the advent of the Internet, web browsers, and GIS technology, to do what you did here would have required a trip to your local library, a request to the librarian to pull out a heavy atlas from the reference section, and a hunt for the map that you wanted (assuming that the atlas publisher even published the exact map that you wanted!) You wouldn’t have the ability to change the basemap, nor would you have the ability to zoom in and out to further explore the geographic areas of interest to you. Also, paper atlases can become out of date rather quickly, whereas digital maps online can be rapidly updated as new information is produced. It’s a wonderful age that we live in, with so much geographic information at our fingertips to help us learn more about our town, neighborhood, region, and planet. Still, we must take care to be careful consumers of this information in order to use it wisely. This involves carefully checking the metadata to better understand the source of the information, comparing similar data sets to see which are the most relevant and useful to your analysis, and being careful not to blindly trust any information on a computer – all computer data is produced by human beings who are prone to mistakes! Next, let’s apply what you’ve learned about ArcGIS.com to look more specifically at facets of urban sustainability.
IV: Exploring Urban Sustainability Topics with ArcGIS.com As we’ve noted, the term “sustainability” encompasses a vast array of systems, values, goals, and potential topics – so much so that there is a great deal of contentious debate about what the term actually means! Our goal in this exercise is to produce digital maps to help us explore this term as it specifically applies to urban sustainability. We will not be able to examine every variable, or every topic, but a small selection of topics that can serve as a starting point for examining the multi-faceted nature of a complex topic. It is our hope that this online map exploration will encourage you to dig deeper, to read more, to ask more questions, to search for more digital geographic data, and to take courses and read books that encourage you to learn more about sustainability. We’re only scratching the surface using the powerful online tool, ArcGIS.com. Like any tool, its use is one of many possible means of conducting research.
URBP/ENVS-179 and URBP-278: Introduction to GIS Applications for Urban Planning, Spring Semester 2012 H O M E W O R K A Page 21 of 27
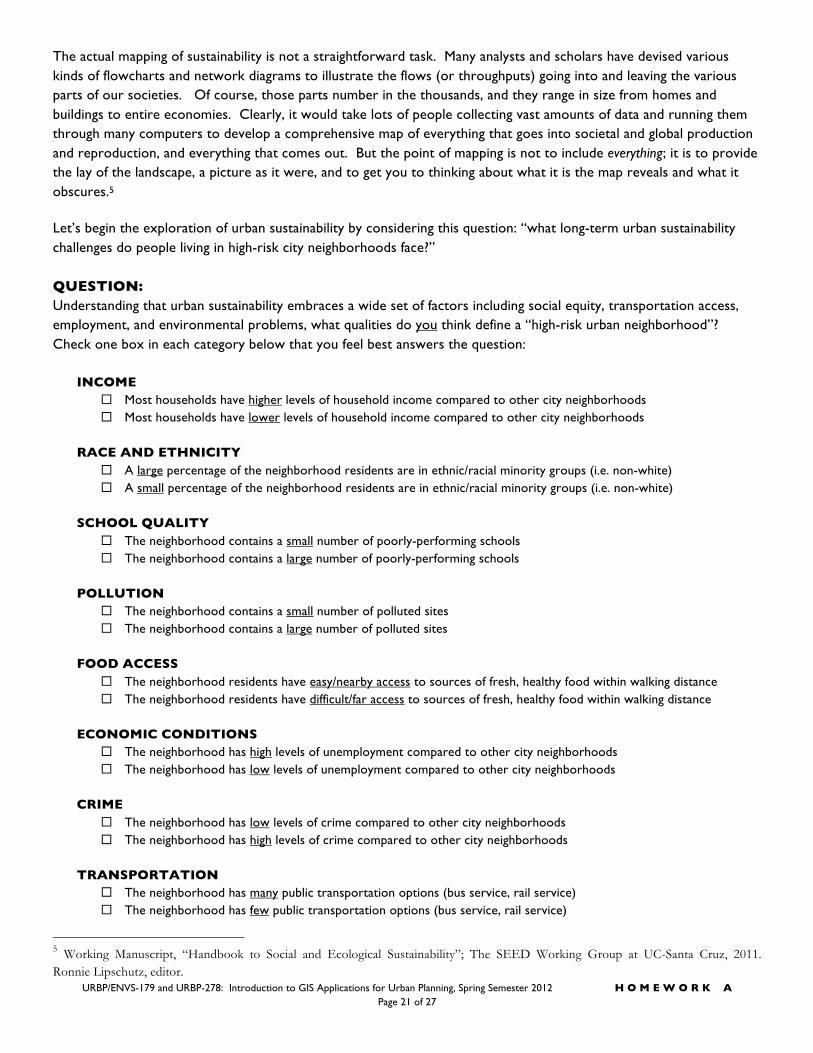
The actual mapping of sustainability is not a straightforward task. Many analysts and scholars have devised various kinds of flowcharts and network diagrams to illustrate the flows (or throughputs) going into and leaving the various parts of our societies. Of course, those parts number in the thousands, and they range in size from homes and buildings to entire economies. Clearly, it would take lots of people collecting vast amounts of data and running them through many computers to develop a comprehensive map of everything that goes into societal and global production and reproduction, and everything that comes out. But the point of mapping is not to include everything; it is to provide the lay of the landscape, a picture as it were, and to get you to thinking about what it is the map reveals and what it obscures.5 Let’s begin the exploration of urban sustainability by considering this question: “what long-term urban sustainability challenges do people living in high-risk city neighborhoods face?” QUESTION: Understanding that urban sustainability embraces a wide set of factors including social equity, transportation access, employment, and environmental problems, what qualities do you think define a “high-risk urban neighborhood”? Check one box in each category below that you feel best answers the question:
INCOME Most households have higher levels of household income compared to other city neighborhoods Most households have lower levels of household income compared to other city neighborhoods
RACE AND ETHNICITY
A large percentage of the neighborhood residents are in ethnic/racial minority groups (i.e. non-white) A small percentage of the neighborhood residents are in ethnic/racial minority groups (i.e. non-white)
SCHOOL QUALITY
The neighborhood contains a small number of poorly-performing schools The neighborhood contains a large number of poorly-performing schools
POLLUTION
The neighborhood contains a small number of polluted sites The neighborhood contains a large number of polluted sites
FOOD ACCESS
The neighborhood residents have easy/nearby access to sources of fresh, healthy food within walking distance The neighborhood residents have difficult/far access to sources of fresh, healthy food within walking distance
ECONOMIC CONDITIONS
The neighborhood has high levels of unemployment compared to other city neighborhoods The neighborhood has low levels of unemployment compared to other city neighborhoods
CRIME
The neighborhood has low levels of crime compared to other city neighborhoods The neighborhood has high levels of crime compared to other city neighborhoods
TRANSPORTATION
The neighborhood has many public transportation options (bus service, rail service) The neighborhood has few public transportation options (bus service, rail service)
5 Working Manuscript, “Handbook to Social and Ecological Sustainability”; The SEED Working Group at UC-Santa Cruz, 2011. Ronnie Lipschutz, editor.
URBP/ENVS-179 and URBP-278: Introduction to GIS Applications for Urban Planning, Spring Semester 2012 H O M E W O R K A
Page 22 of 27
A larger percentage of neighborhood residents own cars compared to more affluent neighborhoods A smaller percentage of neighborhood residents own cars compared to more affluent neighborhoods
HEALTH CARE ACCESS
The neighborhood residents have a large number of healthcare facilities (hospitals, clinics) nearby The neighborhood residents have a small number of healthcare facilities (hospitals, clinics) nearby
Are there any other qualities that you think define high-risk urban neighborhoods that present challenges for making them more sustainable over the long-term? You might want to jot down some notes below.
____________________________________________________________________________________
____________________________________________________________________________________
____________________________________________________________________________________
____________________________________________________________________________________
Let’s investigate some of these factors by using ArcGIS.com to look more closely at the urban conditions in the city of San Francisco. We’ll explore two areas – a wealthier neighborhood called Cow Hollow, and a poorer neighborhood called Bayview-Hunters Point. First, some quick facts about San Francisco:
• It is the financial, cultural, and transportation center of the San Francisco Bay Area, a region of 7.15 million people which includes San Jose and Oakland
• It is the most densely settled large city (population greater than 200,000) in the state of California and the second-most densely populated large city in the United States (New York City is the most dense)
• It is the fourth most populous city in California and the 13th most populous city in the United States, with a 2010 estimated population of 805,235.
URBAN SUSTIANABILITY INDICATOR #1: HOUSEHOLD INCOME Objective: COMPARE HOUSEHOLD INCOME IN COW HOLLOW AND BAYVIEW-HUNTERS POINT
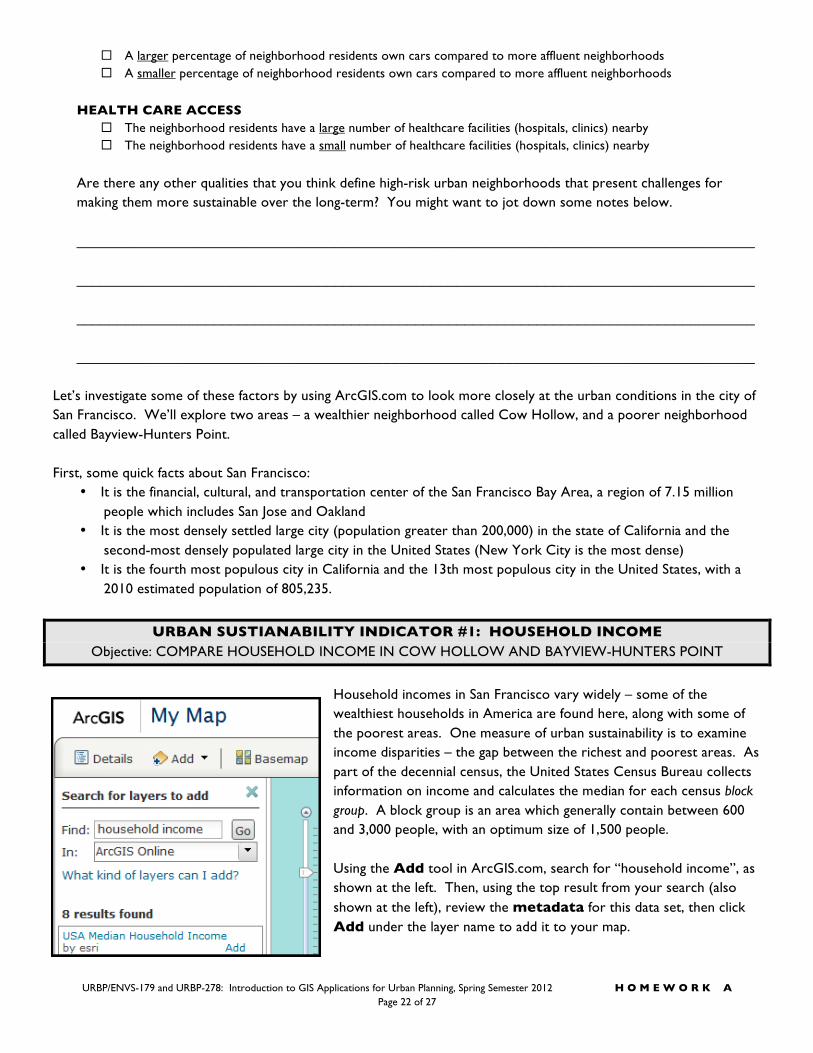
Household incomes in San Francisco vary widely – some of the wealthiest households in America are found here, along with some of the poorest areas. One measure of urban sustainability is to examine income disparities – the gap between the richest and poorest areas. As part of the decennial census, the United States Census Bureau collects information on income and calculates the median for each census block group. A block group is an area which generally contain between 600 and 3,000 people, with an optimum size of 1,500 people. Using the Add tool in ArcGIS.com, search for “household income”, as shown at the left. Then, using the top result from your search (also shown at the left), review the metadata for this data set, then click Add under the layer name to add it to your map.
URBP/ENVS-179 and URBP-278: Introduction to GIS Applications for Urban Planning, Spring Semester 2012 H O M E W O R K A Page 23 of 27
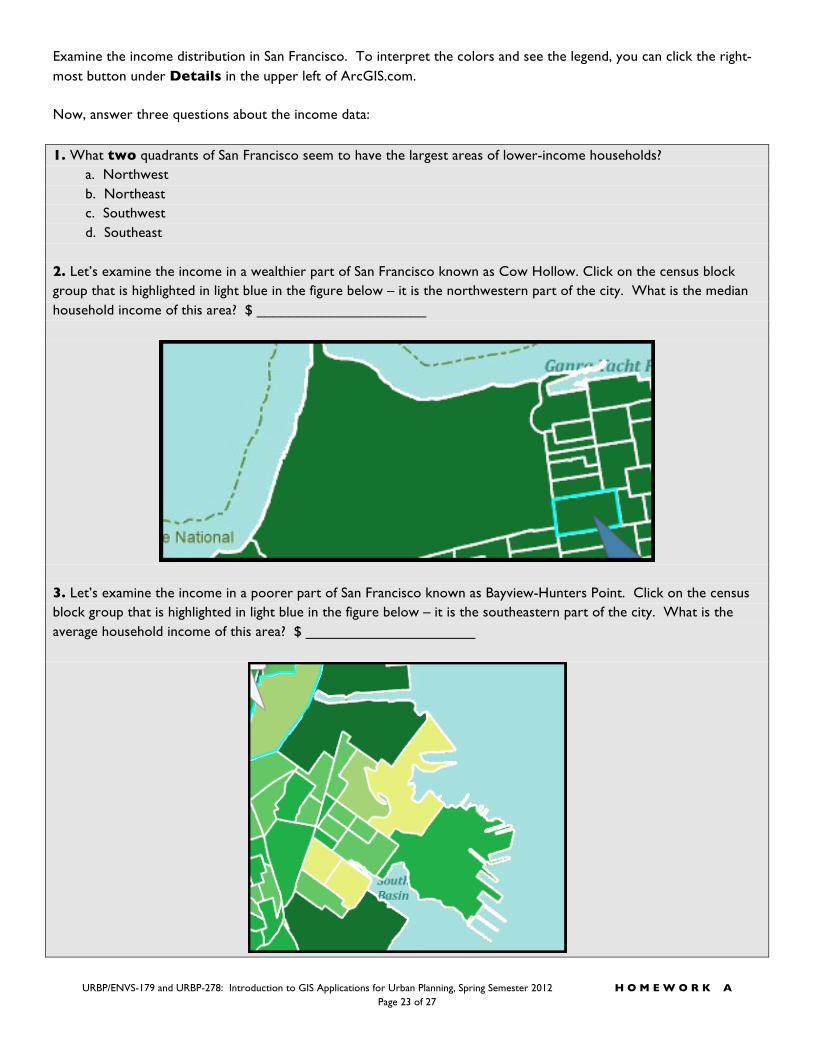
Examine the income distribution in San Francisco. To interpret the colors and see the legend, you can click the right-most button under Details in the upper left of ArcGIS.com. Now, answer three questions about the income data:
1. What two quadrants of San Francisco seem to have the largest areas of lower-income households? a. Northwest b. Northeast c. Southwest d. Southeast 2. Let’s examine the income in a wealthier part of San Francisco known as Cow Hollow. Click on the census block group that is highlighted in light blue in the figure below – it is the northwestern part of the city. What is the median household income of this area? $ _____________________
3. Let’s examine the income in a poorer part of San Francisco known as Bayview-Hunters Point. Click on the census block group that is highlighted in light blue in the figure below – it is the southeastern part of the city. What is the average household income of this area? $ _____________________
URBP/ENVS-179 and URBP-278: Introduction to GIS Applications for Urban Planning, Spring Semester 2012 H O M E W O R K A
Page 24 of 27
URBAN SUSTIANABILITY INDICATOR #2: RACIAL DIVERSITY Objective: COMPARE RACIAL DIVERSITY IN COW HOLLOW AND BAYVIEW-HUNTERS POINT
We see that the household income varies substantially between the two study neighborhoods. Using ArcGIS.com, what else can we learn about the conditions in these two neighborhoods? Let’s next examine the racial and ethnic composition of these same two areas.
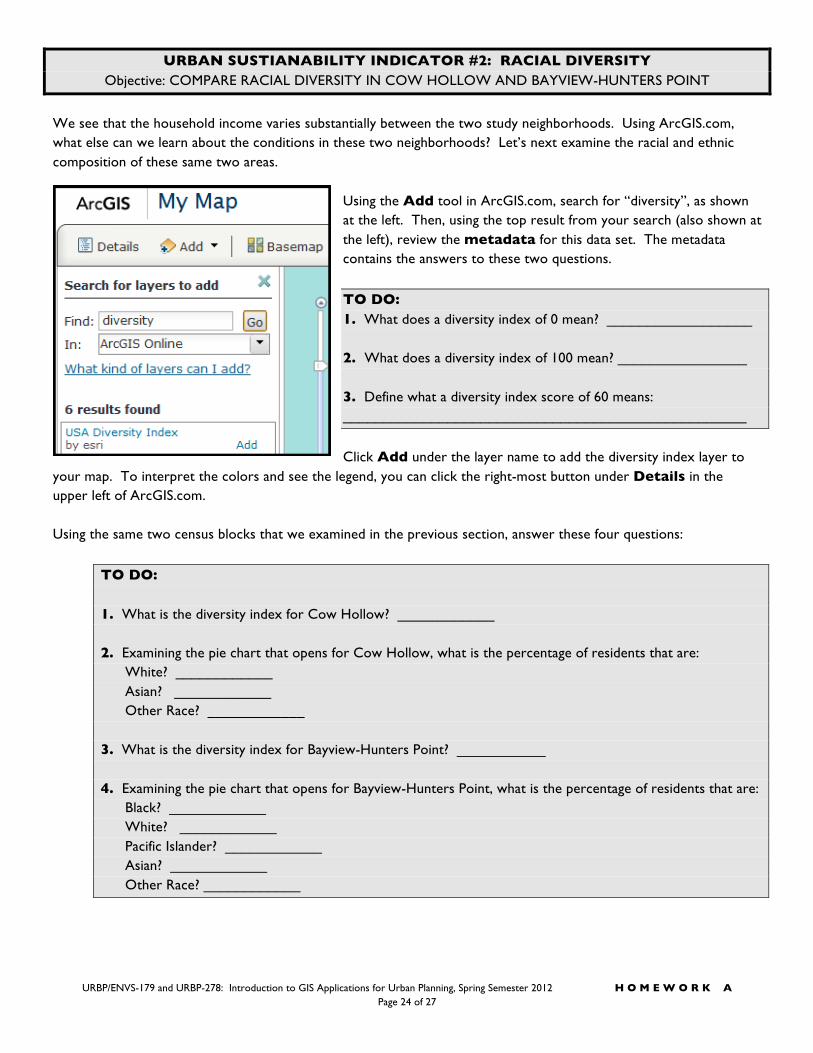
Using the Add tool in ArcGIS.com, search for “diversity”, as shown at the left. Then, using the top result from your search (also shown at the left), review the metadata for this data set. The metadata contains the answers to these two questions.
TO DO: 1. What does a diversity index of 0 mean? __________________ 2. What does a diversity index of 100 mean? ________________ 3. Define what a diversity index score of 60 means: __________________________________________________
Click Add under the layer name to add the diversity index layer to
your map. To interpret the colors and see the legend, you can click the right-most button under Details in the upper left of ArcGIS.com. Using the same two census blocks that we examined in the previous section, answer these four questions:
TO DO: 1. What is the diversity index for Cow Hollow? ____________ 2. Examining the pie chart that opens for Cow Hollow, what is the percentage of residents that are: White? ____________ Asian? ____________ Other Race? ____________ 3. What is the diversity index for Bayview-Hunters Point? ___________ 4. Examining the pie chart that opens for Bayview-Hunters Point, what is the percentage of residents that are: Black? ____________ White? ____________ Pacific Islander? ____________ Asian? ____________ Other Race? ____________
URBP/ENVS-179 and URBP-278: Introduction to GIS Applications for Urban Planning, Spring Semester 2012 H O M E W O R K A Page 25 of 27
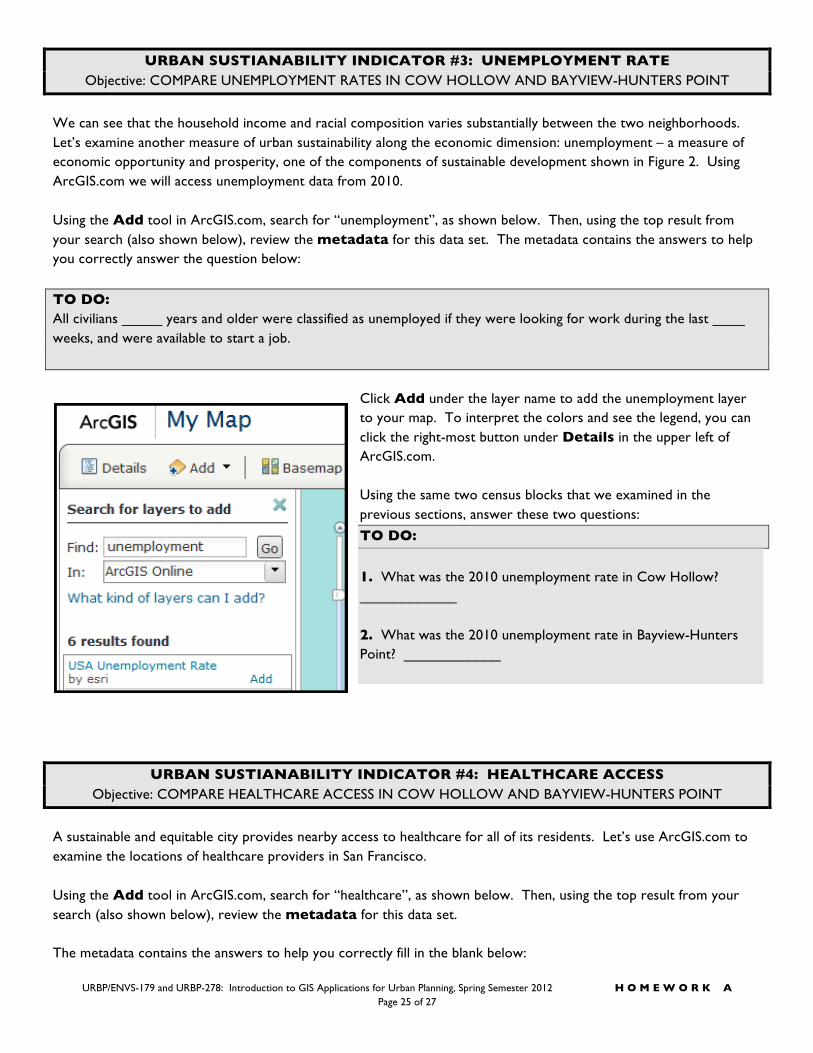
URBAN SUSTIANABILITY INDICATOR #3: UNEMPLOYMENT RATE Objective: COMPARE UNEMPLOYMENT RATES IN COW HOLLOW AND BAYVIEW-HUNTERS POINT
We can see that the household income and racial composition varies substantially between the two neighborhoods. Let’s examine another measure of urban sustainability along the economic dimension: unemployment – a measure of economic opportunity and prosperity, one of the components of sustainable development shown in Figure 2. Using ArcGIS.com we will access unemployment data from 2010. Using the Add tool in ArcGIS.com, search for “unemployment”, as shown below. Then, using the top result from your search (also shown below), review the metadata for this data set. The metadata contains the answers to help you correctly answer the question below:
TO DO: All civilians _____ years and older were classified as unemployed if they were looking for work during the last ____ weeks, and were available to start a job.
Click Add under the layer name to add the unemployment layer to your map. To interpret the colors and see the legend, you can click the right-most button under Details in the upper left of ArcGIS.com. Using the same two census blocks that we examined in the previous sections, answer these two questions:
TO DO:
1. What was the 2010 unemployment rate in Cow Hollow? ____________ 2. What was the 2010 unemployment rate in Bayview-Hunters Point? ____________
URBAN SUSTIANABILITY INDICATOR #4: HEALTHCARE ACCESS Objective: COMPARE HEALTHCARE ACCESS IN COW HOLLOW AND BAYVIEW-HUNTERS POINT
A sustainable and equitable city provides nearby access to healthcare for all of its residents. Let’s use ArcGIS.com to examine the locations of healthcare providers in San Francisco. Using the Add tool in ArcGIS.com, search for “healthcare”, as shown below. Then, using the top result from your search (also shown below), review the metadata for this data set. The metadata contains the answers to help you correctly fill in the blank below:
URBP/ENVS-179 and URBP-278: Introduction to GIS Applications for Urban Planning, Spring Semester 2012 H O M E W O R K A
Page 26 of 27
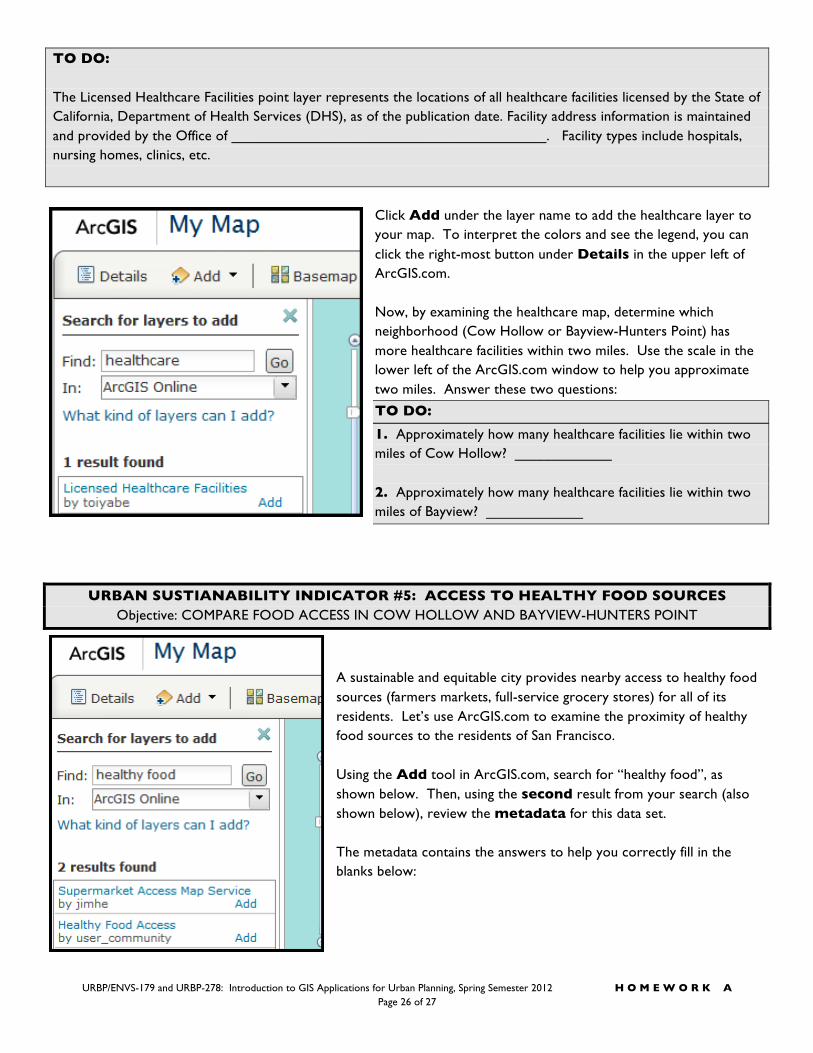
TO DO: The Licensed Healthcare Facilities point layer represents the locations of all healthcare facilities licensed by the State of California, Department of Health Services (DHS), as of the publication date. Facility address information is maintained and provided by the Office of _______________________________________. Facility types include hospitals, nursing homes, clinics, etc.
Click Add under the layer name to add the healthcare layer to your map. To interpret the colors and see the legend, you can click the right-most button under Details in the upper left of ArcGIS.com. Now, by examining the healthcare map, determine which neighborhood (Cow Hollow or Bayview-Hunters Point) has more healthcare facilities within two miles. Use the scale in the lower left of the ArcGIS.com window to help you approximate two miles. Answer these two questions:
TO DO:
1. Approximately how many healthcare facilities lie within two miles of Cow Hollow? ____________ 2. Approximately how many healthcare facilities lie within two miles of Bayview? ____________
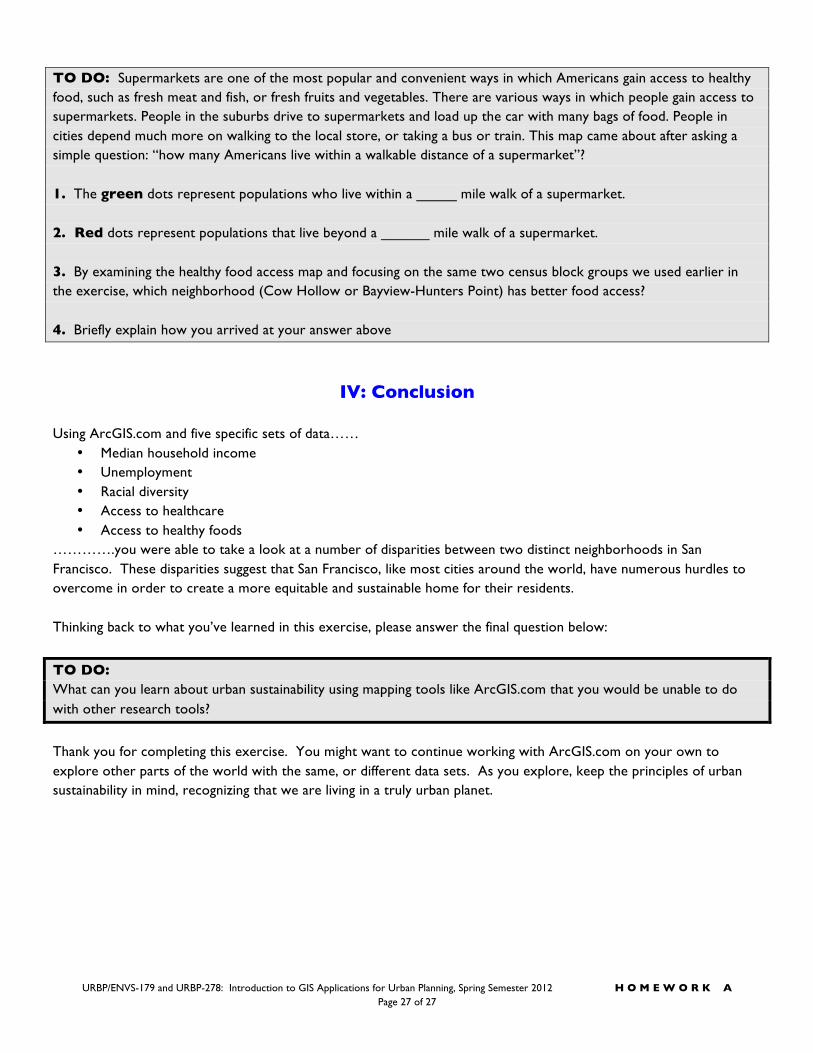
URBAN SUSTIANABILITY INDICATOR #5: ACCESS TO HEALTHY FOOD SOURCES Objective: COMPARE FOOD ACCESS IN COW HOLLOW AND BAYVIEW-HUNTERS POINT
A sustainable and equitable city provides nearby access to healthy food sources (farmers markets, full-service grocery stores) for all of its residents. Let’s use ArcGIS.com to examine the proximity of healthy food sources to the residents of San Francisco. Using the Add tool in ArcGIS.com, search for “healthy food”, as shown below. Then, using the second result from your search (also shown below), review the metadata for this data set. The metadata contains the answers to help you correctly fill in the blanks below:
URBP/ENVS-179 and URBP-278: Introduction to GIS Applications for Urban Planning, Spring Semester 2012 H O M E W O R K A Page 27 of 27
TO DO: Supermarkets are one of the most popular and convenient ways in which Americans gain access to healthy food, such as fresh meat and fish, or fresh fruits and vegetables. There are various ways in which people gain access to supermarkets. People in the suburbs drive to supermarkets and load up the car with many bags of food. People in cities depend much more on walking to the local store, or taking a bus or train. This map came about after asking a simple question: “how many Americans live within a walkable distance of a supermarket”? 1. The green dots represent populations who live within a _____ mile walk of a supermarket. 2. Red dots represent populations that live beyond a ______ mile walk of a supermarket. 3. By examining the healthy food access map and focusing on the same two census block groups we used earlier in the exercise, which neighborhood (Cow Hollow or Bayview-Hunters Point) has better food access? 4. Briefly explain how you arrived at your answer above
IV: Conclusion Using ArcGIS.com and five specific sets of data……
• Median household income • Unemployment • Racial diversity • Access to healthcare • Access to healthy foods
………….you were able to take a look at a number of disparities between two distinct neighborhoods in San Francisco. These disparities suggest that San Francisco, like most cities around the world, have numerous hurdles to overcome in order to create a more equitable and sustainable home for their residents. Thinking back to what you’ve learned in this exercise, please answer the final question below:
TO DO: What can you learn about urban sustainability using mapping tools like ArcGIS.com that you would be unable to do with other research tools?
Thank you for completing this exercise. You might want to continue working with ArcGIS.com on your own to explore other parts of the world with the same, or different data sets. As you explore, keep the principles of urban sustainability in mind, recognizing that we are living in a truly urban planet.