Embed Size (px)
Citation preview
1
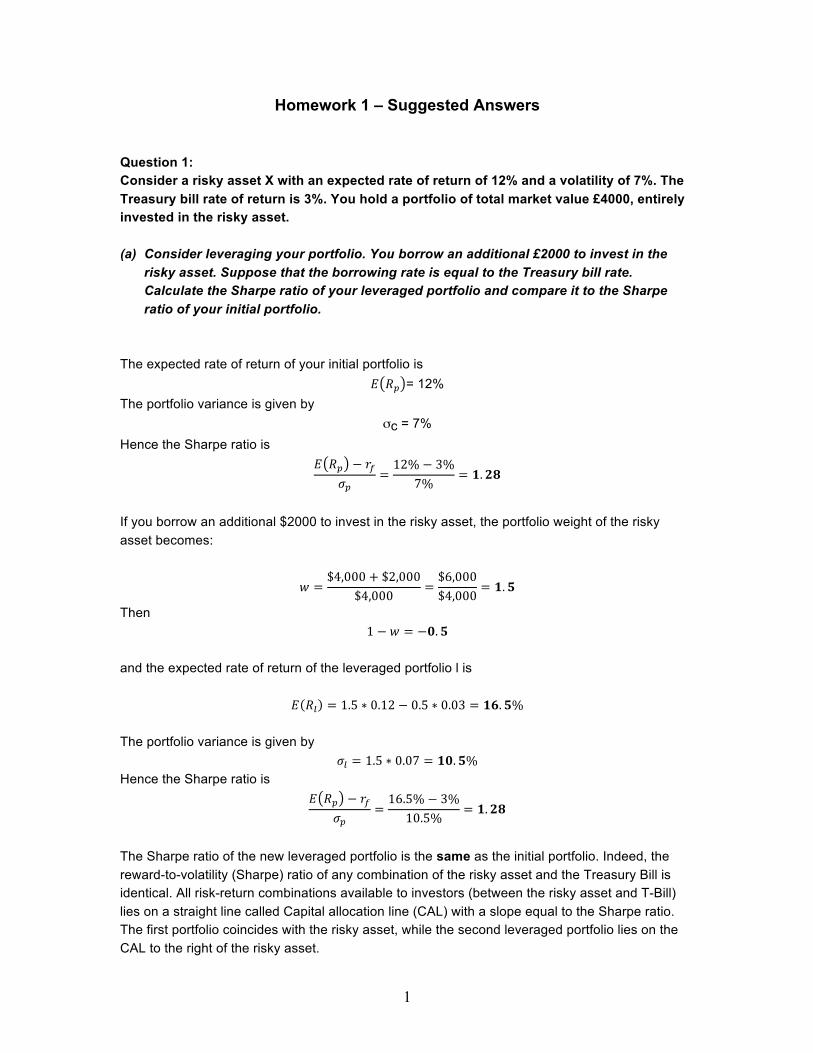
Homework 1 – Suggested Answers
Question 1: Consider a risky asset X with an expected rate of return of 12% and a volatility of 7%. The Treasury bill rate of return is 3%. You hold a portfolio of total market value £4000, entirely invested in the risky asset. (a) Consider leveraging your portfolio. You borrow an additional £2000 to invest in the
risky asset. Suppose that the borrowing rate is equal to the Treasury bill rate. Calculate the Sharpe ratio of your leveraged portfolio and compare it to the Sharpe ratio of your initial portfolio.
The expected rate of return of your initial portfolio is
𝐸 𝑅! = 12% The portfolio variance is given by
σc = 7% Hence the Sharpe ratio is
𝐸 𝑅! − 𝑟!𝜎!
=12% − 3%
7%= 𝟏.𝟐𝟖
If you borrow an additional $2000 to invest in the risky asset, the portfolio weight of the risky asset becomes:
𝑤 =$4,000 + $2,000
$4,000=$6,000$4,000
= 𝟏.𝟓
Then 1 − 𝑤 = −𝟎.𝟓
and the expected rate of return of the leveraged portfolio l is
𝐸 𝑅! = 1.5 ∗ 0.12 − 0.5 ∗ 0.03 = 𝟏𝟔.𝟓% The portfolio variance is given by
𝜎! = 1.5 ∗ 0.07 = 𝟏𝟎.𝟓% Hence the Sharpe ratio is
𝐸 𝑅! − 𝑟!𝜎!
=16.5% − 3%
10.5%= 𝟏.𝟐𝟖
The Sharpe ratio of the new leveraged portfolio is the same as the initial portfolio. Indeed, the reward-to-volatility (Sharpe) ratio of any combination of the risky asset and the Treasury Bill is identical. All risk-return combinations available to investors (between the risky asset and T-Bill) lies on a straight line called Capital allocation line (CAL) with a slope equal to the Sharpe ratio. The first portfolio coincides with the risky asset, while the second leveraged portfolio lies on the CAL to the right of the risky asset.
2
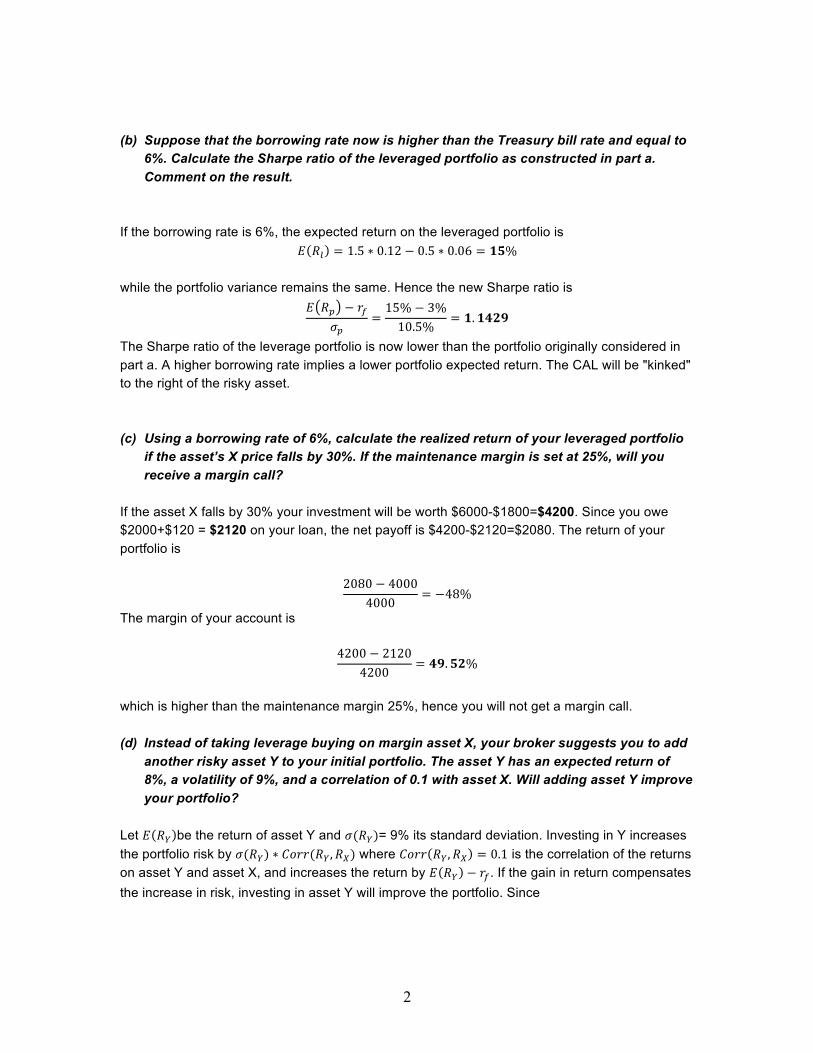
(b) Suppose that the borrowing rate now is higher than the Treasury bill rate and equal to
6%. Calculate the Sharpe ratio of the leveraged portfolio as constructed in part a. Comment on the result.
If the borrowing rate is 6%, the expected return on the leveraged portfolio is
𝐸 𝑅! = 1.5 ∗ 0.12 − 0.5 ∗ 0.06 = 𝟏𝟓% while the portfolio variance remains the same. Hence the new Sharpe ratio is
𝐸 𝑅! − 𝑟!𝜎!
=15% − 3%10.5%
= 𝟏.𝟏𝟒𝟐𝟗
The Sharpe ratio of the leverage portfolio is now lower than the portfolio originally considered in part a. A higher borrowing rate implies a lower portfolio expected return. The CAL will be "kinked" to the right of the risky asset.
(c) Using a borrowing rate of 6%, calculate the realized return of your leveraged portfolio
if the asset’s X price falls by 30%. If the maintenance margin is set at 25%, will you receive a margin call?
If the asset X falls by 30% your investment will be worth $6000-$1800=$4200. Since you owe $2000+$120 = $2120 on your loan, the net payoff is $4200-$2120=$2080. The return of your portfolio is
2080 − 40004000
= −48%
The margin of your account is
4200 − 21204200
= 𝟒𝟗.𝟓𝟐%
which is higher than the maintenance margin 25%, hence you will not get a margin call.
(d) Instead of taking leverage buying on margin asset X, your broker suggests you to add
another risky asset Y to your initial portfolio. The asset Y has an expected return of 8%, a volatility of 9%, and a correlation of 0.1 with asset X. Will adding asset Y improve your portfolio?
Let 𝐸 𝑅! be the return of asset Y and 𝜎(𝑅!)= 9% its standard deviation. Investing in Y increases the portfolio risk by 𝜎(𝑅!) ∗ 𝐶𝑜𝑟𝑟(𝑅!,𝑅!) where 𝐶𝑜𝑟𝑟 𝑅!,𝑅! = 0.1 is the correlation of the returns on asset Y and asset X, and increases the return by 𝐸 𝑅! − 𝑟!. If the gain in return compensates the increase in risk, investing in asset Y will improve the portfolio. Since
3
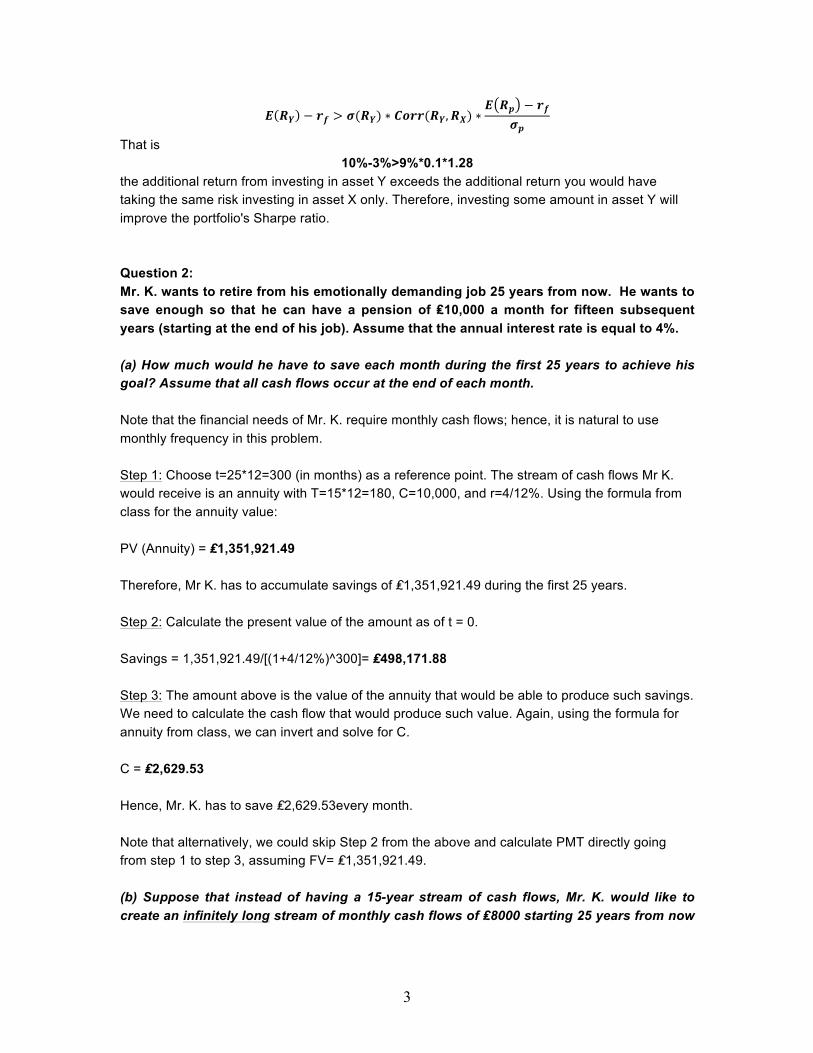
𝑬 𝑹𝒀 − 𝒓𝒇 > 𝝈(𝑹𝒀) ∗ 𝑪𝒐𝒓𝒓(𝑹𝒀,𝑹𝑿) ∗𝑬 𝑹𝒑 − 𝒓𝒇
𝝈𝒑
That is 10%-3%>9%*0.1*1.28
the additional return from investing in asset Y exceeds the additional return you would have taking the same risk investing in asset X only. Therefore, investing some amount in asset Y will improve the portfolio's Sharpe ratio. Question 2: Mr. K. wants to retire from his emotionally demanding job 25 years from now. He wants to save enough so that he can have a pension of ₤10,000 a month for fifteen subsequent years (starting at the end of his job). Assume that the annual interest rate is equal to 4%. (a) How much would he have to save each month during the first 25 years to achieve his goal? Assume that all cash flows occur at the end of each month. Note that the financial needs of Mr. K. require monthly cash flows; hence, it is natural to use monthly frequency in this problem. Step 1: Choose t=25*12=300 (in months) as a reference point. The stream of cash flows Mr K. would receive is an annuity with T=15*12=180, C=10,000, and r=4/12%. Using the formula from class for the annuity value: PV (Annuity) = ₤1,351,921.49 Therefore, Mr K. has to accumulate savings of ₤1,351,921.49 during the first 25 years. Step 2: Calculate the present value of the amount as of t = 0. Savings = 1,351,921.49/[(1+4/12%)^300]= ₤498,171.88 Step 3: The amount above is the value of the annuity that would be able to produce such savings. We need to calculate the cash flow that would produce such value. Again, using the formula for annuity from class, we can invert and solve for C. C = ₤2,629.53 Hence, Mr. K. has to save ₤2,629.53every month. Note that alternatively, we could skip Step 2 from the above and calculate PMT directly going from step 1 to step 3, assuming FV= ₤1,351,921.49. (b) Suppose that instead of having a 15-year stream of cash flows, Mr. K. would like to create an infinitely long stream of monthly cash flows of ₤8000 starting 25 years from now
4
to provide for his descendants. How much would he have to save each month during the first 25 years? This question is very similar, except for Mr. K. wants to receive a perpetuity instead of annuity after 25 years of saving. We assume this perpetuity has a constant cash flow of ₤8,000. The value of perpetuity at the end of year 25 would be: PV (Perpetuity) = C/r = 8000/(4/12%) = ₤2,400,000.00 Therefore, Mr K. has to accumulate savings of ₤2,400,000.00 during the first 25 years. We calculate the present value of the amount as of t = 0. Savings = 2,400,000.00 /[(1+4/12%)^300]= ₤ 884,380.14 The amount above is the value of the annuity that would be able to produce such savings. We need to calculate the cash flow that would produce such value. Using the formula from class: C= ₤4,668.08 Hence, Mr. K. has to save ₤4,668.08 every month. Again, you could have skipped one step by going directly from FV of annuity into the payment. Question 3: You are among the OTC dealers (intermediaries) in the stock of Bio-Engineering, Inc. and quote a bid of 102 1/4 and an ask of 102 1/2. Suppose that you have a zero inventory. (a) On Day 1, you receive buy orders for 10,000 shares and sell orders for 4,000 shares. How much do you earn on the 4,000 shares that you bought and sold? What is the value of your inventory at the end of the day? (Hints: It is possible to have negative inventory. Further, there is more than one correct way to value an inventory, but please state what assumption your valuation is based on.) You have sold 10,000 shares at the ask price of 102 1/2. You bought 4,000 shares at a bid price 102 1/4. Thus, 6,000 shares are sold short (sold without already owning the security). Your revenue from the 4,000 round trip purchase and sale produces a profit equal to the bid minus the ask times the volume done. Hence, the profit on the round trip trades is 0.25*4,000 = 1,000. The value of your inventory is equal to the value of your short position of 6,000 shares. Since there is both a bid and an ask price, this question can be answered in various ways depending on what you assume: The conservative valuation is to value your position at the ask price of 102.50. Then, you have a position of -615,000. This conservative valuation is useful because, if you cover your short
5
position by buying from another dealer at his ask price of 102 1/2, you would have to pay 615,000. (Also, in this example it is the price for which you sold the securities.) The aggressive valuation is to value your position at the bid price of 102.25. Then, you have a position of -613,500 (i.e. less negative than above). This value is implicitly based on an expectation that some investors will come to you and sell you 6000 shares at your current bid price. Often, real-world market makers will value their inventory at the mid-price, in this case 102 3/8. Then, you have a position of -614,250. (b) Before trading begins on Day 2 the company announces trial testing of a cure for acne in mice. The quoted bid and ask jump to 110 1/4-1/2. During Day 2 you receive sell orders for 8,000 shares and buy orders for 2,000 shares. What is your total profit or loss over the two-day period? What is the value of your inventory at the end of Day 2? You have bought 8,000 shares during Day 2 at 110 1/4 and sold 2,000 shares at 110 1/2. On the 2,000 you bought and sold during the day you earn 2,000*0.25 = 500. You also added 6,000 shares to your inventory at a price of 110 1/4. Since you were short 6,000 shares at 102 1/2 from yesterday's trading, your loss on these 6,000 shares is -7.75* 6,000=-46,500. Thus your total profit/loss over the two-day period is 1,000+500-46,500=-45,000. Your inventory at the end of Day 2 is zero since you purchased 6,000 shares that offset the 6,000 share short position at the end of day 1. Note: 10000*102.5-4000*102.25-8000*110.25+2000*110.5=-45000 (c) What is a dealer’s objective? Is there anything you could have done during Day 1, consistent with a dealer’s objective that would have improved your performance over the two-day period? A dealer's objective is to earn the bid-ask spread, and not necessarily to speculate on equilibrium price movements. The 6,000 share short position at the end of Day 1 left him vulnerable to a jump in quoted prices. Perhaps he should have increased the prices during Day 1 as he observed more buying than selling. Also, he could have reduced his short inventory position by buying from other dealers at 102 1/2 as the market closed on Day 1. There are two factors that may have prevented him from doing this: (1) His expected profit of 0.25 on the 6,000 shares if market prices remained unchanged at 102 1/4-1/2. (2) Unwillingness of other dealers to accommodate his purchase of 6,000 shares at the 102 1/2 ask price. Question 4: Suppose that the economy is either in a recession next period or in a boom. Financial markets are frictionless (i.e., you can buy and sell assets without any constraints and transactions costs). Two assets, stocks and gold, are affected differently by the economic environment. The following table summarizes the rates of returns in these two states:
6
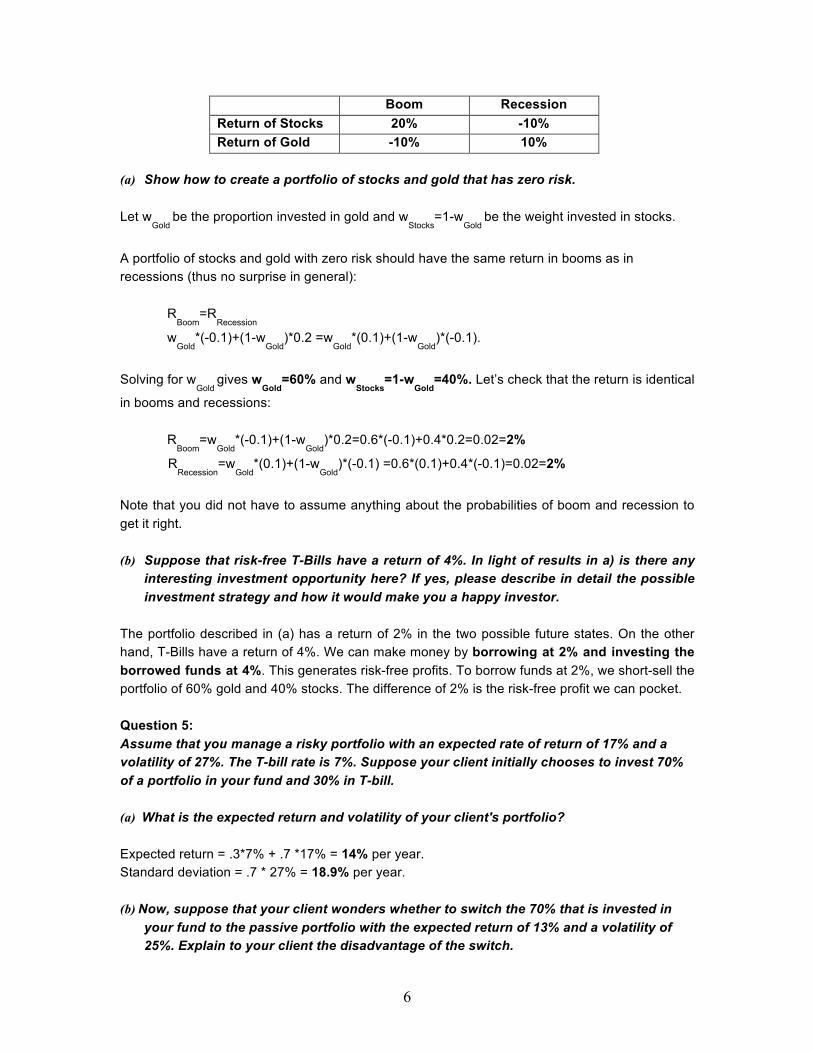
Boom Recession Return of Stocks 20% -10% Return of Gold -10% 10%
(a) Show how to create a portfolio of stocks and gold that has zero risk.
Let w
Gold be the proportion invested in gold and w
Stocks=1-w
Gold be the weight invested in stocks.
A portfolio of stocks and gold with zero risk should have the same return in booms as in recessions (thus no surprise in general):
RBoom
=RRecession
wGold
*(-0.1)+(1-wGold
)*0.2 =wGold
*(0.1)+(1-wGold
)*(-0.1).
Solving for w
Gold gives w
Gold=60% and w
Stocks=1-w
Gold=40%. Let’s check that the return is identical
in booms and recessions: R
Boom=w
Gold*(-0.1)+(1-w
Gold)*0.2=0.6*(-0.1)+0.4*0.2=0.02=2%
RRecession
=wGold
*(0.1)+(1-wGold
)*(-0.1) =0.6*(0.1)+0.4*(-0.1)=0.02=2%
Note that you did not have to assume anything about the probabilities of boom and recession to get it right.
(b) Suppose that risk-free T-Bills have a return of 4%. In light of results in a) is there any
interesting investment opportunity here? If yes, please describe in detail the possible investment strategy and how it would make you a happy investor.
The portfolio described in (a) has a return of 2% in the two possible future states. On the other hand, T-Bills have a return of 4%. We can make money by borrowing at 2% and investing the borrowed funds at 4%. This generates risk-free profits. To borrow funds at 2%, we short-sell the portfolio of 60% gold and 40% stocks. The difference of 2% is the risk-free profit we can pocket. Question 5: Assume that you manage a risky portfolio with an expected rate of return of 17% and a volatility of 27%. The T-bill rate is 7%. Suppose your client initially chooses to invest 70% of a portfolio in your fund and 30% in T-bill. (a) What is the expected return and volatility of your client's portfolio? Expected return = .3*7% + .7 *17% = 14% per year. Standard deviation = .7 * 27% = 18.9% per year.
(b) Now, suppose that your client wonders whether to switch the 70% that is invested in
your fund to the passive portfolio with the expected return of 13% and a volatility of 25%. Explain to your client the disadvantage of the switch.
7
With 70% of his money in my fund's portfolio the client gets a mean return of 14% per year and a standard deviation of 18.9% per year. If he shifts that money to the passive portfolio (which has a mean of 13% and standard deviation of 25%), his overall mean and standard deviation would become: E(rc) = rf + .7(r
M - rf)
In this case, rf = 7% and rM = 13%. Therefore, E(rc) = 7% + .7 * 6% = 11.2% The volatility of the complete portfolio using the passive portfolio would be:
σc = .7 * σM = .7 * 25% = 17.5%
Therefore, the shift entails a decline in the mean from 14% to 11.2% and a decline in volatility from 18.9% to 17.5%. Since both mean return and volatility fall, it is not yet clear whether the move is beneficial or harmful. The disadvantage of the shift is that if my client is willing to accept a mean on his total portfolio of 11.2%, he can achieve it with a lower standard deviation using my fund portfolio, rather than the passive portfolio. To achieve a target mean of 11.2%, we first write the mean of the complete portfolio as a function of the proportions invested in my fund portfolio, y:
E (rc) = 7 + y (17 - 7) = 7 + 10y Because our target is: E(rc) = 11.2%, the proportion that must be invested in my fund is determined as follows:
11.2 = 7 + 10y ⇒ y = 11.2 - 710 = .42
The volatility of the portfolio would be: σc = y * 27 = .42 * 27 = 11.34%. Thus, by using my portfolio, the same 11.2% mean can be achieved with a standard deviation of only 11.34% as opposed to the standard deviation of 17.5% using the passive portfolio. Note: A shorter answer to this question would be to calculate Sharpe ratios for the two strategies and compare their values. The shift would only be beneficial if the relocation increased investors’ Sharpe ratio. Sharpe Ratio (a) = (14%-7%)/18.9% = 0.37 Sharpe Ratio (b) = (13%-7%)/25% = 0.24 As is evident, the Sharpe ratio actually goes down for the alternative strategy; hence, the shift would not be advisable.
8
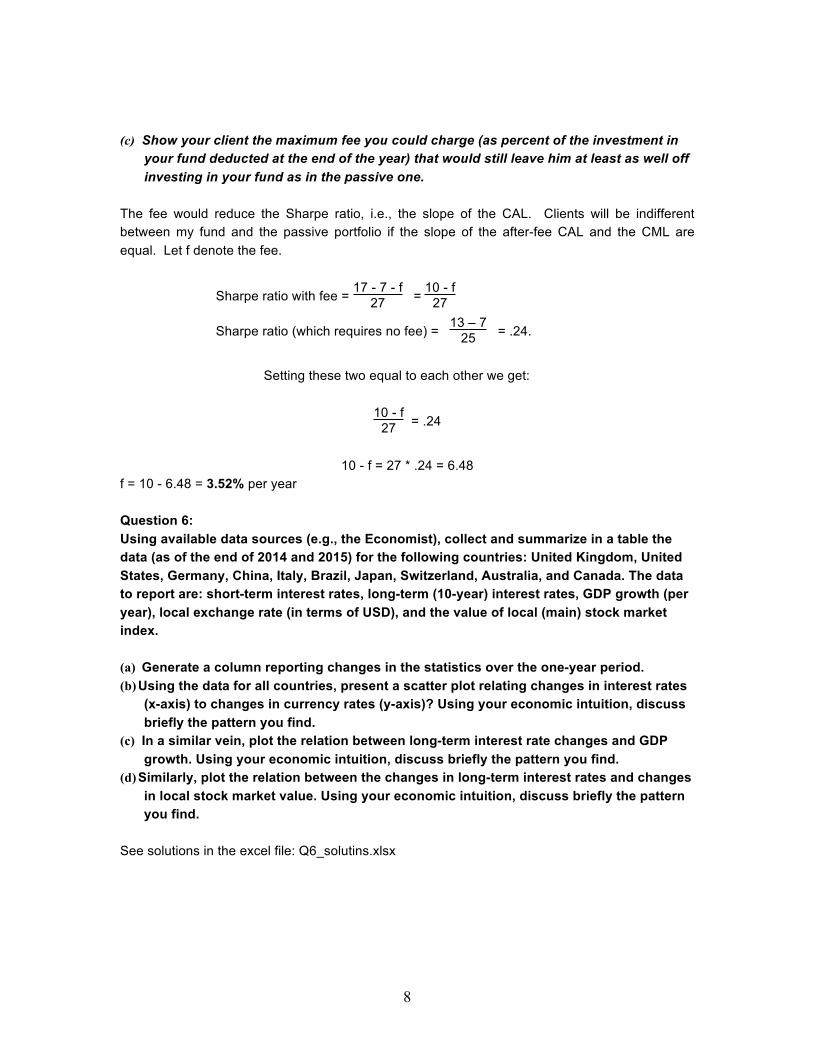
(c) Show your client the maximum fee you could charge (as percent of the investment in
your fund deducted at the end of the year) that would still leave him at least as well off investing in your fund as in the passive one.
The fee would reduce the Sharpe ratio, i.e., the slope of the CAL. Clients will be indifferent between my fund and the passive portfolio if the slope of the after-fee CAL and the CML are equal. Let f denote the fee.
Sharpe ratio with fee = 17 - 7 - f27 = 10 - f
27
Sharpe ratio (which requires no fee) = 13 – 725 = .24.
Setting these two equal to each other we get:
10 - f27 = .24
10 - f = 27 * .24 = 6.48
f = 10 - 6.48 = 3.52% per year Question 6: Using available data sources (e.g., the Economist), collect and summarize in a table the data (as of the end of 2014 and 2015) for the following countries: United Kingdom, United States, Germany, China, Italy, Brazil, Japan, Switzerland, Australia, and Canada. The data to report are: short-term interest rates, long-term (10-year) interest rates, GDP growth (per year), local exchange rate (in terms of USD), and the value of local (main) stock market index. (a) Generate a column reporting changes in the statistics over the one-year period. (b) Using the data for all countries, present a scatter plot relating changes in interest rates
(x-axis) to changes in currency rates (y-axis)? Using your economic intuition, discuss briefly the pattern you find.
(c) In a similar vein, plot the relation between long-term interest rate changes and GDP growth. Using your economic intuition, discuss briefly the pattern you find.
(d) Similarly, plot the relation between the changes in long-term interest rates and changes in local stock market value. Using your economic intuition, discuss briefly the pattern you find.
See solutions in the excel file: Q6_solutins.xlsx