Embed Size (px)
Citation preview

Homeless and Jailed:
Jailed and Homeless
The John Howard Society of Toronto August 2010
Acknowledgements
We are indebted to the many inmates who answered our questions for no recompense than to contribute to this report. We
also wish to express our appreciation to the following people for their kind assistance in this study:
Gregory Brown and Lina Guzzo, Correctional Services Research Committee
Kathy Underhill, Supervisor, Statistics, Community Safety and Correctional Services
John Howard Society of Ontario staff
Lori Shank and Records Department staff, Toronto East Detention Centre
Aldene Buchanan, Toronto West Detention Centre
Mariann Taylor-Baptiste, Sheri Murphy, and Jim Aspiotis, Toronto Jail
Rhonda Frank, Janette Gauthier, and Glen Maitland, Maplehurst Correctional Centre
Gary Reist, Executive Director, John Howard Society of Peel-Halton-Dufferin
Kathryn Lynch, John Howard Society of Peel-Halton-Dufferin
Harvey Low, Acting Manager, Social Research & Analysis Unit, City of Toronto
Tony Doob, Professor, University of Toronto
Paula McLellan, Program Manager, Toronto Bail Program
Cameron Brown, Program Director, Toronto Bail Program
Advisory Committee
The following members of the Advisory Committee were selected for their various forms of expertise and provided critical
assistance with research design, interpretation of results, and development of recommendations:
Greg Rogers, Executive Director, John Howard Society of Toronto
Pat Larson, Nurse Practitioner, Sherbourne Health Centre
Victor Willis, Executive Director, Parkdale Activity and Recreation Centre
Stephen Gaetz, Professor, York University
John Sewell, Co-ordinator, Toronto Police Accountability Coalition
Frances Sanderson, Executive Director, Nishnawbe Homes
Boris Rosolak, Toronto Shelter, Support and Housing Administration, City of Toronto
Funders and Contributors
This research was made possible with funding from the Homelessness Partnering Secretariat of Human Resources and
Development Canada under the Homelessness Knowledge Development Program (HKDP).
Staff of the John Howard Society of Toronto contributed considerably with their expertise and many hours of labour.
Special thanks go to Amber Kellen who conceived, spearheaded, and directed the project. Other staff who conducted
interviews or performed other research tasks include Shallen Murray, Ainsley Cripps, Chris Iantorno, David Raponi-Monk,
Julie Freedman, Karen Mitchell, Lois Powers, Peter Markwell, Christina Faulkner, Jaclyn Bristou, and Vanessa Abel.
Spatial data analysis services were provided courtesy of Professor David Hulchanski, Associate Research Director of the
Cities Centre, University of Toronto.
Research Team
Amber Kellen, Project Director
Julie Freedman, Project Supervisor
Sylvia Novac and Linda Lapointe, Co-researchers
Richard Maaranen, Spatial Data Analyst
Angeline Wong, Lead Interviewer

EXECUTIVE SUMMARY
Previous research has established that being homeless increases the likelihood of ending up in jail, while imprisonment increases the risk of homelessness and the length of time that homeless people spend in shelters. The number of homeless prisoners in Toronto area jails is increasing. And a small, but growing, number of men are caught in a revolving door between jails and shelters.
This report explores the housing situation of adult men serving sentences in Toronto area jails, focusing on those who are homeless. These prisoners‘ housing plans on discharge, as well as their immediate and anticipated service needs in the months after release, are documented. Their residential locations are mapped in relation to selected neighbourhood characteristics.
The survey results are based on interviews with 363 sentenced prisoners who have spent a minimum of five consecutive nights in custody and who are within days of scheduled release from one of four provincial correctional facilities in the Greater Toronto Area.
Among this group, 22.9 percent, or roughly one of every five prisoners, was homeless when incarcerated, that is they were staying in a shelter, living on the street (in places considered unfit for human habitation), in a treatment facility, or staying at the home of a friend, paying no rent. The latter situation is a common form of hidden homelessness; if persons in that situation are excluded, in line with a more conservative definition of homelessness, a total of 19.3 percent were homeless.
The average stay in custody was a little more than two months. Within days of discharge, the prisoners‘ housing plans indicate that their overall projected rate of homelessness would increase by 40 percent. Half of them plan to return to their pre-custody housing situation, even if it meant staying in a shelter, on the street, or using a friend‘s couch. Of those who were homeless before being incarcerated, the majority, 85.5 percent, anticipate being homeless again on discharge. Among prisoners who were housed before being incarcerated, 16.4 percent anticipate being homeless upon discharge.
Thirteen percent of the survey respondents were homeless both before and after being incarcerated.
Overall, 32.2 percent, or almost one of every three prisoners had plans upon discharge to go a shelter, live on the street, or couch-surf at the home of a friend. Another 12 percent of these prisoners are at risk of being homeless since they do not know where they will go. If these two groups are combined, a total of 44.6 percent are homeless or at risk of homelessness. This is a large, identifiable stream of people who should be targeted for assistance to reduce chronic homelessness. Analysts have pointed out repeatedly that relative to other homeless sub-groups, those who are chronically homeless have the greatest need for appropriate housing and services, an investment that would provide the largest social returns (Trypuc and Robinson 2009).
Homeless prisoners are a vulnerable group – they tend to be older, 22.3 percent are 50 years of age or older. A high proportion of them, 43.3 percent, have severe health impairments. Most of them rely on income support programs, whose benefits they lose while in jail; in many cases, they must re-apply for these benefits after they are discharged.
Homeless prisoners requested more types of service to deal with community re-entry than housed prisoners. Yet, almost all the prisoners (95 percent) said they needed various kinds of support.
Overall, the survey respondents were only slightly more likely than the general population to have been living in City-designated priority neighbourhoods which lack adequate services for the needs of residents. Homeless prisoners, however, were more likely to have been living either in priority neighbourhoods, many of which are in the inner suburbs, or downtown where services are concentrated.

Contents 1.0 INTRODUCTION ............................................................................................................................. 1
2.0 METHOLOGY ................................................................................................................................. 5 3.0 SURVEY RESULTS ...................................................................................................................... 12
3.1 Characteristics of Respondents ................................................................................................... 12 3.2 Pre-Custody Housing Situation ................................................................................................... 14 3.3 Pre-Custody Housing Status ....................................................................................................... 16
3.4 Respondents’ Housing Plans on Discharge ................................................................................. 18 3.5 Anticipated Homelessness .......................................................................................................... 20 3.6 Immediate and Anticipated Service Needs ................................................................................. 21
3.7 Residential Locations and Neighbourhood Characteristics ........................................................ 24 4.0 CONCLUSIONS ............................................................................................................................. 27 5.0 RECOMMENDATIONS ................................................................................................................ 29
Appendix A: Description of Toronto Area Jails and Detention Centres .......................................... 30
Appendix B: Tables, Figures, and Maps ........................................................................................... 31 Appendix C: Postscripts .................................................................................................................... 35

1 John Howard Society of Toronto
1.0 INTRODUCTION
Homelessness has become an entrenched problem in urban areas over the past several decades. Since the mid-1990s, senior governments have chosen to address homelessness among its citizens with ad hoc project funding rather than a comprehensive program to develop social housing as in the past. The presumed efficiencies in such an approach require adequate, reliable information to best target limited resources and to account for expenditures. Such information is frequently lacking.
The report addresses a particular knowledge gap; it explores the housing situation of men who are jailed in the Toronto area; their housing options and service needs on discharge, with a focus on homeless prisoners; and maps their residential locations to compare the level of services in the neighbourhoods or areas where they live. The intention is to point to where resources can be directed to minimize chronic or repeat homelessness within this population.
What is Known
U.S. studies have determined that being homeless increases the likelihood of ending up in jail, while imprisonment increases the risk of homelessness, and the length of time that homeless people spend in shelters (Metraux and Culhane 2004). Release from institutions and prisoner re-entry to the community are risk factors for both homelessness and recidivism.
Lack of support services and employment opportunities, as well as disconnection from family members during incarceration, are associated with reintegration failure (Lynch and Sabol 2001). Housing, though, is generally considered the ―lynchpin‖ that holds the re-integration process together‖ (Bradley et al. 2001).
While the scale of homelessness among released prisoners in Canada is unknown, one estimate is that 30 per cent of individuals incarcerated in Canada have no homes to go to upon their release (Zorzi et al. 2006).
Neighbourhood distress has also been flagged as part of the dynamic. Using the home locations of released prisoners, the Justice Mapping Center in the United States identified a pattern of poverty-stricken, resource-poor neighbourhoods, ill-equipped to provide employment opportunities, good housing, or adequate support services. Such research has been used to document the costs, if not futility, of a ‗tough‘ approach to crime. This has motivated at least one state to divert spending from prisons to community services in distressed neighbourhoods as a more effective way to address social problems and reduce recidivism (Gonnerman 2004). In a 2008 series of article on ―Crime and Punishment‖, the Toronto Star newspaper used government-supplied addresses of provincial prisoners to establish that a similar pattern existed in Toronto: prisoners were more likely to live in neighbourhoods where poverty was concentrated.
Chronic Homelessness and Incarceration
A study commissioned for the 1998 Toronto Mayor‘s Homelessness Action Task Force showed that most homeless people who use a shelter do so only once within a period of many years (they are considered transitional users). But about one-fifth of them are chronic (and episodic) shelter users who stay for longer periods of time and return repeatedly. Chronic shelter users are most likely to use emergency rooms for medical care and other institutions, notably jails, thereby drawing heavily on the public purse. Shelter users coming from a correctional facility had a 30 percent probability of spending one year or more in the shelter system (Springer et al 1998).

2 John Howard Society of Toronto
Since then, analysts have provided cost comparisons showing that provision of social housing or supportive housing is less costly than homeless individuals‘ repeat, and frequently inappropriate, reliance on shelters, the emergency health care, social services, and the criminal justice systems, the latter including police, courts, jails, and probation services (City of Toronto 2009; Pomeroy 2005; Eberle 2001).
One report estimates that on a national basis, chronic homelessness costs a total of ―$1.1 billion or $35,000 per homeless person each year through being inappropriately ‗housed‘ in jails and temporary shelters and using hospital emergency departments‖ (Trypuc and Robinson 2009: 1). It is estimated that roughly 15 percent of the prison population were homeless in the year before incarceration, and it cost the Canadian public a total of $412 million in 2006 to house the homeless in correctional institutions, and to provide parole supervision, and police services (Ibid.: 9).
The personal costs to homeless individuals who face repeated losses and crises, and whose lives are in limbo, have yet to be included in anyone‘s computations (Berry et al. 2003).
Recently, the City of Toronto has acknowledged that homelessness among those in correctional facilities is a major issue. The City‘s 2009 Street Needs Assessment included homeless prisoners in its one-day point-in-time count of the homeless; the count combined the number of those in shelters and selected institutions (among them, correctional, health, and treatment facilities) with a tally of the ―outside homeless.‖ Based on data from the Ministry of Community Safety and Correctional Services (MCSCS), 288 prisoners (91.8 percent male) had no fixed address1; this is double the number in the 2006 count, and represents 5.7 percent of the total 2009 homeless count. Homeless prisoners were homeless for longer on average, 4.7 years, than the other sub-groups, except for those sleeping outside (City of Toronto 2009).
An April 2010 staff report acknowledges the success of its one program, the Post-Incarceration Housing Support Services through Streets to Homes, in reducing homelessness among released prisoners. It also pledges the Shelter, Support and Housing Administration staff to work with the Ministry of Community Safety and Correctional Services and local service agencies ―to identify innovative solutions to assist homeless individuals who are incarcerated to find housing upon release‖ (City of Toronto 2010: 7).
The Revolving Door of Homeless Prisoners
The forerunner study to this report, conducted by researchers at the University of Toronto in partnership with the John Howard Society of Toronto, explored various aspects of the relationship between homelessness and the criminal justice system in Toronto (Novac, Hermer, Paradis, and Kellen 2006).
Using administrative data from government sources, this study found that the number of people admitted to a Toronto area jail with no fixed address was small but growing quickly; it had increased by 64 percent between 2001 and 2004. Moreover, a marked pattern of recidivism was evident – four out of ten admissions to jail of a homeless person in a single year were returnees. A growing sub-set of homeless individuals were cycling between shelters and jails, increasingly alienated from the community.
This dynamic predominantly affects men — at least 97 percent of those admitted to a jail with no fixed address were adult males. While homelessness has increased greatly among single women, single mothers, and juveniles of both genders since the 1980s, single adult males still predominate among shelters users and the visibly homeless. Longitudinal research on patterns of homelessness
1 The number of homeless prisoners is based on court records. For the next count in 2012, the City plans to add prisoners who reported a shelter address (which courts may consider a ‗fixed‘ address).

3 John Howard Society of Toronto
confirms that single men are the demographic group facing the greatest difficulties finding and maintaining housing; and they are least likely to obtain subsidized housing (Aubry et al. 2005).
The revolving door pattern was clear, but the extent of the problem was not. Service providers point to evidence that the official statistics severely under-count the number of individuals who were homeless when admitted to jails as well as the number who are homeless when discharged. Reasons for under-reporting by prisoners and under-counting by the criminal justice system are outlined in Novac et al. (2006).
Prison versus Jail Releases
Studies have tended to focus on individuals released from prison, or combined those released from prison with those released from jail. For instance, an Australian study found the rate of homelessness among a group of prison releases was 18 percent prior to incarceration and 21 percent post-release (Baldry et al. 2006). US and Canadian studies have reported incarceration histories among homeless populations ranging from 20 percent to 82 percent, without specifying whether jail or prison terms were involved.
Is it appropriate to generalize such results to jail releases when, in North America at least, jails are for those charged with relatively minor offences and serving short sentences? (In Ontario, jails are under provincial or municipal administration, and the maximum sentence is two years less a day. Jails have fewer amenities, including space, than federally-administered prisons. Jail inmates are not separated by type of offence or crime in jails, as they are in prisons.)
Metraux and Culhane (2006) used administrative databases to determine that 23.1 percent of more than 7,000 shelters users in New York City had been incarcerated within the previous two years. While there was some overlap between those who were in jail and those in prison, the 17 percent who were jailed had a distinct pattern of shelter use compared to the 7 percent who had been in a prison. The jail group stayed in shelters more frequently before and after being incarcerated; their sequential pattern of shelter and jail use ―points to a more prolonged pattern of residential instability‖ (Ibid.: 514), rather than the transitional shelter use pattern typical of prison releases. The authors conclude that different approaches to preventing homelessness are required for those released from jail and prison, and that a distinct prevention approach for jail releases has more potential ―to substantially reduce the demand for shelter among single adults‖ (Ibid.: 515).
Discharge Planning and Service Gaps
Many studies have pointed to inadequate discharge planning and lack of support services and housing options for ex-prisoners as factors in repeat homelessness and recidivism.
Using data from Ontario and British Columbia, Gaetz and O‘Grady (2006) argue that the inadequacy of resources to support prisoner re-entry means that many inmates are left with few options other than to become or remain homeless. These authors outline how provincial government funding reductions have left non-profit organizations to fill the service gaps. As a result, provincial prisoners generally receive little or no effective assistance, and this contributes to continued homelessness (Ibid.)
Another study of prisoners‘ housing options similarly found that while discharge planning and gradual release supports are available for federal inmates in Canada, fewer services are offered to those within provincial institutions:
At the federal level, some supports, such as discharge planning, are available to help a prisoner find suitable housing. At the provincial level, in [Ontario, Quebec, and British Columbia], there was very little in the way of discharge planning and there was a trend away

4 John Howard Society of Toronto
from gradual release. There are no services available to help inmates retain their housing while incarcerated. Most housing services, including supportive housing for special needs groups, are provided by community agencies; these are reported to be under-funded and therefore insufficient to meet the demand (Cathexis Consulting 2007: 3).
The following critical service gaps were identified: 1) discharge planning in provincial facilities; 2) transportation from court to jail to collect belongings; and 3) targeted housing assistance, such as help for inmates to retain their housing, supportive housing for special needs groups, and housing and support services for transitional age youth and elderly offenders (Ibid.).
5 John Howard Society of Toronto
2.0 METHOLOGY
Initially, the researchers attempted to recruit study participants from those being released from courts as well as jails2. A high percentage of inmates in provincial jails in the Toronto area (roughly half) are ―held on remand‖ or in custodial remand (also known as pre-trial detention). Remand inmates are typically released at court with no advance notice. It proved very difficult logistically to continue recruiting at court locations, and this was terminated quite early in the study. Thereafter, recruiting and interviewing was restricted to inmates in jails who were scheduled for release, which effectively meant inmates who were completing sentences.
Inmates were recruited within days of their scheduled release dates, to learn as much as possible about their plans on release, specifically where they would stay or reside.
For a period of seven months, from September 2009 through March 2010, inmates were recruited and interviewed at three jails in the Toronto area: Toronto Jail, Toronto East Detention Centre, and Toronto West Detention Centre. For five consecutive weeks from early November to early December, inmates were also recruited and interviewed at Maplehurst Correctional Centre, located in Milton, Ontario. (See Appendix A for a description of each institution, and Table 7 in Appendix B for the distribution of interviews by site.)
Eligibility Criteria
Some individuals are incarcerated for only a very brief time, from one to a few nights. Out of concern that little would be learned from individuals in this situation, the sample was intentionally skewed toward those with longer stays in custody. It was decided that a minimum of five nights (or days) in custody was enough to potentially put a person‘s work obligations at risk and reduce his income, thereby threatening his ability to pay rent or other housing costs. Persons in custody for five nights or less were excluded. (Inmates who were awaiting deportation were also excluded from the study.)
Questionnaire
A questionnaire was custom-designed to elicit information about the following:
length of custody and type of charge
number of residences and shelter use within the past two years
pre-custody housing situation (location, type of housing, type and length of tenure, and household composition)
planned or anticipated post-custody housing situation (location, type of housing, household composition, reason for not returning to previous residence (if applicable), length of tenure)
post-custody service needs, and
socio-demographic characteristics, including Aboriginal ancestry.3
While the questionnaire was designed to be completed within 15 minutes, many interviewees were anxious to talk to the interviewers, and the average time of interviews in the field was about 20 minutes. The questionnaire relied almost exclusively on closed-ended questions. It was pre-tested with five individuals prior to being finalized. The interviews were conducted by John Howard Society of Toronto staff who had security clearance to see inmates in local jails.
2 The terms jail, detention centre, facility, and institution are used interchangeably. 3 According to local service providers, Aboriginal inmates are especially vulnerable to homelessness when released from jail (John Howard Society of Toronto 2008).

6 John Howard Society of Toronto
Post-discharge Postcards
An attempt was made to include a technique to confirm the residential location of released individuals rather than rely solely on their stated plans. Survey respondents were asked to mail follow-up postcards at one-month and two-month intervals after their release from custody. Respondents were asked to write their current address on the pre-addressed and pre-stamped cards on which interviewers wrote a unique identification code. It was not anticipated that one jail would not permit these postcards to be issued.4 In any case, very few of the post-cards were returned by respondents.5
Ethical Considerations
The study methodology and protocol were approved by the Ethics Review Committee at York University and by the Research Committee of the MCSCS. The MCSCS provided a memo to the jails outlining its permission for us to conduct this study. JHS-T staff negotiated specific protocols in accordance with the needs, resources, and practices of each jail that determined how eligible inmates would be identified and interviews would be arranged.
Ethical guidelines for scholarly research with impoverished participants typically insist that researchers provide a modest benefit or incentive. In compliance with strict government rules, however, the researchers were not allowed to offer any kind of benefit to study participants. Any service information provided by the interviewers was minimal compared to what prisoners can normally receive from contact with John Howard Society workers.
Terms of consent which outlined the voluntary nature of participation in the study, among other things, were reviewed with each eligible, interested inmate. Each study participant signed this document to indicate their understanding of the terms and agreement to take part. Each participant was given a copy of this document, which included contact information in case they later had questions or concerns, or wished to retroactively withdraw from the study.
Sample and Response Rate
Face-to-face interviews were conducted with a total of 363 inmates who had been incarcerated for at least five consecutive nights and were scheduled for release within one week. All but three interviews took place within a jail. Inmates were interviewed within a few days of their scheduled release dates, to learn as much as possible about where they planned to stay or reside.
Despite the lack of any incentive to participate in the survey, the response rate was quite high. Of the 435 eligible inmates who were contacted for the study, 83 percent were interviewed, perhaps not surprising for a literally ―captive audience‖ of people with few diversions or demands on their time. The response rate was virtually the same at each of the three jails where interviewers recruited on the basis of Departure Lists (see below).
4 According to jail staff, these post cards posed potential problems – the paper could be used to roll cigarettes, and the stamps (which were added to cards that had been franked prior to an increase in postage rates) could be steamed off and reused, thereby violating the maximum two-stamp per week rule. Since security concerns applied to the use of metal-stapled pages, a non-staple paper punch was used to bind the six-page questionnaires. We were told that metal staples could be fashioned into a weapon. Metal implements are used for tattooing and may contribute to the transmission of HIV and Hepatitis C, rates of which are high among inmates (PASAN 2002). 5 For future reference, a web-based method of obtaining follow-up information would likely work with younger men, most of whom have an e-mail account.

7 John Howard Society of Toronto
Mechanics of the Recruiting and Interviewing Process
On a weekly basis6, the Records Department of three jails provided the Project Director with Departure Lists of inmates who met the study eligibility criteria. The lists included eligible inmates‘ names, release dates, and birth dates. To ensure that no inmate was recruited or interviewed twice during the period of data collection, the Project Director checked inmates‘ names and birth dates to eliminate duplicate listings.
Once reviewed, the lists were provided to JHS-T staff who conducted the interviews. Most of the interviewers interspersed working on this study with their regular duties and usual schedule of visits to jails. Eventually one staff member was assigned to dedicate a considerable portion of her work to this study; she conducted the vast majority of the interviews.
Due to security concerns and the very large size of one jail, the researchers worked closely with the staff social workers to negotiate a different process. An officer was assigned to recruit eligible inmates, and to escort the interviewer and participating inmates. Albeit for a short period of time, this high level of co-operation and assistance allowed for the consistent use of a prepared introduction and recruiting script that the assigned officer read to each eligible inmate. Interested inmates were led to a private room to review the terms of consent and, if agreeable, complete the interview.
In the other jails, interviewers sometimes approached eligible inmates directly, speaking to them through cell bars or a sally port7, and asked an available guard to escort willing inmates to a private interview room. If upon learning more about the study and terms of consent, the inmate declined to participate, he was escorted back to his cell by the guard. At one jail, professional visitors (including interviewers) are not permitted on the range8. When interviewers were not allowed to approach inmates directly, a guard informed eligible inmates that a John Howard Society worker wanted to see them about this study. If the inmate agreed, he was escorted to an interview room. If not, the interviewer was informed that the inmate declined. Thus, the manner of introduction to the study and recruiting varied.
The vast majority of interviews were conducted in a private interview room with no other person present. Some interviews were conducted in an Activity Room where on occasion another inmate was meeting with their lawyer or a guard was filling out paperwork.
Interviews ranged in length from ten minutes to one hour, but on average were completed within twenty minutes. Many respondents wanted to disclose more information than requested: they wanted to talk about their livelihoods, the challenges they faced in the criminal justice system, and their personal struggle to change their lives and to stay out of the justice system. Interviewers sometimes provided basic referrals to community resources, but did not fulfill any requests to contact a welfare worker or landlord, or obtain a phone number.
Scope of Recruiting
Interviewers attempted to contact all eligible inmates on the Departure Lists, a total of approximately 760 individuals over a seven-month period (September 2009 to March 2010). Due to time restrictions, they were able to contact only 435, or 57% of all those listed. (As noted above, 83 percent of those contacted agreed to be interviewed.) Interviewers simply did not have enough time to see
6 Due to limited staff time, one jail later reduced the frequency of sending these lists to every two weeks. 7 A sally port is a small, contained space in a restricted prison or military area, usually having two doors that are opened and locked in sequence and monitored by a guard who controls entry and exit. 8 A range is a long row of cells that constitute the inmates‘ living area.

8 John Howard Society of Toronto
everyone on the list during their scheduled visits to the facility. This was exacerbated by occasional, unanticipated lockdowns9 which prevented interviewers from beginning or continuing to meet with inmates. In addition, inmates were sometimes unavailable because they were in medical segregation, in the shower, in the yard, at work10, or their location was temporarily unknown. On short notice, some inmates‘ status was changed to ―on hold‖, meaning their release was suspended, usually because additional charges had been filed in the interim. On occasion, the guards were temporarily understaffed and unable to spare an officer to escort an inmate.
Determination of Housing Status
Based on respondents‘ answers to questions about their housing situation, such as housing type, tenure, household composition, etc., respondents were categorized as homeless if they were staying in a shelter, living on the street, in a treatment facility, or couch-surfing at the home of friends. The term couch-surfing refers to tentative arrangements in which no rent is paid and no legal right of tenure exists. Such living arrangements are generally short-term and strained (Robinson and Coward 2003). Those who paid rent and shared bathroom or kitchen facilities with other tenants were categorized as roomers. Those living in self-contained housing (an apartment or house), with or without family members (or in some cases, living with friends and splitting housing costs), were categorized as living in regular, or self-contained, housing.
Definitions
Homeless respondents were:
staying in a shelter or treatment facility,
living on the street or a place considered unfit for human habitation, or
couch-surfing, that is, temporarily staying with friends and paying no rent, a common form of hidden homelessness. Those staying with family members and paying no rent were excluded from this designation.
Health-impaired respondents were:
receiving a disability pension (ODSP) when incarcerated,
placed in the Special Needs Unit of the jail, or
placed in the Medical Unit of the jail.
Individuals who receive a disability pension from the government have a medically-certified physical or psychiatric disability that impairs their ability to be employed. Individuals placed in a Special Needs unit of a jail typically have a severe mental illness.11 Those placed in a Medical Unit are usually chronically ill, or may be suffering from drug withdrawal. Inmates placed in protective custody were not included because that area combines inmates who may be subject to mistreatment from other prisoners (who would have been included, if they could be identified as such) and inmates who are considered a danger to others.
9 A lockdown means that security is tightened. Prisoners are confined to their cells. Some cells may be searched for illegal drugs, weapons, etc. No visitors are allowed. 10 In some jails, inmates have the opportunity to work in a supervised location. For instance, some inmates work in the laundry or prepare packaged meals that are sent to other jails. Inmates are paid a modest amount for this work. 11 A high proportion of prisoners have special needs due to severe mental health issues. Inmates with a mental illness are significantly more likely to have repeat contact with the criminal justice system, and represent a unique mental health/psychiatric subgroup. More than two-thirds of provincial inmates in Ontario require mental health services; and more than 60% of inmates need help to establish a social support system (Brown 2009).

9 John Howard Society of Toronto
Data Analysis
Depending on the level of data, the chi-square test of significance and contingency coefficient were most often used to distinguish group differences that exceeded normal variance.
Respondents‘ addresses before incarceration and the addresses of where they planned to live on release were geo-coded and mapped. Where addresses and postal codes were incomplete or not available, street intersections were coded; when the latter fell on the boundary of two, or more, dissemination areas, they were randomly assigned to one of those areas. Neighbourhood information was drawn from City of Toronto data on transit nodes and designated priority neighbourhoods, and from Statistics Canada data from the Census 2006 Profile Series, and custom calculations.
Study Limitations
Three aspects of the study method and sample selection affect the generalizability of the findings: 1) virtual exclusion from the survey of inmates held on remand; 2) the criterion of a five-day minimum stay in custody; and 3) reliance on inmates‘ self-report plans to assess their post-discharge housing situation.
Exclusion of Inmates Held on Remand
Virtually all the respondents were scheduled for release after having been convicted and serving a sentence. For logistical reasons, our sample excludes those who were held in custodial remand. Individuals are usually held on remand because they are waiting for a bail hearing, to lodge or negotiate a plea, for a trial, or for a sentencing hearing. Only those who are sentenced have pre-determined discharge dates, allowing jails to give us advance notice of who would be released each week.
The researchers tried, but with limited resources were unable, to recruit and interview inmates who were released from court and who met our criterion of having been incarcerated for at least five nights. The volume of eligible released persons was low and erratic. Although they had permission to follow people from the court room to the cells, interviewers found it difficult to visit individuals in the holding cells without waiting several hours. Many individuals returned to jail for one day, even when the judge granted them a release for ‗time served‘. Furthermore, most people were not released until after regular hours (after 5 p.m.), and JHS T staff and volunteers are not permitted to meet with clients when management is not on regular duty or supervision is unavailable. All this proved to be very time consuming and not an efficient use of limited resources.
Minimum five-nights-in-custody criterion
Among sentenced prisoners, those who were in custody for less than five nights were excluded from the survey. The implications of this exclusion are discussed below.
Reliance on Inmates’ Plans to Assess Post-Discharge Housing Situation
Based on past experience of working with inmates, it was known that the plans of about-to-be-released inmates frequently were not realized. It was important for this reason to interview inmates as close to their release date as possible.
While it is possible that respondents may have misled, or lied to, the interviewers, reliance on any kind of self-report information may raise such doubts. The interviewers are seasoned in working with prisoners, and familiar with the range of their circumstances. Most prisoners know about the John Howard Society and understand it to be a non-profit service agency that maintains confidentiality on behalf of its clients. As noted above, study participants received no benefit from participating in the study.

10 John Howard Society of Toronto
Without confirmation of actual post-custody residential locations, however, the findings on housing status on discharge are presented as ―plans‖ rather than outcomes and should be considered with caution, especially for those whose plans included a temporary or interim stay with family or friends.
Sample Representativeness
Selected characteristics of the study sample were compared to MSCSC data on all adult sentenced males released in the past year from the four Toronto area jails where the study was conducted. In 1, below, study sample characteristics are shown in the first column, followed by sentenced inmates in the second column, and remand inmates in the third column.
The average age and age distribution for the study sample and for sentenced inmates are similar, as is the distribution of major types of charges.
Three characteristics differ in this comparison: the average time spent in custody, Aboriginal status, and homeless status.
The average time spent in custody is greater in the study sample, 67 versus 25 days. As this information was collected from inmates, the study data is less reliable than the administrative records of the MCSCS, but it is unlikely that this accounts for such a discrepancy. The eligibility criterion of a minimum of five nights in custody excluded those who were jailed for quite brief periods. The Ministry average time of 25 days suggests that a great number of prisoners serve very short sentences. Unfortunately, more information on this sub-group and whether and how their circumstances and characteristics differ remains to be investigated.
In the Ministry data, only 3 percent of sentenced inmates are Aboriginal. In the study sample, 19 percent are Aboriginal. The MCSCS relies on inmate self-reports to determine Aboriginal status. The study relied on an explicit question of whether the respondent had Aboriginal ancestry. It is likely that the discrepancy is due to the different methods of collecting this information. In Brown‘s (2009) sample of more than 500 provincial inmates in Ontario jails, 23 percent were Aboriginal.
In the Ministry data, 4.6 percent of sentenced inmates have no fixed address; this study found that 19.3 percent of survey respondents were staying in a shelter or living on the street. Some of the reasons why inmates under-report their homeless status to the authorities is outlined in Novac et al. (2006). For this study, respondents were asked a series of questions to carefully probe their housing situation. The differing purposes and methods of collecting this type of information, along with the over-sampling of inmates serving longer sentences, probably accounts for the discrepancy.
How does the exclusion of remand prisoners affect the sample? Virtually all respondents were sentenced inmates, and inmates in custodial remand were effectively excluded from the survey. Has this resulted in the exclusion of those prisoners who are more at risk of homelessness?
Some researchers and service providers consider remanded inmates to be more vulnerable to homelessness. They argue that homeless persons have less access to bail and thus are more often held in remand; that homeless persons are often charged with relatively minor offences, and therefore serve short sentences and are more likely to be released by the courts with no discharge planning (Gaetz and O‘Grady 2007; Novac et al. 2006).
While previous studies suggest that remand inmates are more likely to have a severe mental illness and addictions (and thereby be more vulnerable to homelessness), this is not supported by the recent mental health assessment of inmates in Ontario jails (Brown 2009). In fact, more of the sentenced

11 John Howard Society of Toronto
than remanded male inmates have symptoms of severe mental illness, 44 percent versus 35 percent, respectively.
The Ministry data in Table 1 also shows that sentenced prisoners are more likely than remand prisoners to have no fixed address when incarcerated, 4.6 percent versus 2.9 percent, and to suffer from mental illness, 21.2 percent versus 15 percent, and addiction problems, 43.6 percent versus 22.8 percent.
In summary, we believe the study sample is representative of sentenced prisoners who are in custody for at least five nights. The exclusion of prisoners who serve shorter sentences, however, may slightly skew the results toward over-representing the rate of homelessness among all sentenced prisoners. And housing plans are just that; establishing the housing outcomes of jailed prisoners will require further research.
Table 1: Characteristics of Study Respondents & Sentenced & Remand Releases from Toronto-area Adult
Institutions in 2009-2010*
Study Respondents Sentenced Releases Remand Releases
Total # of releases N = 363 6,524 15,803
Mean Age at Release 36.7 35.3 33.5
‹20 years of age 3.6% 4.6% 8.8%
60+ years of age 2.0% 1.6% 2.0%
Aboriginal Offenders** 19.1% 3.0% 2.8%
Most Serious Offence Type
Violent Offences 18.0%† 18.1% 33.8%
Property Offences 32.7%† 35.3% 21.6%
Drug-related Offences 10.5%† 7.3% 11.7%
Other Offences# 38.9%† 35.9% 29.2%
Mean Sentence Time Served or Remand Days 67 days 24.5 days 21.9 days
No Fixed Address** 22.9% 4.6% 2.9%
Mental Health Alert n/a 21.1% 15.0%
Substance Abuse Alert n/a 43.6% 22.8%
* Source: Ministry of Community Safety and Correctional Services. ** This information is self-reported by the prisoner. † Multiple responses add to more than 100%. # Most ―other‖ offences are administrative justice charges, such as probation and bail violations; includes driving-related offences.

12 John Howard Society of Toronto
3.0 SURVEY RESULTS
3.1 Characteristics of Respondents
Age Distribution
Respondents‘ ages ranged from 18 to 68, with an average age of 37 years. Almost three-quarters of the respondents were aged 25 through 49 years, as shown in Figure 1 below.
Figure 1: Age Group Distribution of Respondents (N = 363)
Compared to the Toronto population of adult males (aged 18 and older), adults aged 25 to 39 years are over-represented, and older adults aged 50 years to 70 are under-represented (see Figure 5 in Appendix B for comparison).
Country of Birth
Most respondents, 72 percent, were born in Canada. The rest were born in a wide range of more than 40 countries. By comparison, one-half of males in the Toronto population were born in Canada.
Aboriginal Ancestry
Inmates who reported having Aboriginal ancestry comprise 19 percent of our sample. In the 2009 City of Toronto homeless count, 15.4 percent of all individuals self-identified as Aboriginal; however, the rate was higher, 23.5 percent, among the sub-group in jails (City of Toronto 2009).
Aboriginal peoples are greatly over-represented among those who are imprisoned, and among those who are homeless. About 1 percent of the Toronto population is Aboriginal.12 (See Figure 6 in Appendix B for respondents‘ ethno-racial background.)
While obviously disadvantaged as a group, Aboriginal respondents did not differ significantly from non-Aboriginal respondents with respect to demographic characteristics, time in jail, type of charge, housing status before incarceration, or anticipated housing status on discharge.
12 According to the 2006 Census, the Aboriginal population is 0.5% of the Toronto population, but agencies serving the Aboriginal community estimate the actual number to be twice as high (City of Toronto 2008).
13.2%
47.1%
27.5%
12.1%
0.0%
10.0%
20.0%
30.0%
40.0%
50.0%
18-24 25-39 40-49 50+
13 John Howard Society of Toronto
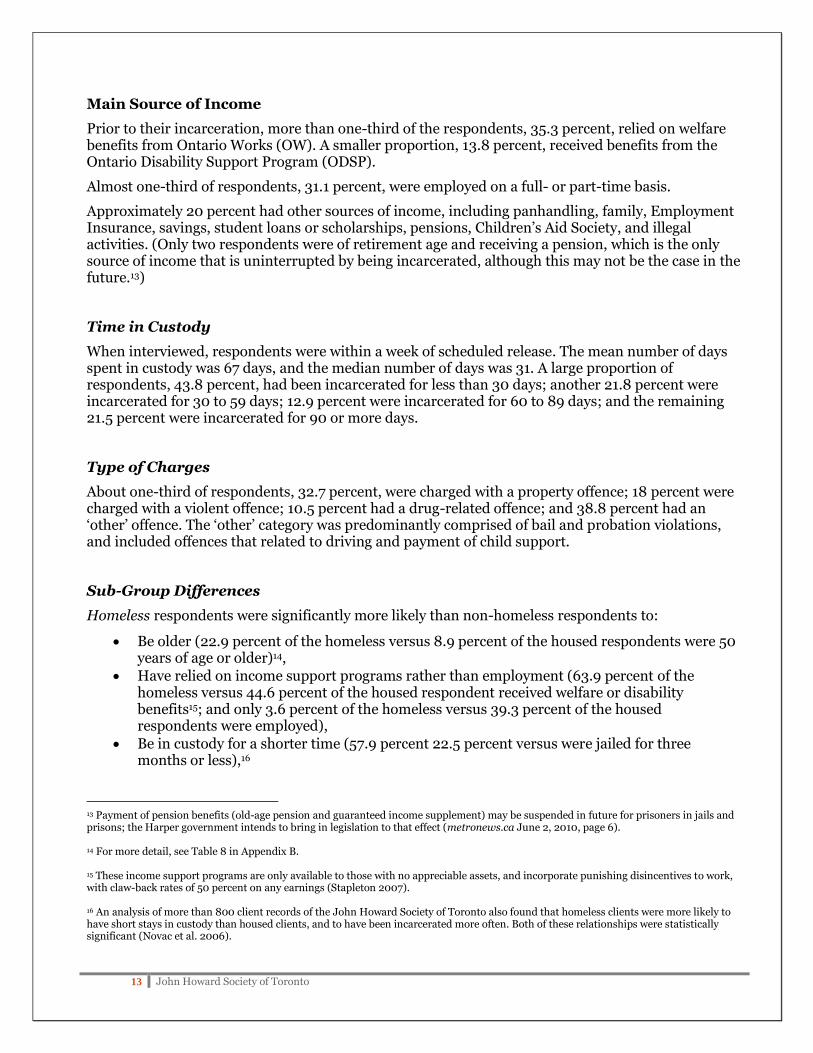
Main Source of Income
Prior to their incarceration, more than one-third of the respondents, 35.3 percent, relied on welfare benefits from Ontario Works (OW). A smaller proportion, 13.8 percent, received benefits from the Ontario Disability Support Program (ODSP).
Almost one-third of respondents, 31.1 percent, were employed on a full- or part-time basis.
Approximately 20 percent had other sources of income, including panhandling, family, Employment Insurance, savings, student loans or scholarships, pensions, Children‘s Aid Society, and illegal activities. (Only two respondents were of retirement age and receiving a pension, which is the only source of income that is uninterrupted by being incarcerated, although this may not be the case in the future.13)
Time in Custody
When interviewed, respondents were within a week of scheduled release. The mean number of days spent in custody was 67 days, and the median number of days was 31. A large proportion of respondents, 43.8 percent, had been incarcerated for less than 30 days; another 21.8 percent were incarcerated for 30 to 59 days; 12.9 percent were incarcerated for 60 to 89 days; and the remaining 21.5 percent were incarcerated for 90 or more days.
Type of Charges
About one-third of respondents, 32.7 percent, were charged with a property offence; 18 percent were charged with a violent offence; 10.5 percent had a drug-related offence; and 38.8 percent had an ‗other‘ offence. The ‗other‘ category was predominantly comprised of bail and probation violations, and included offences that related to driving and payment of child support.
Sub-Group Differences
Homeless respondents were significantly more likely than non-homeless respondents to:
Be older (22.9 percent of the homeless versus 8.9 percent of the housed respondents were 50 years of age or older)14,
Have relied on income support programs rather than employment (63.9 percent of the homeless versus 44.6 percent of the housed respondent received welfare or disability benefits15; and only 3.6 percent of the homeless versus 39.3 percent of the housed respondents were employed),
Be in custody for a shorter time (57.9 percent 22.5 percent versus were jailed for three months or less),16
13 Payment of pension benefits (old-age pension and guaranteed income supplement) may be suspended in future for prisoners in jails and prisons; the Harper government intends to bring in legislation to that effect (metronews.ca June 2, 2010, page 6). 14 For more detail, see Table 8 in Appendix B. 15 These income support programs are only available to those with no appreciable assets, and incorporate punishing disincentives to work, with claw-back rates of 50 percent on any earnings (Stapleton 2007). 16 An analysis of more than 800 client records of the John Howard Society of Toronto also found that homeless clients were more likely to have short stays in custody than housed clients, and to have been incarcerated more often. Both of these relationships were statistically significant (Novac et al. 2006).

14 John Howard Society of Toronto
Be charged with a property-related offence (55.4 percent of homeless versus 30.4 percent of housed respondents) or ‗other‘ charge (31.3 percent of homeless versus 46.8 percent of housed respondents), but less likely to be charged with a violent offence (12 percent of homeless versus 22.1 of housed respondents percent).
Homeless respondents were also significantly more likely than non-homeless respondents to be health-impaired (43.3 percent of homeless versus 26.6 percent of housed respondents), that is, they have a physical or psychiatric disability or chronic illness.
Like those who were homeless, health-impaired respondents were older (21.2 percent of health-impaired were aged 50 or older, see Table 9 in Appendix B for more detail), and relied heavily on income support programs (58.8 percent were receiving disability benefits, and 22.4 percent were receiving welfare benefits; only 8.2 percent of them had employment income versus 39.1 percent of respondents with no health impairment).
3.2 Pre-Custody Housing Situation
Residential Instability
About two-thirds, 68.8 percent, of respondents lived in more than one place during the two years prior to their incarceration. On average, they lived in five places during that two-year period.
Prior Shelter Use
Within the two years prior to their incarceration, 24 percent of respondents had used a shelter.
Length of Stay and Location of Last Place
The median17 length of stay in pre-custody location was about nine months. (See Table 10 in Appendix B for more detail.)
Almost three-quarters, 73 percent, of respondents lived in Toronto. A small number lived outside Toronto, but within the Greater Toronto Area (GTA), while 19 percent of respondents lived outside the GTA.
Household Composition
Most respondents were not living on their own before being incarcerated, 59.5 percent lived with family members or friends.
Sub-Group Differences
While residential instability was characteristic of all respondents, on average, it was most pronounced among homeless respondents. Several indicators reflect this instability.
Within the two years prior to their incarceration, homeless respondents were significantly more likely than non-homeless respondents to have lived in more than one place, 89 percent lived in more than one place. Sixty percent of homeless respondent had lived in more than five places within that time.
17 The median represents the mid-point: half of respondents stayed a longer time, half stayed a shorter time.

15 John Howard Society of Toronto
Compared to respondents who were housed when incarcerated, homeless respondents were much more likely to have stayed in a shelter during the two years prior to their incarceration (70.7 percent of homeless versus 20.6 percent of housed respondents).
On average, regularly-housed respondents stayed for more than one year in their last place of residence. Among health-impaired respondents, the mean length of residence was six months. Among the roomers, it was four months. And among homeless respondents, it was two months.
Living arrangements also varied significantly by sub-group. While 81.7 percent of the regularly-housed lived with family, friends, or a roommate, that figure dropped to 44 percent among roomers, and 13.3 percent among homeless respondents.18 Health-impaired respondents were also less likely to live with others, 47.1 percent did so.
Table 2: Pre-Custody Household Composition by Sub-Groups
Regularly
Housed N = 230
Roomer N = 50
Homeless N = 83
Health-impaired
N = 85
All Respondents
N = 363
Alone 18.3% 66.0% 86.7% 52.9% 40.5%
With spouse/spouse and children 27.9% 4.0% 3.6% 15.3% 19.0%
With adult children .9% 0.0% 0.0% 0.0% .6%
With parents 24.3% 0.0% 0.0% 12.9% 16.0%
With friends 14.8% 24.0% 9.6% 14.1% 14.3%
Other* 13.9% 6.0% 0.0% 4.7% 9.6%
Total 100% 100% 100% 100% 100%
* Most ―others‖ were extended family members.
Health-impaired respondents differed significantly in their pre-custody housing situation. Within the two years prior to incarceration, they were more likely to have used a shelter, 37 percent versus 27 percent of respondents without a disability.
When taken into custody, they were more likely to be homeless, 30 percent versus 17 percent of respondents with no health impairment. More specifically, more of them were living on the street, 13 percent versus 6 percent of respondents with no health impairment. And more of them were roomers, 20 percent versus 11 percent of respondents with no health impairment.
18 Conventional rooming houses are usually intended to accommodate single adults. And while many shelters accommodate only singles,
and are gender-specific, some accommodate couples, and parents with children. A minority of ‗outside homeless‘ are partnered couples.

16 John Howard Society of Toronto
3.3 Pre-Custody Housing Status
More than one-fifth of respondents, 22.9 percent, were homeless (as shown in Figure 2), that is, staying in a shelter or a treatment facility; living on the street or staying in places unfit for habitation (such as an abandoned building)19; or couch-surfing (temporarily staying with friends).
If the more conservative definition of homelessness is applied and respondents who were couch-surfing are excluded, 19.3 percent of respondents were homeless.
Most respondents, 63.4percent, lived in an apartment or a house (that is, a self-contained unit with kitchen and bathroom).
Another 13.8 percent of respondents lived in a rooming house or shared housing (that is, they rented a room and shared kitchen and/or bathroom facilities with people who were not family or friends.) This group included those living in conventional rooming houses, as well as hotels and motels.
Only 3.9 percent of respondents lived in owner-occupied versus rented homes.
More detail on specific housing circumstances is presented in Table 3 below.
Figure 2: Housing Status, Pre-custody (N = 363)
19 The City of Toronto estimates that about 400 individuals live on the street or are considered ―outdoor homeless‖ at any one time (City of Toronto 2009).
Roomer13.7%
Homeless22.9%Regular or self-
contained housing63.4%

17 John Howard Society of Toronto
Table 3: Housing Status, Pre-custody
Housing Status – Broad Categories – Specific Categories number percent number percent
Regular or self-contained housing 230 63.4% House 92 40.0% Apartment 134 58.3% Other20 4 1.7%
Total 230 100% Roomer 50 13.7% Room – not shared 44 88%
Room – shared 6 12% Total 50 100%
Homeless 83 22.9% Shelter 39 47.1% Street 31 37.3%
Couch-surfing 9 10.8% Other21 4 4.8%
Total 363 100% Total 83 100%
Income and Housing Status
While being housed was significantly related to being employed, less than half of the respondents who lived in regular (that is, self-contained) housing were employed, full- or part-time, 33 percent and 11 percent, respectively. Another 38 percent relied on income support programs. The rest had other sources of income, including savings and student loans.
Among roomers, 12 percent were employed, full- or part-time. The majority of roomers, 72 percent, relied on income support programs, most often (60 percent) on welfare.
Among those who were homeless, only 4 percent were employed. Homeless respondents were significantly more likely to have relied on income support programs, 64 percent, most often on welfare, 46 percent. More of the homeless respondents referred to having ―other‖ sources of income, including illegal activities, 31 percent versus 14 percent of those housed.
Forms of Homelessness
Among the 83 homeless prisoners, 51.8 percent were staying in a shelter or treatment facility (as shown in Figure 3 below); 37.3 percent were living on the street or in places considered unfit for human habitation (which included vehicles and abandoned buildings) or staying in a treatment centre; and 10.8 percent were couch-surfing, that is, temporarily staying with friends and paying no rent.
20 This included trailers and farms. 21 This included treatment centres.

18 John Howard Society of Toronto
Figure 3: Forms of Homelessness, Pre-Custody (N = 83)
3.4 Respondents’ Housing Plans on Discharge
Intending to Return to Pre-Custody Place of Residence
Half of the respondents, 50.7 percent, were intending to return to the same place where they lived before being incarcerated. This rate varied according to their pre-custody housing status: a higher proportion of those who lived in self-contained units, 57.4 percent, intended to return, compared to 43.4 percent of those who were homeless, and only 34.8 percent of roomers.
Half of those intending to return expected their stay would be only temporary and last as little as one day. Most of these temporary returnees did not know where they would live next.
Table 4: Returning to Previous Place of Residence by Pre-Custody Housing Status
Homeless
N = 83
Roomer
N = 50
Regular Housing
N = 230
Total
N = 363
Returning 43.4% 32% 57.4% 50.7%
Not Returning 41.0% 54% 34.8% 38.8%
Unsure 15.6% 14% 7.8% 10.5%
Total 100% 100% 100% 100%
in shelter or treatment facility,
51.8%
on the street, 37.3%
couch-surfing, 10.8%

19 John Howard Society of Toronto
Intending Not to Return and Reasons
More than one-third of respondents, 38.8 percent, said they would not return to the same location where they had been living before being incarcerated. Their reasons for not returning were categorized into four general categories:
economic issues (such as rent arrears22, eviction23, inability to afford the rent);
family separation (divorce, conflict, wanting to shield family members);
avoidance (either voluntary to avoid a risky or dangerous environment, or involuntary as part of a court order);
seeking or having a better housing option (a more convenient location, better housing quality); or other.
Economic reasons accounted for 42.9 percent of non-returns; family separation for 17.0 percent; avoidance for 21.5 percent; better housing options for 16.1 percent, and ―other‖: for 2.7 percent.
More of the homeless respondents said they wanted, or were obligated by court order, to avoid their former location, 44.8 percent of homeless versus 19.8 percent of housed respondents; or they wanted or hoped to find a better housing situation, 20.7 percent of homeless versus 13.5 percent of housed respondents.
More of the housed respondents had economic reasons for not returning, 44.4 percent versus 27.6 percent of homeless respondents. Family separation played a role for 19.8 percent of housed versus 6.9 percent of homeless respondents.
The remaining 10.5 percent of respondents were unsure whether they would return or not.
Income Loss
Employment opportunities and adequate income support are fundamental determinants of successful community reintegration.
Prior to being incarcerated, 31.2 percent of respondents were employed, full- or part-time. On discharge, only 19.3 percent still have their jobs or expect to be employed (some admitting their expectations were hopeful) – a drop of 11.9 percent.
More than half of the respondents, 55.4 percent, intended to apply for welfare or disability benefits. Prior to incarceration, a total of 49.2 percent of respondents were receiving such benefits.
Respondents who were receiving welfare benefits will be required to re-apply for benefits.
Respondents who had been receiving disability benefits may be able to re-activate suspended benefits, depending on various factors.
22
Landlords are typically poised to evict a tenant within two weeks of non-payment of rent. Even if the rent is paid, landlords may take back possession of an apparently abandoned apartment, and possessions not claimed within 30 days may be lost. 23 If an inmate lacks a trusted person to pay arrears, deal with the landlord, or attend an eviction hearing, he may lose all his possessions as well as his home. Once an eviction order is issued by the Landlord and Tenant Board, the eviction is enforced by the Sheriff who will change the locks. At this stage, a tenant has very little time to retrieve goods and belongings. After 72 hours the landlord can keep or sell or throw out everything in the apartment.

20 John Howard Society of Toronto
3.5 Anticipated Homelessness
Before incarceration, the rate of homelessness among respondents was 22.9 percent. Within days of discharge, the rate of anticipated or imminent homelessness was 32.2 percent (as shown in Figure 4 below).
Overall, more than one of every ten respondents, or 13 percent, was homeless before being incarcerated and anticipated being homeless again on discharge.
Another 12.4 percent of respondents said they would not go to a shelter, but they did not know where they would go.
Figure 4: Anticipated Housing Status at Discharge (N = 363)
Sub-Group Differences
Most of the homeless respondents, 85.5 percent, anticipated being homeless again on discharge, most
of them going to a shelter. Another 2.4 percent said they would not go to a shelter, but did not know
where they would go. Only a few, 7.2 percent, planned to live in a self-contained unit. The remaining
4.8 percent intended to rent a room.
Health-impaired respondents were more likely than those with no health impairment to say they would be homeless on discharge, 36.5 percent versus 29.9 percent, respectively. They were also more likely to say they would rent a room, 17.6 percent of health-impaired versus 4.1 percent of those with no health impairment; and less likely to say they would have regular housing, 34.1 percent versus 53.3 percent, respectively.
Roomer7.7%
Homeless32.2%
Regular or self-contained housing
47.7%
don't know12.4%

21 John Howard Society of Toronto
3.6 Immediate and Anticipated Service Needs When asked to anticipate their service needs within the next six months, 95 percent of respondents selected at least one type of assistance, and usually more than one type. On average, eight distinct services were specified.
Help with transportation, housing, furniture, and replacing identification documents were the most frequently chosen services:
74 percent of the respondents need assistance with transportation,
70 percent need help obtaining subsidized (that is, rent-geared-to-income) housing,
65 percent need help getting low-cost or free furniture, and
63 percent need help replacing identification documents.
Suggestions for specific assistance included provision of a list of local shelters and transport directly to a shelter or alternate places to stay, which in conjunction with other supports would reduce some of the pitfalls of released inmates having to make their own way, such as lapsing into drug use or engaging in illegal activity.
Most respondents also requested assistance to improve their work-related skills and find a job, as well as help getting clothing and food:
59 percent need education upgrading,
59 percent need employment and skills training,
59 percent need financial help to purchase clothing,
55 percent need help finding work,
55 percent need help to get food, and
52 percent need help applying for income benefits.
Finally, a sizeable portion of respondents want assistance with medical, legal, and literacy issues:
48 percent need help dealing with addictions,
40 percent need psychological counseling,
40 percent need help finding a doctor or health care provider,
32 percent need legal assistance, and
24 percent need to improve literacy skills.
Additional requests were made for parenting classes, anger management classes, an ―ex-con‖ big brother program, opportunities to connect with faith and religious groups, and the return of the community chaplain program (cut due to lost funding) that had provided some discharge planning in the past.
Some respondents wanted services to be available to inmates while in custody, to better prepare them for release and reduce the motivation to re-offend. They also wanted follow-up supports; case workers, not just referrals to various agencies; an integrated, ‗one-stop‘ service; and supportive housing options, instead of shelters.
The length of time incarcerated was not related to the number of services needed. This may mean that spending a short period of time in jail, such as one month, is as disruptive to a prisoner‘s life as a long period of up to two years. In any case, it suggests that provincial prisoners as a group require multi-faceted assistance to successfully re-integrate into the community.

22 John Howard Society of Toronto
Sub-Group Differences
On average, respondents who had been living in regular (that is, self-contained) housing requested a total of seven types of service, significantly fewer than the other sub-groups. Homeless respondents specified the greatest number of service types, ten. Roomers requested nine service types, and those who were health-impaired, about the same.
Among the sub-groups, homeless respondents were most likely to need a full range of services: transportation (91.6 percent), finding affordable housing (89.2 percent), furniture (86.7 percent), clothing (81.9 percent), help replacing documents24 (75.9 percent), food (73.5 percent), applying for income benefits (65.1 percent), help with addiction (63.9 percent), finding employment (61.4 percent), education upgrading (60.2 percent), employment and skills training (55.4 percent), and finding a doctor (55.4 percent).
Table 5: Service Needs by Sub-Group
Homeless
N = 83
Roomer
N = 50
Regularly Housed
N = 230
Health-impaired
N = 85
All Respondents
N = 363
Mean number of services
needed 10.0 9.2 7.1 8.6
Employment & skills training 55.4% 64.0% 59.1% 51.8% 59.0%
Education upgrading 60.2% 58.0% 59.1% 55.3% 59.2%
Literacy skills 21.7% 24.0% 24.3% 28.2% 23.7%
Finding affordable housing 89.2% 86.0% 60.0% 75.3% 70.2%
Help with addiction 63.9% 60.0% 39.1% 57.6% 47.7%
Legal assistance 34.9% 30.0% 31.3% 40.0% 32.0%
Finding employment 61.4% 70.0% 48.7% 49.4% 54.5%
Applying for income benefits 65.1% 60.0% 44.8% 50.6% 51.5%
Counseling 43.4% 50.0% 37.0% 55.3% 40.2%
Finding a doctor 55.4% 54.0% 30.9% 44.7% 39.7%
Low-cost or free clothing 81.9% 76.0% 47.8% 68.2% 59.5%
Low cost or free food 73.5% 72.0% 43.9% 63.5% 54.5%
Low-cost or free furniture 86.7% 78.0% 53.9% 72.9% 64.7%
Transportation 91.6% 80.0% 66.5% 80.0% 74.1%
Help replacing documents 75.9% 62.0% 59.1% 67.1% 63.4
24 It is a challenge for homeless people to keep their most basic possessions safe from theft and loss.

23 John Howard Society of Toronto
Reflecting their exclusion from the workforce, health-impaired respondents were less likely than those with no health impairment to say they would need help with employment and skills training or education upgrading, or help finding employment, but they were more likely than non-impaired respondents to require other types of assistance, especially transportation (80 percent) and finding affordable housing (75.3 percent), furniture (72.9 percent), clothing (68.2 percent), and food (63.5 percent), as well as counseling (55.3 percent).
Of all the sub-groups, roomers were the most likely to want help finding employment (70 percent) and employment and skills training (64 percent). They were also highly likely to need help finding affordable housing (86 percent), transportation (80 percent), furniture (78 percent), clothing (76 percent), food (72 percent), and help with replacing documents (62 percent), applying for income benefits (60 percent), dealing with addiction (60 percent), and education upgrading (58 percent).
Among those who lived in self-contained housing, transportation assistance was the most frequently needed service (66.5 percent), followed by help replacing documents (59.1 percent), employment and skills training (59.1 percent), and education upgrading (59.1 percent).
Postscripts
Since only ten respondents returned the postcards that were designed to confirm their post-custody residential location, their information is of limited value. Nevertheless, we have used them to compile brief narratives, one of which appears below. (See Appendix C for the remaining narratives.)
All ten men lived in self-contained housing before they were incarcerated, that is, they were in the group assumed to be stably housed prior to incarceration.
After being discharged, most of them appeared to be stably housed. Seven of the men returned to their pre-custody residence. Five returned to live with family members or friends.25 This suggests that aside from having the economic means to sustain a household, family support is critical in keeping people housed.
Despite being among the apparently more stably housed respondents, five men wanted help to find affordable housing.
Nine men said they needed services on release, specifying from three to twelve types of assistance. This underscores the widespread need for a range of support services to help prisoners with community re-entry on release from jail.
***
In the two years before being incarcerated for more than a month, Joseph worked part-time and lived in three different places. For the past year, he and his partner rented an apartment downtown. But his partner did not renew the lease (and apparently they would no longer live together), so Joseph, aged 32, was unsure where he would stay when released, but did not plan to go to a shelter. He wanted help to find affordable housing, as well as fourteen other types of service. Within a month of release, he had stayed at four different places.
25 One man was not allowed, by court order, to return to his home.

24 John Howard Society of Toronto
3.7 Residential Locations and Neighbourhood Characteristics
Before their incarceration, respondents were more likely to live in the city core (that is, the City of Toronto, pre-amalgamation) than the general population, 43 percent versus 27 percent (see Table 6 below).
Conversely, respondents were less likely to live in the inner suburbs, overall (former municipalities of North York, Etobicoke, York, East York, and Scarborough), 57 percent versus 73 percent. This pattern applied to each former municipality, except for Scarborough where 29 percent of respondents lived, versus 24 percent of the general population.
A much higher proportion of homeless respondents, 70 percent, lived in the city core or former City of Toronto (See Table 11 in Appendix B for more detail).
The distribution of respondents‘ residential locations, before incarceration, as shown in Map 1, appears to roughly follow the ―poverty U‖ pattern of Toronto‘s lower-income neighbourhoods, as identified in previous research (United Way of Greater Toronto. 2004:18).
Map 1: Residential Location Prior to Incarceration

25 John Howard Society of Toronto
As shown in Map 2, homeless respondents were clearly concentrated in the downtown city core.
Homeless respondents who lived in the inner suburbs were more likely to live in low-income neighbourhoods26 (67 percent of homeless respondents versus 46 percent of housed respondents, and 42 percent of the general population lived in low-income neighbourhoods).
Homeless and Roomers More Likely to Live in Priority Neighbourhoods
Overall, respondents were only very slightly more likely than the general population to live within the City of Toronto‘s thirteen priority neighbourhoods, 23 percent versus 19 percent, as shown in Table 6 below. These areas are slated for modest public investment due to their inadequate level of services and amenities relative to residents‘ poverty and need.
Two sub-groups of respondents, those who were homeless and roomers, were more concentrated in priority neighbourhoods, 28 percent of each sub-group lived there.
Since homeless shelters and services tend to be located close to mass transit nodes, this may account for why homeless respondents live closer to a subway station than do roomers and those in regular housing — 25 percent of homeless respondents lived within 500 metres of a subway station, compared to 14 percent of the Toronto population (see Map 2 and Table 6 below for more detail).
Of the three sub-groups, roomers are located furthest away from a subway station, only 6 percent lived within 500 metres of one.
Map 2: Locations of Homeless Respondents (N = 72)
26 Neighbourhood incomes are based on the median individual income of Dissemination Areas within 500 metres of the respondents‘ place of residence. A low-income neighbourhood is defined as one in which the median individual income is 80 percent or less of the CMA median individual income of $26, 750 before tax for the year 2005.

26 John Howard Society of Toronto
Table 6: Location by Priority Neighbourhood, Transit, and Housing Status (N = 300)*
Homeless
(N = 71)
Roomer
(N = 47)
Regularly
Housed
(N = 182)
All
Respondents
(N = 300)
Toronto
Population
Living in Priority Area
Persons living in a Priority area 28% 28% 20% 23% 19%
Not living in a Priority area 78% 78% 80% 77% 81%
Total 100% 100% 100% 100% 100%
Rapid Transit Accessibility
Persons living within 500 m. of subway
station 25% 6% 15% 16% 14%
Not living within 500 m. of subway
station 75% 94% 85% 84% 86%
Total 100% 100% 100% 100% 100%
Persons living within 1 k. of subway
station 65% 30% 31% 39% 28%
Not living within 1 k. of subway station 45% 70% 69% 61% 72%
Total 100% 100% 100% 100% 100%
* Only addresses located within the City of Toronto were geo-coded for this analysis, reducing the total number to 300.
Total Population (2006) percentages near a subway station were calculated using Dissemination Area centroids.
Total population percentages within Priority Areas were calculated using Census Tracts.
Distribution of Anticipated Locations Post-Discharge
Since half of respondents intended to return to the same location where they previously stayed, and some respondents could not say where they would be living, relatively few respondents had a new address to map.
The overall distribution of post-discharge locations changed only slightly in that relatively more respondents planned to be located in the inner suburbs than before, 62 percent versus 57 percent (see Map 3 in Appendix B).

27 John Howard Society of Toronto
4.0 CONCLUSIONS
The results of this study show that the rate of homelessness is high among sentenced adult male prisoners who have been in custody for at least five consecutive nights in a Toronto area jail — 22.9 percent of the survey respondents were homeless when incarcerated. Even if a more conservative definition of homeless is applied, the rate is 19.3 percent (excluding those couch-surfing with friends, an acknowledged form of hidden homelessness).
Projected Rate of Homelessness Increases on Discharge
The anticipated rate of homelessness increases on discharge. Based on the survey respondents‘ plans upon imminent discharge, 32.2 percent will be homeless. If their projections are realized, the rate of homelessness will increase by 40 percent among the 363 prisoners surveyed— 83 individuals were homeless when they entered jail, and 117 individuals expected to be homeless on leaving jail.
While individual paths varied, most of those who were homeless when incarcerated anticipated being homeless again upon discharge. Some prisoners who were housed when admitted to jail, lost their housing while incarcerated, usually for economic reasons such as rent arrears, and plan to go to a shelter.
Thirteen percent of surveyed prisoners were homeless both before and after being incarcerated.
Beyond those respondents who anticipate being homeless on leaving jail, 12.4 percent of prisoners said they have no idea where they will live.
If this group is combined with those who are homeless, a total of 44.6 percent are homeless or at risk of homelessness. This is a large, identifiable stream of people who should be targeted for assistance to reduce chronic homelessness. Analysts have pointed out repeatedly that relative to other homeless sub-groups, those who are chronically homeless have the greatest need for appropriate housing and services, an investment that would provide the largest social returns (Trypuc and Robinson 2009).
Homeless prisoners are a vulnerable group – they tend to be older, 22.3 percent are 50 years of age or older. A high proportion of them, 43.3 percent, have a severe health impairment. Most of them rely on income support programs, whose benefits they lose while in jail; in many cases, they must re-apply for these benefits after they are discharged.
Almost All Prisoners Want Assistance with Community Re-entry
Homeless prisoners requested more services than those who were housed. Yet, almost all the prisoners (95 percent) said they needed support services. Prisoners‘ immediate needs are basic: transportation from jail and subsidized housing in a safe area, along with the wherewithal to set up a new household, including low-cost or free furniture. They need other forms of assistance as well, including help to replace lost or stolen documents that are fundamental to access basic services and for the exercise of a range of citizenship rights; these include a birth certificate, OHIP card, and social insurance card.
When asked about the types of services they would need, not one of the respondents mentioned that discharge planning was being provided to them and would address their needs.

28 John Howard Society of Toronto
Residential Location and Neighbourhood
Overall, the survey respondents were only slightly more likely than the general population to live in low-income neighbourhoods that lack adequate services for the needs of residents. Homeless respondents, and those who were roomers, were more likely than those living in self-contained housing units to be located in City-designated priority neighbourhoods.
Since half of respondents planned to return to their former residence, and 12 percent did not know where they would live, only a minority of respondents had new post-discharge addresses. The post-discharge distribution of residential locations did not vary substantially from the pre-custody pattern. Nor was there a change in the proportion of respondents who planned to live in a priority neighbourhood.
Income and Housing Losses
More than one of every ten respondents (11.9 percent) lost their job while in jail, increasing the proportion relying on income support programs upon discharge. Economic reasons such as rent arrears and inadequate income accounted for why 42.9 percent of respondents were not returning to their former place of residence. Others were not returning because of family separation or tensions, or for other reasons.
Some respondents, especially homeless respondents, said they were not planning to return to their previous residence, or would avoid doing so, because of the dangers there. In some cases, the perceived threat was associated with a specific building or area where former associates were regular drug users or engaged in anti-social behaviour. In other cases, the danger was inherent in the very poor physical condition of the building in which they had lived, or the immediate area was a ‗hot spot‘ of violent crime.
Other studies of ‗paths of homelessness‘ have noted that housing loss may be due to unsafe conditions, or neighbours, or other negative environmental features of a neighbourhood (Aubry et al. 2007). With increasing socio-economic polarization in urban areas, neighbourhood deterioration reduces the quality of life for residents who cannot afford to obtain a better place (Hulchanski 2007), and ultimately, for everyone (United Way 2004).
A Better Approach is Warranted
It has been well-demonstrated that provision of rent-geared-to income housing and accessible community supports and services are the most effective factors to re-house people and keep them stably housed. For some homeless individuals, a single key service provided at the right time and place is critical; for others an appropriate, on-going combination of complementary services and supports is needed (Aubry et al. 2007; Baulderstone and Beer 2003; Anucha 2003).
Without concerted efforts to assist homeless prisoners obtain affordable, safe housing, along with access to other support services, the cycle of chronic homelessness and costly institutionalization will continue.

29 John Howard Society of Toronto
5.0 RECOMMENDATIONS
That the Government of Ontario should:
1. Adopt a policy that no person is discharged from jails or courts in Ontario be released to the streets without access to adequate, rent-geared-to-income housing.
a. Develop and fund a dedicated stream of rent supplements for homeless individuals
leaving correctional facilities.
b. Develop and fund a rent bank dedicated to helping prisoners maintain their current housing.
c. Fund additional, dedicated transitional and supportive housing for ex-prisoners.
2. Consult with agencies who serve prisoners and ex-prisoners to improve discharge planning services, and increase funding for programs and services to provide discharge planning.
a. Increase funding for non-profit service agencies to provide discharge planning to those being released from jails or courts, including access to adequate, rent-geared-to-income housing.
b. Fund arms-length agencies to determine the housing status of individuals when they enter and leave correctional facilities and identify those who are homeless or at risk of becoming homeless.
c. Initiate discharge planning for inmates on their admission to correctional facilities and
regularly evaluate its effectiveness.
d. Ensure that all persons being released from jail or court and who are identified through the discharge planning process as homeless, or likely to be homeless, are offered and provided with appropriate civilian clothing, a current list of community resources, and public transit fares, at no personal cost.
3. Increase funding for community reintegration programs and services, including those that
support and maintain connections between prisoners and their families.
4. Develop and implement a two-staged admission screening process when individuals enter the correctional system to screen for mental health care needs.
a. Fund training on mental health care issues and needs for nursing staff, correctional officers, and social workers.

30 John Howard Society of Toronto
Appendix A: Description of Toronto Area Jails and Detention Centres
The Ontario Ministry of Community Safety and Correctional Services (MSCSC) is responsible for 31 adult
correctional institutions across the province. In addition, the Ministry is responsible for the provision of
supervision, enforcement, rehabilitative programs and services to adult offenders serving sentences in the
community on probation, conditional sentence, or provincial parole orders. As of January 31, 2009, the
institutional system held an average of 8, 266 adult offenders at any given time. And there were 57, 595 adults
under community supervision.
The Ministry has jurisdiction over offenders 18 years of age and over who are sentenced to terms of
imprisonment of less than two years.27 All four Toronto area jails are provincial institutions. Inmates of these
jails tend to have relatively short terms of stay. Unlike federal prisoners, they are not allowed to have a radio,
television, or computer in their cells.
The Toronto West Detention Centre is a maximum security institution located in the north-west corner of
Toronto (Rexdale). With a designed capacity for 631 male prisoners, it serves adult males who have been
remanded into custody while awaiting trial or sentencing, are serving short sentences, or are awaiting transfer
to federal or provincial correctional facilities.
The Toronto East Detention Centre is a maximum security remand institution located in the eastern end
of Toronto (Scarborough), with a capacity for 473 prisoners.
The Toronto (Don) Jail is a short-term (remand) institution with a capacity for 550 prisoners, located in a
central part of Toronto, near the Don River. The original ―Old Jail‖ closed in 1977; the adjoining ―New Jail‖ was
built in 1958, but remains notorious for its overcrowding and very poor physical conditions. Slated for closure,
it will be replaced by the new Toronto South Detention Centre being built on the site of the former Mimico
Correctional Centre.
Maplehurst Correctional Complex is a medium/maximum security institution located in Milton, Ontario,
30 minutes west of Toronto. Repeatedly expanded over the years, it is now Canada‘s largest jail. Known as the
first ―super-jail‖ in Ontario, it has a capacity for 1,500 male prisoners. Its latest 21st century expansion is based
on a pod design, with self-contained 192-bed units where inmates spend their day, including program areas and
an exercise outdoor yard (20 minutes a day). Sentenced inmates may work in the kitchen, laundry, or do other
scantly-paid jobs. Maplehurst shares its location with the adjacent Vanier Centre for Women, a 333-bed
medium and maximum security facility for remanded and sentenced female offenders.
27 The Ministry also has jurisdiction over those with terms of probation of up to three years, or conditional sentences of up to two years less
a day, as well as offenders under parole supervision, adults on remand awaiting appearance in court (for trial or sentencing), adults held for
immigration hearing or deportation, and offenders awaiting to transfer to federal institutions to serve sentences of two years or more.
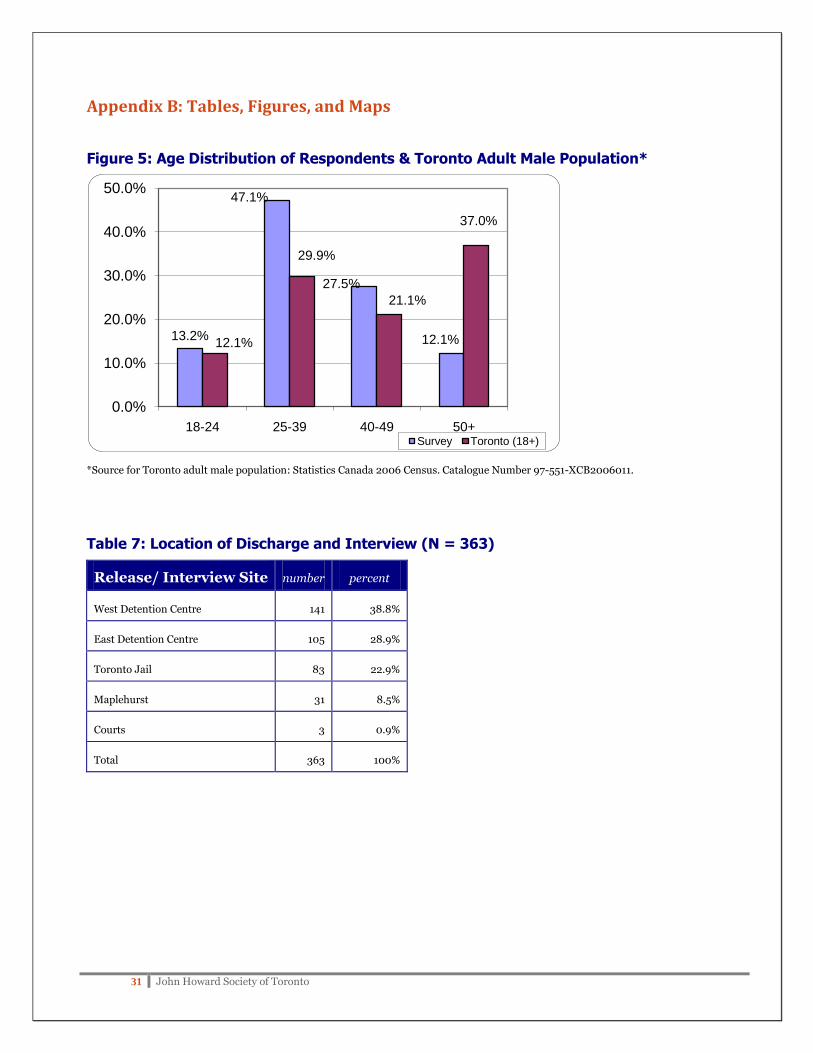
31 John Howard Society of Toronto
Appendix B: Tables, Figures, and Maps
Figure 5: Age Distribution of Respondents & Toronto Adult Male Population*
*Source for Toronto adult male population: Statistics Canada 2006 Census. Catalogue Number 97-551-XCB2006011.
Table 7: Location of Discharge and Interview (N = 363)
Release/ Interview Site number percent
West Detention Centre 141 38.8%
East Detention Centre 105 28.9%
Toronto Jail 83 22.9%
Maplehurst 31 8.5%
Courts 3 0.9%
Total 363 100%
13.2%
47.1%
27.5%
12.1%12.1%
29.9%
21.1%
37.0%
0.0%
10.0%
20.0%
30.0%
40.0%
50.0%
18-24 25-39 40-49 50+Survey Toronto (18+)

32 John Howard Society of Toronto
Figure 6: Respondents’ Ethno-Racial Background (N = 363)
Note: Multiple responses result in a total of more than 100%.
Table 8: Homeless versus Housed Respondents by Age Group
Age Group Homeless Housed Total
number percent number percent number percent
18 to 24 years 7 8% 41 15% 48 13%
25 to 39 years 35 42% 136 49% 171 47%
40 to 49 years 22 27% 78 28% 100 28%
50 and older 19 23% 25 9% 44 12%
Total 83 100% 280 100% 363 100%
Table 9: Respondents with Health-Impairment by Age Group
Age Group Health-impaired
(N = 85)
Non-Health-impaired
(N = 197)
Total*
(N = 282)
18 to 24 years 9.4% 14.7% 13.1%
25 to 39 years 32.9% 50.3% 45.0%
40 to 49 years 36.5% 25.9% 29.1%
50 and older 21.2% 9.1% 12.8%
Total 100% 100% 100%
* Due to missing information for some respondents, the sample size for comparisons involving health impairment is reduced to 282.
4%
7%
19%
25%
60%
0% 20% 40% 60% 80%
Other
Asian
Aboriginal
African/Caribbean
European

33 John Howard Society of Toronto
Table 10: Length of Inmates’ Pre-Custody Residency by Deciles
Sample Divided by Ten (Deciles) Length of Residency
1 to 10% 1 to 11 days
11 to 20% 12 to 42 days
21 to 30% 43 days to 3 months
31 to 40% 3 to 6 months
41 to 50% 6 to 9 months
51 to 60% 9 months to 1 year
61 to 70% 1 to 2 years
71 to 80% 2 to 3 years
81 to 90% 3 to 6 years
91 to 100% 6 to 39 years
Table 11: Pre-Custody Residential Locations in Urban Context
All Respondents
Homeless Roomers
Self-contained City
Population*
number percent number percent number percent number percent
Toronto City core 128 43% 50 70% 22 47% 56 31%% 27%
Inner Suburbs (former York, North York, East York,
Etobicoke, and Scarborough)
172 57% 21 30% 25 53% 126 69% 73%
100% 100% 100% 100% 100%
Scarborough 88 29% 12 17% 12 26% 64 35% 24%
North York 25 8% 2 3% 5 11% 18 10% 25%
Etobicoke 23 8% 4 6% 1 2% 18 10% 13%
York 17 6% 2 3% 6 13% 9 5% 6%
East York 19 6% 1 1% 1 2% 17 9% 4%
Total in City of Toronto 300 100% 71 100% 47 100% 182 100% 100%
Outer Suburbs (905 region) 23 1 1 21
Toronto CMA (City + outer
suburbs)
323 72 48 203
*Based on 2006 Census

34 John Howard Society of Toronto
Map 3: Residential Locations According to Post-Release Plans

35 John Howard Society of Toronto
Appendix C: Postscripts
During the two years before being jailed, Bob28 worked part-time and lived in three different places. For the last seven months he rented a downtown eastside apartment with people who were not family or friends. By a judge‘s order, Bob, aged 49, was not allowed to return to his home. He had no clear plan and was unsure where he would live when released, making a vague reference to friends who might take him in. Assistance to find affordable housing was among the twelve types of services he needed. Within a month of discharge, he stayed in two places close to his former address, perhaps couch-surfing with friends, as he suggested he might do. Another month later, he was living a few blocks way.
***
For the past two years, Curtis received welfare benefits and lived downtown with his mother and sister in a house they rented. After being incarcerated for more than a month, this 33-year old wanted help to find affordable housing, along with eleven other services. His plan was to move back home for three months. Curtis was not sure where he would live after that, or whether he would go to a shelter. Two months after release he was living with his mother and sister.
***
A 47-year-old man with Aboriginal heritage, Dan lived in five different places, including a shelter, in the two years before he was jailed for 69 days. His housing status was unusual and difficult to categorize, but we considered him housed, albeit marginally. For two months he was a live-in employee working downtown part of the week, and staying with friends the rest of the week in their apartment in a west-end suburb. He was one of the very few respondents who said he had no need of any services. His plan on release was to live on the street for a while near the downtown agency that arranges his work assignments, and then return to staying with his friends. One month after release, he was living downtown, but not near the agency.
***
Duane is 23 years old. For the past ten years, he lived with his mother in the townhouse she rents in a west-end suburb. He was working part-time before being jailed for 21 months. He wanted help finding affordable housing, along with six other types of service. His plan was to move back to his mother‘s place for about a year to save some money before going off on his own. Two months after being released, he confirmed that he was living with his mother.
***
George received disability benefits and rented an apartment in a west-end suburb for more than two years before being incarcerated for a month. At age 56, his plan on release was to return to his apartment, for about a year. He wanted help to find affordable housing, along with a wide range of services, twelve in total. Two months after being released, George was living in his former apartment.
***
For nine months prior to being incarcerated for two months, Jack rented an apartment in an east end suburb and received disability benefits. He did not want help with housing, but needed six other types of service. One month after release, Jack, aged 38, confirmed that he was back in his apartment.
***
28 Names are fictitious.

36 John Howard Society of Toronto
Jubal is 46 years old. For the past twenty years he has rented a basement apartment in the heart of downtown. He had a full-time job before serving a jail term of six months. He did not want help finding housing, but he needed six other services. His plan was to return to full-time employment and to his apartment. Two months after being released, Jubal was living in his old apartment.
***
For the past four years, Bill lived with his parents who rent a house in the east side of the city. Before being in custody for a week, he had a full-time job. He did not want any help with housing, but said he needed a few other services. He planned to move back home and resume working at his job. One month later he was living with his parents.
***
For the past two years, John received welfare benefits and lived with his parents who rent an apartment in the east end of the city. He did not need help to find affordable housing, but wanted a few other services. When released after his one-month term in jail, at age 47, John planned to move back with his parents, which is where he was living two months later.

37 John Howard Society of Toronto
References
Anucha, Uzo. 2003. Where do they come from? Why do they leave? Where do they go? A study of tenant exits from
housing for homeless people. Ottawa: Canada Mortgage and Housing Corporation.
Aubry, Tim, Fran Klodawsky, and Cristina Bonetta. 2005. Understanding pathways out of homelessness. Community
Forum on Research alliance to end Homelessness in Ottawa. Online: www.endhomlessnessottawa.ca. Retrieved Sept. 6,
2009.
Aubry, Tim, Fran Klodawsky, Rebecca Nemiroff, Sarah Birnie, and Cristina Bonetta. 2007. Panel study on Persons Who Are
Homeless in Ottawa: Phase 2 results. Final report. University of Ottawa. Online: www.endhomlessnessottawa.ca. Retrieved
Sept. 6, 2009.
Baldry, Eileen, Desmond McDonnell, Peter Maplestone, and Manu Peeters. 2003. Ex-prisoners and accommodation: What
bearing do different forms of housing have on social reintegration? Australian Housing and Urban Research Institute.
Baulderstone, Jo and Andrew Beer. 2003. Evaluation of successful tenancies: Demonstration projects and initiatives.
South Australian Housing Trust.
Berry, Mike, Chris Chamberlain, Tony Dalton, Michael Horn, and Gabrielle Berman. 2003. Counting the costs of
homelessness: A systematic review of cost effectiveness and cost benefit studies of homelessness. Australian Housing and
Urban Research Institute.
Bradley, Katharine, R.B. Michael Oliver, Noel Richardson, and Elspeth Slayter. 2001. No place like home: Housing and the
ex-Prisoner. Community Resources for Justice. Policy Brief. Crime and Justice Institute.
Brown, Greg. 2009. Seriously mentally ill inmates in Ontario correctional facilities: Prevalence, mental health care needs,
and implications for correctional and mental health care policy. Presentation to the Human Services and Justice Co-
ordinating Committee Conference. October 26-28, 2009, Niagara Falls, Ontario.
Calgary Homeless Foundation. Rehousing triage and assessment survey tool. 2009. Available online at ???
Cathexis Consulting Inc. 2007. Housing options upon discharge from correctional facilities. Research Highlight #07-001.
Ottawa: CMHC.
City of Toronto. 2008. Toronto Aboriginal Persons Demographic Snapshot 2006. City of Toronto Social Development,
Finance and Administrative Division.
City of Toronto. 2009. Street needs assessment results. Toronto Shelter, Support & Housing Administration.
City of Toronto. 2010. 2009 Street Needs Assessment: Results and observations. General Manager, Shelter, Support and
Housing Administration.
Eberle, Margaret, Deborah Kraus, Steve Pomeroy, and David Hulchanski. 2001. Homelessness: Cause and effects. Volume
1: The relationship between homelessness and the health, social services and criminal justice systems: A review of the.
British Columbia Ministry of Social Development and Economic Security and BC Housing Management Commission.
Eberle, Margaret, Deborah Kraus, Steve Pomeroy, and David Hulchanski. 2001. Homelessness: Cause and effects. Volume
3: The costs of homelessness in British Columbia. British Columbia Ministry of Social Development and Economic Security
and BC Housing Management Commission.
Gaetz, Stephen and Bill O‘Grady. 2006. The missing link: discharge planning, incarceration and homelessness. Toronto:
The John Howard Society of Ontario.
Gonnerman, Jennifer. 2004. Million-dollar blocks: The neighborhood costs of America‘s prison boom. The Village Voice.
November 19.
Hulchanski, J. David. 2007. The three cities within Toronto: Income polarization among Toronto’s neighbourhoods, 1970-
2000. Research Bulletin #41. Centre for Urban and Community Studies, University of Toronto.
www.NeighbourhoodChange.ca
John Howard Society of Toronto. 2008. Aboriginal post-incarceration study.

38 John Howard Society of Toronto
Lynch, P. J. and W. J. Sabol. 2001. Prisoner Reentry in Perspective. Crime Policy Report 3: 1-24.
Metraux, S. and Dennis Culhane. 2006. Recent incarceration history among a sheltered homeless population. Crime and
Delinquency 52(3): 504-517.
Ministry of Community Safety and Correctional Services. 2008. A safe, strong, secure Ontario. Strategic Plan 2008-2013.
Novac, Sylvia, Joe Hermer, Emily Paradis, and Amber Kellen. 2007. A revolving door? Homeless people and the justice
system in Toronto. Research Bulletin #36. Centre for Urban and Community Studies, University of Toronto.
Novac, Sylvia, Joe Hermer, Emily Paradis, and Amber Kellen. 2006. Justice and Injustice: Homelessness, Crime,
Victimization, and the Criminal Justice System. Research Paper #207.Toronto: Center for Urban and Community Studies,
University of Toronto.
PASAN. 2002. Pros and cons: A guide to creating successful community-based HIV/AIDS programs for prisoners.
Toronto: Prisoners‘ HIV/AIDS Support Action Network (PASAN).
Pomeroy, Steve. 2005. The costs of homelessness: Anaysis of alternative responses in four Canadian cities. Ottawa:
National Secretariat on Homelessness.
Public Safety Canada Portfolio Correction Statistics Committee. 2007. Corrections and conditional release statistical
overview. Ottawa: Public Works and Government Services Canada.
Robinson, David and Sarah Coward. 2003. Your place, not mine: The experiences of homeless people staying with family
and friends. London: CRISIS.
Springer, Joe, James Mars, and Melissa Dennison. 1998. A profile of the Toronto homeless population. Background paper
#20. Volume II. City of Toronto: Taking responsibility for homelessness: An action plan for Toronto. Mayor‘s
Homelessness Action Task Force.
Stapleton, John. 2007. Why is it so tough to get ahead? How our tangled social programs pathologize the transition to
self-reliance. Toronto: Metcalf Foundation.
Statistics Canada. 2008. Neighborhood characteristics and the distribution of crime: Edmonton, Halifax and Thunder
Bay. Ottawa: Minister of Industry.
Trypuc, Bri and Jeffrey Robinson. 2009. Homeless in Canada: A funder’s primer in understanding the tragedy on
Canada’s streets. Charity Intelligence Canada.
United Way of Greater Toronto. 2004. Poverty by postal code: The geography of neighbourhood poverty, City of Toronto,
1981-2001.
Zorzi, Rochelle, Susan Scott, Diane Doherty, Anne Engman, Claude Lauzon, Melissa McGuire, and Jim Ward. 2006.
Housing options upon discharge from correctional facilities. Ottawa: Canada Mortgage and Housing Corporation.