Embed Size (px)
Citation preview
Home victory for Brazil in the 2014FIFA World Cup
Achim Zeileis, Christoph Leitner,Kurt Hornik
Working Papers in Economics and Statistics
2014-17
University of Innsbruck
http://eeecon.uibk.ac.at/

University of InnsbruckWorking Papers in Economics and Statistics
The series is jointly edited and published by
- Department of Economics
- Department of Public Finance
- Department of Statistics
Contact Address:
University of Innsbruck
Department of Public Finance
Universitaetsstrasse 15
A-6020 Innsbruck
Austria
Tel: + 43 512 507 7171
Fax: + 43 512 507 2970
E-mail: [email protected]
The most recent version of all working papers can be downloaded at
http://eeecon.uibk.ac.at/wopec/
For a list of recent papers see the backpages of this paper.
Home Victory for Brazil in the
2014 FIFA World Cup
Achim ZeileisUniversitat Innsbruck
Christoph LeitnerWU Wirtschafts-universitat Wien
Kurt HornikWU Wirtschafts-universitat Wien
Abstract
After 36 years the FIFAWorld Cup returns to South America with the 2014 event beinghosted in Brazil (after 1978 in Argentina). And as in all previous South American FIFAWorld Cups, a South American team is expected to take the victory: Using a bookmakerconsensus rating – obtained by aggregating winning odds from 22 online bookmakers – theclear favorite is the host Brazil with a forecasted winning probability of 22.5%, followedby three serious contenders. Neighbor country Argentina is the expected runner-up witha winning probability of 15.8% before Germany with 13.4% and Spain with 11.8%. Allother competitors have much lower winning probabilities with the “best of the rest” beingthe “insider tip” Belgium with a predicted 4.8%. Furthermore, by complementing thebookmaker consensus results with simulations of the whole tournament, predicted pairwiseprobabilities for each possible game at the FIFA World Cup are obtained along with“survival”probabilities for each team proceeding to the di↵erent stages of the tournament.For example, it can be inferred that the most likely final is a match between neighborsBrazil and Argentina (6.5%) with the odds somewhat in favor of Brazil of winning such afinal (with a winning probability of 57.8%). However, this outcome is by no means certainand many other courses of the tournament are not unlikely as will be presented here.
All forecasts are the result of an aggregation of quoted winning odds for each teamin the 2014 FIFA World Cup: These are first adjusted for profit margins (“overrounds”),averaged on the log-odds scale, and then transformed back to winning probabilities. More-over, team abilities (or strengths) are approximated by an “inverse” procedure of tourna-ment simulations, yielding estimates of probabilities for all possible pairwise matches atall stages of the tournament. This technique correctly predicted the EURO 2008 final(Leitner, Zeileis, and Hornik 2008), with better results than other rating/forecast meth-ods (Leitner, Zeileis, and Hornik 2010a), and correctly predicted Spain as the 2010 FIFAWorld Champion (Leitner, Zeileis, and Hornik 2010b) and EURO 2012 Champion (Zeileis,Leitner, and Hornik 2012).
Keywords: consensus, agreement, bookmakers odds, tournament, 2014 FIFA World Cup.
1. Bookmaker consensus
In order to forecast the winner of the 2014 FIFA World Cup, we obtained long-term winningodds from 22 online bookmakers (see Tables 2 and 3 at the end). However, before these oddscan be transformed to winning probabilities, the stake has to be accounted for and the profitmargin of the bookmaker (better known as the “overround”) has to be removed (for furtherdetails see Henery 1999; Forrest, Goddard, and Simmons 2005). Here, it is assumed that the

2 Home Victory for Brazil in the 2014 FIFA World Cup
Prob
abilit
y (%
)
BRAARG
GERESP
BELFRA ITA URU
COLPOR
NEDENG CHI
RUS SUIMEX CIV JP
NECU
CRO BIHUSA
GHANGR
GREKOR
CMRAUS
ALG IRICRC
HON
05
1015
2025
Figure 1: 2014 FIFA World Cup winning probabilities from the bookmaker consensus rating.
quoted odds are derived from the underlying “true” odds as: quoted odds = odds · �+1, where+1 is the stake (which is to be paid back to the bookmakers’ customers in case they win)and � < 1 is the proportion of the bets that is actually paid out by the bookmakers. Theoverround is the remaining proportion 1�� and the main basis of the bookmakers’ profits (seealso Wikipedia 2014 and the links therein). Assuming that each bookmaker’s � is constantacross the various teams in the tournament (see Leitner et al. 2010a, for all details), we obtainoverrounds for all 22 bookmakers with a median value of 15.0%.
To aggregate the overround-adjusted odds across the 22 bookmakers, we transform themto the log-odds (or logit) scale for averaging (as in Leitner et al. 2010a). The bookmakerconsensus is computed as the mean winning log-odds for each team across bookmakers (seecolumn 4 in Table 1) and then transformed back to the winning probability scale (see column 3in Table 1). Figure 1 shows the barchart of winning probabilities for all 32 competing teams.
According to the bookmaker consensus, Brazil is most likely to take a home victory (withprobability 22.5%) and the expected runner-up is Argentina with a clearly lower probabil-ity of winning the tournament (15.8%). The defending FIFA World Champion and EUROChampion Spain has only the fourth highest winning probability of 11.8% behind Germany(13.4%). Team Belgium, which played a strong qualification tournament and is considered bysome to be an “insider tip”, is the “best of the rest” already with a rather small winning prob-ability of 4.8%. Subsequently, there is a large group of teams with moderately low winningprobabilities, including former FIFA World Champions France, Italy, Uruguay, and England,followed by another large group of teams with negligible chances of winning.
Although forecasting the winning probabilities for the 2014 FIFA World Cup is probably ofmost interest, we continue to employ the bookmakers’ odds to infer the contenders’ relativeabilities (or strengths) and the expected course of the tournament. To do so, an “inverse”tournament simulation based on team-specific abilities is used. The idea is the following:
1. If team abilities are available, pairwise winning probabilities can be derived for eachpossible match (see Section 2).
2. Given pairwise winning probabilities, the whole tournament can be easily simulated tosee which team proceeds to which stage in the tournament and which team finally wins.
3. Such a tournament simulation can then be run su�ciently often (here 100,000 times)to obtain relative frequencies for each team winning the tournament.
Achim Zeileis, Christoph Leitner, Kurt Hornik 3
Team FIFA code Probability Log-odds Log-ability GroupBrazil BRA 22.5 �1.236 �2.128 AArgentina ARG 15.8 �1.675 �2.442 FGermany GER 13.4 �1.870 �2.486 GSpain ESP 11.8 �2.015 �2.479 BBelgium BEL 4.8 �2.991 �2.952 HFrance FRA 3.8 �3.242 �3.086 EItaly ITA 3.5 �3.330 �3.033 DUruguay URU 3.2 �3.411 �3.058 DColombia COL 3.1 �3.457 �3.081 CPortugal POR 2.9 �3.526 �3.131 GNetherlands NED 2.8 �3.534 �3.040 BEngland ENG 2.6 �3.616 �3.125 DChile CHI 2.1 �3.861 �3.148 BRussia RUS 1.0 �4.570 �3.518 HSwitzerland SUI 0.8 �4.811 �3.619 EMexico MEX 0.6 �5.067 �3.558 AIvory Coast CIV 0.6 �5.078 �3.573 CJapan JPN 0.6 �5.151 �3.588 CEcuador ECU 0.6 �5.174 �3.691 ECroatia CRO 0.6 �5.180 �3.588 ABosnia-Herzogovina BIH 0.5 �5.226 �3.730 FUSA USA 0.5 �5.385 �3.654 GGhana GHA 0.4 �5.451 �3.672 GNigeria NGR 0.3 �5.659 �3.826 FGreece GRE 0.3 �5.721 �3.796 CSouth Korea KOR 0.2 �6.044 �3.910 HCameroon CMR 0.1 �6.581 �3.928 AAustralia AUS 0.1 �6.654 �3.827 BAlgeria ALG 0.1 �7.304 �4.237 HIran IRI 0.1 �7.341 �4.215 FCosta Rica CRC 0.1 �7.525 �4.184 DHonduras HON 0.0 �7.630 �4.275 E
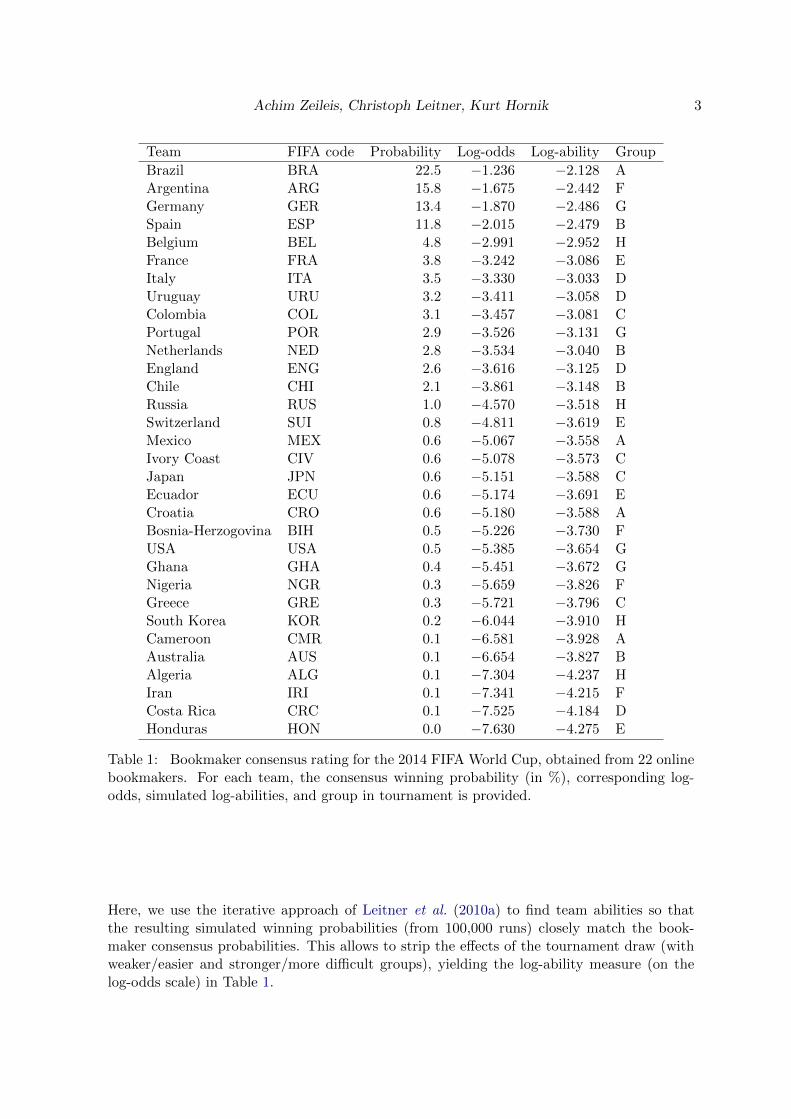
Table 1: Bookmaker consensus rating for the 2014 FIFA World Cup, obtained from 22 onlinebookmakers. For each team, the consensus winning probability (in %), corresponding log-odds, simulated log-abilities, and group in tournament is provided.
Here, we use the iterative approach of Leitner et al. (2010a) to find team abilities so thatthe resulting simulated winning probabilities (from 100,000 runs) closely match the book-maker consensus probabilities. This allows to strip the e↵ects of the tournament draw (withweaker/easier and stronger/more di�cult groups), yielding the log-ability measure (on thelog-odds scale) in Table 1.
4 Home Victory for Brazil in the 2014 FIFA World Cup
2. Pairwise comparisons
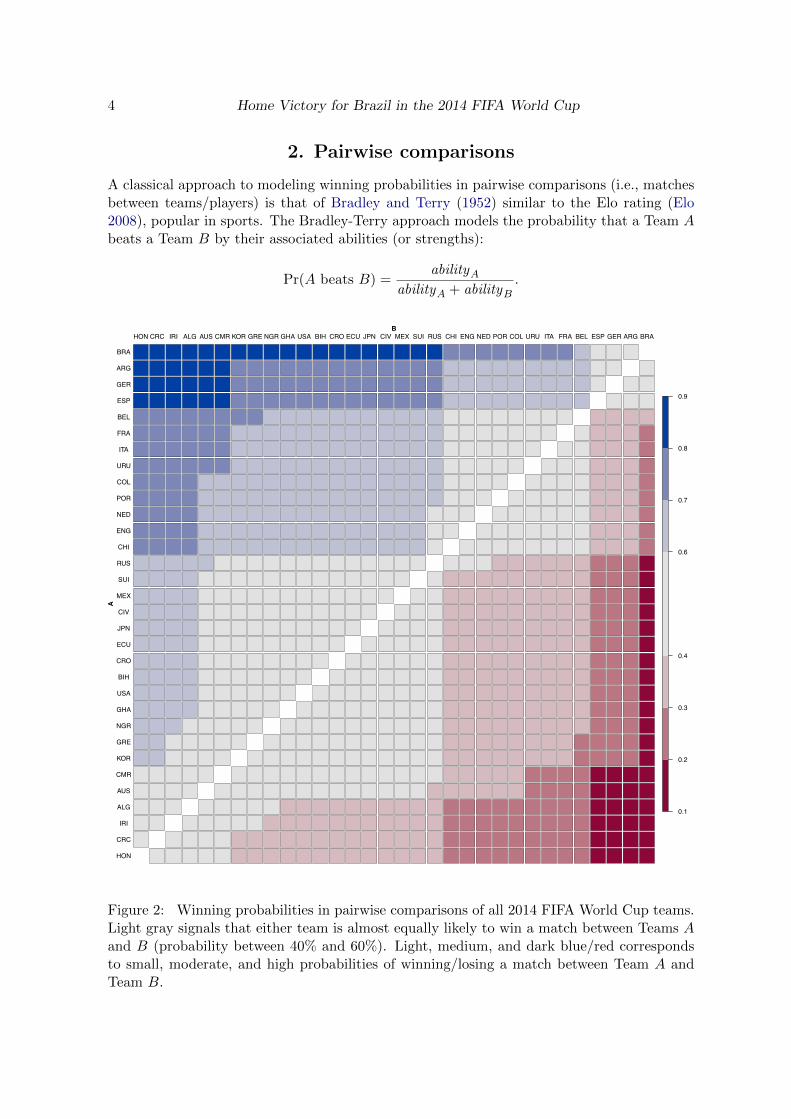
A classical approach to modeling winning probabilities in pairwise comparisons (i.e., matchesbetween teams/players) is that of Bradley and Terry (1952) similar to the Elo rating (Elo2008), popular in sports. The Bradley-Terry approach models the probability that a Team Abeats a Team B by their associated abilities (or strengths):
Pr(A beats B) =abilityA
abilityA + abilityB.
0.1
0.2
0.3
0.4
0.6
0.7
0.8
0.9
B
A
HON
CRC
IRI
ALG
AUS
CMR
KOR
GRE
NGR
GHA
USA
BIH
CRO
ECU
JPN
CIV
MEX
SUI
RUS
CHI
ENG
NED
POR
COL
URU
ITA
FRA
BEL
ESP
GER
ARG
BRA
HON CRC IRI ALG AUS CMR KOR GRE NGR GHA USA BIH CRO ECU JPN CIV MEX SUI RUS CHI ENG NED POR COL URU ITA FRA BEL ESP GER ARG BRA
Figure 2: Winning probabilities in pairwise comparisons of all 2014 FIFA World Cup teams.Light gray signals that either team is almost equally likely to win a match between Teams Aand B (probability between 40% and 60%). Light, medium, and dark blue/red correspondsto small, moderate, and high probabilities of winning/losing a match between Team A andTeam B.

Achim Zeileis, Christoph Leitner, Kurt Hornik 5
As explained in Section 1, the abilities for the teams in the 2014 FIFAWorld Cup can be chosensuch that when simulating the whole tournament with these pairwise winning probabilitiesPr(A beats B), the resulting winning probabilities for the whole tournament are close to thebookmaker consensus winning probabilities. Table 1 reports the log-abilities for all teams andthe corresponding pairwise winning probabilities are visualized in Figure 2.
Clearly, the bookmakers perceive Brazil to be the strongest team in the tournament withmoderate (70–80%) to high (> 80%) probabilities to beat almost any other team in thetournament. The only group of teams that get close to having even chances are Argentina(with probability of 42.2% of beating Brazil), Germany (with 41.3%), and Spain (with 41.2%).Behind these four strongest teams two or three bigger clusters of teams can be seen, each ofwhich are approximately of the same strength (i.e., yielding approximately even chances ina pairwise comparison). Interestingly, three of the nine teams immediately behind the top 4have to compete in the same group D: Italy, Uruguay, and England. Hence, this group isboth particularly strong and homogeneous, so that it is likely to be very exciting.
3. Performance throughout the tournament
Based on the teams’ inferred abilities and the corresponding probabilities for all matchesfrom Section 2 the whole tournament is simulated 100,000 times. As expounded above, theabilities have been calibrated such that the simulated winning proportions for each time closelymatch the bookmakers’ consensus winning probabilities. So with respect to the probabilitiesof winning the tournament, there are no new insights. However, the simulations also yieldsimulated probabilities for each team to “survive” over the tournament, i.e., proceed from thegroup-phase to the round of 16, quarter- and semi-finals, and the final.
Figure 3 depicts these “survival” curves for all 32 teams within the groups they were drawnin. Clearly, Brazil and Argentina are the clear favorites within their respective groups A andF with almost 100% probability to make it to the round of 16 whereas all remaining teamshave much poorer chances to proceed to the later stages of the FIFA World Cup. The nextbest teams, Germany and Spain, face much harder groups: Germany plays in group G againstPortugal while Spain has to prevail against two strong contenders, The Netherlands and Chile.Group D, as already mentioned above, is particularly well-balanced with three former FIFAWorld Champions all of which have about equal chances to proceed. The remaining groups C,E, and H are also somewhat balanced but not as tight as group D. Also observe that for someof the groups the curves are rather flat (e.g., F and G) while in other groups there are clearkinks at some stage. The latter indicates that there is a high likelihood of encountering aparticularly strong team at that stage. However, note that even the weakest teams in thetournament have probabilities of about 20% to proceed to the round of 16 indicating that thecurves just reflect average expected performance and that surprises are by no means unlikely.
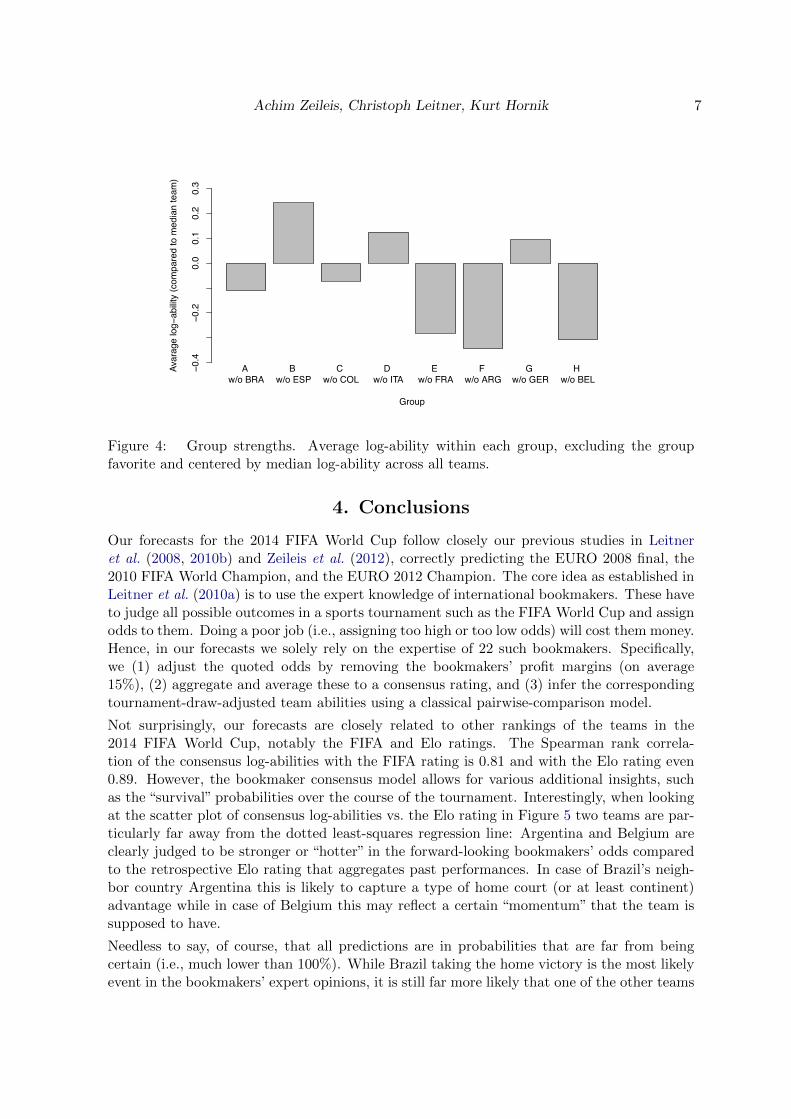
To emphasize that stronger and weaker teams are not evenly distributed across the di↵erentgroups, Figure 4 tries to capture the group strength. More precisely, the average log-abilityof the three teams without the groups’ favorite are shown relative to the median team’s log-ability. Again, this brings out clearly that Spain, Italy, and Germany have to prevail againststrong contenders to make it into the next round whereas Argentina, Belgium and Francehave been drawn against relatively weak teams.

6 Home Victory for Brazil in the 2014 FIFA World Cup
Group A
Prob
abilit
y (%
)
Round of 16 Quarter Semi Final Winner
020
4060
8010
0
BRAMEXCROCMR
●
●
●
●
●
●
●
●● ●
●
●
●● ●
●
●
● ● ●
Group B
Prob
abilit
y (%
)
Round of 16 Quarter Semi Final Winner
020
4060
8010
0
ESPNEDCHIAUS●
●
●
●
●
●
●
●
●●
●
●
●
●●
●
●● ● ●
Group C
Prob
abilit
y (%
)
Round of 16 Quarter Semi Final Winner
020
4060
8010
0
COLCIVJPNGRE
●
●
●
●●
●
●
●● ●
●
●
●● ●
●
●
●● ●
Group D
Prob
abilit
y (%
)
Round of 16 Quarter Semi Final Winner
020
4060
8010
0
ITAURUENGCRC
●
●
●
●
●
●
●
●
●
●
●
●
●
●●
●
●● ● ●
Group E
Prob
abilit
y (%
)
Round of 16 Quarter Semi Final Winner
020
4060
8010
0
FRASUIECUHON●
●
●
●
●
●
●
●
●●
●
●
●
● ●
●
●
● ● ●
Group F
Prob
abilit
y (%
)
Round of 16 Quarter Semi Final Winner
020
4060
8010
0
ARGBIHNGRIRI
●
●
●
●
●
●
●
●
● ●
●
●
●● ●
●
●
● ● ●
Group G
Prob
abilit
y (%
)
Round of 16 Quarter Semi Final Winner
020
4060
8010
0
GERPORUSAGHA
●
●
●
●
●
●
●
●
●
●
●
●
●● ●
●
●
●● ●
Group H
Prob
abilit
y (%
)
Round of 16 Quarter Semi Final Winner
020
4060
8010
0
BELRUSKORALG
●
●
●
●
●
●
●
●
●●
●
●
●● ●
●
●● ● ●
Figure 3: Probability for each team to “survive” in the 2014 FIFA World Cup, i.e., proceedfrom the group phase to the round of 16, quarter and semi-finals, the final and to win thetournament.
Achim Zeileis, Christoph Leitner, Kurt Hornik 7
A w/o BRA
B w/o ESP
C w/o COL
D w/o ITA
E w/o FRA
F w/o ARG
G w/o GER
H w/o BEL
Group
Avar
age
log−
abilit
y (c
ompa
red
to m
edia
n te
am)
−0.4
−0.2
0.0
0.1
0.2
0.3
Figure 4: Group strengths. Average log-ability within each group, excluding the groupfavorite and centered by median log-ability across all teams.
4. Conclusions
Our forecasts for the 2014 FIFA World Cup follow closely our previous studies in Leitneret al. (2008, 2010b) and Zeileis et al. (2012), correctly predicting the EURO 2008 final, the2010 FIFA World Champion, and the EURO 2012 Champion. The core idea as established inLeitner et al. (2010a) is to use the expert knowledge of international bookmakers. These haveto judge all possible outcomes in a sports tournament such as the FIFA World Cup and assignodds to them. Doing a poor job (i.e., assigning too high or too low odds) will cost them money.Hence, in our forecasts we solely rely on the expertise of 22 such bookmakers. Specifically,we (1) adjust the quoted odds by removing the bookmakers’ profit margins (on average15%), (2) aggregate and average these to a consensus rating, and (3) infer the correspondingtournament-draw-adjusted team abilities using a classical pairwise-comparison model.
Not surprisingly, our forecasts are closely related to other rankings of the teams in the2014 FIFA World Cup, notably the FIFA and Elo ratings. The Spearman rank correla-tion of the consensus log-abilities with the FIFA rating is 0.81 and with the Elo rating even0.89. However, the bookmaker consensus model allows for various additional insights, suchas the “survival” probabilities over the course of the tournament. Interestingly, when lookingat the scatter plot of consensus log-abilities vs. the Elo rating in Figure 5 two teams are par-ticularly far away from the dotted least-squares regression line: Argentina and Belgium areclearly judged to be stronger or “hotter” in the forward-looking bookmakers’ odds comparedto the retrospective Elo rating that aggregates past performances. In case of Brazil’s neigh-bor country Argentina this is likely to capture a type of home court (or at least continent)advantage while in case of Belgium this may reflect a certain “momentum” that the team issupposed to have.
Needless to say, of course, that all predictions are in probabilities that are far from beingcertain (i.e., much lower than 100%). While Brazil taking the home victory is the most likelyevent in the bookmakers’ expert opinions, it is still far more likely that one of the other teams

8 Home Victory for Brazil in the 2014 FIFA World Cup
1600 1700 1800 1900 2000 2100 2200
−7−6
−5−4
−3−2
−1
Elo rating
Log−
abilit
y (fr
om b
ookm
aker
con
sens
us)
BRA
ARGGER
ESP
BELFRAITAURUCOLPOR NEDENG
CHI
RUSSUI
MEXCIVJPN ECUCROBIHUSAGHA
NGR GRE
KOR
CMR AUS
ALG IRICRCHON Spearman rank correlation = 0.89
Figure 5: Bookmaker consensus log-ability vs. Elo rating for all 32 teams in the 2014 FIFAWorld Cup (along with least-squares regression line).
wins. This is one of the two reasons why we would recommend to refrain from placing betsbased on our analyses. The more important second reason, though, is that the bookmakershave a sizeable profit margin of (on average) 15% which assures that the best chances ofmaking money based on sports betting lie with them. Hence, this should be kept in mindwhen placing bets. We, ourselves, will not place bets but focus on enjoying the excitingfootball tournament that the FIFA 2014 World Cup will be with 100% predicted probability!
References
Bradley RA, Terry ME (1952). “Rank Analysis of Incomplete Block Designs: I. The Methodof Paired Comparisons.” Biometrika, 39, 324–345.
Elo AE (2008). The Rating of Chess Players, Past and Present. Ishi Press, San Rafael.
Forrest D, Goddard J, Simmons R (2005). “Odds-Setters as Forecasters: The Case of EnglishFootball.” International Journal of Forecasting, 21, 551–564.

Achim Zeileis, Christoph Leitner, Kurt Hornik 9
Henery RJ (1999). “Measures of Over-Round in Performance Index Betting.” Journal of the
Royal Statistical Society D, 48(3), 435–439.
Leitner C, Zeileis A, Hornik K (2008). “Who is Going to Win the EURO 2008? (A StatisticalInvestigation of Bookmakers Odds).”Report 65, Department of Statistics and Mathematics,Wirtschaftsuniversitat Wien, Research Report Series. URL http://epub.wu.ac.at/1570/.
Leitner C, Zeileis A, Hornik K (2010a). “Forecasting Sports Tournaments by Ratings of(Prob)abilities: A Comparison for the EURO 2008.” International Journal of Forecasting,26(3), 471–481. doi:10.1016/j.ijforecast.2009.10.001.
Leitner C, Zeileis A, Hornik K (2010b). “Forecasting the Winner of the FIFAWorld Cup 2010.”Report 100, Institute for Statistics and Mathematics, WU Wirtschaftsuniversitat Wien,Research Report Series. URL http://epub.wu.ac.at/702/.
Wikipedia (2014). “Odds — Wikipedia, The Free Encyclopedia.” Online, accessed 2014-05-01,URL http://en.wikipedia.org/wiki/Odds.
Zeileis A, Leitner C, Hornik K (2012). “History Repeating: Spain Beats Germany in theEURO 2012 Final.” Working Paper 2012-09, Working Papers in Economics and Statistics,Research Platform Empirical and Experimental Economics, Universitat Innsbruck. URLhttp://EconPapers.RePEc.org/RePEc:inn:wpaper:2012-09.
A�liation:
Achim ZeileisDepartment of StatisticsFaculty of Economics and StatisticsUniversitat InnsbruckUniversitatsstr. 156020 Innsbruck, AustriaE-mail: [email protected]
Christoph Leitner, Kurt HornikInstitute for Statistics and MathematicsDepartment of Finance, Accounting and StatisticsWU Wirtschaftsuniversitat WienWelthandelsplatz 11020 Wien, AustriaE-mail: [email protected], [email protected]

10 Home Victory for Brazil in the 2014 FIFA World Cup
BRA ARG GER ESP BEL FRA ITA URUbwin 3.85 6.00 6.0 7.50 17 21.0 21 2610Bet 3.45 5.25 6.0 7.25 19 22.0 27 27
ApolloBET 4.00 5.50 7.0 7.50 19 26.0 26 26BALL2WIN 3.45 4.90 5.7 6.10 16 18.5 20 20
bet365 3.75 5.50 6.5 7.50 19 23.0 26 26BetButler 4.00 6.00 6.5 8.00 17 21.0 23 29
BETFRED 4.00 5.00 6.5 7.50 15 21.0 26 29betinternet 4.00 5.50 6.5 7.50 13 21.0 26 26
BETVICTOR 4.00 6.00 6.5 7.50 21 26.0 29 29Boylesports 4.00 5.50 7.0 7.50 19 26.0 26 26
CORAL 4.00 5.50 7.0 7.50 19 23.0 21 29Ladbrokers 4.00 5.50 6.0 7.00 17 21.0 23 29
MARATHONbet 3.75 5.50 6.0 7.50 17 23.0 17 26Paddy.Power 4.00 6.00 6.5 7.50 19 21.0 26 26
skyBET 4.00 5.50 6.0 7.00 17 26.0 26 23SmartLiveSports 4.00 5.50 6.4 7.40 19 23.0 26 28
SPREADEX 3.80 5.50 7.0 7.00 21 21.0 23 26StanJames 4.00 5.00 7.0 7.00 21 23.0 26 23totesport 4.00 5.00 6.5 7.50 15 21.0 26 29BETDAQ 4.00 6.00 7.2 7.80 22 27.0 29 29UNIBET 4.00 5.75 6.5 7.50 18 24.0 26 26
William.HILL 4.00 5.50 6.5 7.00 15 21.0 26 29COL POR NED ENG CHI RUS SUI MEX
bwin 26 26 34 34 41 67 81 15110Bet 33 31 29 33 42 83 106 106
ApolloBET 29 29 34 29 41 101 101 126BALL2WIN 27 23 25 21 32 75 90 99
bet365 34 29 29 34 41 81 101 151BetButler 26 34 23 51 41 101 126 126
BETFRED 21 34 29 34 41 81 101 151betinternet 26 29 29 34 41 67 101 101
BETVICTOR 34 26 34 34 51 101 126 151Boylesports 29 29 34 29 41 101 101 126
CORAL 34 26 34 29 34 101 81 151Ladbrokers 23 23 29 34 34 81 101 126
MARATHONbet 26 29 29 34 51 56 81 126Paddy.Power 26 34 26 34 41 67 101 126
skyBET 26 29 26 29 51 81 126 126SmartLiveSports 30 30 29 34 40 80 100 150
SPREADEX 29 29 29 29 34 81 101 151StanJames 29 34 34 34 41 81 126 126totesport 21 34 29 34 41 81 101 151BETDAQ 42 34 39 33 50 134 162 180UNIBET 26 32 30 30 42 80 120 150
William.HILL 23 34 29 34 41 67 101 151
Table 2: Quoted odds from 22 online bookmakers for the first 16 teams in the 2014 FIFAWorld Cup. Obtained on 2014-05-19 from http://www.oddscomparisons.com/ and http:
//www.bwin.com/, respectively.

Achim Zeileis, Christoph Leitner, Kurt Hornik 11
CIV JPN ECU CRO BIH USA GHA NGRbwin 126 126 151 151 126 151 151 25110Bet 131 161 131 161 161 161 261 261
ApolloBET 151 151 151 151 151 201 201 251BALL2WIN 78 120 110 110 99 130 130 150
bet365 126 151 126 151 151 226 251 251BetButler 151 151 151 151 151 151 151 201
BETFRED 151 151 151 151 151 151 201 251betinternet 126 151 126 151 151 201 201 251
BETVICTOR 151 201 151 151 201 201 201 301Boylesports 151 151 151 151 151 201 201 251
CORAL 151 81 201 126 151 251 151 251Ladbrokers 151 151 151 151 201 201 201 201
MARATHONbet 101 126 126 126 151 201 201 201Paddy.Power 101 151 126 126 151 151 151 201
skyBET 151 151 151 176 151 126 251 201SmartLiveSports 150 150 150 150 180 200 200 250
SPREADEX 151 151 201 151 201 251 201 301StanJames 151 151 151 201 151 251 201 301totesport 151 151 151 151 151 151 201 251BETDAQ 140 230 205 220 190 260 270 315UNIBET 150 150 180 150 200 200 250 280
William.HILL 151 126 151 151 151 151 201 251GRE KOR CMR AUS ALG IRI CRC HON
bwin 251 501 401 501 1501 1501 1501 150110Bet 311 311 511 511 1551 1551 2601 2101
ApolloBET 351 401 751 501 2001 1501 1501 1501BALL2WIN 200 200 200 200 200 200 200 200
bet365 301 301 501 501 1501 1501 2501 2001BetButler 201 251 401 301 1001 801 1001 1001
BETFRED 201 401 501 751 1001 1501 2001 2501betinternet 251 251 501 501 1001 1001 1001 1501
BETVICTOR 301 501 1001 751 2501 1501 4001 4001Boylesports 351 401 751 501 2001 1501 1501 1501
CORAL 301 401 501 1001 751 2501 1001 2501Ladbrokers 251 401 751 1001 1001 1501 2001 2001
MARATHONbet 201 301 501 751 1001 1501 1501 1501Paddy.Power 201 301 501 501 2001 1501 2001 3001
skyBET 251 501 1001 1001 1501 2001 1501 2001SmartLiveSports 250 400 710 710 1000 1000 1000 1000
SPREADEX 301 501 1501 1501 2501 2501 4001 2001StanJames 201 301 1001 1501 2501 2501 4001 4001totesport 201 401 501 751 1001 1501 2001 2501BETDAQ 465 560 850 1000 1000 1000 1000 1000UNIBET 250 300 500 500 1500 1000 750 2000
William.HILL 251 251 751 751 1001 751 2501 2501
Table 3: Quoted odds from 22 online bookmakers for the second 16 teams in the 2014 FIFAWorld Cup. Obtained on 2014-05-19 from http://www.oddscomparisons.com/ and http:
//www.bwin.com/, respectively.

University of Innsbruck - Working Papers in Economics and StatisticsRecent Papers can be accessed on the following webpage:
http://eeecon.uibk.ac.at/wopec/
2014-17 Achim Zeileis, Christoph Leitner, Kurt Hornik: Home victory for Brazilin the 2014 FIFA World Cup
2014-16 Andreas Exenberger, Andreas Pondorfer, Maik H. Wolters: Estima-ting the impact of climate change on agricultural production: accounting fortechnology heterogeneity across countries
2014-15 Alice Sanwald, Engelbert Theurl: Atypical employment and health: Ameta-analysis
2014-14 Gary Charness, Francesco Feri, Miguel A. Melendez-Jimenez,Matthias Sutter: Experimental games on networks: Underpinnings of beha-vior and equilibrium selection slightly revised version forthcoming in Econo-metrica
2014-13 Uwe Dulleck, Rudolf Kerschbamer, Alexander Konovalov: Too muchor too little? Price-discrimination in a market for credence goods
2014-12 Alexander Razen, Wolgang Brunauer, Nadja Klein, Thomas Kneib,Stefan Lang, Nikolaus Umlauf: Statistical risk analysis for real estate col-lateral valuation using Bayesian distributional and quantile regression
2014-11 Dennis Dlugosch, Kristian Horn, Mei Wang: Behavioral determinantsof home bias - theory and experiment
2014-10 Torsten Hothorn, Achim Zeileis: partykit: A modular toolkit for recursivepartytioning in R
2014-09 Rudi Stracke, Wolfgang Hochtl, Rudolf Kerschbamer, Uwe Sunde:Incentives and selection in promotion contests: Is it possible to kill two birdswith one stone?
2014-08 Rudi Stracke, Wolfgang Hochtl, Rudolf Kerschbamer, Uwe Sunde:Optimal prizes in dynamic elimination contests: Theory and experimental evi-dence
2014-07 Nikolaos Antonakakis, Max Breitenlechner, Johann Scharler: Howstrongly are business cycles and financial cycles linked in the G7 countries?
2014-06 Burkhard Raunig, Johann Scharler, Friedrich Sindermann: Do bankslend less in uncertain times?

2014-05 Julia Auckenthaler, Alexander Kupfer, Rupert Sendlhofer: The im-pact of liquidity on inflation-linked bonds: A hypothetical indexed bonds ap-proach
2014-04 Alice Sanwald, Engelbert Theurl: What drives out-of pocket health ex-penditures of private households? - Empirical evidence from the Austrian hou-sehold budget survey
2014-03 Tanja Hortnagl, Rudolf Kerschbamer: How the value of information sha-pes the value of commitment or: Why the value of commitment does not vanish
2014-02 Adrian Beck, Rudolf Kerschbamer, Jianying Qiu, Matthias Sutter:Car mechanics in the lab - Investigating the behavior of real experts on expe-rimental markets for credence goods
2014-01 Loukas Balafoutas, Adrian Beck, Rudolf Kerschbamer, MatthiasSutter: The hidden costs of tax evasion - Collaborative tax evasion in marketsfor expert services
2013-37 Reto Stau↵er, Georg J. Mayr, Markus Dabernig, Achim Zeileis: So-mewhere over the rainbow: How to make e↵ective use of colors in meteorolo-gical visualizations
2013-36 Hannah Frick, Carolin Strobl, Achim Zeileis: Rasch mixture models forDIF detection: A comparison of old and new score specifications
2013-35 Nadja Klein, Thomas Kneib, Stephan Klasen, Stefan Lang: Bayesianstructured additive distributional regression for multivariate responses
2013-34 Sylvia Kaufmann, Johann Scharler: Bank-lending standards, loan growthand the business cycle in the Euro area
2013-33 Ting Wang, Edgar C. Merkle, Achim Zeileis: Score-based tests of mea-surement invariance: Use in practice
2013-32 Jakob W. Messner, Georg J. Mayr, Daniel S. Wilks, Achim Zeileis:Extending extended logistic regression for ensemble post-processing: Extendedvs. separate vs. ordered vs. censored published in Monthly Weather Review
2013-31 Anita Gantner, Kristian Horn, Rudolf Kerschbamer: Fair division inunanimity bargaining with subjective claims
2013-30 Anita Gantner, Rudolf Kerschbamer: Fairness and e�ciency in a subjec-tive claims problem
2013-29 Tanja Hortnagl, Rudolf Kerschbamer, Rudi Stracke, Uwe Sunde:Heterogeneity in rent-seeking contests with multiple stages: Theory and expe-rimental evidence
2013-28 Dominik Erharter: Promoting coordination in summary-statistic games
2013-27 Dominik Erharter: Screening experts’ distributional preferences
2013-26 Loukas Balafoutas, Rudolf Kerschbamer, Matthias Sutter: Second-degree moral hazard in a real-world credence goods market
2013-25 Rudolf Kerschbamer: The geometry of distributional preferences and a non-parametric identification approach
2013-24 Nadja Klein, Michel Denuit, Stefan Lang, Thomas Kneib: Nonliferatemaking and risk management with bayesian additive models for location,scale and shape
2013-23 Nadja Klein, Thomas Kneib, Stefan Lang: Bayesian structured additivedistributional regression
2013-22 David Plavcan, Georg J. Mayr, Achim Zeileis: Automatic and probabi-listic foehn diagnosis with a statistical mixture model published in Journal ofApplied Meteorology and Climatology
2013-21 Jakob W. Messner, Georg J. Mayr, Achim Zeileis, Daniel S. Wilks:Extending extended logistic regression to e↵ectively utilize the ensemble spread
2013-20 Michael Greinecker, Konrad Podczeck: Liapouno↵’s vector measure theo-rem in Banach spaces forthcoming in Economic Theory Bulletin
2013-19 Florian Lindner: Decision time and steps of reasoning in a competitive mar-ket entry game forthcoming in Economics Letters
2013-18 Michael Greinecker, Konrad Podczeck: Purification and independenceforthcoming in Economic Theory
2013-17 Loukas Balafoutas, Rudolf Kerschbamer, Martin Kocher, MatthiasSutter: Revealed distributional preferences: Individuals vs. teams forthcomingin Journal of Economic Behavior and Organization
2013-16 Simone Gobien, Bjorn Vollan: Playing with the social network: Socialcohesion in resettled and non-resettled communities in Cambodia
2013-15 Bjorn Vollan, Sebastian Prediger, Markus Frolich: Co-managing com-mon pool resources: Do formal rules have to be adapted to traditional ecolo-gical norms? published in Ecological Economics
2013-14 Bjorn Vollan, Yexin Zhou, Andreas Landmann, Biliang Hu, CarstenHerrmann-Pillath: Cooperation under democracy and authoritarian norms
2013-13 Florian Lindner, Matthias Sutter: Level-k reasoning and time pressure inthe 11-20 money request game published in Economics Letters
2013-12 Nadja Klein, Thomas Kneib, Stefan Lang: Bayesian generalized additivemodels for location, scale and shape for zero-inflated and overdispersed countdata
2013-11 Thomas Stockl: Price e�ciency and trading behavior in limit order marketswith competing insiders forthcoming in Experimental Economics
2013-10 Sebastian Prediger, Bjorn Vollan, Benedikt Herrmann: Resource scar-city, spite and cooperation
2013-09 Andreas Exenberger, Simon Hartmann: How does institutional changecoincide with changes in the quality of life? An exemplary case study
2013-08 E. Glenn Dutcher, Loukas Balafoutas, Florian Lindner, Dmitry Ryv-kin, Matthias Sutter: Strive to be first or avoid being last: An experimenton relative performance incentives.
2013-07 Daniela Glatzle-Rutzler, Matthias Sutter, Achim Zeileis: No myopicloss aversion in adolescents? An experimental note
2013-06 Conrad Kobel, Engelbert Theurl: Hospital specialisation within a DRG-Framework: The Austrian case
2013-05 Martin Halla, Mario Lackner, Johann Scharler: Does the welfare statedestroy the family? Evidence from OECD member countries
2013-04 Thomas Stockl, Jurgen Huber, Michael Kirchler, Florian Lindner:Hot hand belief and gambler’s fallacy in teams: Evidence from investmentexperiments
2013-03 Wolfgang Luhan, Johann Scharler: Monetary policy, inflation illusion andthe Taylor principle: An experimental study
2013-02 Esther Blanco, Maria Claudia Lopez, James M. Walker: Tensions bet-ween the resource damage and the private benefits of appropriation in thecommons
2013-01 Jakob W. Messner, Achim Zeileis, Jochen Broecker, Georg J. Mayr:Improved probabilistic wind power forecasts with an inverse power curve trans-formation and censored regression forthcoming in Wind Energy

University of Innsbruck
Working Papers in Economics and Statistics
2014-17
Achim Zeileis, Christoph Leitner, Kurt Hornik
Home victory for Brazil in the 2014 FIFA World Cup
AbstractAfter 36 years the FIFA World Cup returns to South America with the 2014 eventbeing hosted in Brazil (after 1978 in Argentina). And as in all previous South Ame-rican FIFA World Cups, a South American team is expected to take the victory:Using a bookmaker consensus rating - obtained by aggregating winning odds from22 online bookmakers - the clear favorite is the host Brazil with a forecasted win-ning probability of 22.5%, followed by three serious contenders. Neighbor countryArgentina is the expected runner-up with a winning probability of 15.8% beforeGermany with 13.4% and Spain with 11.8%. All other competitors have much lowerwinning probabilities with the ”best of the rest”being the ınsider tip”Belgium witha predicted 4.8%. Furthermore, by complementing the bookmaker consensus resultswith simulations of the whole tournament, predicted pairwise probabilities for eachpossible game at the FIFAWorld Cup are obtained along with ßurvival”probabilitiesfor each team proceeding to the di↵erent stages of the tournament. For example,it can be inferred that the most likely final is a match between neighbors Braziland Argentina (6.5%) with the odds somewhat in favor of Brazil of winning such afinal (with a winning probability of 57.8%). However, this outcome is by no meanscertain and many other courses of the tournament are not unlikely as will be presen-ted here. All forecasts are the result of an aggregation of quoted winning odds foreach team in the 2014 FIFA World Cup: These are first adjusted for profit margins(overrounds”), averaged on the log-odds scale, and then transformed back to win-ning probabilities. Moreover, team abilities (or strengths) are approximated by anınverse”procedure of tournament simulations, yielding estimates of probabilities forall possible pairwise matches at all stages of the tournament. This technique correct-ly predicted the EURO 2008 final (Leitner, Zeileis, and Hornik 2008), with betterresults than other rating/forecast methods (Leitner, Zeileis, and Hornik 2010a), andcorrectly predicted Spain as the 2010 FIFA World Champion (Leitner, Zeileis, andHornik 2010b) and EURO 2012 Champion (Leitner, Zeileis, and Hornik 2012).
ISSN 1993-4378 (Print)ISSN 1993-6885 (Online)