Embed Size (px)
Citation preview

This article has been downloaded from IOPscience. Please scroll down to see the full text article.
(http://iopscience.iop.org/0957-4484/19/5/055207)
is available
Download details:
IP Address: 155.247.167.161
The article was downloaded on 22/04/2008 at 05:32
Please note that terms and conditions apply.
More related content
HOME | SEARCH | PACS & MSC | JOURNALS | ABOUT | CONTACT US
IOP PUBLISHING NANOTECHNOLOGY
Nanotechnology 19 (2008) 055207 (12pp) doi:10.1088/0957-4484/19/05/055207
Optically controlled thermal managementon the nanometer length scaleF Garwe1, U Bauerschafer2, A Csaki1, A Steinbruck1, K Ritter3,A Bochmann1, J Bergmann1, A Weise4, D Akimov5, G Maubach1,8,K Konig6, G Huttmann7, W Paa1, J Popp1,5 and W Fritzsche1
1 Institute of Photonic Technology (IPHT) Jena, PO Box 100239, D-07745 Jena, Germany2 GmBU, Erich-Neuss-Weg 5, D-06120 Halle/S, Germany3 Technical University Ilmenau, D-98693 Ilmenau, Germany4 Friedrich Schiller University Jena, Institute of Human Genetics and Anthropology,D-07702 Jena, Germany5 Friedrich Schiller University Jena, Institute of Physical Chemistry, D-07743 Jena, Germany6 Fraunhofer Institut St Ingbert, D-07702 St Ingbert, Germany7 Medical Laser Center Lubeck, D-23552 Lubeck, Germany
E-mail: [email protected]
Received 21 September 2007, in final form 7 November 2007Published 14 January 2008Online at stacks.iop.org/Nano/19/055207
AbstractThe manipulation of polymers and biological molecules or the control of chemical reactions ona nanometer scale by means of laser pulses shows great promise for applications in modernnanotechnology, biotechnology, molecular medicine or chemistry. A controllable, parallel,highly efficient and very local heat conversion of the incident laser light into metalnanoparticles without ablation or fragmentation provides the means for a tool like a‘nanoreactor’, a ‘nanowelder’, a ‘nanocrystallizer’ or a ‘nanodesorber’.
In this paper we explain theoretically and show experimentally the interaction of laserradiation with gold nanoparticles on a polymethylmethacrylate (PMMA) layer (one-photonexcitation) by means of different laser pulse lengths, wavelengths and pulse repetition rates. Tothe best of our knowledge this is the first report showing the possibility of highly local (in a40 nm range) regulated heat insertion into the nanoparticle and its surroundings withoutablation of the gold nanoparticles. In an earlier paper we showed that near-infraredfemtosecond irradiation can cut labeled DNA sequences in metaphase chromosomes below thediffraction-limited spot size. Now, we use gold as well as silver-enhanced gold nanoparticles onDNA (also within chromosomes) as energy coupling objects for femtosecond laser irradiationwith single-and two-photon excitation. We show the results of highly localized destructioneffects on DNA that occur only nearby the nanoparticles.
(Some figures in this article are in colour only in the electronic version)
1. Introduction
Highly sophisticated scanning probe technologies allow thepositioning and manipulation of molecules or groups ofmolecules with sub-nanometer accuracy. Examples are themanipulation of chromosomes in order to extract geneticmaterial [1] or the restriction of individual DNA molecules [2].
8 Present address: IBN Singapore, 31 Biopolis Way, The Nanos, #04-01,138669, Singapore.
In these cases the serial character limits the throughputseriously and makes it impracticable for greater numbersof samples. Optical techniques, such as laser-beam-based techniques, were used for cutting individual DNAmolecules [3] or parts of metaphase chromosomes [4]. Theyallow a higher throughput but are even more limited in theirlateral precision due to the wavelength of the applied light. Toincrease the precision far below the wavelength a light energyconversion at metallic nanostructures could be a promisingapproach.
0957-4484/08/055207+12$30.00 © 2008 IOP Publishing Ltd Printed in the UK1
Nanotechnology 19 (2008) 055207 F Garwe et al
Table 1. High pulse energy laser systems utilized in the experiments.
Type Laser system CompanyPulse length(ns)
Wavelength(nm)
Repetition rate(Hz)
ns Nd:YAG lasersystem + amplifier(503-D.NS)
BM Industries 8 532 10
ps Nd:YLF lasersystem + regenerativeamplifier (ISL2001 M PL)
Intelligent LaserSys Inc.
0.035 527 1000
fs Nd:glass- and ytterbiumsystem + regenerative amplifier+ SHG crystal (femtoREGEN)
High Q laser 0.000 250 1053 → 527 10 000
The surface plasmons (SP) at the interface between thegold or silver nanoparticles and the dielectric surroundingsshow pronounced optical absorption resonances due tocoupling of the light to the collective electronic excitation [5].Width and spectral position of the resonance are well describedby the Mie theory [6]. The spectral position depends onparticle material, size, shape and dielectric environment [7, 8].The size dependence is introduced by assuming a size-dependent material dielectric function ε(ω, R), which can bewritten as a combination of an interband term, accountingfor the response of the d electrons and a Drude termconsidering the free conduction electrons only [9, 10]. Thephenomenological damping constant in the Drude term isrelated to inhomogeneous line broadening and the lifetimesof all electron scattering processes in the nanoparticle that aremainly due to electron–electron, electron–phonon or electron–defect scattering, and (in the range of tens of nanometers ofthe nanoparticle diameter) electron–surface scattering. Thedamping mechanism is often described in terms of a lossof phase coherence of the collective electron oscillation dueto scattering of single electrons [5]. Using laser irradiation,this phenomenon can lead to a rise in electron temperature incontrast to the ionic lattice. Electron–electron and electron–phonon collisions will cause the formation of a new thermalequilibrium [11]. This dynamic behavior was studied bypump probe experiments [13]. In [12] the subpicosecondtime response of the optical excitation and the relaxationdynamics of the nonequilibrium electrons by the electron–phonon interaction were studied theoretically by the electron–phonon coupling model.
Metallic nanoparticles, which are fabricated by chemicalpreparation, exhibit surface plasmon effects. In connectionwith (bio)chemical functionalization, such nanoparticles canbe conjugated to various molecules [14, 15] and even asequence-specific positioning along DNA is possible [16–18].There are even therapeutic applications of plasmonic heatednanoparticles [19].
In this paper we first investigate the interaction of laserradiation of various laser pulse lengths, intensities and pulserepetition rates with gold nanoparticles immobilized on aPMMA layer in air. Here, the PMMA layer serves as ahighly local discrete sensor for the temperature nearby thenanoparticle. After laser irradiation we detected a sinking ofthe hot nanoparticle and/or the hot or cold ablated nanoparticlefragments by AFM measurements. Also, a change in the
size of nanoparticles on pure glass after laser irradiationcan be monitored by AFM. For a specific combination oflaser irradiation parameters a parallel temperature increaseof the nanoparticle’s surroundings without ablation occurs.Using the electron–phonon coupling model in combinationwith the heat conduction equation, we simulated the heatconversion in metal nanoparticles during irradiation withultrafast laser pulses. Various intensities, repetition ratesand the complex heat conduction from the nanoparticle intothe nonsymmetric, nonuniform 3D PMMA air surroundingswere modeled. These results encourage practical applicationslike ‘nanoreactors’, ‘nanowelding’, ‘nanocrystallization’ and‘nanodesorption’. Finally, we show experimentally thesubwavelength destruction of nanoparticle-labeled DNA inchromosomes as well as in an isolated state by optical single-photon excitation and two-photon excitation with fs laserpulses.
2. Experimental details
2.1. Experimental set-up
For thermal manipulation of technical materials or control ofchemical reactions near the gold nanoparticles, a moderateintensity of laser pulses and necessary fluence is required,so that, on the one hand, the desired material manipulationor chemical reaction takes place and, on the other hand,no destruction of nanoparticles, glass slide or other carriermaterial would occur. First of all, to get optimal conditionsfor heat conversion, an excitation of the nanoparticle with theresonance wavelength (plasmon or interband) is necessary. Inthe case of gold nanoparticles with 30 nm diameter we used530 nm. In addition, the pulse length and pulse repetition ratehas to be in a range where nanoparticles absorb effectivelya well-determined dose of the incoming light which is thenconverted into heat.
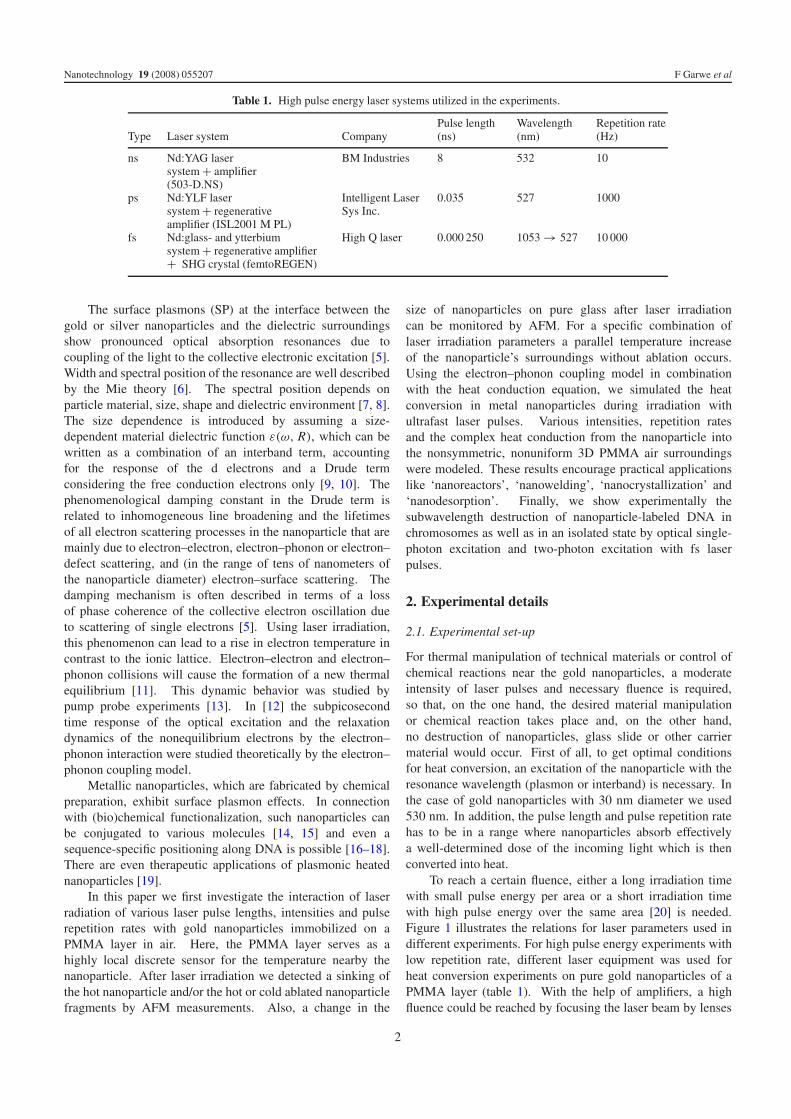
To reach a certain fluence, either a long irradiation timewith small pulse energy per area or a short irradiation timewith high pulse energy over the same area [20] is needed.Figure 1 illustrates the relations for laser parameters used indifferent experiments. For high pulse energy experiments withlow repetition rate, different laser equipment was used forheat conversion experiments on pure gold nanoparticles of aPMMA layer (table 1). With the help of amplifiers, a highfluence could be reached by focusing the laser beam by lenses
2
Nanotechnology 19 (2008) 055207 F Garwe et al
Table 2. Low pulse energy laser systems.
Type Laser system CompanyPulse length(fs)
Wavelength(nm)
Repetition rate(MHz)
cw cw 530 —ps 1 titanium:sapphire laser
(Mira 900HP) + OPOCoherentAPE
3000 530 76
fs 1 titanium:sapphire laser(Mira 900HP) + OPO
CoherentAPE
100 530 76
fs 2 titanium:sapphire laser(Mai Tai)
Spectra Physics 100 800 80
Table 3. Single high power laser pulse experiments on 30 nm gold nanoparticles of PMMA (for focus area = 0.1 cm2—ablation pulseenergy: 100 fs :→ 280 μJ [25]; and ionization pulse energy: 60 fs: for Re = 1012 s−1 → 400 μJ, 1 ps: Re = 1012 s−1 → 6, 4 mJ, 10 ns:Re = 1012 s−1 → 64 J [5], O: single focused irradiation, S: scanned irradiation with smaller focus).
Wavelength/pulse duration(nm/ns)
Pulse energy(mJ)
Repetition rate(Hz)
Average power(mW)
Focusdiameter (μm)
Fluence(mJ cm−2)
Experimentalresults in AFMpicture
532/8 0.5 10 5 O: 550 200 Figure 3(a)1 10 10 O: 550 350 Figure 3(c)
527/0.035 0.76 1000 760 O: 300 160 Figure 3(e)1.27 1000 1270 O: 300 240 Figure 3(f)
532/0.0003 0.0016 10000 16 S: 80 36 Figure 3(g)0.0024 10000 24 S: 80 54 Figure 3(h)0.0040 10000 40 S: 80 90 Figure 3(i)
Table 4. High repetition rate, low power pulse experiments on 30 nm gold nanoparticles of PMMA (for focus area = 0.1 cm2—ablationpulse energy: → 280 μJ [25]; and ionization pulse energy: 60 fs: for Re = 1012 s−1 → 400 μJ [5]) O: single focused irradiation.
Wavelength/pulseduration(nm)/(ns)
Pulseenergy(nJ)
Repetitionrate(MHz)
Averagepower(mW)
Focusdiameter(μm)
Fluence(mJ cm−2)
Experimentalresults inAFM picture
cw/530 t = 100 μs 22 O: 3.5 2.8 Figure 4(a)530/0.003 0.27 76 22 O: 3.5 2.8 Figure 4(b)530/0.0001 0.27 76 22 O: 3.5 2.8 Figures 4(c) and (d)
only (table 3). The laser systems for small pulse energy withhigh repetition rate experiments are shown in tables 2 and 4.Cw, ps1 and fs1 were used for the single-photon excitationexperiments on gold nanoparticles on a PMMA layer, too.Here, the same small fluence below the ablation threshold ofgold nanoparticles for all single-photon excitation experimentswas reached by focusing the laser beam with the same objectiveinside the microscope (Olympus).
Fs2 is applied for the two-photon excitation experimentsdone on silver-enhanced gold nanoparticles attached to pureDNA or DNA in chromosomes. Utilizing a laser scanningmicroscope (LSM 410 from Carl Zeiss Jena) with highnumerical aperture objective (oil immersion), ultrafast fs laserpulses with intensities in the range of MW cm−2–GW cm−2
are attained in the tiny focal volume (table 5). Here, twophotons at a wavelength of 800 nm excite simultaneouslya silver electron within the absorption band at 400 nm.Components in out-of-focus regions do not experience thisintense radiation and remain unaffected. In the experiment,gold nanoparticles were used to label DNA as part of thechromosomes. Because gold nanoparticles have a maximumplasmon absorption near 527 nm, it is necessary to performa silver deposition on the gold nanoparticle labels in order to
Table 5. Two-photon medium power fs laser pulse experiments ongold–silver core–shell nanoparticles sequence-specific labeled onchromosomes DNA or stretched DNA (S—laser scanning mode) (forfocus area = 0.1cm2—ablation pulse energy: → 280 μJ [24]; andionization pulse energy: 60 fs: for Re = 1012 s−1 → 400 μJ [5].)
Wavelength/pulseduration(nm fs−1)
Pulseenergy(nJ)
Repetitionrate(MHz)
Averagepower(mW)
Focusdiameter(μm)
Fluence(mJ cm−2)
fs:800/100 0.775 80 62 S: 1 98fs:800/100 0.27 80 22 S: 1 34fs:800/100 0.11 80 9 S: 1 14fs:800/100 0.075 80 6 S: 1 9.5
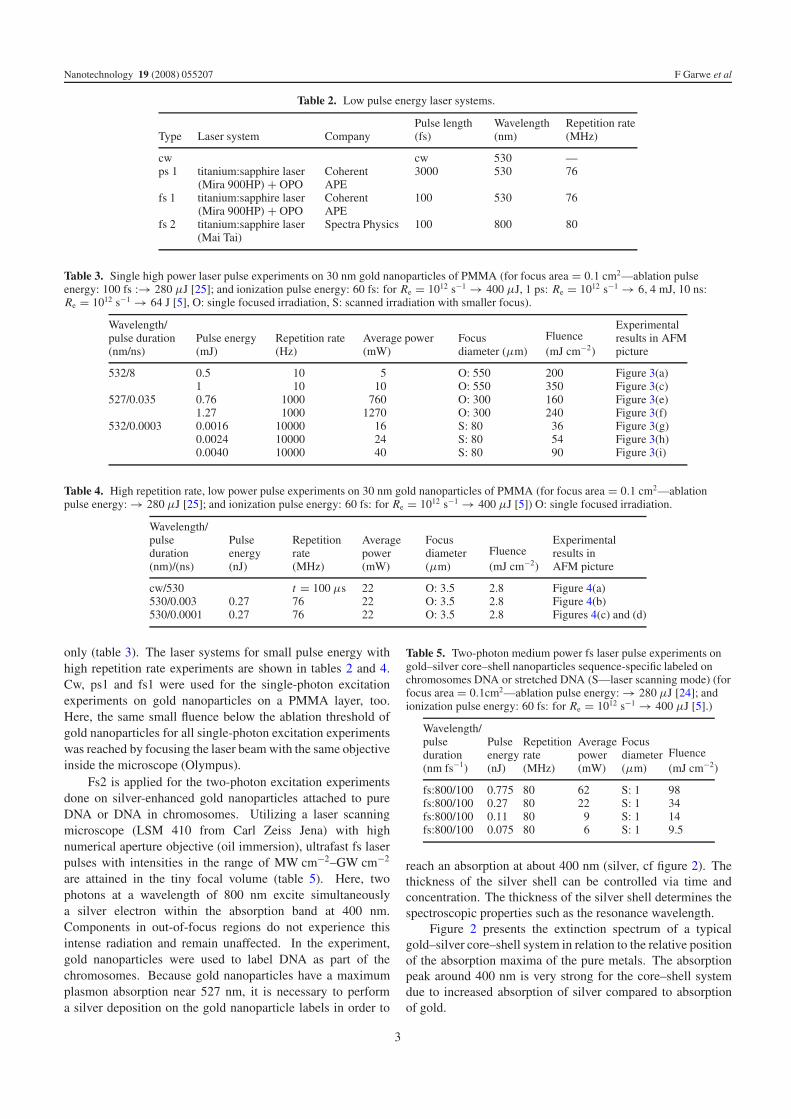
reach an absorption at about 400 nm (silver, cf figure 2). Thethickness of the silver shell can be controlled via time andconcentration. The thickness of the silver shell determines thespectroscopic properties such as the resonance wavelength.
Figure 2 presents the extinction spectrum of a typicalgold–silver core–shell system in relation to the relative positionof the absorption maxima of the pure metals. The absorptionpeak around 400 nm is very strong for the core–shell systemdue to increased absorption of silver compared to absorptionof gold.
3
Nanotechnology 19 (2008) 055207 F Garwe et al
Figure 1. The rectangles illustrate the ratio of pulse intensity,pulse length and repetition rate for the different laser experiments.(cw) continuous wave, (ns) 8 ns laser pulse with 10 Hz pulserepetition rate, (ps) high intensity 35 ps laser pulses with 1 kHz pulserepetition rate and low intensity 3 ps laser pulses with 76 MHzrepetition rate, (fs) high intensity 300 fs laser pulses with 10 kHzpulse repetition rate and low intensity 100 fs laser pulses with76 MHz repetition rate.
In the experiments, 100 fs pulses with a wavelength of800 nm were used. This compromise gives the possibility oftwo-photon excitation of the silver-enhanced gold nanoparti-cles to achieve specific and very local thermal damage aroundthe nanoparticles while endogenous fluorophores are avoided.At this wavelength, water and most organic compounds pos-sess only low absorption and scattering coefficients. How-ever, simultaneous absorption of two or more NIR photonscan excite UV or VIS electronic transitions in endogenousor exogenous fluorophores [21]. Endogenous absorbers suchas melanin, hemoglobin, chlorophyll, tyrosine, tryptophan,NAD(P)H, flavins, porphyrins, etc, can be destroyed by pho-tothermal, photochemical and photomechanical effects whichresult in the formation of destructive oxygen radicals, singletoxygen and indirect DNA damage [22]. The excitation effi-ciency is indirectly proportional to the pulse length and pro-portional to the squared power. Therefore, destruction exper-iments on pure chromosomes have to show, for a given laserpulse length, the upper usable laser intensity for irradiation ofchromosomes before they will be destroyed unspecifically.
2.2. Analysis methods
For the characterization of samples before and after exposure,images in overview optical dark-field contrast were madewith an Axiotech microscope (Carl Zeiss Jena, Germany).Scanning force microscopy (SFM) images (topography) witha Dimension 3100/Nanoscope III (Digital Instruments, SantaBarbara, CA) using tapping mode in air were performed fordetailed analysis. The images were only flattened by thesoftware.
Figure 2. Extinction spectra of nanoparticle solutions of 30 nm goldparticles, 40 nm silver particles and core–shell systems of 30 nmgold core with 5 nm silver shell.
2.3. Preparation of samples
For the first experiment, glass substrates were purchasedfrom Paul Marienfeld GmbH. Cleaning was performed usingacetone, ethanol and distilled water followed by a chemicalactivation in a 1:1:1 solution of HCl:H2O2:H2O. Cleaned andactivated glass substrates were coated with PMMA by spincoating a solution of 2% PMMA in ethyl acetate (500 rpmfor 10 s, 3000 rpm for 60 s). The layer was 50–70 nm thick.Gold nanoparticles were immobilized on the PMMA layer byincubation of the samples in a nanoparticle solution overnightat room temperature followed by rinsing in distilled water andair-stream drying.
Prior to unspecific nanoparticle labeling of humanmetaphase chromosomes, the surface was blocked byincubation with 1% PEG (polyethyleneglycol) for 15 min atroom temperature. The solution of positively charged goldnanoparticles (Genogold, BBI, UK) was incubated with thesamples as delivered for 15 s at room temperature. Thecharged gold nanoparticles were bound to the DNA backboneby electrostatic interaction. After the particle labeling, the goldparticles were enlarged with a silver enhancement kit (SEKL15, BBI UK) for 3 min. The resulting particle diameter wasapprox. 70 nm as measured by AFM. Genogold was also usedfor unspecific labeling of stretched DNA bundles.
In the next experiment, samples coupled by specificmolecular interactions were used as described before [32]. Thesame procedure was applied for specific labeling of stretchedDNA in the last experiment.
3. Theoretical simulation methods
We examined the relaxation dynamics of the electrontemperature by the electron–phonon coupling model [12]. Thetime evolution of the electron temperature Te and the effectivelattice temperature Tl is described by the coupled differentialequations
ce(Te)∂Te
∂ t= κ�Te − G(Te − Tl) + P(t)
cl∂Tl
∂ t= G(Te − Tl).
(1)
4
Nanotechnology 19 (2008) 055207 F Garwe et al
Here ce(Te) is the temperature-dependent electronic heatcapacity, cl is the lattice heat capacity, κ is the thermalconductivity, G is the electron–phonon coupling constant andP(t) is the excitation energy density per unit time and unitvolume in a particle. The first term on the right-hand side,representing thermal conductivity losses from a particle to thematrix, can be neglected for a few picoseconds after laserirradiation. The value of G is 3 × 10⁴ J ps−1 m−3 K−1 [11].We used the parameters of ce(Te) and cl with ce = c0Te,c0 = 66 J m−3 K−2 [8] and cl = 3 × 10⁶ J m−3 K−1 [11].As transient absorption a value of 27% was taken [23].
The conductive heat transfer from the gold nanosphere tothe PMMA matrix starts after equilibration of the electron gaswith the lattice. The model for heat transfer by conduction isdescribed by the heat equation
ρCp∂T
∂ t+ ∇ · (−k∇T ) = q (2)
with the following material properties: ρ is the density, Cp isthe heat capacity, k is the thermal conductivity and q is theheat source. The two subdomains are a gold particle modeledas a truncated sphere with radius 15 nm without a cup of5 nm height and the PMMA matrix as a cuboid 200 nm ×200 nm × 100 nm. The gold properties are the density ρAu =19 300 kg m−3, the heat capacity CpAu = 129 J kg−1 K−1 andthe thermal conductivity kAu = 317 W m−1 K−1, while thePMMA properties are ρPMMA = 1190 kg m−3, CpPMMA =1420 J kg−1 K−1 and kPMMA = 0.19 W m−1 K−1. Theinitial temperature in the gold particle is 344 K (the latticetemperature after the fs pulse) and the initial temperature ofthe PMMA matrix is 300 K. At the boundary between the twosubdomains the continuity interior boundary condition is valid:
−nAu · (−kAu∇TAu) − nPMMA · (−kPMMA∇TPMMA) = 0. (3)
As a boundary condition of the PMMA cuboid weset on all surfaces (without the top surface) the prescribedtemperature of 300 K, the heat bath of the surroundings.The top boundaries are described by external natural coolingconditions [24]
−n · (−k∇T ) = h(Tinf − T ) (4)
with the horizontal surface upside
h = 0.54Flam
(�T
L
)0.25
(5)
with
Flam = k
(Ra
L3�T
)0.25
(6)
with the Rayleigh number Ra and the characteristic length L.
4. Experiments on PMMA substrates
4.1. Results
The AFM images in figures 3(a) and (b) show goldnanoparticles lying on a pure glass slide after laser irradiation
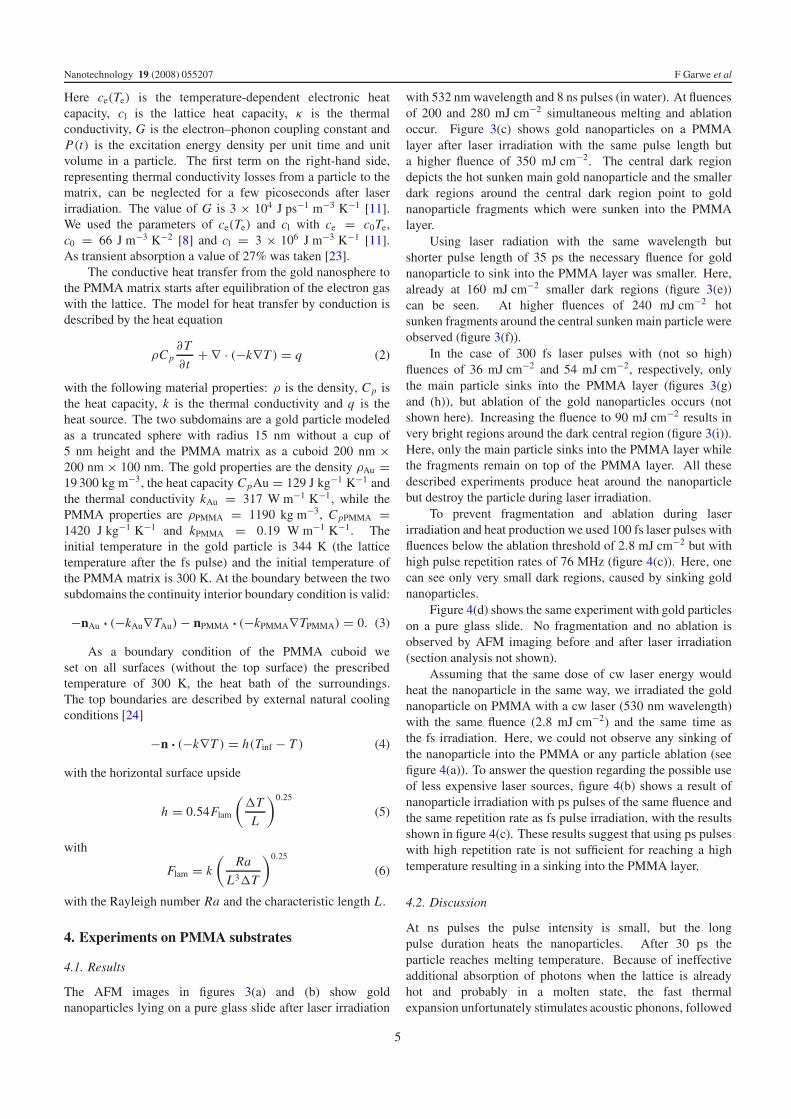
with 532 nm wavelength and 8 ns pulses (in water). At fluencesof 200 and 280 mJ cm−2 simultaneous melting and ablationoccur. Figure 3(c) shows gold nanoparticles on a PMMAlayer after laser irradiation with the same pulse length buta higher fluence of 350 mJ cm−2. The central dark regiondepicts the hot sunken main gold nanoparticle and the smallerdark regions around the central dark region point to goldnanoparticle fragments which were sunken into the PMMAlayer.
Using laser radiation with the same wavelength butshorter pulse length of 35 ps the necessary fluence for goldnanoparticle to sink into the PMMA layer was smaller. Here,already at 160 mJ cm−2 smaller dark regions (figure 3(e))can be seen. At higher fluences of 240 mJ cm−2 hotsunken fragments around the central sunken main particle wereobserved (figure 3(f)).
In the case of 300 fs laser pulses with (not so high)fluences of 36 mJ cm−2 and 54 mJ cm−2, respectively, onlythe main particle sinks into the PMMA layer (figures 3(g)and (h)), but ablation of the gold nanoparticles occurs (notshown here). Increasing the fluence to 90 mJ cm−2 results invery bright regions around the dark central region (figure 3(i)).Here, only the main particle sinks into the PMMA layer whilethe fragments remain on top of the PMMA layer. All thesedescribed experiments produce heat around the nanoparticlebut destroy the particle during laser irradiation.
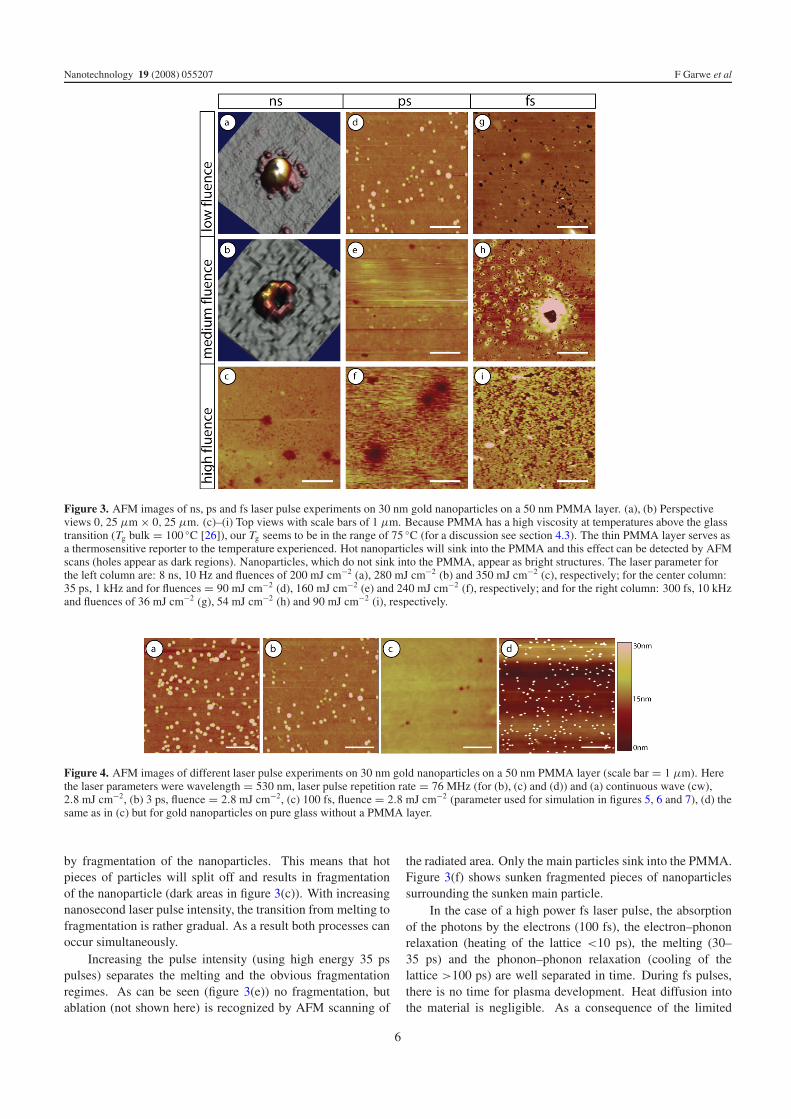
To prevent fragmentation and ablation during laserirradiation and heat production we used 100 fs laser pulses withfluences below the ablation threshold of 2.8 mJ cm−2 but withhigh pulse repetition rates of 76 MHz (figure 4(c)). Here, onecan see only very small dark regions, caused by sinking goldnanoparticles.
Figure 4(d) shows the same experiment with gold particleson a pure glass slide. No fragmentation and no ablation isobserved by AFM imaging before and after laser irradiation(section analysis not shown).
Assuming that the same dose of cw laser energy wouldheat the nanoparticle in the same way, we irradiated the goldnanoparticle on PMMA with a cw laser (530 nm wavelength)with the same fluence (2.8 mJ cm−2) and the same time asthe fs irradiation. Here, we could not observe any sinking ofthe nanoparticle into the PMMA or any particle ablation (seefigure 4(a)). To answer the question regarding the possible useof less expensive laser sources, figure 4(b) shows a result ofnanoparticle irradiation with ps pulses of the same fluence andthe same repetition rate as fs pulse irradiation, with the resultsshown in figure 4(c). These results suggest that using ps pulseswith high repetition rate is not sufficient for reaching a hightemperature resulting in a sinking into the PMMA layer.
4.2. Discussion
At ns pulses the pulse intensity is small, but the longpulse duration heats the nanoparticles. After 30 ps theparticle reaches melting temperature. Because of ineffectiveadditional absorption of photons when the lattice is alreadyhot and probably in a molten state, the fast thermalexpansion unfortunately stimulates acoustic phonons, followed
5
Nanotechnology 19 (2008) 055207 F Garwe et al
Figure 3. AFM images of ns, ps and fs laser pulse experiments on 30 nm gold nanoparticles on a 50 nm PMMA layer. (a), (b) Perspectiveviews 0, 25 μm × 0, 25 μm. (c)–(i) Top views with scale bars of 1 μm. Because PMMA has a high viscosity at temperatures above the glasstransition (Tg bulk = 100 ◦C [26]), our Tg seems to be in the range of 75 ◦C (for a discussion see section 4.3). The thin PMMA layer serves asa thermosensitive reporter to the temperature experienced. Hot nanoparticles will sink into the PMMA and this effect can be detected by AFMscans (holes appear as dark regions). Nanoparticles, which do not sink into the PMMA, appear as bright structures. The laser parameter forthe left column are: 8 ns, 10 Hz and fluences of 200 mJ cm−2 (a), 280 mJ cm−2 (b) and 350 mJ cm−2 (c), respectively; for the center column:35 ps, 1 kHz and for fluences = 90 mJ cm−2 (d), 160 mJ cm−2 (e) and 240 mJ cm−2 (f), respectively; and for the right column: 300 fs, 10 kHzand fluences of 36 mJ cm−2 (g), 54 mJ cm−2 (h) and 90 mJ cm−2 (i), respectively.
Figure 4. AFM images of different laser pulse experiments on 30 nm gold nanoparticles on a 50 nm PMMA layer (scale bar = 1 μm). Herethe laser parameters were wavelength = 530 nm, laser pulse repetition rate = 76 MHz (for (b), (c) and (d)) and (a) continuous wave (cw),2.8 mJ cm−2, (b) 3 ps, fluence = 2.8 mJ cm−2, (c) 100 fs, fluence = 2.8 mJ cm−2 (parameter used for simulation in figures 5, 6 and 7), (d) thesame as in (c) but for gold nanoparticles on pure glass without a PMMA layer.
by fragmentation of the nanoparticles. This means that hotpieces of particles will split off and results in fragmentationof the nanoparticle (dark areas in figure 3(c)). With increasingnanosecond laser pulse intensity, the transition from melting tofragmentation is rather gradual. As a result both processes canoccur simultaneously.
Increasing the pulse intensity (using high energy 35 pspulses) separates the melting and the obvious fragmentationregimes. As can be seen (figure 3(e)) no fragmentation, butablation (not shown here) is recognized by AFM scanning of
the radiated area. Only the main particles sink into the PMMA.Figure 3(f) shows sunken fragmented pieces of nanoparticlessurrounding the sunken main particle.
In the case of a high power fs laser pulse, the absorptionof the photons by the electrons (100 fs), the electron–phononrelaxation (heating of the lattice <10 ps), the melting (30–35 ps) and the phonon–phonon relaxation (cooling of thelattice >100 ps) are well separated in time. During fs pulses,there is no time for plasma development. Heat diffusion intothe material is negligible. As a consequence of the limited
6
Nanotechnology 19 (2008) 055207 F Garwe et al
(a) (b)
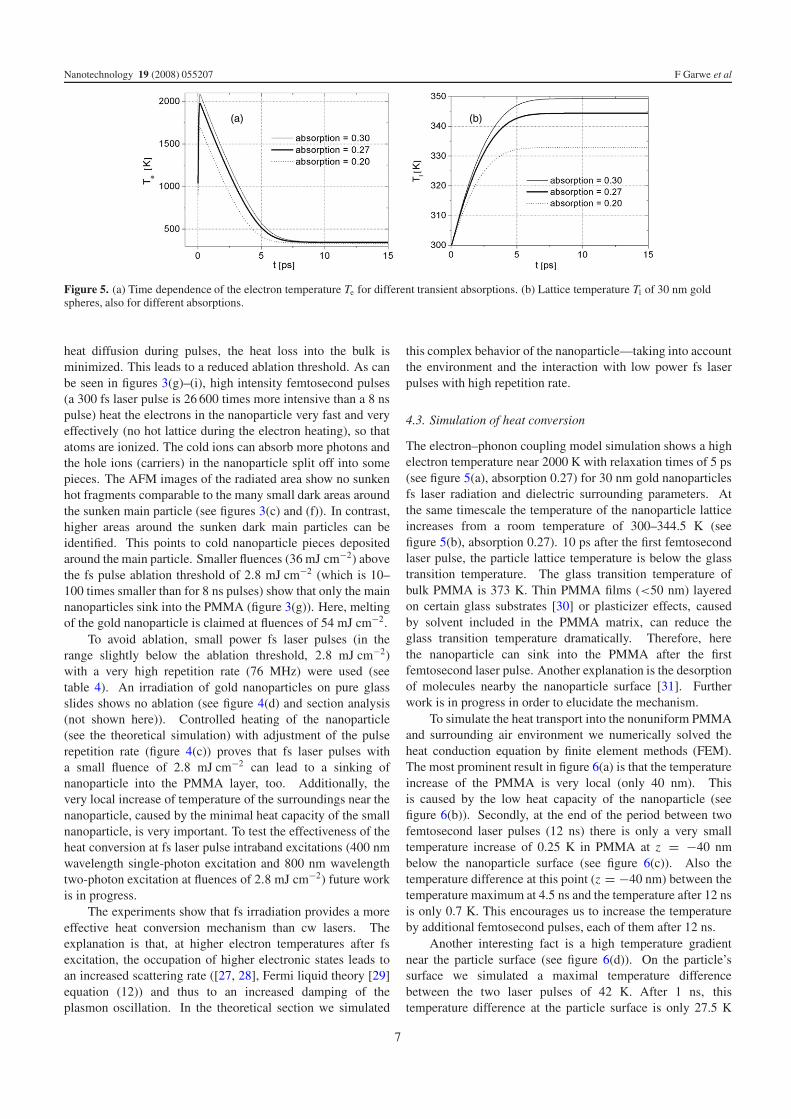
Figure 5. (a) Time dependence of the electron temperature Te for different transient absorptions. (b) Lattice temperature Tl of 30 nm goldspheres, also for different absorptions.
heat diffusion during pulses, the heat loss into the bulk isminimized. This leads to a reduced ablation threshold. As canbe seen in figures 3(g)–(i), high intensity femtosecond pulses(a 300 fs laser pulse is 26 600 times more intensive than a 8 nspulse) heat the electrons in the nanoparticle very fast and veryeffectively (no hot lattice during the electron heating), so thatatoms are ionized. The cold ions can absorb more photons andthe hole ions (carriers) in the nanoparticle split off into somepieces. The AFM images of the radiated area show no sunkenhot fragments comparable to the many small dark areas aroundthe sunken main particle (see figures 3(c) and (f)). In contrast,higher areas around the sunken dark main particles can beidentified. This points to cold nanoparticle pieces depositedaround the main particle. Smaller fluences (36 mJ cm−2) abovethe fs pulse ablation threshold of 2.8 mJ cm−2 (which is 10–100 times smaller than for 8 ns pulses) show that only the mainnanoparticles sink into the PMMA (figure 3(g)). Here, meltingof the gold nanoparticle is claimed at fluences of 54 mJ cm−2.
To avoid ablation, small power fs laser pulses (in therange slightly below the ablation threshold, 2.8 mJ cm−2)with a very high repetition rate (76 MHz) were used (seetable 4). An irradiation of gold nanoparticles on pure glassslides shows no ablation (see figure 4(d) and section analysis(not shown here)). Controlled heating of the nanoparticle(see the theoretical simulation) with adjustment of the pulserepetition rate (figure 4(c)) proves that fs laser pulses witha small fluence of 2.8 mJ cm−2 can lead to a sinking ofnanoparticle into the PMMA layer, too. Additionally, thevery local increase of temperature of the surroundings near thenanoparticle, caused by the minimal heat capacity of the smallnanoparticle, is very important. To test the effectiveness of theheat conversion at fs laser pulse intraband excitations (400 nmwavelength single-photon excitation and 800 nm wavelengthtwo-photon excitation at fluences of 2.8 mJ cm−2) future workis in progress.
The experiments show that fs irradiation provides a moreeffective heat conversion mechanism than cw lasers. Theexplanation is that, at higher electron temperatures after fsexcitation, the occupation of higher electronic states leads toan increased scattering rate ([27, 28], Fermi liquid theory [29]equation (12)) and thus to an increased damping of theplasmon oscillation. In the theoretical section we simulated
this complex behavior of the nanoparticle—taking into accountthe environment and the interaction with low power fs laserpulses with high repetition rate.
4.3. Simulation of heat conversion
The electron–phonon coupling model simulation shows a highelectron temperature near 2000 K with relaxation times of 5 ps(see figure 5(a), absorption 0.27) for 30 nm gold nanoparticlesfs laser radiation and dielectric surrounding parameters. Atthe same timescale the temperature of the nanoparticle latticeincreases from a room temperature of 300–344.5 K (seefigure 5(b), absorption 0.27). 10 ps after the first femtosecondlaser pulse, the particle lattice temperature is below the glasstransition temperature. The glass transition temperature ofbulk PMMA is 373 K. Thin PMMA films (<50 nm) layeredon certain glass substrates [30] or plasticizer effects, causedby solvent included in the PMMA matrix, can reduce theglass transition temperature dramatically. Therefore, herethe nanoparticle can sink into the PMMA after the firstfemtosecond laser pulse. Another explanation is the desorptionof molecules nearby the nanoparticle surface [31]. Furtherwork is in progress in order to elucidate the mechanism.
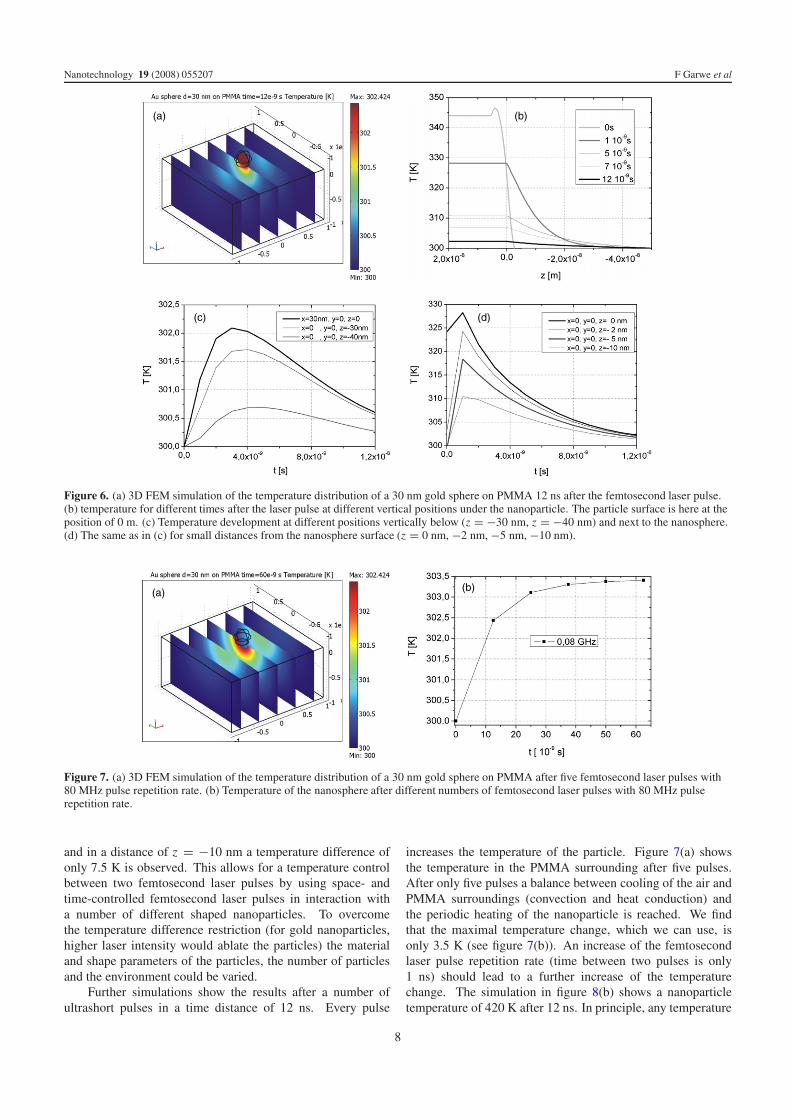
To simulate the heat transport into the nonuniform PMMAand surrounding air environment we numerically solved theheat conduction equation by finite element methods (FEM).The most prominent result in figure 6(a) is that the temperatureincrease of the PMMA is very local (only 40 nm). Thisis caused by the low heat capacity of the nanoparticle (seefigure 6(b)). Secondly, at the end of the period between twofemtosecond laser pulses (12 ns) there is only a very smalltemperature increase of 0.25 K in PMMA at z = −40 nmbelow the nanoparticle surface (see figure 6(c)). Also thetemperature difference at this point (z = −40 nm) between thetemperature maximum at 4.5 ns and the temperature after 12 nsis only 0.7 K. This encourages us to increase the temperatureby additional femtosecond pulses, each of them after 12 ns.
Another interesting fact is a high temperature gradientnear the particle surface (see figure 6(d)). On the particle’ssurface we simulated a maximal temperature differencebetween the two laser pulses of 42 K. After 1 ns, thistemperature difference at the particle surface is only 27.5 K
7
Nanotechnology 19 (2008) 055207 F Garwe et al
(a)
(c) (d)
(b)
Figure 6. (a) 3D FEM simulation of the temperature distribution of a 30 nm gold sphere on PMMA 12 ns after the femtosecond laser pulse.(b) temperature for different times after the laser pulse at different vertical positions under the nanoparticle. The particle surface is here at theposition of 0 m. (c) Temperature development at different positions vertically below (z = −30 nm, z = −40 nm) and next to the nanosphere.(d) The same as in (c) for small distances from the nanosphere surface (z = 0 nm, −2 nm, −5 nm, −10 nm).
(a) (b)
Figure 7. (a) 3D FEM simulation of the temperature distribution of a 30 nm gold sphere on PMMA after five femtosecond laser pulses with80 MHz pulse repetition rate. (b) Temperature of the nanosphere after different numbers of femtosecond laser pulses with 80 MHz pulserepetition rate.
and in a distance of z = −10 nm a temperature difference ofonly 7.5 K is observed. This allows for a temperature controlbetween two femtosecond laser pulses by using space- andtime-controlled femtosecond laser pulses in interaction witha number of different shaped nanoparticles. To overcomethe temperature difference restriction (for gold nanoparticles,higher laser intensity would ablate the particles) the materialand shape parameters of the particles, the number of particlesand the environment could be varied.
Further simulations show the results after a number ofultrashort pulses in a time distance of 12 ns. Every pulse
increases the temperature of the particle. Figure 7(a) showsthe temperature in the PMMA surrounding after five pulses.After only five pulses a balance between cooling of the air andPMMA surroundings (convection and heat conduction) andthe periodic heating of the nanoparticle is reached. We findthat the maximal temperature change, which we can use, isonly 3.5 K (see figure 7(b)). An increase of the femtosecondlaser pulse repetition rate (time between two pulses is only1 ns) should lead to a further increase of the temperaturechange. The simulation in figure 8(b) shows a nanoparticletemperature of 420 K after 12 ns. In principle, any temperature
8
Nanotechnology 19 (2008) 055207 F Garwe et al
(a) (b)
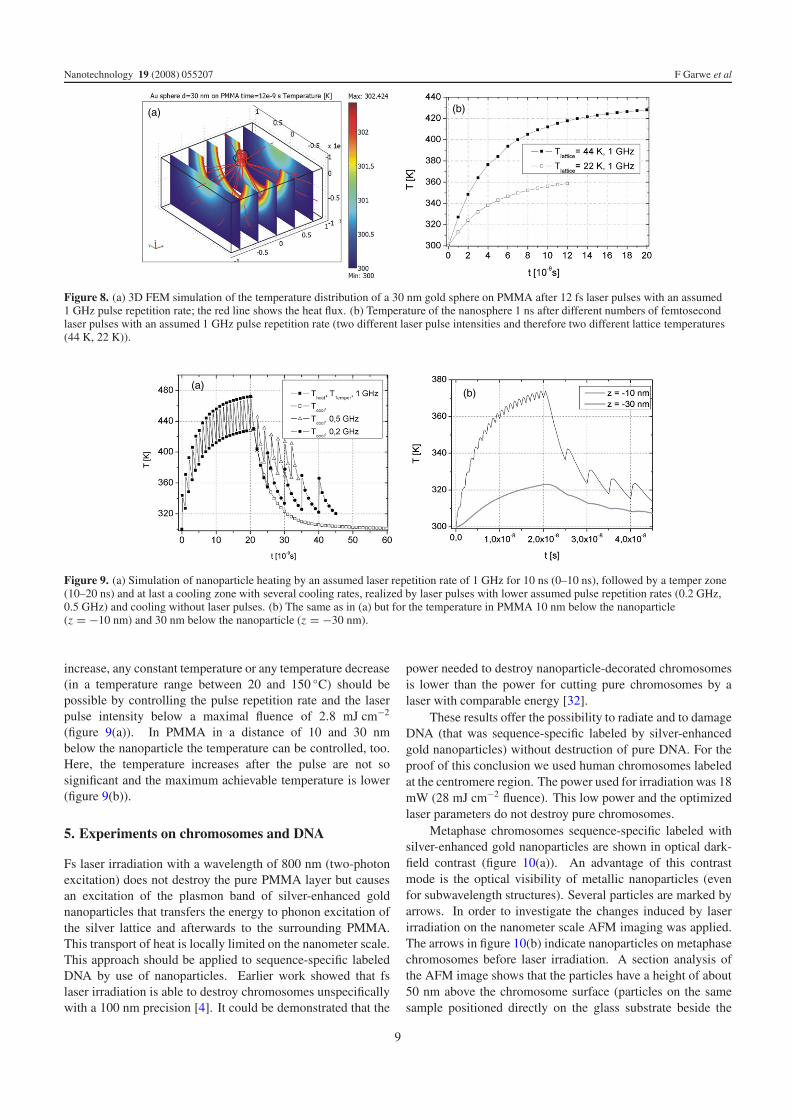
Figure 8. (a) 3D FEM simulation of the temperature distribution of a 30 nm gold sphere on PMMA after 12 fs laser pulses with an assumed1 GHz pulse repetition rate; the red line shows the heat flux. (b) Temperature of the nanosphere 1 ns after different numbers of femtosecondlaser pulses with an assumed 1 GHz pulse repetition rate (two different laser pulse intensities and therefore two different lattice temperatures(44 K, 22 K)).
(a)(b)
Figure 9. (a) Simulation of nanoparticle heating by an assumed laser repetition rate of 1 GHz for 10 ns (0–10 ns), followed by a temper zone(10–20 ns) and at last a cooling zone with several cooling rates, realized by laser pulses with lower assumed pulse repetition rates (0.2 GHz,0.5 GHz) and cooling without laser pulses. (b) The same as in (a) but for the temperature in PMMA 10 nm below the nanoparticle(z = −10 nm) and 30 nm below the nanoparticle (z = −30 nm).
increase, any constant temperature or any temperature decrease(in a temperature range between 20 and 150 ◦C) should bepossible by controlling the pulse repetition rate and the laserpulse intensity below a maximal fluence of 2.8 mJ cm−2
(figure 9(a)). In PMMA in a distance of 10 and 30 nmbelow the nanoparticle the temperature can be controlled, too.Here, the temperature increases after the pulse are not sosignificant and the maximum achievable temperature is lower(figure 9(b)).
5. Experiments on chromosomes and DNA
Fs laser irradiation with a wavelength of 800 nm (two-photonexcitation) does not destroy the pure PMMA layer but causesan excitation of the plasmon band of silver-enhanced goldnanoparticles that transfers the energy to phonon excitation ofthe silver lattice and afterwards to the surrounding PMMA.This transport of heat is locally limited on the nanometer scale.This approach should be applied to sequence-specific labeledDNA by use of nanoparticles. Earlier work showed that fslaser irradiation is able to destroy chromosomes unspecificallywith a 100 nm precision [4]. It could be demonstrated that the
power needed to destroy nanoparticle-decorated chromosomesis lower than the power for cutting pure chromosomes by alaser with comparable energy [32].
These results offer the possibility to radiate and to damageDNA (that was sequence-specific labeled by silver-enhancedgold nanoparticles) without destruction of pure DNA. For theproof of this conclusion we used human chromosomes labeledat the centromere region. The power used for irradiation was 18mW (28 mJ cm−2 fluence). This low power and the optimizedlaser parameters do not destroy pure chromosomes.
Metaphase chromosomes sequence-specific labeled withsilver-enhanced gold nanoparticles are shown in optical dark-field contrast (figure 10(a)). An advantage of this contrastmode is the optical visibility of metallic nanoparticles (evenfor subwavelength structures). Several particles are marked byarrows. In order to investigate the changes induced by laserirradiation on the nanometer scale AFM imaging was applied.The arrows in figure 10(b) indicate nanoparticles on metaphasechromosomes before laser irradiation. A section analysis ofthe AFM image shows that the particles have a height of about50 nm above the chromosome surface (particles on the samesample positioned directly on the glass substrate beside the
9
Nanotechnology 19 (2008) 055207 F Garwe et al
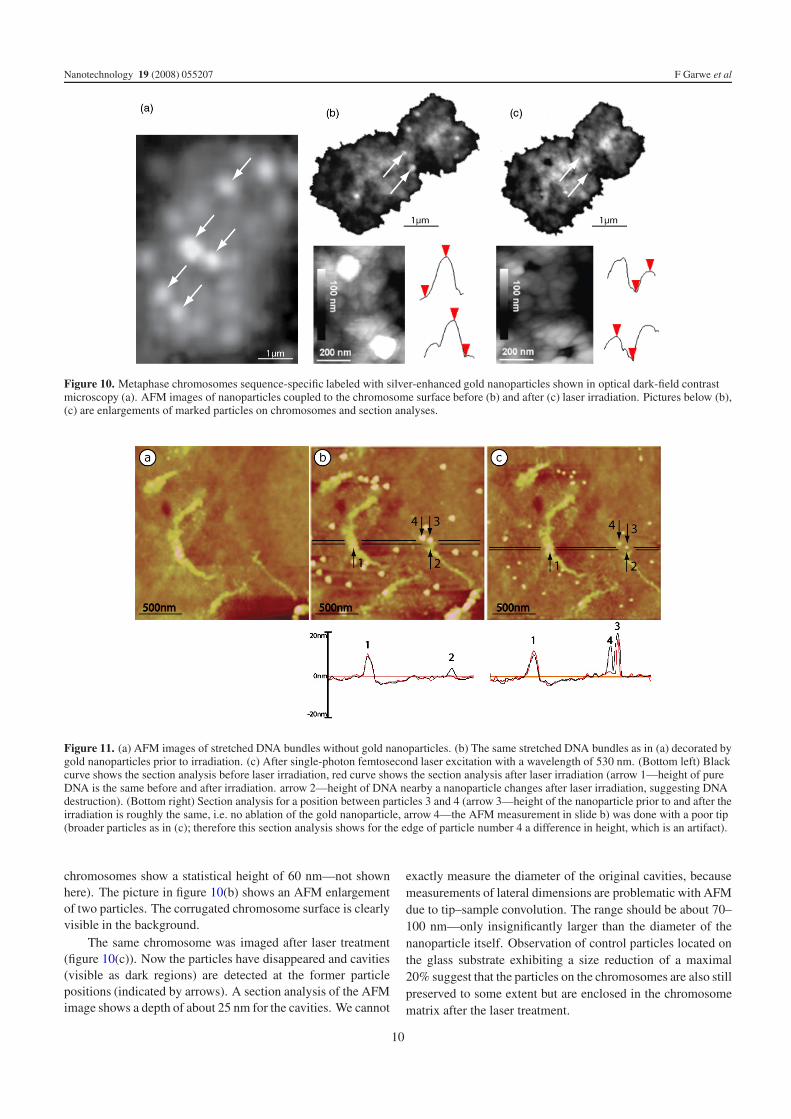
Figure 10. Metaphase chromosomes sequence-specific labeled with silver-enhanced gold nanoparticles shown in optical dark-field contrastmicroscopy (a). AFM images of nanoparticles coupled to the chromosome surface before (b) and after (c) laser irradiation. Pictures below (b),(c) are enlargements of marked particles on chromosomes and section analyses.
Figure 11. (a) AFM images of stretched DNA bundles without gold nanoparticles. (b) The same stretched DNA bundles as in (a) decorated bygold nanoparticles prior to irradiation. (c) After single-photon femtosecond laser excitation with a wavelength of 530 nm. (Bottom left) Blackcurve shows the section analysis before laser irradiation, red curve shows the section analysis after laser irradiation (arrow 1—height of pureDNA is the same before and after irradiation. arrow 2—height of DNA nearby a nanoparticle changes after laser irradiation, suggesting DNAdestruction). (Bottom right) Section analysis for a position between particles 3 and 4 (arrow 3—height of the nanoparticle prior to and after theirradiation is roughly the same, i.e. no ablation of the gold nanoparticle, arrow 4—the AFM measurement in slide b) was done with a poor tip(broader particles as in (c); therefore this section analysis shows for the edge of particle number 4 a difference in height, which is an artifact).
chromosomes show a statistical height of 60 nm—not shownhere). The picture in figure 10(b) shows an AFM enlargementof two particles. The corrugated chromosome surface is clearlyvisible in the background.
The same chromosome was imaged after laser treatment(figure 10(c)). Now the particles have disappeared and cavities(visible as dark regions) are detected at the former particlepositions (indicated by arrows). A section analysis of the AFMimage shows a depth of about 25 nm for the cavities. We cannot
exactly measure the diameter of the original cavities, becausemeasurements of lateral dimensions are problematic with AFMdue to tip–sample convolution. The range should be about 70–100 nm—only insignificantly larger than the diameter of thenanoparticle itself. Observation of control particles located onthe glass substrate exhibiting a size reduction of a maximal20% suggest that the particles on the chromosomes are also stillpreserved to some extent but are enclosed in the chromosomematrix after the laser treatment.
10
Nanotechnology 19 (2008) 055207 F Garwe et al
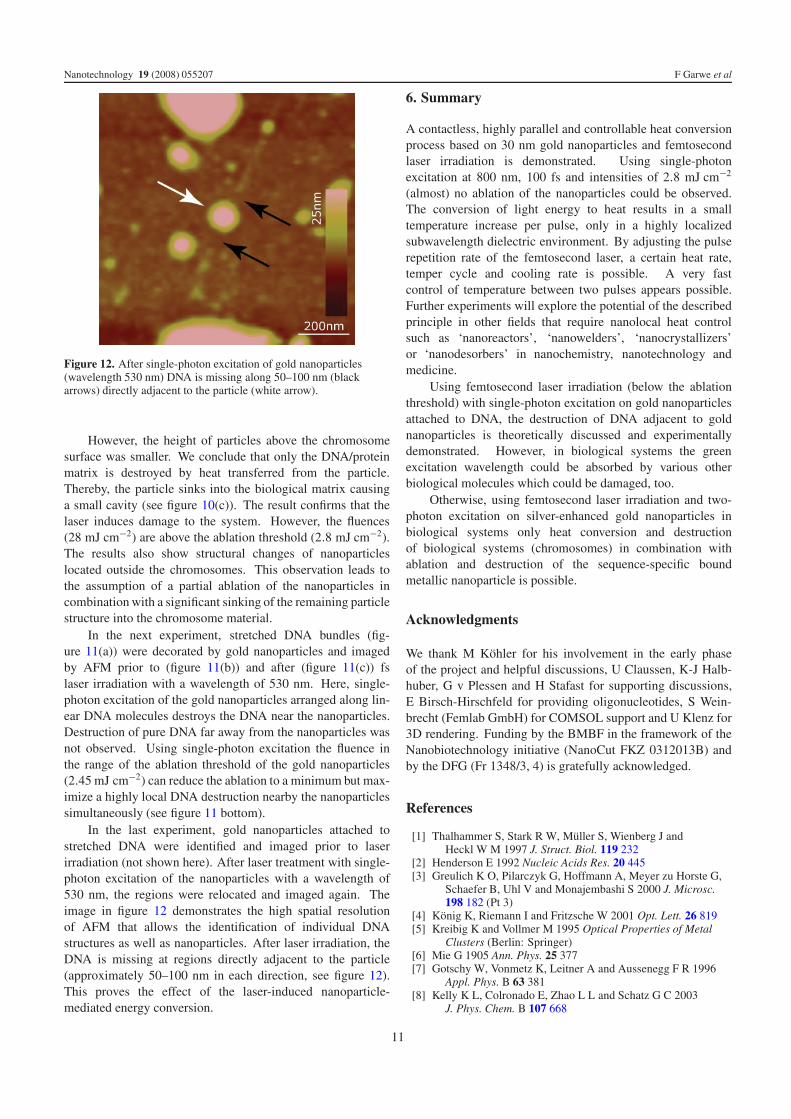
Figure 12. After single-photon excitation of gold nanoparticles(wavelength 530 nm) DNA is missing along 50–100 nm (blackarrows) directly adjacent to the particle (white arrow).
However, the height of particles above the chromosomesurface was smaller. We conclude that only the DNA/proteinmatrix is destroyed by heat transferred from the particle.Thereby, the particle sinks into the biological matrix causinga small cavity (see figure 10(c)). The result confirms that thelaser induces damage to the system. However, the fluences(28 mJ cm−2) are above the ablation threshold (2.8 mJ cm−2).The results also show structural changes of nanoparticleslocated outside the chromosomes. This observation leads tothe assumption of a partial ablation of the nanoparticles incombination with a significant sinking of the remaining particlestructure into the chromosome material.
In the next experiment, stretched DNA bundles (fig-ure 11(a)) were decorated by gold nanoparticles and imagedby AFM prior to (figure 11(b)) and after (figure 11(c)) fslaser irradiation with a wavelength of 530 nm. Here, single-photon excitation of the gold nanoparticles arranged along lin-ear DNA molecules destroys the DNA near the nanoparticles.Destruction of pure DNA far away from the nanoparticles wasnot observed. Using single-photon excitation the fluence inthe range of the ablation threshold of the gold nanoparticles(2.45 mJ cm−2) can reduce the ablation to a minimum but max-imize a highly local DNA destruction nearby the nanoparticlessimultaneously (see figure 11 bottom).
In the last experiment, gold nanoparticles attached tostretched DNA were identified and imaged prior to laserirradiation (not shown here). After laser treatment with single-photon excitation of the nanoparticles with a wavelength of530 nm, the regions were relocated and imaged again. Theimage in figure 12 demonstrates the high spatial resolutionof AFM that allows the identification of individual DNAstructures as well as nanoparticles. After laser irradiation, theDNA is missing at regions directly adjacent to the particle(approximately 50–100 nm in each direction, see figure 12).This proves the effect of the laser-induced nanoparticle-mediated energy conversion.
6. Summary
A contactless, highly parallel and controllable heat conversionprocess based on 30 nm gold nanoparticles and femtosecondlaser irradiation is demonstrated. Using single-photonexcitation at 800 nm, 100 fs and intensities of 2.8 mJ cm−2
(almost) no ablation of the nanoparticles could be observed.The conversion of light energy to heat results in a smalltemperature increase per pulse, only in a highly localizedsubwavelength dielectric environment. By adjusting the pulserepetition rate of the femtosecond laser, a certain heat rate,temper cycle and cooling rate is possible. A very fastcontrol of temperature between two pulses appears possible.Further experiments will explore the potential of the describedprinciple in other fields that require nanolocal heat controlsuch as ‘nanoreactors’, ‘nanowelders’, ‘nanocrystallizers’or ‘nanodesorbers’ in nanochemistry, nanotechnology andmedicine.
Using femtosecond laser irradiation (below the ablationthreshold) with single-photon excitation on gold nanoparticlesattached to DNA, the destruction of DNA adjacent to goldnanoparticles is theoretically discussed and experimentallydemonstrated. However, in biological systems the greenexcitation wavelength could be absorbed by various otherbiological molecules which could be damaged, too.
Otherwise, using femtosecond laser irradiation and two-photon excitation on silver-enhanced gold nanoparticles inbiological systems only heat conversion and destructionof biological systems (chromosomes) in combination withablation and destruction of the sequence-specific boundmetallic nanoparticle is possible.
Acknowledgments
We thank M Kohler for his involvement in the early phaseof the project and helpful discussions, U Claussen, K-J Halb-huber, G v Plessen and H Stafast for supporting discussions,E Birsch-Hirschfeld for providing oligonucleotides, S Wein-brecht (Femlab GmbH) for COMSOL support and U Klenz for3D rendering. Funding by the BMBF in the framework of theNanobiotechnology initiative (NanoCut FKZ 0312013B) andby the DFG (Fr 1348/3, 4) is gratefully acknowledged.
References
[1] Thalhammer S, Stark R W, Muller S, Wienberg J andHeckl W M 1997 J. Struct. Biol. 119 232
[2] Henderson E 1992 Nucleic Acids Res. 20 445[3] Greulich K O, Pilarczyk G, Hoffmann A, Meyer zu Horste G,
Schaefer B, Uhl V and Monajembashi S 2000 J. Microsc.198 182 (Pt 3)
[4] Konig K, Riemann I and Fritzsche W 2001 Opt. Lett. 26 819[5] Kreibig K and Vollmer M 1995 Optical Properties of Metal
Clusters (Berlin: Springer)[6] Mie G 1905 Ann. Phys. 25 377[7] Gotschy W, Vonmetz K, Leitner A and Aussenegg F R 1996
Appl. Phys. B 63 381[8] Kelly K L, Colronado E, Zhao L L and Schatz G C 2003
J. Phys. Chem. B 107 668
11
Nanotechnology 19 (2008) 055207 F Garwe et al
[9] Ashcroft N W and Mermin N D 1976 Solid State Physics(Philadelphia, PA: Saunders College)
[10] Kittel C 1996 Introduction to Solid State Physics(New York: Wiley)
[11] Groeneveld R and Sprik R 1995 Phys. Rev. B 51 11433[12] Tokizaki T, Nakamura A, Kaneko S, Uchida K, Orni S,
Tanji H and Asahara Y 1994 Appl. Phys. Lett. 65 8[13] Ahmadi T, Logunov S L and El-Sayed M A 1996 J. Phys.
Chem. 100 8053[14] Yoshelyev M V, Gao X, Xing Y, Al-Hijj A, Nie S and
o’Regan R M 2006 Lancet Oncol. 7 657[15] Radt B, Serbin J, Lange B I, Birngruber R and
Huttmann G 2001 SPIE 4433 16[16] Alivisatos A P, Johnsson K P, Peng X, Wilson T E, Loweth C J,
Bruchez M P Jr and Schultz P G 1996 Nature 382 609[17] Mirkin C A, Letsinger R L, Mucic R C and Storhoff J J 1996
Nature 382 607[18] Csaki A, Maubach G, Born D, Reichert J and Fritzsche W 2002
Single Mol. 3 275[19] Pissuwan D, Valenzuela S M and Cortie M B 2006 Trends
Biotechnol. 24 62[20] Johnson F H, Eyring H and Stover B J 1974 The Theory of Rate
Processes in Biology and Medicine (New York: Wiley)[21] Denk W, Stickler J H and Webb W W 1990 Science 248 73
[22] Cunningham M L, Johnson J S, Giovanazzi S M andPeak M J 1985 Photochem. Photobiol. 42 125
[23] Logunov S L, Ahmadi T S, El-Sayed M A, Khoury J T andWhetten R L 1997 J. Phys. Chem. B 101 3713
[24] Comsol Multiphysics Heat Transfer Module Users GuideComsol 3.3
[25] Link S, Burda C, Nikoobakht B and El-Sayed M A 2000J. Phys. Chem. B 104 6152
[26] Garwe F, Schonhals A, Lockwenz H, Beiner M, Schroter K andDonth E 1996 Macromolecules 29 247
[27] Blombergen N 1974 IEEE J. Quantum Electron. 10 375[28] Perner M, Bost P, Lemmer U, Plessen G von, Feldmann J,
Becker U, Menning M, Schmitt M and Schmidt H 1997Phys. Rev. Lett. 78 2192
[29] Pines D and Nozieres P 1966 The Theory of Quantum Liquids(New York: Benjamin)
[30] Fryer D S, Peters R D, Kim E J, Tomaszewski J E, Pablo J J de,Nealy P F, White C C and Wu W 2001 Macromolecules34 5627
[31] Struck L M, Richter L J, Buntin A, Cavanagh R R andStephenson J C 1996 Phys. Rev. Lett. 77 4576
[32] Csaki A, Garwe F, Steinbruck A, Maubach G, Festag G,Weise A, Riemann I, Konig K and Fritzsche W 2007Nano Lett. 7 247
12


![Magnetic Shape Memory Polymers with Integrated Multifunctional Shape Manipulation · 2019/10/10 · magnetic soft materials,[2,8] and shape memory polymers (SMPs).[1a,9] Despite](https://img.pdfslide.us/doc/110x75/60276e5175198d0279097473/magnetic-shape-memory-polymers-with-integrated-multifunctional-shape-20191010.jpg)