Embed Size (px)
Citation preview
Developed by the USC Institute for Families in Society, Division of Medicaid Policy ResearchUnder Contract to the SC Department of Health and Human Services
South Carolina Birth Outcomes Initiative Data Workgroup’sAnnual Report of the South Carolina Birth Outcomes InitiativeLaying the Groundwork to Eliminate Maternal and Child Health Disparities in South Carolina by Addressing the Social Determinants of Health March 2015

RECOMMENDED CITATION
Gareau, S. & Lòpez-DeFede, A. (2015, March). South Carolina Birth Outcomes Initiative Data Workgroup’s Annual Report of the South Carolina Birth Outcomes Initiative: Laying the Groundwork to Eliminate Maternal and Child Health Disparities in South Carolina by Addressing the Social Determinants of Health. Developed by the University of South Carolina Institute for Families in Society, Division of Medicaid Policy Research under contract to the South Carolina Department of Health and Human Services.
USC Institute for Families in Society Division of Medicaid Policy Research
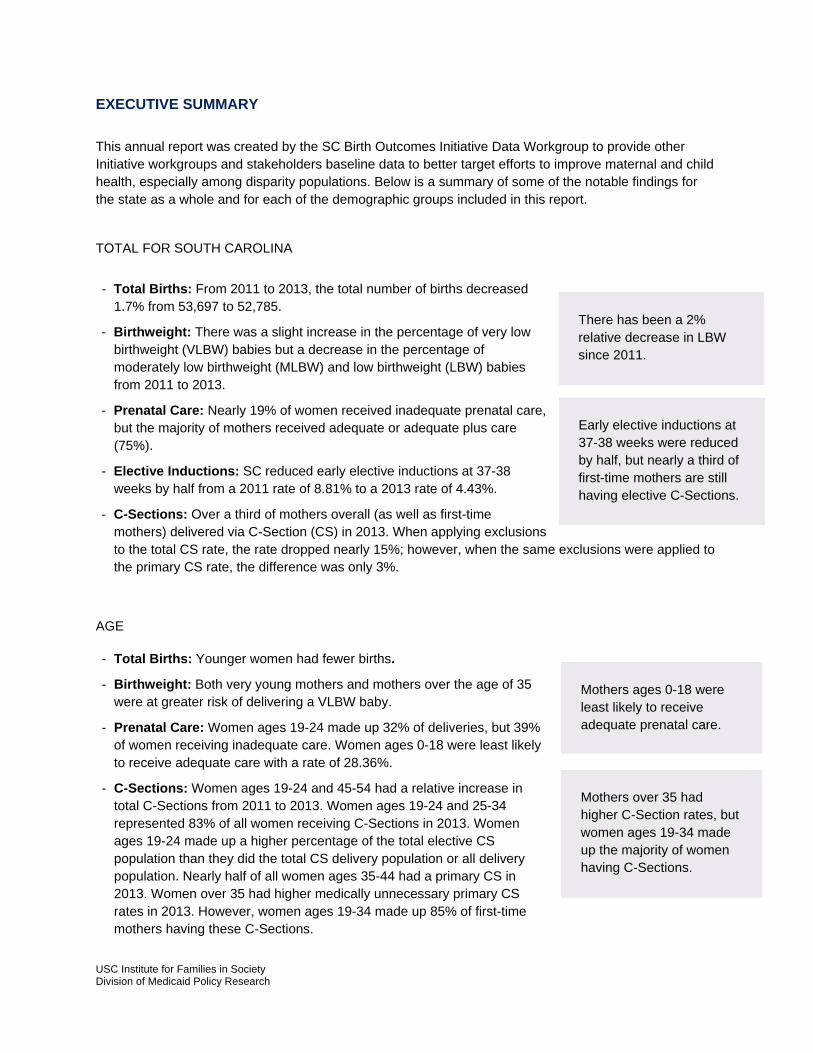
EXECUTIVE SUMMARY
This annual report was created by the SC Birth Outcomes Initiative Data Workgroup to provide other Initiative workgroups and stakeholders baseline data to better target efforts to improve maternal and child health, especially among disparity populations. Below is a summary of some of the notable findings for the state as a whole and for each of the demographic groups included in this report.
TOTAL FOR SOUTH CAROLINA
- Total Births: From 2011 to 2013, the total number of births decreased 1.7% from 53,697 to 52,785.
- Birthweight: There was a slight increase in the percentage of very low birthweight (VLBW) babies but a decrease in the percentage of moderately low birthweight (MLBW) and low birthweight (LBW) babies from 2011 to 2013.
- Prenatal Care: Nearly 19% of women received inadequate prenatal care, but the majority of mothers received adequate or adequate plus care (75%).
- Elective Inductions: SC reduced early elective inductions at 37-38 weeks by half from a 2011 rate of 8.81% to a 2013 rate of 4.43%.
- C-Sections: Over a third of mothers overall (as well as first-time mothers) delivered via C-Section (CS) in 2013. When applying exclusions to the total CS rate, the rate dropped nearly 15%; however, when the same exclusions were applied to the primary CS rate, the difference was only 3%.
AGE
- Total Births: Younger women had fewer births.
- Birthweight: Both very young mothers and mothers over the age of 35 were at greater risk of delivering a VLBW baby.
- Prenatal Care: Women ages 19-24 made up 32% of deliveries, but 39% of women receiving inadequate care. Women ages 0-18 were least likely to receive adequate care with a rate of 28.36%.
- C-Sections: Women ages 19-24 and 45-54 had a relative increase in total C-Sections from 2011 to 2013. Women ages 19-24 and 25-34 represented 83% of all women receiving C-Sections in 2013. Women ages 19-24 made up a higher percentage of the total elective CS population than they did the total CS delivery population or all delivery population. Nearly half of all women ages 35-44 had a primary CS in 2013. Women over 35 had higher medically unnecessary primary CS rates in 2013. However, women ages 19-34 made up 85% of first-time mothers having these C-Sections.
Early elective inductions at 37-38 weeks were reduced by half, but nearly a third of first-time mothers are still having elective C-Sections.
There has been a 2% relative decrease in LBW since 2011.
Mothers ages 0-18 were least likely to receive adequate prenatal care.
Mothers over 35 had higher C-Section rates, but women ages 19-34 made up the majority of women having C-Sections.
USC Institute for Families in Society ii Division of Medicaid Policy Research
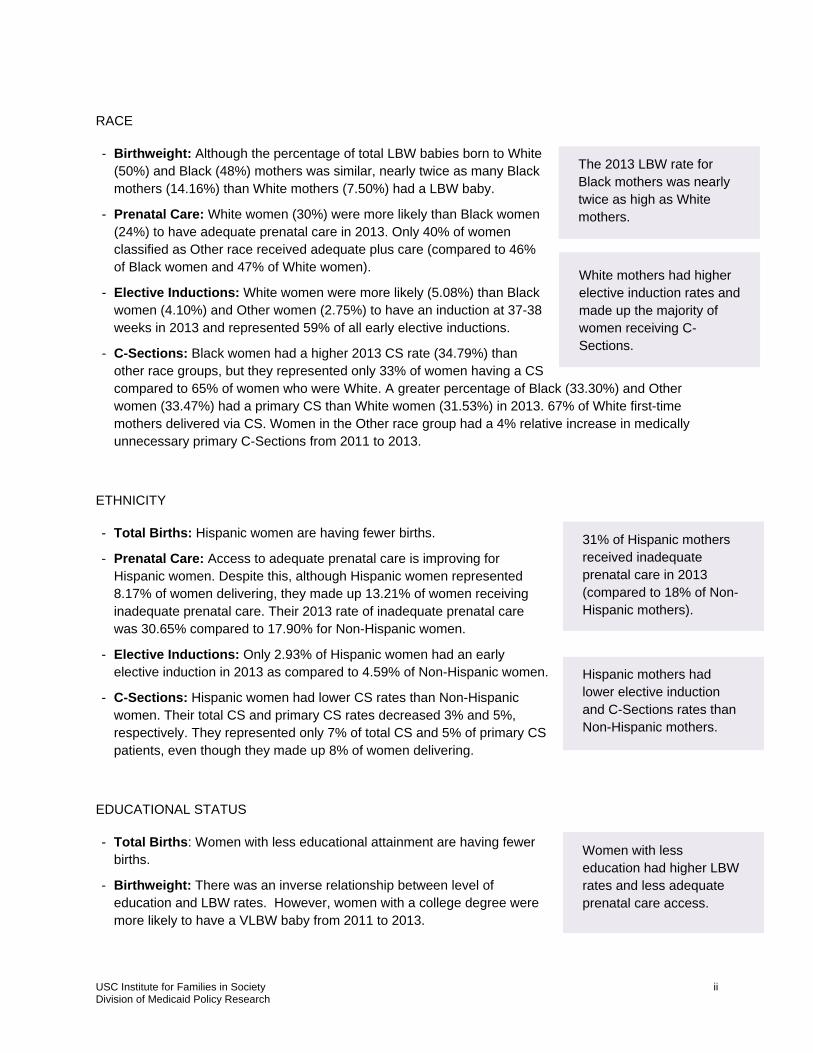
RACE
- Birthweight: Although the percentage of total LBW babies born to White (50%) and Black (48%) mothers was similar, nearly twice as many Black mothers (14.16%) than White mothers (7.50%) had a LBW baby.
- Prenatal Care: White women (30%) were more likely than Black women (24%) to have adequate prenatal care in 2013. Only 40% of women classified as Other race received adequate plus care (compared to 46% of Black women and 47% of White women).
- Elective Inductions: White women were more likely (5.08%) than Black women (4.10%) and Other women (2.75%) to have an induction at 37-38 weeks in 2013 and represented 59% of all early elective inductions.
- C-Sections: Black women had a higher 2013 CS rate (34.79%) than other race groups, but they represented only 33% of women having a CS compared to 65% of women who were White. A greater percentage of Black (33.30%) and Other women (33.47%) had a primary CS than White women (31.53%) in 2013. 67% of White first-time mothers delivered via CS. Women in the Other race group had a 4% relative increase in medically unnecessary primary C-Sections from 2011 to 2013.
ETHNICITY
- Total Births: Hispanic women are having fewer births.
- Prenatal Care: Access to adequate prenatal care is improving for Hispanic women. Despite this, although Hispanic women represented 8.17% of women delivering, they made up 13.21% of women receiving inadequate prenatal care. Their 2013 rate of inadequate prenatal care was 30.65% compared to 17.90% for Non-Hispanic women.
- Elective Inductions: Only 2.93% of Hispanic women had an early elective induction in 2013 as compared to 4.59% of Non-Hispanic women.
- C-Sections: Hispanic women had lower CS rates than Non-Hispanic women. Their total CS and primary CS rates decreased 3% and 5%, respectively. They represented only 7% of total CS and 5% of primary CS patients, even though they made up 8% of women delivering.
EDUCATIONAL STATUS
- Total Births: Women with less educational attainment are having fewer births.
- Birthweight: There was an inverse relationship between level of education and LBW rates. However, women with a college degree were more likely to have a VLBW baby from 2011 to 2013.
The 2013 LBW rate for Black mothers was nearly twice as high as White mothers.
White mothers had higher elective induction rates and made up the majority of women receiving C-Sections.
31% of Hispanic mothers received inadequate prenatal care in 2013 (compared to 18% of Non-Hispanic mothers).
Hispanic mothers had lower elective induction and C-Sections rates than Non-Hispanic mothers.
Women with less education had higher LBW rates and less adequate prenatal care access.

USC Institute for Families in Society iii Division of Medicaid Policy Research
- Prenatal Care: 33% of college-educated mothers received adequate prenatal care compared to only 24% of women with less than a high school education. Mothers with less than a high school graduate made up 17.23% of all deliveries but only 13.94% of mothers receiving adequate plus care.
- C-Sections: Women with more education had higher total CS rates, as well as total and elective primary CS rates. However, they were less likely in 2013 than in 2011 to have any type of CS.
BODY MASS INDEX
- Birthweight: A higher percentage of mothers measured as obese had VLBW babies. Nearly half of LBW babies were born to overweight or obese mothers, but the highest 2013 rate was among mothers measured as underweight (15.13%).
- Prenatal Care: Women who were classified as obese (51.26%) were more likely than overweight (46.45%) or normal weight (43.86%) mothers to receive adequate plus care in 2013.
- Elective Inductions: A greater percentage of obese women had an early elective induction in 2013 (5.28%) than all other BMI categories, and their relative reduction from 2011 to 2013 was also lower.
- C-Sections: Nearly 30% of women measured as obese had a medically unnecessary CS in 2013, and they represented the largest BMI category among the CS population. Only 18.76% of underweight women had a primary CS compared to 46.97% of women measured as obese.
PAYER
- Total Births: Women qualifying for Medicaid are having fewer births.
- Birthweight: Babies delivered by women categorized as self-pay had the highest rate of VLBW, and the rate has increased 33% since 2011. All other payer types also had a decrease in the percentage of LBW babies.
- Prenatal Care: Women with private insurance were 24% more likely to receive inadequate prenatal care from 2011 to 2013; nevertheless, only 9% of women with private insurance received such care in 2013 (compared to 24% of women qualifying for Medicaid and 29% of self-pay women). Although a greater percentage of women with private insurance received adequate prenatal care, women identifying as Medicaid or self-pay were more likely in 2013 than in 2011 to receive such care.
- Elective Inductions: Women identified as self-pay had less of a relative decrease (25%) compared to other payer types.
Women with more education had the highest C-Section rates.
Nearly half of LBW babies were born to overweight or obese mothers. These mothers also had higher elective induction and C-Section rates.
Mothers measured as normal weight had a lower adequate plus prenatal care rate than other mothers.
All payer types but self-pay saw a decrease in LBW from 2011 to 2013. These mothers also made less progress reducing early elective inductions.
Women with private insurance had higher rates of adequate prenatal care, but they also had the highest 2013 C-Section rates.
USC Institute for Families in Society iv Division of Medicaid Policy Research
- C-Sections: Women with private insurance had the highest 2013 CS rate of any payer type, regardless of type of CS. All payers decreased their percentage of primary C-Sections, but women designated self-pay had the greatest relative improvement (12%).
PERINATAL LEVEL
- Birthweight: Perinatal Level III hospitals were most likely to treat a LBW baby (53%) and had the highest 2013 rate (14.14%).
- Prenatal Care: Women served in Perinatal Level III hospitals had the highest 2013 rate of inadequate prenatal care (22%), which represented a 2% relative increase from 2011.
- Elective Inductions: The majority of early elective inductions occurred in Perinatal Level II & IIE hospitals in 2013, and they had the highest 2013 rate (5.15%).
- C-Sections: Total CS and Primary CS rates were lower in Perinatal Level I facilities than other perinatal levels. These facilities only performed approximately 10% of all C-Sections. Most medically unnecessary primary C-Sections in 2013 were performed in Perinatal Levels II & IIE facilities (57%) followed by Level III (33%) and Level I (9%).
RURAL-URBAN
- Total Births: Women residing in rural areas are having fewer births.
- Birthweight: A greater percentage of rural women had very low and MLBW babies (although the percentage of MLBW babies is decreasing for these women).
- C-Sections: Rural women had lower CS rates than urban women, regardless of necessity.
RECOMMENDED NEXT STEPS
o Development of SC BOI Workgroup Strategies: Each of the specific SC BOI workgroups set goals for 2015 that were used to develop the Initiative’s overarching goals for this year. The findings in this report can be used to develop targeted strategies based on areas of greatest need to better meet these goals.
o Implementation of Additional Payment Modifiers: Given the improvement observed for elective inductions at 37-38 weeks gestation, primarily due to SC DHHS and Blue Cross Blue Shield of SC jointly partnering to deny payment for these deliveries, payment modifiers for other clinical outcomes are recommended.
Perinatal Level III hospitals had the highest 2013 LBW rate, as well as rate of inadequate prenatal care.
The majority of elective inductions and C-Sections occurred in Perinatal Level II & IIE facilities.
Mothers residing in rural areas had a higher LBW rate, but lower C-Section rates.

USC Institute for Families in Society v Division of Medicaid Policy Research
o Provider Outreach through Perinatal Regional Coordinators: The highest perinatal level rates of elective inductions and C-Sections are occurring in Perinatal Level II & IIE birthing facilities. Outreach through the perinatal regional coordinators to specific OB/GYN providers in these facilities is recommended. Additionally, better understanding why mothers served in Perinatal Level III had the highest rate of inadequate prenatal care would be beneficial.
o Targeted Patient Outreach: Patient education for specific groups of women is recommended. For instance, younger women and women with less education had higher rates of low birthweight and lower rates of adequate prenatal care. These mothers are having fewer births, but continued outreach through the SC Campaign to Prevent Teenage Pregnancy and other SC BOI partner organizations may be beneficial. Likewise, based on 2013 rates by payer type, women with private insurance may need additional patient information on the risks of elective C-Sections. Lastly, rates of elective procedures are lower for Hispanic women than Non-Hispanic women. Better understanding what drives these lower rates may benefit all mothers and babies.
o Additional Research: To ensure that all aspects of maternal and child health are addressed (not just those explored in this report), ongoing data reporting for other outcomes is recommended. This includes new measures that have not been previously explored, but for which there has been clinical and public health interest, as well as ongoing research on measures not included in the quarterly hospital reports.
USC Institute for Families in Society vi Division of Medicaid Policy Research
TABLE OF CONTENTS
EXECUTIVE SUMMARY ............................................................................................................................... i RECOMMENDED NEXT STEPS .................................................................................................................. iv BACKGROUND OF THE SC BIRTH OUTCOMES INITIATIVE ................................................................... 1 NAVIGATING THIS REPORT ....................................................................................................................... 2 SOUTH CAROLINA BIRTH OUTCOMES INITIATIVE DATA WORKGROUP MEMBERS .......................... 4 DEFINITIONS USED IN THIS REPORT ...................................................................................................... 5 NOTES FOR THE INTERPRETATION OF FINDINGS ................................................................................ 7 KEY FINDINGS ............................................................................................................................................. 8 DISCUSSION .............................................................................................................................................. 16 SECTION I: TOTAL BIRTHS ................................................................................................................ ..... 19
SUMMARY OF FINDINGS: TOTAL BIRTHS ........................................................................................................ 20
2011-2013 TOTAL BIRTHS .......................................................................................................................... 21
2011-2013 DEMOGRAPHIC BIRTH PROFILE .................................................................................................. 22
SECTION II: BIRTHWEIGHT ...................................................................................................................... 23
SUMMARY OF FINDINGS: VERY LOW BIRTHWEIGHT ......................................................................................... 24
2011-2013 PERCENTAGE OF VERY LOW BIRTHWEIGHT ................................................................................. 25
2013 PERCENTAGE OF TOTAL VERY LOW BIRTHWEIGHT ................................................................................ 26
SUMMARY OF FINDINGS: MODERATELY LOW BIRTHWEIGHT ............................................................................. 27
2011-2013 PERCENTAGE OF MODERATELY LOW BIRTHWEIGHT .................................................................... 28
2013 PERCENTAGE OF TOTAL MODERATELY LOW BIRTHWEIGHT .................................................................... 29
SUMMARY OF FINDINGS: LOW BIRTHWEIGHT ................................................................................................. 30
2011-2013 PERCENTAGE OF LOW BIRTHWEIGHT ......................................................................................... 31
2013 PERCENTAGE OF TOTAL LOW BIRTHWEIGHT ........................................................................................ 32
SUMMARY OF FINDINGS: NORMAL BIRTHWEIGHT ............................................................................................ 33
2011-2013 PERCENTAGE OF NORMAL BIRTHWEIGHT ................................................................................... 34
2013 PERCENTAGE OF TOTAL NORMAL BIRTHWEIGHT ................................................................................... 35
SECTION III: ACCESS TO PRENATAL CARE .......................................................................................... 36
SUMMARY OF FINDINGS: INADEQUATE PRENATAL CARE ................................................................................. 37
2011-2013 PERCENTAGE OF INADEQUATE PRENATAL CARE ......................................................................... 38
2013 PERCENTAGE OF TOTAL INADEQUATE PRENATAL CARE ........................................................................ 39
SUMMARY OF FINDINGS: INTERMEDIATE PRENATAL CARE............................................................................... 40
2011-2013 PERCENTAGE OF INTERMEDIATE PRENATAL CARE ...................................................................... 41
USC Institute for Families in Society vii Division of Medicaid Policy Research
2013 PERCENTAGE OF TOTAL INTERMEDIATE PRENATAL CARE...................................................................... 42
SUMMARY OF FINDINGS: ADEQUATE PRENATAL CARE .................................................................................... 43
2011-2013 PERCENTAGE OF ADEQUATE PRENATAL CARE ............................................................................ 44
2013 PERCENTAGE OF TOTAL ADEQUATE PRENATAL CARE ........................................................................... 45
SUMMARY OF FINDINGS: ADEQUATE PLUS PRENATAL CARE ............................................................................ 46
2011-2013 PERCENTAGE OF ADEQUATE PLUS PRENATAL CARE .................................................................... 47
2013 PERCENTAGE OF TOTAL ADEQUATE PRENATAL CARE ........................................................................... 48
SECTION IV: ELECTIVE INDUCTIONS AT 37-38 WEEKS GESTATION ................................................. 49
SUMMARY OF FINDINGS: ELECTIVE INDUCTIONS AT 37-38 WEEKS GESTATION ................................................. 50
2011-2013 PERCENTAGE OF ELECTIVE INDUCTIONS AT 37-38 WEEKS GESTATION ......................................... 51
2013 PERCENTAGE OF TOTAL ELECTIVE INDUCTIONS AT 37-38 WEEKS GESTATION ........................................ 52
SECTION V: TOTAL C-SECTIONS AT 37+ WEEKS GESTATION ........................................................... 53
SUMMARY OF FINDINGS: TOTAL C-SECTIONS AT 37+ WEEKS GESTATION......................................................... 54
2011-2013 PERCENTAGE OF TOTAL C-SECTIONS AT 37+ WEEKS GESTATION ................................................ 55
2013 PERCENTAGE OF TOTAL: TOTAL C-SECTIONS AT 37+ WEEKS GESTATION .............................................. 56
SUMMARY OF FINDINGS: TOTAL C-SECTIONS AT 37+ WEEKS GESTATION (WITH EXCLUSIONS) .......................... 57
2011-2013 PERCENTAGE OF TOTAL C-SECTIONS AT 37+ WEEKS GESTATION (WITH EXCLUSIONS) .................. 58
2013 PERCENTAGE OF TOTAL: TOTAL C-SECTIONS AT 37+ WEEKS GESTATION (WITH EXCLUSIONS) ................ 59
SECTION VI: PRIMARY C-SECTIONS FOR FIRST-TIME MOTHERS AT 37+ WEEKS GESTATION .................................. 60
SUMMARY OF FINDINGS: PRIMARY C-SECTIONS AT 37+ WEEKS GESTATION ..................................................... 61
2011-2013 PERCENTAGE OF PRIMARY C-SECTIONS AT 37+ WEEKS GESTATION ............................................. 62
2013 PERCENTAGE OF TOTAL PRIMARY C-SECTIONS AT 37+ WEEKS GESTATION ............................................ 63
SUMMARY OF FINDINGS: PRIMARY C-SECTIONS AT 37+ WEEKS GESTATION (WITH EXCLUSIONS) ....................... 64
2011-2013 PERCENTAGE OF PRIMARY C-SECTIONS AT 37+ WEEKS GESTATION (WITH EXCLUSIONS) .............. 65
2013 PERCENTAGE OF TOTAL PRIMARY C-SECTIONS AT 37+ WEEKS GESTATION (WITH EXCLUSIONS) .............. 66
SECTION VII: PRIMARY C-SECTIONS FOR FIRST-TIME MOTHERS AT 39-40 WEEKS GESTATION ............................... 67
SUMMARY OF FINDINGS: PRIMARY C-SECTIONS AT 39-40 WEEKS GESTATION .................................................. 68
2011-2013 PERCENTAGE OF PRIMARY C-SECTIONS AT 39-40 WEEKS GESTATION ......................................... 69
2013 PERCENTAGE OF TOTAL PRIMARY C-SECTIONS AT 39-40 WEEKS GESTATION ......................................... 70
SUMMARY OF FINDINGS: PRIMARY C-SECTIONS AT 39-40 WEEKS GESTATION (WITH EXCLUSIONS) ................... 71
2011-2013 PERCENTAGE OF PRIMARY C-SECTIONS AT 39-40 WEEKS GESTATION (WITH EXCLUSIONS) ........... 72
2013 PERCENTAGE OF TOTAL PRIMARY C-SECTIONS AT 39-40 WEEKS GESTATION (WITH EXCLUSIONS) .......... 73
APPENDIX A: DATA SOURCES ..................................................................................................................... 74
APPENDIX B: DETAILED INFORMATION ABOUT THE JOINT COMMISSION EXCLUSION CRITERIA ............................ 75
USC Institute for Families in Society Division of Medicaid Policy Research
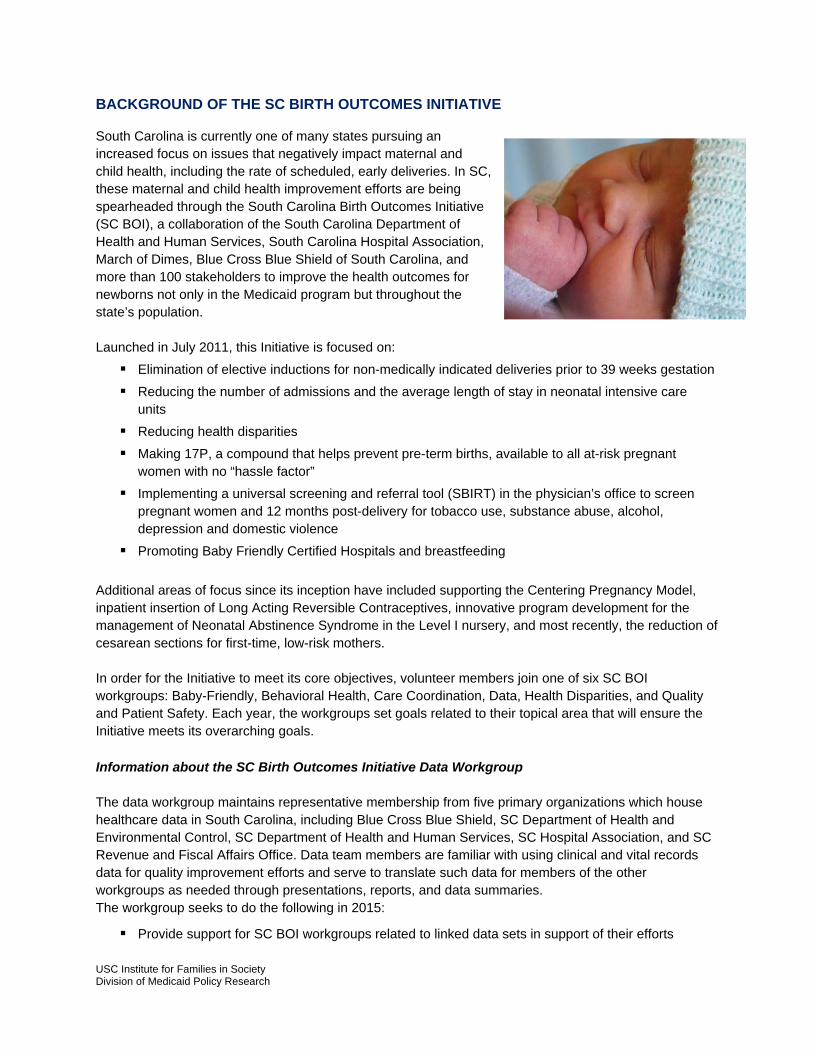
BACKGROUND OF THE SC BIRTH OUTCOMES INITIATIVE South Carolina is currently one of many states pursuing an increased focus on issues that negatively impact maternal and child health, including the rate of scheduled, early deliveries. In SC, these maternal and child health improvement efforts are being spearheaded through the South Carolina Birth Outcomes Initiative (SC BOI), a collaboration of the South Carolina Department of Health and Human Services, South Carolina Hospital Association, March of Dimes, Blue Cross Blue Shield of South Carolina, and more than 100 stakeholders to improve the health outcomes for newborns not only in the Medicaid program but throughout the state’s population. Launched in July 2011, this Initiative is focused on:
Elimination of elective inductions for non-medically indicated deliveries prior to 39 weeks gestation
Reducing the number of admissions and the average length of stay in neonatal intensive care units
Reducing health disparities
Making 17P, a compound that helps prevent pre-term births, available to all at-risk pregnant women with no “hassle factor”
Implementing a universal screening and referral tool (SBIRT) in the physician’s office to screen pregnant women and 12 months post-delivery for tobacco use, substance abuse, alcohol, depression and domestic violence
Promoting Baby Friendly Certified Hospitals and breastfeeding
Additional areas of focus since its inception have included supporting the Centering Pregnancy Model, inpatient insertion of Long Acting Reversible Contraceptives, innovative program development for the management of Neonatal Abstinence Syndrome in the Level I nursery, and most recently, the reduction of cesarean sections for first-time, low-risk mothers. In order for the Initiative to meet its core objectives, volunteer members join one of six SC BOI workgroups: Baby-Friendly, Behavioral Health, Care Coordination, Data, Health Disparities, and Quality and Patient Safety. Each year, the workgroups set goals related to their topical area that will ensure the Initiative meets its overarching goals. Information about the SC Birth Outcomes Initiative Data Workgroup The data workgroup maintains representative membership from five primary organizations which house healthcare data in South Carolina, including Blue Cross Blue Shield, SC Department of Health and Environmental Control, SC Department of Health and Human Services, SC Hospital Association, and SC Revenue and Fiscal Affairs Office. Data team members are familiar with using clinical and vital records data for quality improvement efforts and serve to translate such data for members of the other workgroups as needed through presentations, reports, and data summaries. The workgroup seeks to do the following in 2015:
Provide support for SC BOI workgroups related to linked data sets in support of their efforts

USC Institute for Families in Society 2 Division of Medicaid Policy Research
Identify resources for workgroup requests that cannot be completed with current data workgroup resources
Provide continued support for reporting at the hospital level MCH health outcomes addressing SC BOI efforts
Provide to stakeholders an annual statewide report at the population level addressing SC BOI efforts
Provide the Vision Council support for the development of new areas of inquiry
NAVIGATING THIS REPORT At the 2011 start of the SC Birth Outcomes Initiative (SC BOI), although the overall infant mortality rate in S.C. had declined, the rate for Black and Other infants was still greater than twice the rate for White infants (White: 5.0 infant deaths per 1,000 live births; Black and Other: 11.8 infant deaths per 1,000 live births). 1 There were a number of related risk factors for this, including the fact that:
12.1% of White infants were premature as compared to 18.3% of Black infants.2
Twice as many Black women reported inadequate prenatal care utilization as compared to White women.1
The ratio of Black to White low birthweight babies was 1.93.3
Improving these racial health disparities requires addressing the social determinants of health, such as socioeconomic status, rurality, access to health care, educational attainment, and individual characteristics (e.g., age and chronic disease risk). SC BOI seeks to do this through state policy changes, care coordination, and direct community action focused on health disparities through public-private partnerships. In order to help SC BOI set the groundwork for decreasing these maternal and child health disparities, this report provides some general baseline maternal and child health disparity information for several birth outcomes tracked by the Initiative:
Total births
Birthweight: very low, moderately low, low, and normal
Access to prenatal care: inadequate, intermediate, adequate, and adequate plus
Elective inductions at 37-38 weeks gestation
Total C-Sections at 37+ weeks gestation (with and without exclusions)
Primary C-Sections at 37+ weeks gestation (with and without exclusions)
Primary C-Sections at 39-40 weeks gestation (with and without exclusions)
1 Healthy Mothers, Healthy Babies: South Carolina’s Plan to Reduce Infant Mortality & Premature Births. Retrieved from http://www.scdhec.gov/library/cr-010842.pdf 2 March of Dimes 2013 Premature Birth Report Card. Retrieved from https://www.marchofdimes.org/peristats/pdflib/998/premature-birth-report-card-South-Carolina.pdf 3 SC Health Coordinating Council. General Meeting Notes. September 9, 2014
USC Institute for Families in Society 3 Division of Medicaid Policy Research
For each measure, a table is provided with the state total for 2011-2013, as well as a break down for each year by age, race, ethnicity, educational status, BMI, payer, perinatal level, and Rural-Urban Community Area Codes. Report tables also provide the difference between 2011 (when the Initiative started) and 2013 (the last year of available data) and the relative change between these two years. The relative percentage change provides a measure of the relative change taking into account the quantities in the two years. With the exception of normal birthweight and adequate and adequate plus prenatal care, a negative percentage change indicates a better outcome. Full definitions for all of these measures are provided on pages 5 and 6. In addition, charts are included that provide the percentage of total for each measure. These charts allow users to better understand which subpopulations make up the largest percentage of each measure; whereas, the tables provide a snapshot of disparities between groups and highlight current and past rates (and differences between these rates). For instance, these tables and charts allow one to see that mothers categorized as obese (1) had higher C-Section rates in 2013 than normal weight mothers; (2) had higher rates in 2013 than in 2011; and (3) make up 40% of all mothers having C-Sections. Prior to each set of tables and charts, a summary of key findings is provided for each measure.
Data Sources Although the SC BOI started in 2011, data were not available until August of 2014, when 2013 vital records data closed, to fully assess its impact. This report provides information from vital records data (e.g., number of births, demographics, gestation, birthweight, prenatal care, and C-Sections) and UB-04 all-payer hospital billing data (e.g., elective inductions and medical exclusions) for births occurring in SC birthing facilities. Medicaid has also been verified as payer when noted by linking to Medicaid recipient records. A full description of data sources may be found in Appendix A.
USC Institute for Families in Society 4 Division of Medicaid Policy Research
SOUTH CAROLINA BIRTH OUTCOMES INITIATIVE DATA WORKGROUP MEMBERS Chris Finney, MS Program Manager, South Carolina Revenue and Fiscal Affairs Office, Health and Demographics Sarah Gareau, DrPH Senior Research Associate, University of South Carolina, Institute for Families in Society Division of Medicaid Policy Research Ana Lòpez-DeFede, PhD Research Professor, University of South Carolina, Institute for Families in Society Division of Medicaid Policy Research* Aunyika Moonan, PhD, CPHQ Director, Quality Measurement Services, South Carolina Hospital Association Daniela Nitcheva, PhD Director, Division of Biostatistics, Public Health Statistics and Information Services, South Carolina Department of Health and Environmental Control Michael Smith, MSPH Maternal and Child Health Epidemiologist, Director, Division of Research and Planning, Bureau of Maternal and Child Health, South Carolina Department of Health and Environmental Control * For more information regarding this committee, please contact Ana Lòpez-DeFede at 803-777-5789 or at [email protected]. ACKNOWLEDGEMENTS This report would not be possible without the ongoing collaboration between Blue Cross Blue Shield of South Carolina, South Carolina Department of Health and Environmental Control, South Carolina Department of Health & Human Services, South Carolina Revenue and Fiscal Affairs Office, and University of South Carolina Institute for Families in Society.
USC Institute for Families in Society 5 Division of Medicaid Policy Research
DEFINITIONS USED IN THIS REPORT
Birth Facility - SC hospital where the birth occurred. This definition only includes SC birthing hospitals and does not include freestanding birthing centers or home births. Birthweight, regardless of the period of gestation, was categorized as very low (< 1,500 grams or 3 pounds, 4 ounces), moderately low (1,500-2,499 grams or 3 pounds, 5 ounces to 5 pounds, 7 ounces), low (very low + moderately low or < 2,500 grams or 5 pounds, 8 ounces), and normal (2,500+ grams or at least 5 pounds, 9 ounces). Cesarean Section (C-Section) – This delivery outcome is based on birth certificate data submitted to SC DHEC by delivering hospitals and not based on billing codes. Difference between 2013 and 2011 represents the difference between the annual percentages for these two years. ICD is a classification system developed collaboratively between the World Health Organization (WHO) and 10 international centers so that the medical terms reported by physicians, medical examiners, and coroners on death certificates can be grouped together for statistical purposes.
Induction – An induction is defined for this report as the following ICD-9 procedure codes: 73.01 (induction labor by artificial rupture of membranes), 73.1 (surgical induction of labor, NEC), and 73.4 (medical induction of labor). Gestation is the obstetric/clinical estimation of gestation and is measured in completed weeks. For instance, 37 weeks means 37 weeks, 0 days to 37 weeks, 6 days. Kotelchuck Index, also called the Adequacy of Prenatal Care Utilization (APNCU) Index, uses two crucial elements obtained from birth certificate data – when prenatal care began (initiation) and the number of prenatal visits from when prenatal care began until delivery (received services).
- Inadequate – Prenatal care begun after 4th month, or less than 50% of recommended visits. Includes no prenatal care received.
- Intermediate – Prenatal care begun by 4th month, and 50% - 79% of recommended visits. - Adequate – Prenatal care begun by 4th month, and 80% - 109% of recommended visits. - Adequate Plus – Prenatal care begun by 4th month, and 110% or more of recommended visits.
More information on how this measure is calculated may be read on pages 162 – 163 of this SC DHEC Vital Records report: http://www.scdhec.gov/Health/docs/BiostatisticsPubs/vms2013.pdf. Maternal Age at the time of delivery as designated on the SC birth certificate was grouped into the following categories: 0-18, 19-24, 25-34, 35-44, and 45-54. Maternal BMI is a variable provided on the SC birth certificate that represents the mother’s weight in pounds divided by her height in inches squared and multiplied by a conversion factor of 703. The BMI values were grouped as underweight < 18.5, normal weight 18.5-24.9, overweight 25-29.9, and obese > 30.

USC Institute for Families in Society 6 Division of Medicaid Policy Research
Maternal Education as designated on the SC birth certificate was classified as less than high school graduate, earned a high school diploma or high school equivalent, attended some college, and completed at least a college degree. Maternal Ethnicity – Hispanic origin is reported separately from race. Thus a person with Hispanic origin can be of any race. Mothers were grouped as either (1) Hispanic or Latino or (2) Not Hispanic or Latino. Maternal Race is the client-specific description for the race of the mother as reported on the SC birth certificate. For this report, race has been grouped into three categories: White (White/Caucasian), Black (Black or African American), or Other (Alaskan Native, American Indian, Cuban, Entrant, Federally Recognized Native American, Hispanic, Mexican, More than One Race Recorded, Native Hawaiian, Oriental/Asian, Other Native American, Other, Puerto Rican, or Refugee). Payer– With the exception of the elective induction measure which comes from UB-04 all-payer data, payer is the expected pay source listed on the birth certificate. In order to ensure that the birth certificate data submitted to DHEC by delivering hospitals were reconciled with Medicaid eligibility, Medicaid was verified as the actual payer by linking to SC DHHS, Medicaid Claims data. Perinatal Level describes the level of perinatal care based on the type of patients that are treated, availability of sub-specialty consultation, qualifications of staff, types of equipment available, and volume of high-risk perinatal patients treated.
- Level I – Community Perinatal Center – Term, at least 2,000 grams, low risk - Level II – Specialty Perinatal Center – At least 32 weeks and 1,500 grams, low and moderate risk - Level IIE – Enhanced Perinatal Center – At least 30 weeks and 1,250 grams, low, moderate, and
moderately high risk - Level III – Subspecialty Perinatal Center – All levels of care - Regional Perinatal Center (RPC) – Level III, Subspecialty perinatal care plus regional education
and transport responsibilities
Relative percentage change provides a measure of the relative change taking into account the quantities in 2011 and 2013. The equation used was (2013- 2011)/ 2011. If there were no data provided for the relative percentage change, the value for 2011 was 0.00%, or there were 0 births in either 2011 or 2013. With the exception of the normal birthweight measure and access to adequate or adequate plus prenatal care, a negative percentage change indicates a better outcome. Rural-Urban Community Area Codes – Utilizing standard Bureau of Census Urbanized Area and Urban Cluster definitions in combination with work community information, The US Census Bureau classifies all individuals in the nation as either “urban” or “rural” residents. Mothers living in census-designated Urbanized Areas of 50,000 or more people or Urban Clusters of 2,500 to 49,999 people were classified as “urban.” All other mothers were classified as “rural.” The Joint Commission Exclusion Criteria - For the C-Section measures with exclusions ICD-9 codes included in the Table Number 11.09: Contraindications to Vaginal Delivery were removed. For the early elective delivery measure, ICD-9 codes included in Table Number 11.07: Conditions Possibly Justifying Elective Delivery Prior to 39 Weeks Gestation were removed. These tables are included in the Specifications Manual for Joint Commission National Quality Measures (v2013A1) and are part of the Perinatal Care measure set for measures PC-01 (elective delivery) and PC-02 (Cesarean Section). For more information on these criteria, please see Appendix B.

USC Institute for Families in Society 7 Division of Medicaid Policy Research
NOTES FOR THE INTERPRETATION OF FINDINGS
1. Deliveries – Caution should be taken when interpreting data for mothers ages 45-54, as this subpopulation only represented 45 deliveries in 2013 (0.09% of all deliveries). Likewise, the number of deliveries used to calculate each of the measures may vary based on whether the measure was restricted to certain gestational weeks or exclusions were applied. Deliveries only reflect data from SC birthing facilities and not births occurring in freestanding birthing centers or at home.
2. For accuracy’s sake, state totals represent the percentages for all available data. These percentages
may not always match all payer percentages, as at times payer data were missing. 3. Payer data are excluded from the percentage of total charts, as the payer categories across vital
records and UB-04 all-payer data are not an exact match and, therefore, some payer categories were excluded. Thus, percentages could not add up to 100.0%.
4. The terms medically unnecessary and elective are used interchangeably in this report. For this
report, these two terms refer to procedures that occurred even though one of the ICD-9 codes indicating their necessity (as defined by The Joint Commission) were not present on UB-04 all-payer claims data.
5. For all outcomes but the elective induction measure which originated from UB-04 all-payer data, self-
pay does not include indigent patients as these are grouped in Other, which encompasses patients labeled as Tricare, indigent, Medicare, and any other category not included in Medicaid, private insurance, self-pay, or unknown. For the elective induction measure, self-pay includes indigent patients.
6. As ethnicity was reported separately, Hispanic and Latina race mothers were grouped into the Other
race category, which allowed for a more concise presentation of data. The Other race category includes many different races which are defined in the Definitions section of this report.
7. In the percentage of total charts, percentages may not add up to 100.00% due to rounding.

USC Institute for Families in Society 8 Division of Medicaid Policy Research
KEY FINDINGS Total Births
From 2011 to 2013, the number of births in SC has decreased 1.7%. Women identifying as Hispanic, qualifying for Medicaid, residing in rural areas, with less education, and in younger age groups had fewer babies in 2013. The majority of deliveries in 2013 were for women with the following demographics: White (65%), Non-Hispanic (92%), urban (73%), and ages 25-34 (52%).
Birthweight
After a promising decrease in 2012, there was a slight relative 1.64% increase in the percentage of very low birthweight (VLBW) babies in SC in 2013.
Although Black women only delivered 33% of babies that year, they delivered 55% of VLBW babies with 3% of Black women delivering a VLBW baby compared to 1% of White women. The majority of VLBW babies were delivered in Perinatal Level III facilities (81%). A higher percentage of mothers measured as obese had VLBW babies (2.39%) than all other BMI categories. Both very young mothers and mothers over the age of 35 were at greater risk of delivering of a VLBW baby in 2013, as were women categorized as self-pay.
There was a 3% relative decrease in the percentage of moderately low birthweight (MLBW) babies from 8.06% in 2011 to 7.84% in 2013. Women with a college degree were more likely to have VLBW babies from 2011 to 2013 but slightly less likely to have MLBW babies. The overall percentage of MLBW babies decreased for mothers residing in rural areas, but a greater percentage of rural women than urban women had both VLBW and MLBW babies in 2013. The
53,687
53,047
52,785
52,200
52,400
52,600
52,800
53,000
53,200
53,400
53,600
53,800
2011 2012 2013
Total Births by Year
3.13%
0.95% 1.25%
0.00%
0.50%
1.00%
1.50%
2.00%
2.50%
3.00%
3.50%
BLACK OTHER WHITE
2013 Very Low Birthweight by Race

USC Institute for Families in Society 9 Division of Medicaid Policy Research
racial disparity for this measure was considerable with 11.03% of Black women having a MLBW baby in 2013 compared to 6.25% of White women.
The overall low birthweight (LBW) measure decreased slightly from 9.89% in 2011 to 9.70% in 2013. Although the percentage of total LBW babies born in 2013 to White (50%) and Black (48%) mothers was similar, nearly twice as many Black mothers (14.16%) than White mothers (7.50%) had a LBW baby. Perinatal Level III hospitals were most likely to treat LBW babies (representing 53% of LBW babies in 2013) and also had the highest 2013 rate (14.14%).
Slightly half of LBW babies were born to overweight (22.81%) and obese (28.81%) mothers, but
the highest 2013 rate was among mothers measured as underweight (15.13%). All payer types had a decrease in the percentage of LBW babies, but self-pay.
There was a direct inverse
relationship between level of education and LBW, and women with less than a high school degree were more likely in 2013 than 2011 to have a LBW baby.
Black women (85.81%); younger women ages 0-18 (88.85%) and older women ages 35-44 (88.65%) or 45-64 (86.67%); underweight women (84.82%), women qualifying for Medicaid (88.97%), women delivering in Perinatal Level III facilities (85.81%), and rural women (89.92%) were less likely in 2013 than other subpopulations to have a normal birthweight baby.
Prenatal Care
Nearly 19% of women in SC received inadequate prenatal care as measured by the Kotelchuck Index in 2013; yet, almost three fourths of women receive adequate or adequate plus care.
18.94
5.99
28.13
46.68
2013 Prenatal Care Adequacy (based on Kotelchuck)
Inadequate
Intermediate
Adequate
AdequatePlus
11.54%10.47% 10.15%
7.76%
0.00%
2.00%
4.00%
6.00%
8.00%
10.00%
12.00%
14.00%
LESS THANHIGH SCHOOL
HIGH SCHOOLGRADUATE/GED
SOME COLLEGE COLLEGEDEGREE +
2013 Low Birthweight by Educational Attainment
USC Institute for Families in Society 10 Division of Medicaid Policy Research
Women ages 19-24 represented 32.07% of deliveries, but made up 39.15% of women receiving inadequate care. Women with private insurance were 24% more likely to receive inadequate care. Nevertheless, only 9% of women with private insurance, compared to 24% of women qualifying for Medicaid and 29% of self-pay women, received inadequate care. A greater percentage of younger women and women with less education received inadequate care in 2013. Women served in Perinatal Level III hospitals were more likely to receive inadequate prenatal care. Women identifying as Hispanic were less likely in 2013 than 2011 to receive inadequate care. In spite of this, even though Hispanic women only represented 8.17% of women delivering, they represented 13.21% of women receiving inadequate prenatal care.
Although there was little over all change in the percentage of SC women receiving inadequate prenatal care (RC: 0.11%), there was a larger negative shift in the percentage receiving intermediate care (RC: -10%). There was an inverse relationship between age and intermediate care with younger women having a higher rate than older women. A similar trend was seen with BMI with a greater percentage of underweight and normal weight women having intermediate care than overweight and obese women.
Approximately 28% of SC women delivering received adequate are in 2013, which is a decrease from 29% in 2011 and 2012. Some of this decrease is likely due to a shift towards more mothers receiving adequate plus care (RC: 2.75%), as other prenatal care categories either decreased or only slightly increased.
The inverse trend for education and adequate prenatal care in 2013 was striking; 33% of college educated mothers received adequate care compared to only 24% of women with less than a high school education, a difference of 9%. White women were more likely than Black women and women categorized as Other race to have adequate care in 2013 (30.26% vs. 23.80% and 29.71%, respectively). Although a greater percentage of women with private insurance received adequate care, women identifying as Medicaid and self-pay were more likely in 2013 than in 2011 to receive adequate care.
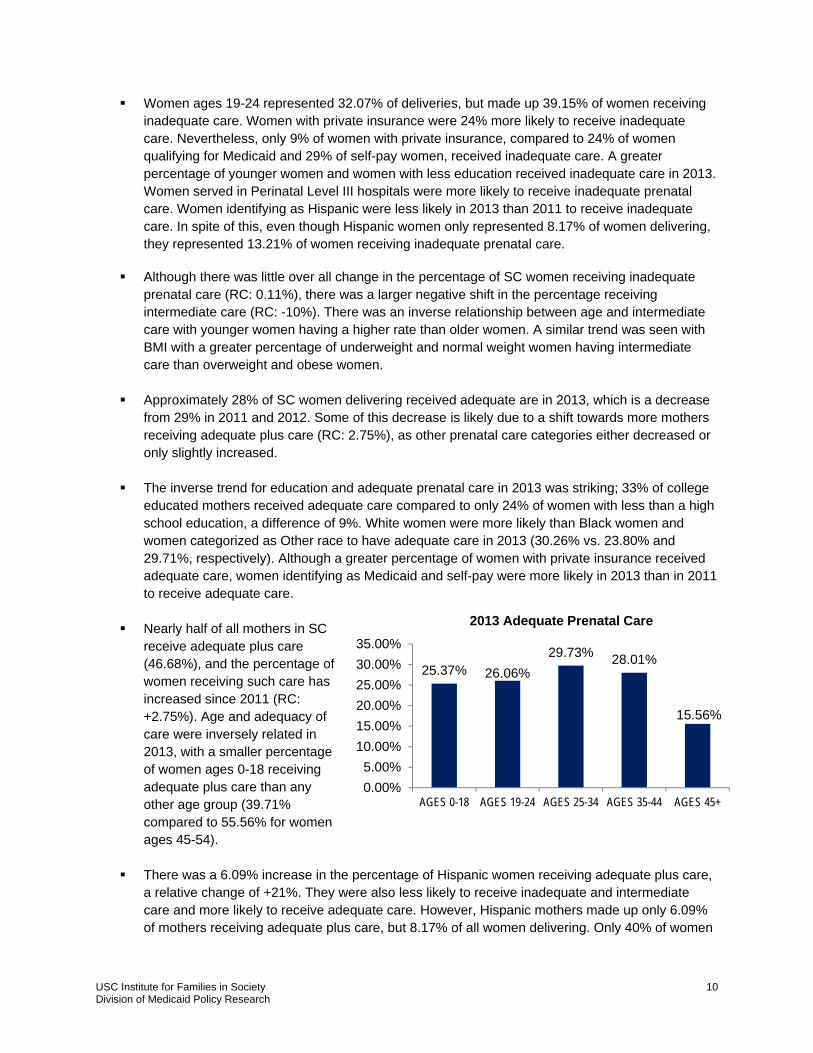
Nearly half of all mothers in SC receive adequate plus care (46.68%), and the percentage of women receiving such care has increased since 2011 (RC: +2.75%). Age and adequacy of care were inversely related in 2013, with a smaller percentage of women ages 0-18 receiving adequate plus care than any other age group (39.71% compared to 55.56% for women ages 45-54).
There was a 6.09% increase in the percentage of Hispanic women receiving adequate plus care, a relative change of +21%. They were also less likely to receive inadequate and intermediate care and more likely to receive adequate care. However, Hispanic mothers made up only 6.09% of mothers receiving adequate plus care, but 8.17% of all women delivering. Only 40% of women
25.37% 26.06%
29.73% 28.01%
15.56%
0.00%
5.00%
10.00%
15.00%
20.00%
25.00%
30.00%
35.00%
AGES 0-18 AGES 19-24 AGES 25-34 AGES 35-44 AGES 45+
2013 Adequate Prenatal Care

USC Institute for Families in Society 11 Division of Medicaid Policy Research
classified as Other race received adequate plus care in 2013 (when 46% of Black women and 47% of White women secured such care).
Women who were classified as obese (51.26%) were more likely than overweight (46.45%) and normal weight (43.86%) mothers to receive adequate plus prenatal care in 2013.
Mothers with less than a high school graduation in 2013 made up 17.23% of all deliveries but only 13.94% of mothers receiving adequate plus care. Conversely, they represented 27.84% of mothers with inadequate prenatal care.
Elective Inductions at 37-38 Weeks Gestation
SC reduced early elective inductions at 37-38 weeks gestation by half from a rate of 8.81% in 2011 to 4.43% in 2013. Every demographic group saw a decrease in this measure except for those women whose rural-urban category could not be defined.
The majority of all early elective inductions occurred in Perinatal Level II & IIE hospitals in 2013 (65.67%); 5.15% of women treated at one of these hospitals had an early elective induction. Likewise, White women (5.08%) were more likely than Black women (4.10%) and Other women (2.75%) to have an induction at 37-38 weeks in 2013. They represented 58.58% of all early elective inductions that year.
Women identified as self-pay had less of a relative decrease, 25%, compared to women with private insurance (53%), Medicaid (49%), or all payers in general (50%), in elective inductions at 37-38 weeks gestation from 2011 to 2013. They also had the highest 2013 percentage of any payer type (4.88%).
A greater percentage of obese women were likely to have an early elective induction (5.28%) compared to all other BMI categories. Although the percentage of women receiving an early elective induction among this group did decrease 2.72% from 2011 to 2013, the relative reduction was only 34% compared to 58% for normal weight and 49% for overweight women.
Only 2.93% of women identifying as Hispanic had an early elective induction in 2013 as compared to 4.59% of women of Non-Hispanic ethnicity.
Total C-Sections at 37+ Weeks Gestation
Over a third of all pregnant women delivered via C-Section (CS) at 37+ weeks gestation in 2013 (33.52%).
4.43%4.32%
4.54%
4.88%
4.00%
4.20%
4.40%
4.60%
4.80%
5.00%
ALL PAYERS MEDICAID PRIVATEINSURANCE
SELF-PAY
2013 Elective Inductions by Payer
USC Institute for Families in Society 12 Division of Medicaid Policy Research
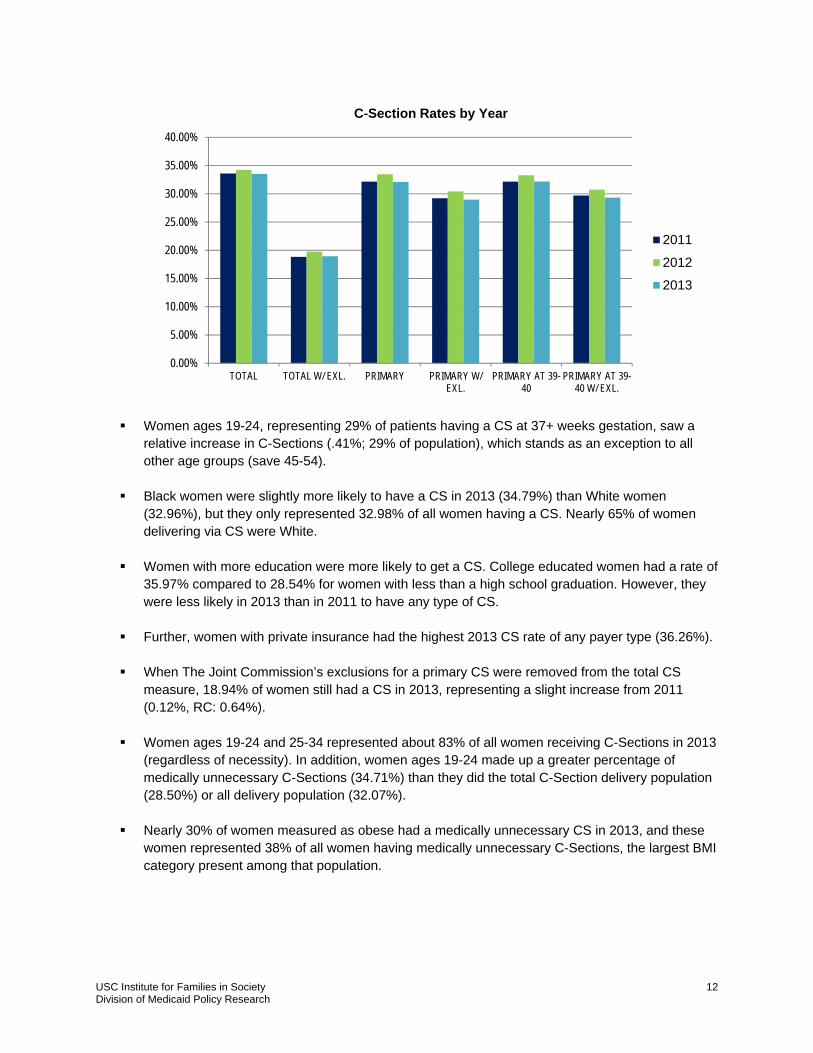
Women ages 19-24, representing 29% of patients having a CS at 37+ weeks gestation, saw a relative increase in C-Sections (.41%; 29% of population), which stands as an exception to all other age groups (save 45-54).
Black women were slightly more likely to have a CS in 2013 (34.79%) than White women (32.96%), but they only represented 32.98% of all women having a CS. Nearly 65% of women delivering via CS were White.
Women with more education were more likely to get a CS. College educated women had a rate of 35.97% compared to 28.54% for women with less than a high school graduation. However, they were less likely in 2013 than in 2011 to have any type of CS.
Further, women with private insurance had the highest 2013 CS rate of any payer type (36.26%).
When The Joint Commission’s exclusions for a primary CS were removed from the total CS measure, 18.94% of women still had a CS in 2013, representing a slight increase from 2011 (0.12%, RC: 0.64%).
Women ages 19-24 and 25-34 represented about 83% of all women receiving C-Sections in 2013 (regardless of necessity). In addition, women ages 19-24 made up a greater percentage of medically unnecessary C-Sections (34.71%) than they did the total C-Section delivery population (28.50%) or all delivery population (32.07%).
Nearly 30% of women measured as obese had a medically unnecessary CS in 2013, and these women represented 38% of all women having medically unnecessary C-Sections, the largest BMI category present among that population.
0.00%
5.00%
10.00%
15.00%
20.00%
25.00%
30.00%
35.00%
40.00%
TOTAL TOTAL W/ EXL. PRIMARY PRIMARY W/EXL.
PRIMARY AT 39-40
PRIMARY AT 39-40 W/ EXL.
C-Section Rates by Year
2011
2012
2013

USC Institute for Families in Society 13 Division of Medicaid Policy Research
Primary C-Sections for First-Time Mothers at 37+ Weeks Gestation
Approximately one in three SC first-time mothers delivering at 37+ weeks gestation had a primary CS in 2013 (32.10%).
Women were less likely to have a CS (32.50%) and primary CS (29.63%) in a Perinatal Level I facility than any other type of facility, and these facilities only performed approximately 10% of total C-Sections and 9% of primary C-Sections.
Women identifying as White were slightly less likely to have a primary CS in 2013 (31.53%) than
women identifying as Black (33.30%) or Other (33.47%) race. White and black race mothers represented the majority of the primary C-Sections, making up 67% and 31%, respectively.
First-time mothers ages 25-34 had a slight relative increase of 1% in primary C-Sections at 37+ weeks gestation with a 2013 rate of 36.14%. They represented 46% of women having a primary CS. Nearly half of all women ages 35-44 had a primary CS in 2013.
All payers decreased their percentage of primary C-Sections, although women designated self-pay had the greatest decrease (-3.75%, RC: -12%). Women with private insurance in 2013 were most likely to have both a medically necessary (35.46%) and unnecessary (31.33%) primary CS.
21.42%
26.12%
34.30%
45.52%
29.70%
0.00%
5.00%
10.00%
15.00%
20.00%
25.00%
30.00%
35.00%
40.00%
45.00%
50.00%
UNDERWEIGHT NORMAL OVERWEIGHT OBESE MISSING/UNKNOWN
2013 Total C-Sections by BMI
19.70%
29.04%36.14%
49.53%
72.73%
0.00%
10.00%
20.00%
30.00%
40.00%
50.00%
60.00%
70.00%
80.00%
AGES 0-18 AGES 19-24 AGES 25-34 AGES 35-44 AGES 45+
2013 Primary C-Sections by Age Group
USC Institute for Families in Society 14 Division of Medicaid Policy Research
0.00%
5.00%
10.00%
15.00%
20.00%
25.00%
30.00%
35.00%
40.00%
TOTAL TOTAL W/ EXL. PRIMARY PRIMARY W/EXL.
PRIMARY AT39-40
PRIMARY AT39-40 W/ EXL.
C-Section Rates by Year and Ethnicity
Hispanic
Non-Hispanic
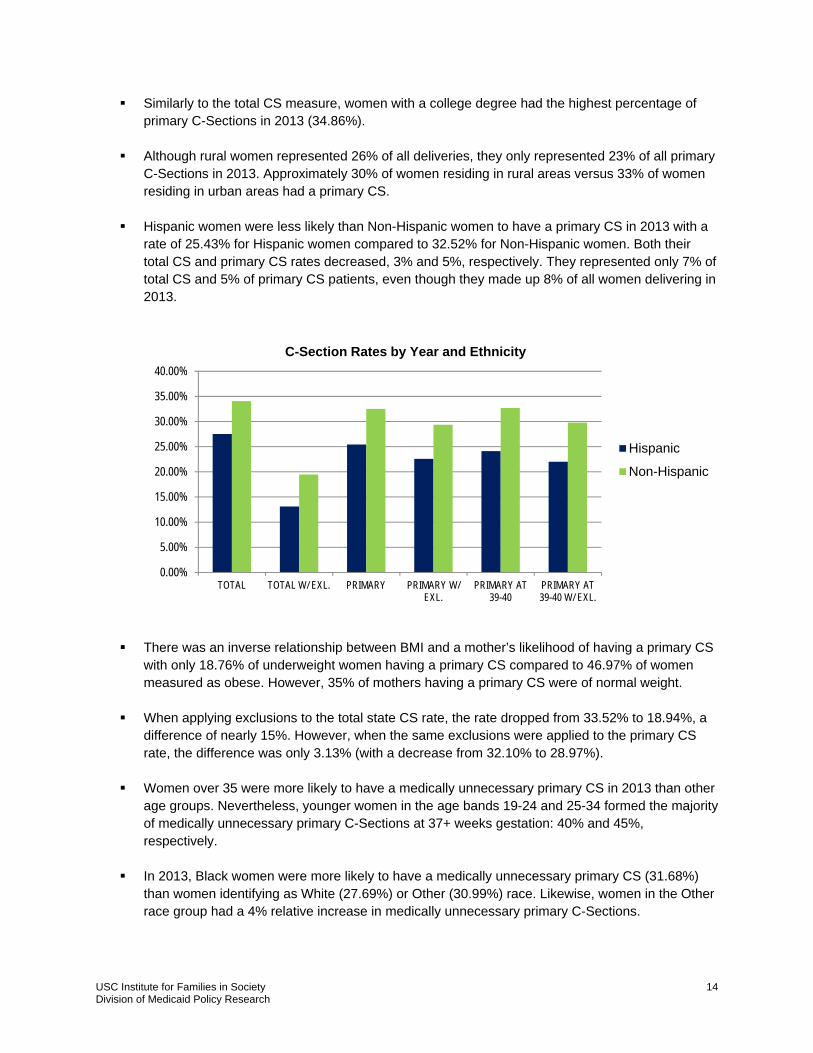
Similarly to the total CS measure, women with a college degree had the highest percentage of primary C-Sections in 2013 (34.86%).
Although rural women represented 26% of all deliveries, they only represented 23% of all primary C-Sections in 2013. Approximately 30% of women residing in rural areas versus 33% of women residing in urban areas had a primary CS.
Hispanic women were less likely than Non-Hispanic women to have a primary CS in 2013 with a rate of 25.43% for Hispanic women compared to 32.52% for Non-Hispanic women. Both their total CS and primary CS rates decreased, 3% and 5%, respectively. They represented only 7% of total CS and 5% of primary CS patients, even though they made up 8% of all women delivering in 2013.
There was an inverse relationship between BMI and a mother’s likelihood of having a primary CS
with only 18.76% of underweight women having a primary CS compared to 46.97% of women measured as obese. However, 35% of mothers having a primary CS were of normal weight.
When applying exclusions to the total state CS rate, the rate dropped from 33.52% to 18.94%, a difference of nearly 15%. However, when the same exclusions were applied to the primary CS rate, the difference was only 3.13% (with a decrease from 32.10% to 28.97%).
Women over 35 were more likely to have a medically unnecessary primary CS in 2013 than other age groups. Nevertheless, younger women in the age bands 19-24 and 25-34 formed the majority of medically unnecessary primary C-Sections at 37+ weeks gestation: 40% and 45%, respectively.
In 2013, Black women were more likely to have a medically unnecessary primary CS (31.68%) than women identifying as White (27.69%) or Other (30.99%) race. Likewise, women in the Other race group had a 4% relative increase in medically unnecessary primary C-Sections.

USC Institute for Families in Society 15 Division of Medicaid Policy Research
Most medically unnecessary primary C-Sections in 2013 were performed in Perinatal Levels II & IIE facilities (57%) followed by Level III (33%) and Level I (9%). Nearly 27% of women served in Perinatal Level I facilities and 30% of women served in Perinatal Levels II & IIE facilities had an elective primary CS. Urban women (29.41%) were more likely than rural women (27.77%) to have an elective primary CS.
Total Primary C-Sections for First-Time Mothers at 39-40 Weeks Gestation
The 2013 percentage of primary CS for first-time mothers at 39-40 weeks was similar to the percentage at 37+ weeks (32.17% and 32.10%, respectively). In fact, results for this measure mirrored the findings for 37+ weeks primary C-Sections for most demographic characteristics.
When comparing different payers, women categorized as self-pay were least likely to have a primary CS at 39-40 weeks (27.01%) in 2013 and saw the greatest improvement in this measure with a relative decrease of 23%. This exceeded the improvement of 12% for primary CS at 37+ weeks.
Women ages 0-18 (19.76%) and women categorized as underweight (19.93%) were least likely to have a primary CS at 39-40 weeks gestation, as well as at 37+ weeks gestation (19.70% and 21.42%, respectively). These findings are consistent with higher CS percentages among mothers of advanced maternal age and obese mothers, as described previously.
There was a slight decrease in elective primary C-Sections for first-time mothers at 39-40 weeks. The percentage of these medically unnecessary C-Sections decreased for both Perinatal Level I and III facilities, but increased slightly for Perinatal Level II & IIE facilities.
Mothers under the age of 35 (92%), identifying as White (66%), Non-Hispanic ethnicity (95%), served at a Perinatal Level II & IIE facility (59%), and who resided in urban areas (75%) made up the profile of the majority of mothers having medically unnecessary primary C-Sections at 39-40 weeks in 2013. These percentages were slightly higher than the general birth profile for 2013.
30.00%
29.39%
28.46%
29.56%
31.25%
30.37%
29.79%
30.36%
27.75%
26.00%
27.00%
28.00%
29.00%
30.00%
31.00%
32.00%
2011 2012 2013
Primary C-Sections at 39-40 Weeks (with exclusions applied)
PERINATAL LEVEL I
PERINATAL LEVELS II & IIE
PERINATAL LEVEL III

USC Institute for Families in Society 16 Division of Medicaid Policy Research
DISCUSSION
This annual report was created by the SC Birth Outcomes Initiative Data Workgroup to provide other Initiative workgroups and stakeholders baseline data to hopefully prompt meaningful conversations regarding where targeted efforts to improve maternal and child health, especially among disparity populations, should focus. Data provided in this report reveal the immense progress we have made in some areas, such as reducing the percentage of elective deliveries at 37-38 weeks gestation and moderately low birthweight babies, both initial focuses of the Initiative, as well as areas where more improvement is needed (e.g., reducing the percentage of very low birthweight babies and medically unnecessary C-Section rates).
Likely due to the ongoing recession, women with fewer resources, such as women qualifying for Medicaid and women with less education, are having fewer babies. Additional data is needed to track whether or not SC BOI work to expand access to Long-acting reversible contraception will have a lasting impact on reducing the number of unplanned births in our state.
The percentage of very low birthweight is increasing, and racial and geographic disparities are persistent for both very low birthweight and moderately low birthweight. There is no easy fix for this, but initial evaluations of the expansion of Centering group prenatal care programs are showing promise at reducing low birthweight (LBW) and preterm rates for low-risk women. In addition, SC BOI is supporting the implementation of obstetrics & gynecology telemedicine in rural areas of our states. Interventions targeting high-risk women are needed. Efforts to address associated risk factors, such as obesity, are warranted given that more than half of women having LBW babies were overweight or obese. However, these efforts will not fully address the problem given that mothers measured as underweight actually had the highest rates of low birthweight, and women classified as obese were more likely to receive adequate plus prenatal care in 2013 than women in other BMI categories. Given the inverse relationship between LBW and educational attainment, attempts to expand health education and health literacy may be justified.
The majority of women in SC are receiving adequate or adequate plus prenatal care. However, women with greater resources are more likely to receive such care, as evidenced by the lower percentage of women with private insurance and more education receiving inadequate care. Some progress is being made in this area though, as women identified as Medicaid, self-pay, and Hispanic were more likely in 2013 than in 2011 to receive adequate care.
Due in large part to SC BOI collaborative efforts, including payment reform as substantiated by lower rates among women with private insurance and Medicaid than self-pay women, SC has reduced elective inductions at 37-38 weeks by half. To get this measure to 0%, targeted interventions among Perinatal Level II & IIE hospitals are needed, as the majority of early elective inductions occur in these facilities, and they had the highest perinatal level rate in 2013. In addition, a higher percentage of these elective procedures are happening for women of White race than Black or Other races, as well as for women identifying as Non-Hispanic ethnicity rather than Hispanic ethnicity. Likewise, rates are not decreasing as fast for women categorized as obese as compared to normal and overweight women.
Demonstrating the need for SC BOI’s Supporting Vaginal Birth Initiative, over a third of all pregnant women in SC, as well as a third of all first-time mothers, delivered via C-Section in 2013. Women ages

USC Institute for Families in Society 17 Division of Medicaid Policy Research
19-24 had an increase in their percentage of C-Sections from 2011 to 2013, and they represented 29% of all women having C-Sections. Although Black women were slightly more likely than White women to have a C-Section in 2013, nearly 65% of women having C-Sections were White. Likewise, women with more education and with private insurance had higher C-Section rates, regardless of necessity. Conversely, self-pay women were least likely to have C-Sections. These findings indicate the need to continue to partner with payers to disincentivize C-Section deliveries.
Further, women over the age of 35 and women measured as overweight and obese were more likely to have any type of C-Section, indicating that clinicians may view these as risk factors even though they are not considered medical exemptions by The Joint Commission. However, women of advanced maternal age were least likely to have a baby in 2013. Therefore, clinical and quality improvement efforts focused on reduction unnecessary C-Sections will likely be more successful if they focus on BMI rather than age, as obese women made up 38% of all women having medically unnecessary C-Sections in 2013. Lastly, women identifying as Hispanic were less likely than Non-Hispanic women to have a C-Section. A better understanding of the protective factors existing in this community may benefit all women.
Recommended Next Steps
The data provided in this report indicates that there is not one solution that will improve all birth outcomes. Indeed, while racial disparities are front and center for low birthweight, high BMI appears to be a more pressing issue for higher C-Section rates. It is recommended that SC BOI workgroups review the findings in this report to better target different subpopulations of women as needed to address varying outcomes.
Given the improvement observed for elective inductions at 37-38 weeks gestation, primarily due to SC DHHS and SC Blue Cross Blue Shield jointly partnering to deny payment for these deliveries, payment modifiers for other areas, including incentivizing additional Centering prenatal care visits and reducing unnecessary C-Sections among low-risk, first-time mothers, are recommended.
The highest perinatal level rates of elective inductions and C-Sections are occurring in Perinatal Level II & IIE birthing facilities. Outreach to specific OB/GYN providers in these facilities is recommended.
Younger women and women with less education had higher rates of low birthweight and lower rates of adequate prenatal care. These mothers are having fewer births, but continued outreach through the SC Campaign to Prevent Teenage Pregnancy and other SC BOI partner organizations may be beneficial.
Exploring why a lower percentage of Hispanic women than Non-Hispanic women had medically unnecessary deliveries in 2013 may help the Initiative decrease these deliveries for all women.
Although this report provides baseline maternal and child health disparity information for a number of measures reported on a quarterly basis to birthing facilities, ongoing data reporting for other measures will be provided, as needed, by the Data Workgroup. For instance, a better understanding of maternal

USC Institute for Families in Society 18 Division of Medicaid Policy Research
morbidity and mortality, as well as other clinical outcomes such as congenital heart disease, is warranted. In addition, continued evaluation of other SC BOI-related efforts, including, but not limited to, Centering, the expansion of Screening, Brief Intervention, Treatment, and Referral, the establishment of the Milk Bank, payment for inpatient LARC insertion, and support of breastfeeding through Baby-Friendly hospitals is needed and will be supported by the Data Workgroup. If necessitated, additional measures will be added to the quarterly hospital report, and as requested, separate reports will be developed and presented when Data Workgroup resources are available.

Total Births
USC Institute for Families in Society Division of Medicaid Policy Research
19

Summary of Findings: Total Births
§ There were 902 fewer SC births in 2013 than in 2011, a decrease of 1.70%. § Although there has been an approximately 27% increase in births for women ages 45-54, this only represented 9 births, as these women were least likely to give birth. However, younger women, who represented a larger percentage of total births, had fewer babies. Women ages 0-18 had 806 fewer births (-27%), and women ages 19-24 had 1,050 fewer births (-6%). § These trends in age mirror trends in education, with -1,707 fewer births for women with less than a highschool graduation (-17%) and 1,261 more births for women with some college (+3%) or a college degree(+5%). In addition, the percentage of women with some college or a college degree increased each year from2011 to 2013, while the percentage of women with less than high school graduation decreased each year. § Fewer women are being delivered in smaller, Perinatal Level I hospitals (-1,467, -0.23%), which may reflectfewer births occurring for women living in rural areas (-587, -4%). However, 1 in 4 women delivering in SCresided in a rural area in 2013. § There has been very little change in the percentage of babies born to overweight (-0.48%) or obese (-0.88%) women, although slightly more than half of women delivering in 2013 were overweight orobese at the start of their pregnancies (53%). However, there were 816 fewer babies born to women whowere categorized as underweight (-8%) or normal weight (-3%). § There was not very much change in the percentage of births by different race groups, but there were 397fewer births for women of Hispanic ethnicity, a decrease of 9%. § There were 1,525 fewer births to women who were Medicaid recipients (-5%). § Women ages 25-34 represented the largest percentage of births in 2013 (52%). § The majority of deliveries in 2013 were for White (65%), Non-Hispanic (92%), and urban women (73%).
USC Institute for Families in Society Division of Medicaid Policy Research
20

DemographicCharacteristic Measure 2011 Total
Births 2012 TotalBirths
2013 TotalBirths
DifferenceBetween2013 and2011(Births)
RelativePercentageChange(Births)
AGE
Ages 0-18
Ages 19-24
Ages 25-34
Ages 35-44
Ages 45-54
Missing/Unknown Age
RACE
Black Race
White Race
Other Race
Missing/Unknown Race
ETHNICITYHispanic Ethnicity
Non-Hispanic Ethnicity
EDUCATIONALSTATUS
Less than High School Grad
High School Grad/GED
Some College
College Degree +
Missing/Unknown Education
BMI
Underweight
Normal Weight
Overweight
Obese
Missing/Unknown BMI
PAYER
All Payers
Medicaid
Private Insurance
Self-Pay
PERINATALLEVEL OFBIRTHINGFACILITY
Perinatal Level I
Perinatal Level II & IIE
Perinatal Level III
RURAL-URBANCOMMUNITYAREA CODES(RUCA)
Rural
Urban
Not Defined
TOTAL STATE TOTAL
-100.00%
27.27%
4.00%
2.69%
-5.95%
-26.64%
-1
9
232
714
-1,050
-806
1
45
5,947
27,256
16,927
2,609
1
33
5,806
26,542
17,639
3,026
2
36
5,715
26,542
17,977
3,415
-23.33%
-0.15%
-1.26%
-2.62%
-7
-2
-429
-464
21
1,259
34,157
17,348
30
1,355
33,981
17,681
28
1,261
34,586
17,812
-1.04%
-8.89%
-505
-397
48,475
4,310
48,579
4,468
48,980
4,707
-3.68%
5.28%
2.84%
-3.53%
-17.05%
-6
876
385
-450
-1,707
149
17,094
13,756
12,692
9,094
163
16,583
13,548
12,744
10,009
155
16,218
13,371
13,142
10,801
-7.08%
0.88%
-0.48%
-3.03%
-7.63%
-155
129
-60
-657
-159
1,492
15,194
12,707
21,277
2,115
2,188
14,596
12,502
21,676
2,085
1,647
15,065
12,767
21,934
2,274
-8.48%
1.30%
-4.94%
-1.78%
-56
207
-1,525
-942
687
16,311
29,488
52,743
660
15,940
30,886
53,034
743
16,104
31,013
53,685
1.27%
1.16%
-23.11%
241
322
-1,467
19,173
28,220
5,390
18,945
27,755
6,347
18,932
27,898
6,857
7.46%
-0.91%
-4.27%
37
-352
-587
543
38,759
13,483
496
38,803
13,748
506
39,111
14,070
-1.70%-90252,78553,04753,687
2011-2013 Total Births
USC Institute for Families in Society Division of Medicaid Policy Research
21
Demographic Characteristic Measure
AGE Ages 0-18
Ages 19-24
Ages 25-34
Ages 35-44
Ages 45-54
Missing/Unknown Age
RACE Black Race
White Race
Other Race
Missing/Unknown Race
ETHNICITY Hispanic Ethnicity
Non-Hispanic Ethnicity
EDUCATIONAL STATUS Less than High SchoolGrad
High School Grad/GED
Some College
College Degree +
Missing/UnknownEducation
BMI Underweight
Normal Weight
Overweight
Obese
Missing/Unknown BMI
PERINATAL LEVEL OFBIRTHING FACILITY
Perinatal Level I
Perinatal Levels II & IIE
Perinatal Level III
RURAL-URBAN COMMUNITYAREA CODES (RUCA)
Rural
Urban
Not Defined
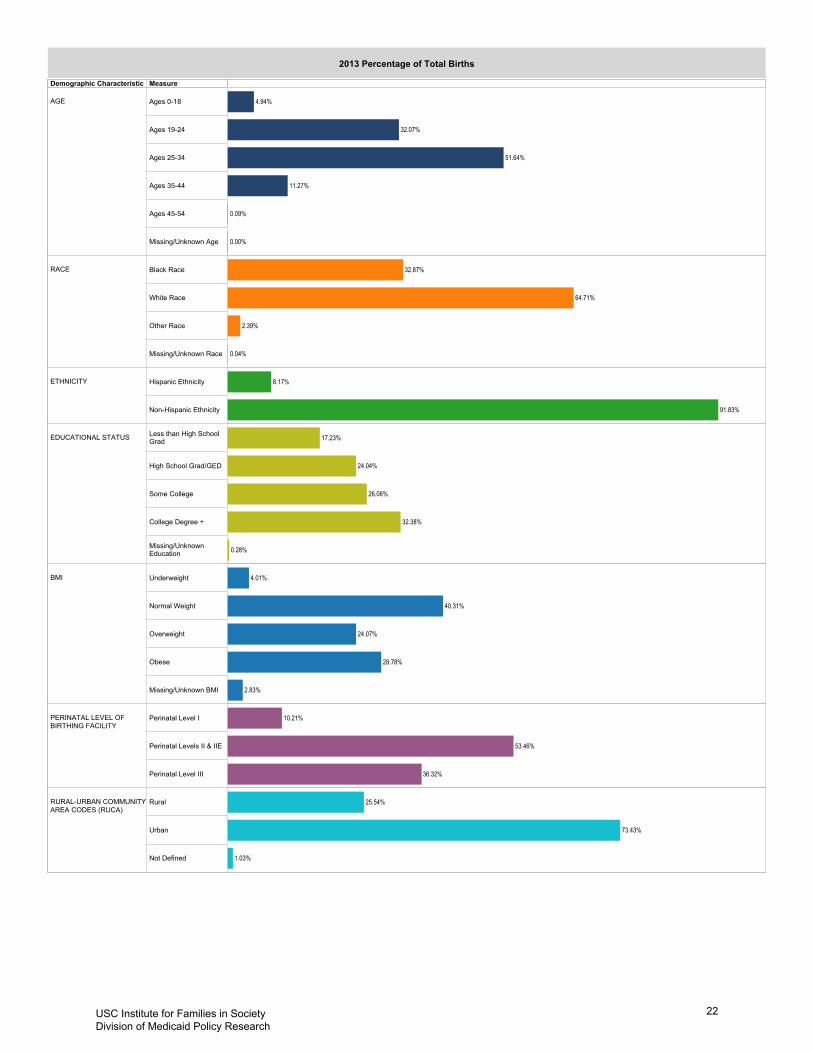
32.07%
51.64%
11.27%
4.94%
0.09%
0.00%
32.87%
64.71%
2.39%
0.04%
91.83%
8.17%
17.23%
24.04%
26.06%
32.38%
0.28%
40.31%
24.07%
28.78%
4.01%
2.83%
10.21%
53.46%
36.32%
25.54%
73.43%
1.03%
2013 Percentage of Total Births
USC Institute for Families in Society Division of Medicaid Policy Research
22

Birthweight
USC Institute for Families in Society Division of Medicaid Policy Research
23

Summary of Findings: Very Low Birthweight
§ For the state as a whole, there was a slight increase in the percentage of very low birthweight (VLBW) babies from 1.83% in 2011 to 1.86% in 2013 (0.03%, RC: +1.64%). This was after a decrease to 1.76% in2012. § The percentage of Black women delivering VLBW babies increased 0.11% from 2011 to 2013, a relative increase of nearly 4%. Although Black women only delivered 33% of babies in 2013, they delivered 55% ofVLBW babies. Approximately 3% of Black mothers delivered VLBW babies in 2013 compared to only slightlymore than 1% of White mothers. § From 2011 to 2013, there was a 0.42% increase in the percentage of VLBW babies born to mothers of Hispanic ethnicity (RC: +41%). However, these women only delivered 6% of VLBW babies in 2013. § Younger women ages 0-18 (-0.36%, RC: -15%) and 19-24 (-0.32%, RC: -16%) were less likely to deliver aVLBW baby; whereas, women ages 25-34 (0.26%, RC: 17%) and 35-44 (0.28%, RC: 12%) were more likelyto deliver a VLBW baby. In addition, a greater percentage of very young mothers (2.07%) and mothers overthe age of 35 (35-44: 2.54%, 45-54: 2.22%) delivered VLBW babies in 2013 than mothers between the agesof 19-34 (19-24: 1.65%, 25-34: 1.82%). § The percentage of VLBW babies delivered for women with some college (RC: -3%) decreased; whereas,women with less than high school graduation (RC: 4%) or a high school degree (RC: 1%) were more likely todeliver a VLBW baby in 2013 than 2011. Women with a college degree had a 9% relative increase in their percentage of VLBW babies. § There was a 4% relative increase in the percentage of women with private insurance delivering VLBW babies, but a 3% relative decrease in the percentage of women who were Medicaid recipients deliveringVLBW babies. Women categorized as self-pay had the highest percentage of VLBW in 2013 (2.33%), whichwas a relative increase of 33%. § 81% of VLBW babies were delivered in Perinatal Level III hospitals in 2013. Less than 1% of babies born inPerinatal Level I and Levels II & IIE were measured as VLBW as compared to slightly more than 4% in Perinatal Level III hospitals. § Nearly two thirds of VLBW babies in 2013 were born to women who were overweight (26%) or obese(37%). A higher percentage of mothers measured as obese had VLBW babies (2.39%) than all other BMI categories.
USC Institute for Families in Society Division of Medicaid Policy Research
24

DemographicCharacteristic Measure 2011 % VLBW 2012 % VLBW 2013 % VLBW
DifferenceBetween 2013and 2011(VLBW)
RelativePercentageChange(VLBW)
AGE
Ages 0-18
Ages 19-24
Ages 25-34
Ages 35-44
Ages 45-54
Missing/Unknown Age
RACE
Black Race
White Race
Other Race
Missing/Unknown Race
ETHNICITYHispanic Ethnicity
Non-Hispanic Ethnicity
EDUCATIONALSTATUS
Less than High School Grad
High School Grad/GED
Some College
College Degree +
Missing/Unknown Education
BMI
Underweight
Normal Weight
Overweight
Obese
Missing/Unknown BMI
PAYER
All Payers
Medicaid
Private Insurance
Self-Pay
PERINATALLEVEL OFBIRTHINGFACILITY
Perinatal Level I
Perinatal Level II & IIE
Perinatal Level III
RURAL-URBANCOMMUNITYAREA CODES(RUCA)
Rural
Urban
Not Defined
TOTAL STATE TOTAL
N/A
N/A
12.39%
16.67%
-16.24%
-14.81%
0.00%
2.22%
0.28%
0.26%
-0.32%
-0.36%
0.00%
2.22%
2.54%
1.82%
1.65%
2.07%
0.00%
0.00%
2.12%
1.63%
1.79%
1.98%
0.00%
0.00%
2.26%
1.56%
1.97%
2.43%
N/A
-37.09%
1.63%
3.64%
0.00%
-0.56%
0.02%
0.11%
0.00%
0.95%
1.25%
3.13%
3.33%
1.18%
1.09%
3.08%
0.00%
1.51%
1.23%
3.02%
-0.52%
41.18%
-0.01%
0.42%
1.90%
1.44%
1.84%
0.83%
1.91%
1.02%
-5.49%
9.35%
-2.87%
1.06%
3.98%
-0.39%
0.13%
-0.06%
0.02%
0.08%
6.71%
1.52%
2.03%
1.91%
2.09%
1.84%
1.27%
2.06%
1.96%
1.89%
7.10%
1.39%
2.09%
1.89%
2.01%
24.29%
-1.65%
15.12%
-5.33%
-4.66%
0.34%
-0.04%
0.26%
-0.08%
-0.09%
1.74%
2.39%
1.98%
1.42%
1.84%
1.83%
2.31%
1.68%
1.42%
1.77%
1.40%
2.43%
1.72%
1.50%
1.93%
33.14%
3.79%
-2.88%
1.64%
0.58%
0.05%
-0.06%
0.03%
2.33%
1.37%
2.02%
1.86%
1.97%
1.09%
2.00%
1.75%
1.75%
1.32%
2.08%
1.83%
-2.12%
11.76%
-16.67%
-0.09%
0.06%
-0.09%
4.15%
0.57%
0.45%
3.94%
0.53%
0.58%
4.24%
0.51%
0.54%
39.66%
9.15%
-14.89%
0.94%
0.15%
-0.35%
3.31%
1.79%
2.00%
4.03%
1.63%
2.03%
2.37%
1.64%
2.35%
1.64%0.03%1.86%1.76%1.83%
2011-2013 Percentage of Very Low Birthweight Babies
USC Institute for Families in Society Division of Medicaid Policy Research
25

Demographic Characteristic Measure
AGE Ages 0-18
Ages 19-24
Ages 25-34
Ages 35-44
Ages 45-54
Missing/Unknown Age
RACE Black Race
White Race
Other Race
Missing/Unknown Race
ETHNICITY Hispanic Ethnicity
Non-Hispanic Ethnicity
EDUCATIONAL STATUS Less than High School Grad
High School Grad/GED
Some College
College Degree +
Missing/Unknown Education
BMI Underweight
Normal Weight
Overweight
Obese
Missing/Unknown BMI
PERINATAL LEVEL OFBIRTHING FACILITY
Perinatal Level I
Perinatal Levels II & IIE
Perinatal Level III
RURAL-URBAN COMMUNITYAREA CODES (RUCA)
Rural
Urban
Not Defined
28.41%
50.61%
15.38%
5.50%
0.10%
0.00%
55.30%
43.48%
1.22%
0.00%
93.69%
6.31%
19.35%
24.75%
28.41%
26.48%
1.02%
30.86%
25.56%
36.97%
3.97%
2.65%
16.50%
81.06%
2.44%
27.39%
70.77%
1.83%
2013 Percentage of Total Very Low Birthweight Babies
USC Institute for Families in Society Division of Medicaid Policy Research
26

Summary of Findings: Moderately Low Birthweight
§ Although there was a slight increase in the percentage of VLBW babies from 2011 to 2013 (0.03%, RC:2%), there was a decrease in the percentage of moderately low birthweight (MLBW) babies from 8.06% in2011 to 7.84% in 2013 (-0.22%, RC: -3%). The Initiative specifically focused on this weight category with its focus on reducing elective inductions at 37-38 weeks gestation. § There was a relative increase of 14% in the percentage of babies of Hispanic origin born with MLBW. However, a greater percentage of Non-Hispanic women had MLBW babies (8.06%) than Hispanic women(5.31%). § There was a 3% relative increase in the percentage of women with less than a high school education havingbabies with MLBW; women in all other educational categories had a decrease. The more education a motherhad, the less likely she was to have a MLBW baby in 2013. § There was a .93% increase in the percentage of women categorized as self-pay having MLBW babies (RC:+15%). With a rate of 8.98% in 2013, mothers qualifying for Medicaid had the highest percentage of MLBWbabies. Even though self-pay mothers had the highest percentage of VLBW babies in 2013, they had one ofthe lowest percentages of MLBW babies (6.99%). § Fewer MLBW babies were born in Perinatal Level I (-0.28%, RC: -5%) and Perinatal Level III hospitals (-0.84%, RC: -8%), while slightly more were born in Perinatal Level II & IIE hospitals (0.09%, RC: +1%). Nearly 10% of babies born in Perinatal Level III hospitals, 7% born in Perinatal Level II & IIE, and 6% born inPerinatal Level I had MLBW. § Not surprisingly, given the decrease in Perinatal Level I hospitals, the overall percentage of MLBW babiesborn to mothers residing in rural areas also decreased (-0.78%, RC: -9%). However, rural women were morelikely to have VLBW (2.00%) and MLBW (8.05%) babies in 2013 than urban women (1.79% and 7.72%, respectively). § In 2013, 46% of MLBW babies were born in Perinatal Level II & IIE hospitals, and another 46% were born in Perinatal Level III hospitals. However, only approximately 7% of ba-bies born in Perinatal Level II & IIE hospitals were measured MLBW compared to nearly 10% in Perinatal Level III hospitals. § More mothers identifying as White than any other race group had MLBW babies in 2013 (52%). Nevertheless, the disparity between Black and White women was considerable with 11.03% of Black womenhaving a MLBW baby compared to 6.25% of White women. § Women delivering MLBW babies in 2013 were most likely to have normal weight (42%), although a combined 49% were measured as overweight (22%) or obese (27%). A greater percentage of underweight(13.29%) and normal weight (8.10%) mothers had MLBW babies in 2013 than overweight (7.22%) and obese(7.32%) mothers.
USC Institute for Families in Society Division of Medicaid Policy Research
27

DemographicCharacteristic Measure 2011 %
MLBW2012 %MLBW
2013 %MLBW
DifferenceBetween2013 and2011(MLBW)
RelativePercentageChange(MLBW)
AGE
Ages 0-18
Ages 19-24
Ages 25-34
Ages 35-44
Ages 45-54
Missing/Unknown Age
RACE
Black Race
White Race
Other Race
Missing/Unknown Race
ETHNICITYHispanic Ethnicity
Non-Hispanic Ethnicity
EDUCATIONALSTATUS
Less than High School Grad
High School Grad/GED
Some College
College Degree +
Missing/Unknown Education
BMI
Underweight
Normal Weight
Overweight
Obese
Missing/Unknown BMI
PAYER
All Payers
Medicaid
Private Insurance
Self-Pay
PERINATALLEVEL OFBIRTHINGFACILITY
Perinatal Level I
Perinatal Level II & IIE
Perinatal Level III
RURAL-URBANCOMMUNITYAREA CODES(RUCA)
Rural
Urban
Not Defined
TOTAL STATE TOTAL
N/A
0.00%
-0.11%
-2.32%
-1.86%
-7.72%
0.00%
0.00%
-0.01%
-0.17%
-0.16%
-0.75%
0.00%
11.11%
8.79%
7.16%
8.42%
8.97%
0.00%
15.15%
8.49%
7.23%
8.30%
9.52%
0.00%
11.11%
8.80%
7.33%
8.58%
9.72%
-100.00%
-7.98%
0.16%
-5.08%
-7.14%
-0.62%
0.01%
-0.59%
0.00%
7.15%
6.25%
11.03%
0.00%
6.05%
6.18%
11.23%
7.14%
7.77%
6.24%
11.62%
-3.93%
14.19%
-0.33%
0.66%
8.06%
5.31%
8.12%
5.04%
8.39%
4.65%
-53.75%
-0.32%
-1.10%
-6.86%
3.39%
-6.24%
-0.02%
-0.09%
-0.63%
0.31%
5.37%
6.24%
8.12%
8.56%
9.45%
9.20%
6.42%
8.06%
8.46%
9.18%
11.61%
6.26%
8.21%
9.19%
9.14%
-10.98%
-8.61%
4.34%
-2.06%
2.07%
-0.86%
-0.69%
0.30%
-0.17%
0.27%
6.97%
7.32%
7.22%
8.10%
13.29%
6.76%
7.62%
7.33%
7.93%
13.14%
7.83%
8.01%
6.92%
8.27%
13.02%
15.35%
-1.30%
-3.65%
-2.73%
0.93%
-0.08%
-0.34%
-0.22%
6.99%
6.08%
8.98%
7.84%
6.21%
5.95%
9.01%
7.86%
6.06%
6.16%
9.32%
8.06%
-7.76%
1.34%
-4.70%
-0.84%
0.09%
-0.28%
9.99%
6.79%
5.68%
10.17%
6.94%
4.96%
10.83%
6.70%
5.96%
5.95%
-0.39%
-8.83%
0.60%
-0.03%
-0.78%
10.68%
7.72%
8.05%
9.27%
7.60%
8.53%
10.08%
7.75%
8.83%
-2.73%-0.22%7.84%7.86%8.06%
2011-2013 Percentage of Moderately Low Birthweight Babies
USC Institute for Families in Society Division of Medicaid Policy Research
28
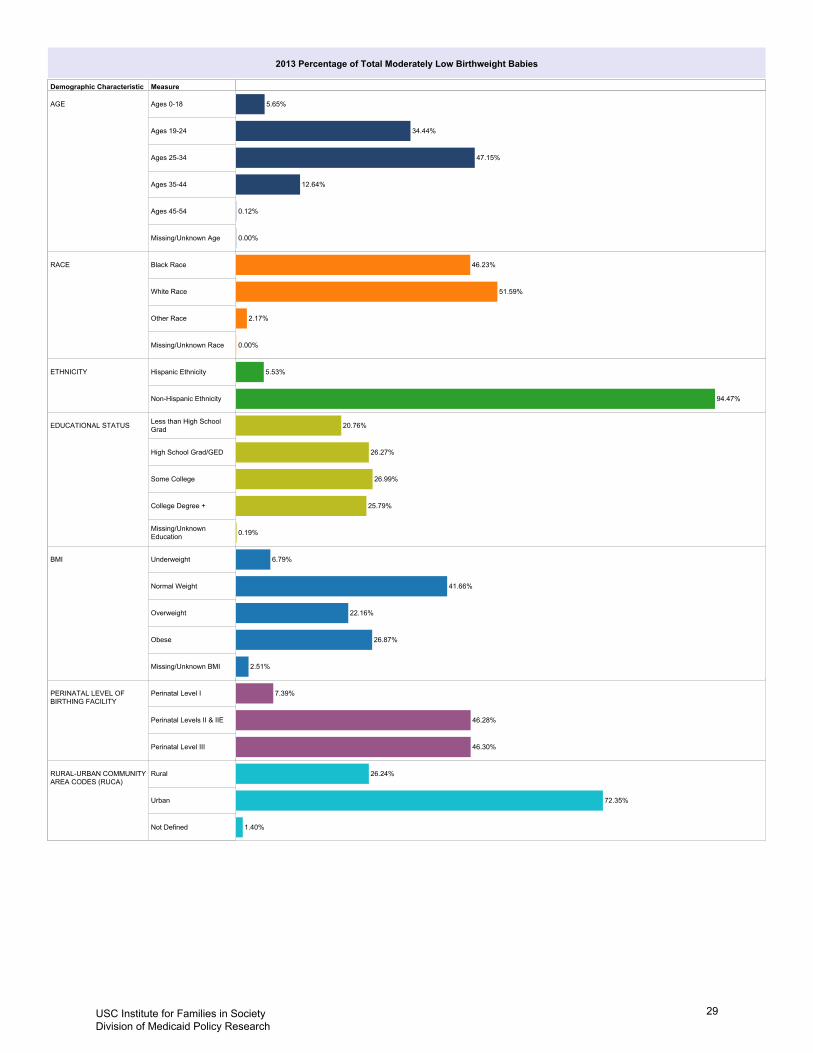
Demographic Characteristic Measure
AGE Ages 0-18
Ages 19-24
Ages 25-34
Ages 35-44
Ages 45-54
Missing/Unknown Age
RACE Black Race
White Race
Other Race
Missing/Unknown Race
ETHNICITY Hispanic Ethnicity
Non-Hispanic Ethnicity
EDUCATIONAL STATUS Less than High SchoolGrad
High School Grad/GED
Some College
College Degree +
Missing/UnknownEducation
BMI Underweight
Normal Weight
Overweight
Obese
Missing/Unknown BMI
PERINATAL LEVEL OFBIRTHING FACILITY
Perinatal Level I
Perinatal Levels II & IIE
Perinatal Level III
RURAL-URBAN COMMUNITYAREA CODES (RUCA)
Rural
Urban
Not Defined
34.44%
47.15%
12.64%
5.65%
0.12%
0.00%
46.23%
51.59%
2.17%
0.00%
94.47%
5.53%
20.76%
26.27%
26.99%
25.79%
0.19%
41.66%
22.16%
26.87%
6.79%
2.51%
46.28%
46.30%
7.39%
26.24%
72.35%
1.40%
2013 Percentage of Total Moderately Low Birthweight Babies
USC Institute for Families in Society Division of Medicaid Policy Research
29
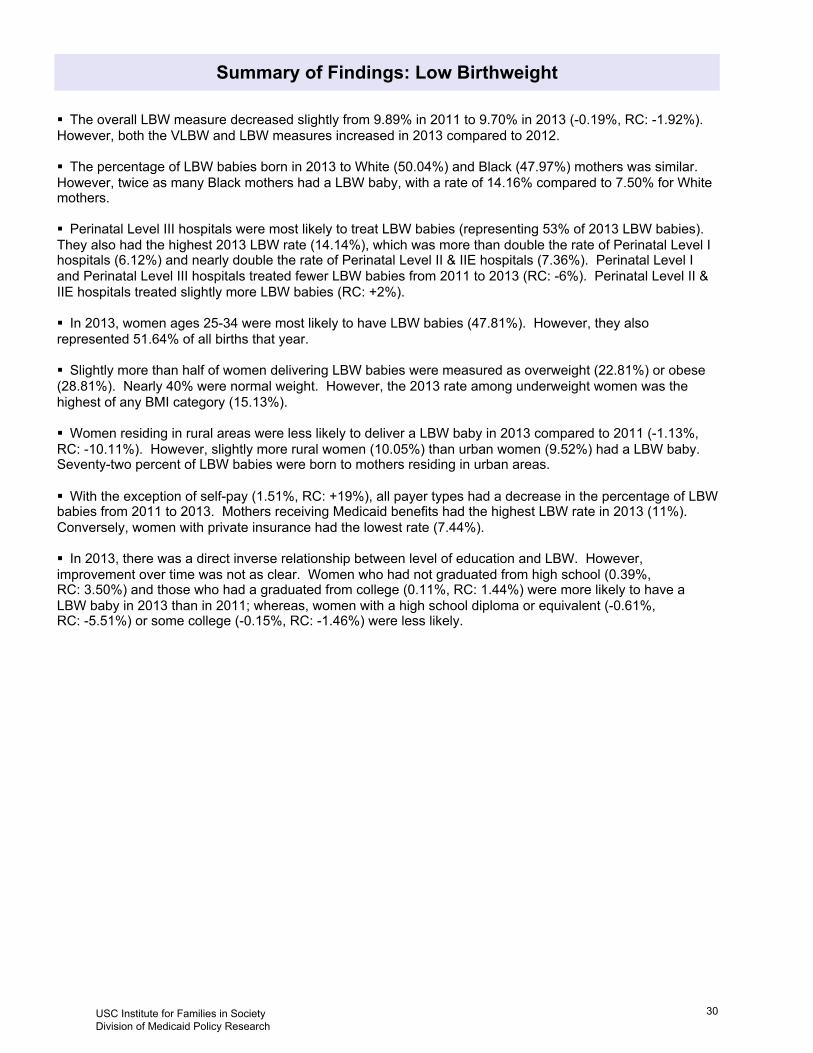
Summary of Findings: Low Birthweight
§ The overall LBW measure decreased slightly from 9.89% in 2011 to 9.70% in 2013 (-0.19%, RC: -1.92%).However, both the VLBW and LBW measures increased in 2013 compared to 2012. § The percentage of LBW babies born in 2013 to White (50.04%) and Black (47.97%) mothers was similar. However, twice as many Black mothers had a LBW baby, with a rate of 14.16% compared to 7.50% for Whitemothers. § Perinatal Level III hospitals were most likely to treat LBW babies (representing 53% of 2013 LBW babies).They also had the highest 2013 LBW rate (14.14%), which was more than double the rate of Perinatal Level Ihospitals (6.12%) and nearly double the rate of Perinatal Level II & IIE hospitals (7.36%). Perinatal Level Iand Perinatal Level III hospitals treated fewer LBW babies from 2011 to 2013 (RC: -6%). Perinatal Level II &IIE hospitals treated slightly more LBW babies (RC: +2%). § In 2013, women ages 25-34 were most likely to have LBW babies (47.81%). However, they also represented 51.64% of all births that year. § Slightly more than half of women delivering LBW babies were measured as overweight (22.81%) or obese(28.81%). Nearly 40% were normal weight. However, the 2013 rate among underweight women was the highest of any BMI category (15.13%). § Women residing in rural areas were less likely to deliver a LBW baby in 2013 compared to 2011 (-1.13%,RC: -10.11%). However, slightly more rural women (10.05%) than urban women (9.52%) had a LBW baby.Seventy-two percent of LBW babies were born to mothers residing in urban areas. § With the exception of self-pay (1.51%, RC: +19%), all payer types had a decrease in the percentage of LBWbabies from 2011 to 2013. Mothers receiving Medicaid benefits had the highest LBW rate in 2013 (11%).Conversely, women with private insurance had the lowest rate (7.44%). § In 2013, there was a direct inverse relationship between level of education and LBW. However, improvement over time was not as clear. Women who had not graduated from high school (0.39%, RC: 3.50%) and those who had a graduated from college (0.11%, RC: 1.44%) were more likely to have aLBW baby in 2013 than in 2011; whereas, women with a high school diploma or equivalent (-0.61%, RC: -5.51%) or some college (-0.15%, RC: -1.46%) were less likely.
USC Institute for Families in Society Division of Medicaid Policy Research
30
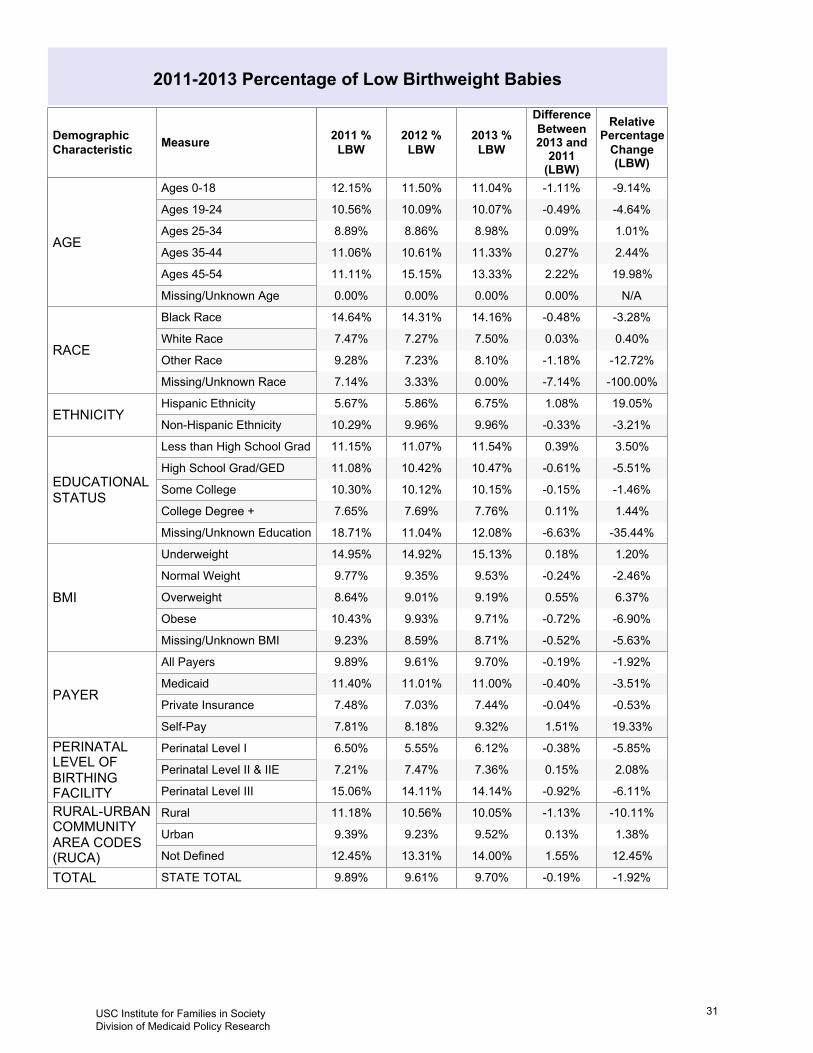
DemographicCharacteristic Measure 2011 %
LBW2012 %LBW
2013 %LBW
DifferenceBetween2013 and2011(LBW)
RelativePercentageChange(LBW)
AGE
Ages 0-18
Ages 19-24
Ages 25-34
Ages 35-44
Ages 45-54
Missing/Unknown Age
RACE
Black Race
White Race
Other Race
Missing/Unknown Race
ETHNICITYHispanic Ethnicity
Non-Hispanic Ethnicity
EDUCATIONALSTATUS
Less than High School Grad
High School Grad/GED
Some College
College Degree +
Missing/Unknown Education
BMI
Underweight
Normal Weight
Overweight
Obese
Missing/Unknown BMI
PAYER
All Payers
Medicaid
Private Insurance
Self-Pay
PERINATALLEVEL OFBIRTHINGFACILITY
Perinatal Level I
Perinatal Level II & IIE
Perinatal Level III
RURAL-URBANCOMMUNITYAREA CODES(RUCA)
Rural
Urban
Not Defined
TOTAL STATE TOTAL
N/A
19.98%
2.44%
1.01%
-4.64%
-9.14%
0.00%
2.22%
0.27%
0.09%
-0.49%
-1.11%
0.00%
13.33%
11.33%
8.98%
10.07%
11.04%
0.00%
15.15%
10.61%
8.86%
10.09%
11.50%
0.00%
11.11%
11.06%
8.89%
10.56%
12.15%
-100.00%
-12.72%
0.40%
-3.28%
-7.14%
-1.18%
0.03%
-0.48%
0.00%
8.10%
7.50%
14.16%
3.33%
7.23%
7.27%
14.31%
7.14%
9.28%
7.47%
14.64%
-3.21%
19.05%
-0.33%
1.08%
9.96%
6.75%
9.96%
5.86%
10.29%
5.67%
-35.44%
1.44%
-1.46%
-5.51%
3.50%
-6.63%
0.11%
-0.15%
-0.61%
0.39%
12.08%
7.76%
10.15%
10.47%
11.54%
11.04%
7.69%
10.12%
10.42%
11.07%
18.71%
7.65%
10.30%
11.08%
11.15%
-5.63%
-6.90%
6.37%
-2.46%
1.20%
-0.52%
-0.72%
0.55%
-0.24%
0.18%
8.71%
9.71%
9.19%
9.53%
15.13%
8.59%
9.93%
9.01%
9.35%
14.92%
9.23%
10.43%
8.64%
9.77%
14.95%
19.33%
-0.53%
-3.51%
-1.92%
1.51%
-0.04%
-0.40%
-0.19%
9.32%
7.44%
11.00%
9.70%
8.18%
7.03%
11.01%
9.61%
7.81%
7.48%
11.40%
9.89%
-6.11%
2.08%
-5.85%
-0.92%
0.15%
-0.38%
14.14%
7.36%
6.12%
14.11%
7.47%
5.55%
15.06%
7.21%
6.50%
12.45%
1.38%
-10.11%
1.55%
0.13%
-1.13%
14.00%
9.52%
10.05%
13.31%
9.23%
10.56%
12.45%
9.39%
11.18%
-1.92%-0.19%9.70%9.61%9.89%
2011-2013 Percentage of Low Birthweight Babies
USC Institute for Families in Society Division of Medicaid Policy Research
31

Demographic Characteristic Measure
AGE Ages 0-18
Ages 19-24
Ages 25-34
Ages 35-44
Ages 45-54
Missing/Unknown Age
RACE Black Race
White Race
Other Race
Missing/Unknown Race
ETHNICITY Hispanic Ethnicity
Non-Hispanic Ethnicity
EDUCATIONAL STATUS Less than High SchoolGrad
High School Grad/GED
Some College
College Degree +
Missing/UnknownEducation
BMI Underweight
Normal Weight
Overweight
Obese
Missing/Unknown BMI
PERINATAL LEVEL OFBIRTHING FACILITY
Perinatal Level I
Perinatal Levels II & IIE
Perinatal Level III
RURAL-URBAN COMMUNITYAREA CODES (RUCA)
Rural
Urban
Not Defined
33.28%
47.81%
13.16%
5.63%
0.12%
0.00%
47.97%
50.04%
1.99%
0.00%
94.32%
5.68%
20.49%
25.98%
27.27%
25.92%
0.35%
39.59%
22.81%
28.81%
6.25%
2.54%
40.57%
52.97%
6.45%
26.46%
72.05%
1.48%
2013 Percentage of Total Low Birthweight Babies
USC Institute for Families in Society Division of Medicaid Policy Research
32

Summary of Findings: Normal Birthweight
§ Across demographic groups, there were only slight changes in the percentage of normal weight babies bornin 2013 as compared to 2011. Rural women were more likely to have a normal weight baby (1.11%, RC: +1%), and women of Hispanic ethnicity were less likely (-1.08%, RC: -1%). However, other demographic shifts were negligible. § In 2013, a greater proportion of normal birthweight babies were present among women who were ages 25-34 (52.05%), White (66.28%), Non-Hispanic ethnicity (91.57%), normal weight (40.39%), residing in an urbanarea (73.58%), and delivered in a Perinatal Level II or IIE hospital (54.86%). However, as the majority of babies born are of normal weight (90.28%), this also represented the general birth profile in SC. § Women of Hispanic ethnicity were more likely to have a normal birthweight baby in 2013 than women ofNon-Hispanic ethnicity (93.25% and 90.01%, respectively). § As expected, given the inverse relationship between educational attainment and LBW, the rate of normalbirthweight was highest among women with a college degree (92.21%). § Lower 2013 rates of normal weight were present among Black women (85.81%); younger women ages 0-18(88.85%) and older women ages 35-44 (88.65%) or 45-64 (86.67%); underweight women (84.82%), womenqualifying for Medicaid (88.97%), women delivering in Perinatal Level III facilities (85.81%), and rural women(89.92%).
USC Institute for Families in Society Division of Medicaid Policy Research
33

DemographicCharacteristic Measure 2011 % NBW 2012 % NBW 2013 % NBW
DifferenceBetween2013 and2011 (NBW)
RelativePercentageChange(NBW)
AGE
Ages 0-18
Ages 19-24
Ages 25-34
Ages 35-44
Ages 45-54
Missing/Unknown Age
RACE
Black Race
White Race
Other Race
Missing/Unknown Race
ETHNICITYHispanic Ethnicity
Non-Hispanic Ethnicity
EDUCATIONALSTATUS
Less than High School Grad
High School Grad/GED
Some College
College Degree +
Missing/Unknown Education
BMI
Underweight
Normal Weight
Overweight
Obese
Missing/Unknown BMI
PAYER
All Payers
Medicaid
Private Insurance
Self-PayPERINATALLEVEL OFBIRTHINGFACILITY
Perinatal Level I
Perinatal Level II & IIE
Perinatal Level IIIRURAL-URBANCOMMUNITYAREA CODES(RUCA)
Rural
Urban
Not Defined
TOTAL STATE TOTAL
0.00%
-2.50%
-0.30%
-0.12%
0.51%
1.14%
0.00%
-2.22%
-0.27%
-0.11%
0.46%
1.00%
100.00%
86.67%
88.65%
90.99%
89.90%
88.85%
100.00%
84.85%
89.39%
91.13%
89.90%
88.50%
100.00%
88.89%
88.92%
91.10%
89.44%
87.85%
7.69%
1.30%
-0.06%
0.54%
7.14%
1.18%
-0.06%
0.46%
100.00%
91.90%
92.47%
85.81%
96.67%
92.77%
92.73%
85.67%
92.86%
90.72%
92.53%
85.35%
0.35%
-1.14%
0.31%
-1.08%
90.01%
93.25%
90.03%
94.14%
89.70%
94.33%
9.01%
-0.14%
0.14%
0.67%
-0.47%
7.27%
-0.13%
0.13%
0.60%
-0.42%
87.92%
92.21%
89.82%
89.51%
88.42%
88.96%
92.31%
89.87%
89.57%
88.92%
80.65%
92.34%
89.69%
88.91%
88.84%
0.64%
0.76%
-0.63%
0.24%
-0.27%
0.58%
0.68%
-0.58%
0.22%
-0.23%
91.29%
90.25%
90.78%
90.45%
84.82%
91.36%
90.05%
90.99%
90.65%
85.08%
90.71%
89.57%
91.36%
90.23%
85.05%
-1.64%
0.01%
0.42%
0.19%
-1.51%
0.01%
0.37%
0.17%
90.68%
92.53%
88.97%
90.28%
91.82%
92.96%
88.98%
90.38%
92.19%
92.52%
88.60%
90.11%
1.04%
-0.18%
0.36%
0.88%
-0.17%
0.34%
85.81%
92.62%
93.82%
85.88%
92.52%
94.44%
84.93%
92.79%
93.48%
-1.77%
-0.17%
1.25%
-1.55%
-0.15%
1.11%
86.00%
90.45%
89.92%
86.69%
90.76%
89.44%
87.55%
90.60%
88.81%
0.18%0.16%90.27%90.38%90.11%
2011-2013 Percentage of Normal Birthweight Babies
USC Institute for Families in Society Division of Medicaid Policy Research
34

Demographic Characteristic Measure
AGE Ages 0-18
Ages 19-24
Ages 25-34
Ages 35-44
Ages 45-54
Missing/Unknown Age
RACE Black Race
White Race
Other Race
Missing/Unknown Race
ETHNICITY Hispanic Ethnicity
Non-Hispanic Ethnicity
EDUCATIONAL STATUS Less than High SchoolGrad
High School Grad/GED
Some College
College Degree +
Missing/UnknownEducation
BMI Underweight
Normal Weight
Overweight
Obese
Missing/Unknown BMI
PERINATAL LEVEL OFBIRTHING FACILITY
Perinatal Level I
Perinatal Levels II & IIE
Perinatal Level III
RURAL-URBAN COMMUNITYAREA CODES (RUCA)
Rural
Urban
Not Defined
31.94%
52.05%
11.06%
4.86%
0.08%
0.00%
31.24%
66.28%
2.43%
0.04%
91.57%
8.43%
16.88%
23.84%
25.93%
33.08%
0.27%
40.39%
24.21%
28.78%
3.77%
2.86%
10.61%
54.86%
34.53%
25.44%
73.58%
0.98%
2013 Percentage of Total Normal Birthweight Babies
USC Institute for Families in Society Division of Medicaid Policy Research
35
Access to Prenatal Care
USC Institute for Families in Society Division of Medicaid Policy Research
36
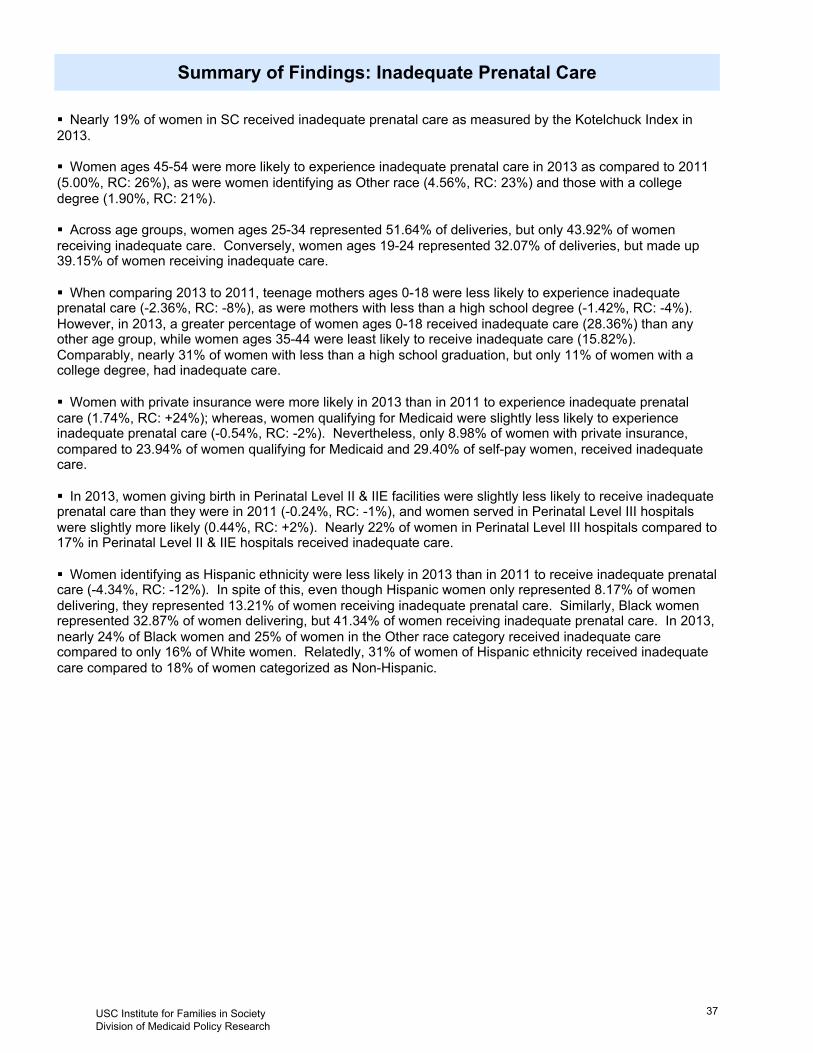
Summary of Findings: Inadequate Prenatal Care
§ Nearly 19% of women in SC received inadequate prenatal care as measured by the Kotelchuck Index in2013. § Women ages 45-54 were more likely to experience inadequate prenatal care in 2013 as compared to 2011(5.00%, RC: 26%), as were women identifying as Other race (4.56%, RC: 23%) and those with a college degree (1.90%, RC: 21%). § Across age groups, women ages 25-34 represented 51.64% of deliveries, but only 43.92% of women receiving inadequate care. Conversely, women ages 19-24 represented 32.07% of deliveries, but made up39.15% of women receiving inadequate care. § When comparing 2013 to 2011, teenage mothers ages 0-18 were less likely to experience inadequate prenatal care (-2.36%, RC: -8%), as were mothers with less than a high school degree (-1.42%, RC: -4%).However, in 2013, a greater percentage of women ages 0-18 received inadequate care (28.36%) than any other age group, while women ages 35-44 were least likely to receive inadequate care (15.82%). Comparably, nearly 31% of women with less than a high school graduation, but only 11% of women with a college degree, had inadequate care. § Women with private insurance were more likely in 2013 than in 2011 to experience inadequate prenatalcare (1.74%, RC: +24%); whereas, women qualifying for Medicaid were slightly less likely to experience inadequate prenatal care (-0.54%, RC: -2%). Nevertheless, only 8.98% of women with private insurance, compared to 23.94% of women qualifying for Medicaid and 29.40% of self-pay women, received inadequatecare. § In 2013, women giving birth in Perinatal Level II & IIE facilities were slightly less likely to receive inadequateprenatal care than they were in 2011 (-0.24%, RC: -1%), and women served in Perinatal Level III hospitalswere slightly more likely (0.44%, RC: +2%). Nearly 22% of women in Perinatal Level III hospitals compared to17% in Perinatal Level II & IIE hospitals received inadequate care. § Women identifying as Hispanic ethnicity were less likely in 2013 than in 2011 to receive inadequate prenatalcare (-4.34%, RC: -12%). In spite of this, even though Hispanic women only represented 8.17% of women delivering, they represented 13.21% of women receiving inadequate prenatal care. Similarly, Black womenrepresented 32.87% of women delivering, but 41.34% of women receiving inadequate prenatal care. In 2013,nearly 24% of Black women and 25% of women in the Other race category received inadequate care compared to only 16% of White women. Relatedly, 31% of women of Hispanic ethnicity received inadequatecare compared to 18% of women categorized as Non-Hispanic.
USC Institute for Families in Society Division of Medicaid Policy Research
37
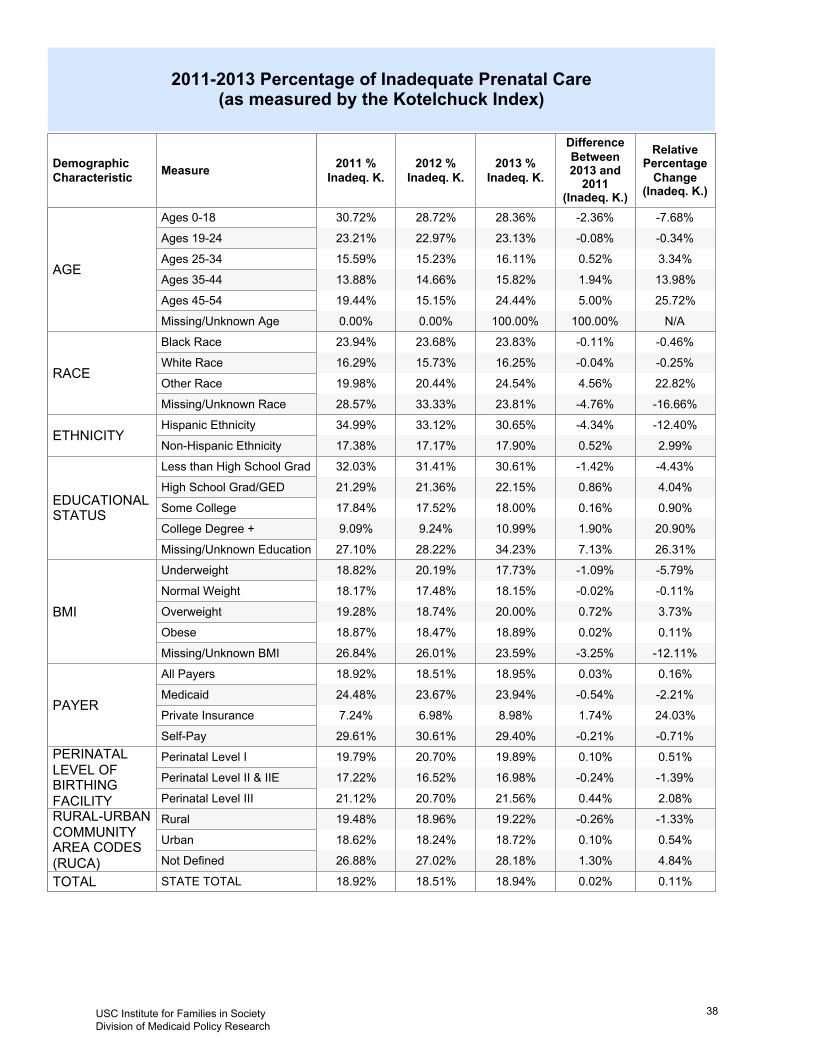
DemographicCharacteristic Measure 2011 %
Inadeq. K.2012 %Inadeq. K.
2013 %Inadeq. K.
DifferenceBetween2013 and2011
(Inadeq. K.)
RelativePercentageChange(Inadeq. K.)
AGE
Ages 0-18
Ages 19-24
Ages 25-34
Ages 35-44
Ages 45-54
Missing/Unknown Age
RACE
Black Race
White Race
Other Race
Missing/Unknown Race
ETHNICITYHispanic Ethnicity
Non-Hispanic Ethnicity
EDUCATIONALSTATUS
Less than High School Grad
High School Grad/GED
Some College
College Degree +
Missing/Unknown Education
BMI
Underweight
Normal Weight
Overweight
Obese
Missing/Unknown BMI
PAYER
All Payers
Medicaid
Private Insurance
Self-PayPERINATALLEVEL OFBIRTHINGFACILITY
Perinatal Level I
Perinatal Level II & IIE
Perinatal Level IIIRURAL-URBANCOMMUNITYAREA CODES(RUCA)
Rural
Urban
Not Defined
TOTAL STATE TOTAL
N/A
25.72%
13.98%
3.34%
-0.34%
-7.68%
100.00%
5.00%
1.94%
0.52%
-0.08%
-2.36%
100.00%
24.44%
15.82%
16.11%
23.13%
28.36%
0.00%
15.15%
14.66%
15.23%
22.97%
28.72%
0.00%
19.44%
13.88%
15.59%
23.21%
30.72%
-16.66%
22.82%
-0.25%
-0.46%
-4.76%
4.56%
-0.04%
-0.11%
23.81%
24.54%
16.25%
23.83%
33.33%
20.44%
15.73%
23.68%
28.57%
19.98%
16.29%
23.94%
2.99%
-12.40%
0.52%
-4.34%
17.90%
30.65%
17.17%
33.12%
17.38%
34.99%
26.31%
20.90%
0.90%
4.04%
-4.43%
7.13%
1.90%
0.16%
0.86%
-1.42%
34.23%
10.99%
18.00%
22.15%
30.61%
28.22%
9.24%
17.52%
21.36%
31.41%
27.10%
9.09%
17.84%
21.29%
32.03%
-12.11%
0.11%
3.73%
-0.11%
-5.79%
-3.25%
0.02%
0.72%
-0.02%
-1.09%
23.59%
18.89%
20.00%
18.15%
17.73%
26.01%
18.47%
18.74%
17.48%
20.19%
26.84%
18.87%
19.28%
18.17%
18.82%
-0.71%
24.03%
-2.21%
0.16%
-0.21%
1.74%
-0.54%
0.03%
29.40%
8.98%
23.94%
18.95%
30.61%
6.98%
23.67%
18.51%
29.61%
7.24%
24.48%
18.92%
2.08%
-1.39%
0.51%
0.44%
-0.24%
0.10%
21.56%
16.98%
19.89%
20.70%
16.52%
20.70%
21.12%
17.22%
19.79%
4.84%
0.54%
-1.33%
1.30%
0.10%
-0.26%
28.18%
18.72%
19.22%
27.02%
18.24%
18.96%
26.88%
18.62%
19.48%
0.11%0.02%18.94%18.51%18.92%
2011-2013 Percentage of Inadequate Prenatal Care
(as measured by the Kotelchuck Index)
USC Institute for Families in Society Division of Medicaid Policy Research
38
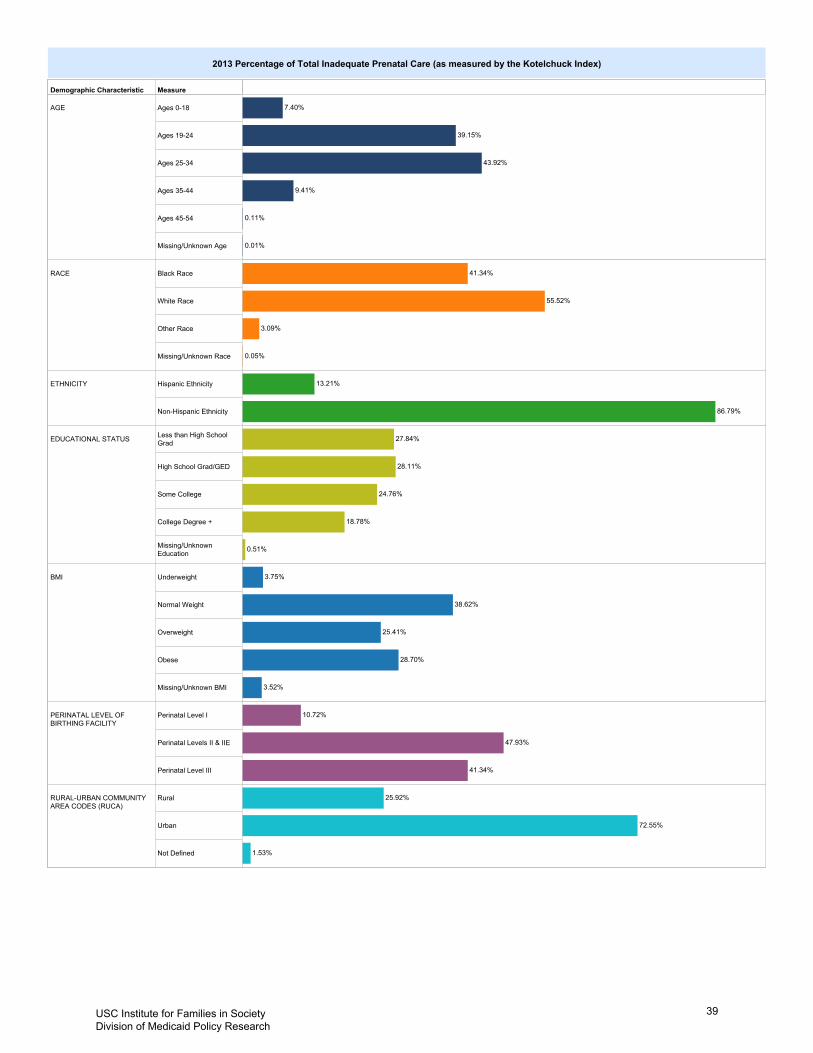
Demographic Characteristic Measure
AGE Ages 0-18
Ages 19-24
Ages 25-34
Ages 35-44
Ages 45-54
Missing/Unknown Age
RACE Black Race
White Race
Other Race
Missing/Unknown Race
ETHNICITY Hispanic Ethnicity
Non-Hispanic Ethnicity
EDUCATIONAL STATUS Less than High SchoolGrad
High School Grad/GED
Some College
College Degree +
Missing/UnknownEducation
BMI Underweight
Normal Weight
Overweight
Obese
Missing/Unknown BMI
PERINATAL LEVEL OFBIRTHING FACILITY
Perinatal Level I
Perinatal Levels II & IIE
Perinatal Level III
RURAL-URBAN COMMUNITYAREA CODES (RUCA)
Rural
Urban
Not Defined
39.15%
43.92%
7.40%
9.41%
0.11%
0.01%
41.34%
55.52%
3.09%
0.05%
13.21%
86.79%
27.84%
28.11%
24.76%
18.78%
0.51%
38.62%
25.41%
28.70%
3.75%
3.52%
10.72%
47.93%
41.34%
25.92%
72.55%
1.53%
2013 Percentage of Total Inadequate Prenatal Care (as measured by the Kotelchuck Index)
USC Institute for Families in Society Division of Medicaid Policy Research
39
Summary of Findings: Intermediate Prenatal Care
§ Although there was little over all change in the percentage of SC women receiving inadequate prenatal care(0.02%, RC: 0.11%), there was a larger negative shift in the percentage receiving intermediate care (-0.66%,RC: -10%). § With the exception of women ages 0-18 & 45-54 and those served in Perinatal Level I hospitals, all demographic groups had fewer women receiving intermediate care in 2013 than in 2011. The greatest decreases were seen for women identifying as Other race (-1.97%, RC: -26%) and Hispanic ethnicity (-2.67%,RC: -29%). § The 2013 percent of total intermediate prenatal care coincided with the 2013 demographic birth profile. § Women with less than a high school degree or equivalent had the highest percentage of intermediate prenatal care in 2013 (7.06%) compared to women of any other educational attainment. § There was an inverse relationship between age and intermediate care with younger women having a higherrate than older women. A similar trend was seen with BMI with a greater percentage of underweight and normal weight women having intermediate care than overweight and obese women. § Nearly 8% of mothers identified as self-pay received intermediate care compared to 6% for all other payertypes.
USC Institute for Families in Society Division of Medicaid Policy Research
40
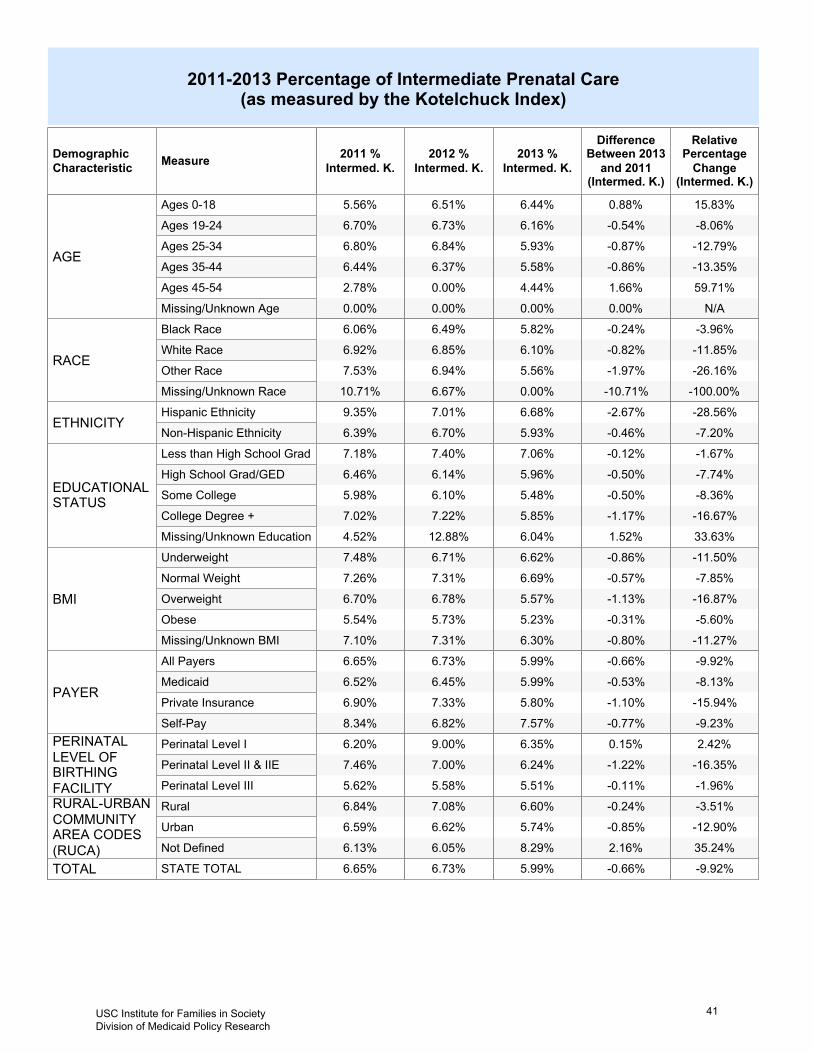
DemographicCharacteristic Measure 2011 %
Intermed. K.2012 %
Intermed. K.2013 %
Intermed. K.
DifferenceBetween 2013and 2011
(Intermed. K.)
RelativePercentageChange
(Intermed. K.)
AGE
Ages 0-18
Ages 19-24
Ages 25-34
Ages 35-44
Ages 45-54
Missing/Unknown Age
RACE
Black Race
White Race
Other Race
Missing/Unknown Race
ETHNICITYHispanic Ethnicity
Non-Hispanic Ethnicity
EDUCATIONALSTATUS
Less than High School Grad
High School Grad/GED
Some College
College Degree +
Missing/Unknown Education
BMI
Underweight
Normal Weight
Overweight
Obese
Missing/Unknown BMI
PAYER
All Payers
Medicaid
Private Insurance
Self-PayPERINATALLEVEL OFBIRTHINGFACILITY
Perinatal Level I
Perinatal Level II & IIE
Perinatal Level IIIRURAL-URBANCOMMUNITYAREA CODES(RUCA)
Rural
Urban
Not Defined
TOTAL STATE TOTAL
N/A
59.71%
-13.35%
-12.79%
-8.06%
15.83%
0.00%
1.66%
-0.86%
-0.87%
-0.54%
0.88%
0.00%
4.44%
5.58%
5.93%
6.16%
6.44%
0.00%
0.00%
6.37%
6.84%
6.73%
6.51%
0.00%
2.78%
6.44%
6.80%
6.70%
5.56%
-100.00%
-26.16%
-11.85%
-3.96%
-10.71%
-1.97%
-0.82%
-0.24%
0.00%
5.56%
6.10%
5.82%
6.67%
6.94%
6.85%
6.49%
10.71%
7.53%
6.92%
6.06%
-7.20%
-28.56%
-0.46%
-2.67%
5.93%
6.68%
6.70%
7.01%
6.39%
9.35%
33.63%
-16.67%
-8.36%
-7.74%
-1.67%
1.52%
-1.17%
-0.50%
-0.50%
-0.12%
6.04%
5.85%
5.48%
5.96%
7.06%
12.88%
7.22%
6.10%
6.14%
7.40%
4.52%
7.02%
5.98%
6.46%
7.18%
-11.27%
-5.60%
-16.87%
-7.85%
-11.50%
-0.80%
-0.31%
-1.13%
-0.57%
-0.86%
6.30%
5.23%
5.57%
6.69%
6.62%
7.31%
5.73%
6.78%
7.31%
6.71%
7.10%
5.54%
6.70%
7.26%
7.48%
-9.23%
-15.94%
-8.13%
-9.92%
-0.77%
-1.10%
-0.53%
-0.66%
7.57%
5.80%
5.99%
5.99%
6.82%
7.33%
6.45%
6.73%
8.34%
6.90%
6.52%
6.65%
-1.96%
-16.35%
2.42%
-0.11%
-1.22%
0.15%
5.51%
6.24%
6.35%
5.58%
7.00%
9.00%
5.62%
7.46%
6.20%
35.24%
-12.90%
-3.51%
2.16%
-0.85%
-0.24%
8.29%
5.74%
6.60%
6.05%
6.62%
7.08%
6.13%
6.59%
6.84%
-9.92%-0.66%5.99%6.73%6.65%
2011-2013 Percentage of Intermediate Prenatal Care
(as measured by the Kotelchuck Index)
USC Institute for Families in Society Division of Medicaid Policy Research
41

Demographic Characteristic Measure
AGE Ages 0-18
Ages 19-24
Ages 25-34
Ages 35-44
Ages 45-54
Missing/Unknown Age
RACE Black Race
White Race
Other Race
Missing/Unknown Race
ETHNICITY Hispanic Ethnicity
Non-Hispanic Ethnicity
EDUCATIONAL STATUS Less than High SchoolGrad
High School Grad/GED
Some College
College Degree +
Missing/UnknownEducation
BMI Underweight
Normal Weight
Overweight
Obese
Missing/Unknown BMI
PERINATAL LEVEL OFBIRTHING FACILITY
Perinatal Level I
Perinatal Levels II & IIE
Perinatal Level III
RURAL-URBAN COMMUNITYAREA CODES (RUCA)
Rural
Urban
Not Defined
33.00%
51.12%
10.50%
5.31%
0.06%
0.00%
31.92%
65.87%
2.21%
0.00%
90.89%
9.11%
20.31%
23.92%
23.85%
31.64%
0.28%
45.05%
22.40%
25.15%
4.43%
2.97%
10.82%
55.74%
33.41%
28.16%
70.42%
1.42%
2013 Percentage of Total Intermediate Prenatal Care
(as measured by the Kotelchuck Index)
USC Institute for Families in Society Division of Medicaid Policy Research
42

Summary of Findings: Adequate Prenatal Care
§ Approximately 28% received adequate are in 2013, which was a decrease from 29% in 2011 and 2012.When comparing 2013 to 2011, fewer women received adequate prenatal care in SC (-0.57%, RC: -1.99%).Some of this decrease is likely because a greater percentage of mothers received adequate plus care (1.25%,RC: 2.75%), as intermediate care decreased (-.66%, RC: -9.92%) and inadequate care only slightly increased(0.02%, RC: +0.11%). § A greater percentage of women ages 25-34 received adequate care in 2013 than any other age group(29.73%). Younger women were more likely to receive adequate prenatal care in 2013 as compared to 2011(Ages 0-18: 2.85%, RC: +13%; Ages 19-24: 0.28%, RC: +1%). Women over the age of 24 were less likely toreceive adequate care, with the largest drop being for women ages 45-54 (-6.66%, RC: -30%). § A similar trend was seen for educational status with women with less than high school (1.75%, RC: +8%) orhigh school graduation (0.04%, RC: 0.16%) being more likely to receive adequate care in 2013 than they werein 2011, and women with some college (-1.07%, RC: -4%) or a college degree (-2.90%, RC: -8%) less likely.However, the inverse trend for education and adequate prenatal care in 2013 was striking; 33% of college educated mothers received adequate care compared to only 24% of women with less than a high school education, a difference of 9%. § White women were more likely than Black women and women categorized as Other race to have adequatecare in 2013 (30.26% vs. 23.80% and 29.71%, respectively). § Women identified as Medicaid recipients (0.81%, RC: +3%) or self-pay (2.71%, RC: +10%) were more likelyto receive adequate care; whereas, women with private insurance were less likely (-3.14%, RC: -9%). However, a greater percentage of women with private insurance (nearly 34%) received adequate care than allother payer types. § Women served in Perinatal Level I hospitals in 2013 were more likely to receive adequate care than theywere in 2011 (1.02%, RC: +3%), as were women delivering in Perinatal Level III hospitals (0.21%, RC:+0.79%). However, women delivering in Perinatal Level II & IIE hospitals were less likely to receive adequatecare (-1.30%, RC: -4%). This mirrored findings for rural and urban women with rural women more likely to receive adequate care (1.05%, RC: +4%) and urban women less likely (-1.17%, RC: -4%). Some of this decrease can likely be accounted for by an increase in the percentage of these women receiving adequateplus care (PL II & IIE: 2.84%, RC: +6%; Urban: 1.94%, RC: +4%). § A greater percentage of women served in Perinatal Level I facilities (31.65%) received adequate care thanin Perinatal Levels II & IIE (28.28%) and Perinatal Level III (26.91%). However, the rate of adequate plus carefor these mothers was lower than it was for those served in other facilities.
USC Institute for Families in Society Division of Medicaid Policy Research
43
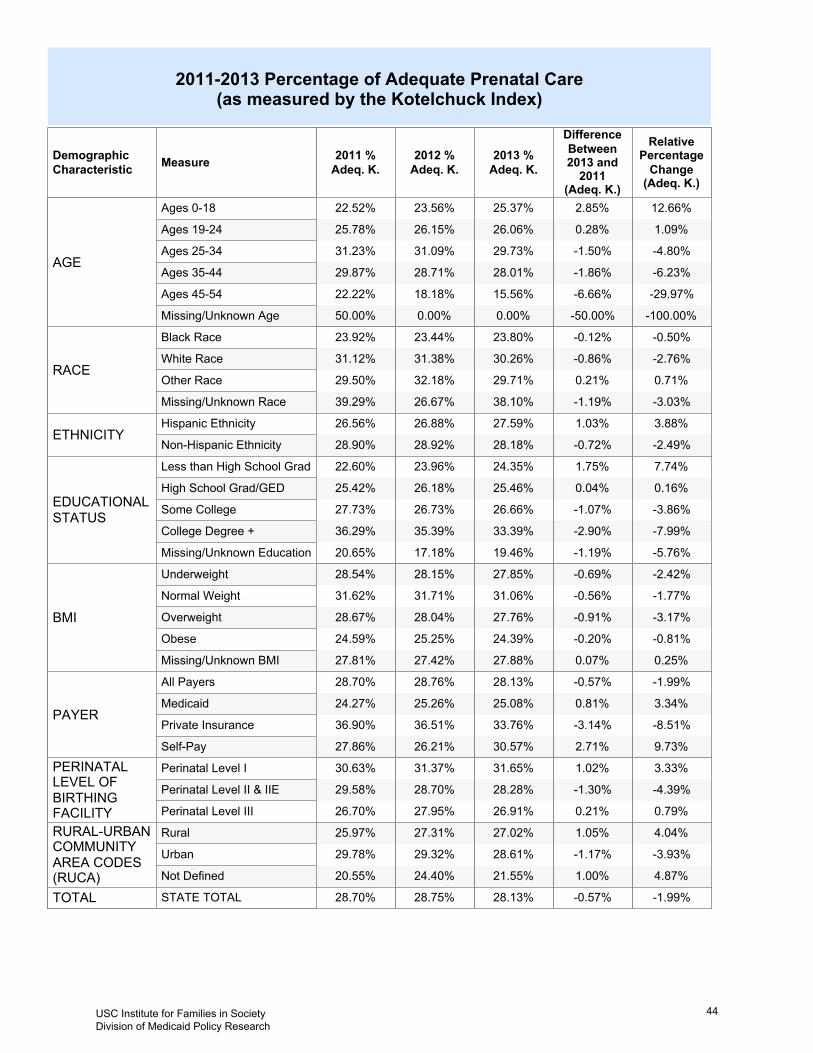
DemographicCharacteristic Measure 2011 %
Adeq. K.2012 %Adeq. K.
2013 %Adeq. K.
DifferenceBetween2013 and2011
(Adeq. K.)
RelativePercentageChange(Adeq. K.)
AGE
Ages 0-18
Ages 19-24
Ages 25-34
Ages 35-44
Ages 45-54
Missing/Unknown Age
RACE
Black Race
White Race
Other Race
Missing/Unknown Race
ETHNICITYHispanic Ethnicity
Non-Hispanic Ethnicity
EDUCATIONALSTATUS
Less than High School Grad
High School Grad/GED
Some College
College Degree +
Missing/Unknown Education
BMI
Underweight
Normal Weight
Overweight
Obese
Missing/Unknown BMI
PAYER
All Payers
Medicaid
Private Insurance
Self-Pay
PERINATALLEVEL OFBIRTHINGFACILITY
Perinatal Level I
Perinatal Level II & IIE
Perinatal Level III
RURAL-URBANCOMMUNITYAREA CODES(RUCA)
Rural
Urban
Not Defined
TOTAL STATE TOTAL
-100.00%
-29.97%
-6.23%
-4.80%
1.09%
12.66%
-50.00%
-6.66%
-1.86%
-1.50%
0.28%
2.85%
0.00%
15.56%
28.01%
29.73%
26.06%
25.37%
0.00%
18.18%
28.71%
31.09%
26.15%
23.56%
50.00%
22.22%
29.87%
31.23%
25.78%
22.52%
-3.03%
0.71%
-2.76%
-0.50%
-1.19%
0.21%
-0.86%
-0.12%
38.10%
29.71%
30.26%
23.80%
26.67%
32.18%
31.38%
23.44%
39.29%
29.50%
31.12%
23.92%
-2.49%
3.88%
-0.72%
1.03%
28.18%
27.59%
28.92%
26.88%
28.90%
26.56%
-5.76%
-7.99%
-3.86%
0.16%
7.74%
-1.19%
-2.90%
-1.07%
0.04%
1.75%
19.46%
33.39%
26.66%
25.46%
24.35%
17.18%
35.39%
26.73%
26.18%
23.96%
20.65%
36.29%
27.73%
25.42%
22.60%
0.25%
-0.81%
-3.17%
-1.77%
-2.42%
0.07%
-0.20%
-0.91%
-0.56%
-0.69%
27.88%
24.39%
27.76%
31.06%
27.85%
27.42%
25.25%
28.04%
31.71%
28.15%
27.81%
24.59%
28.67%
31.62%
28.54%
9.73%
-8.51%
3.34%
-1.99%
2.71%
-3.14%
0.81%
-0.57%
30.57%
33.76%
25.08%
28.13%
26.21%
36.51%
25.26%
28.76%
27.86%
36.90%
24.27%
28.70%
0.79%
-4.39%
3.33%
0.21%
-1.30%
1.02%
26.91%
28.28%
31.65%
27.95%
28.70%
31.37%
26.70%
29.58%
30.63%
4.87%
-3.93%
4.04%
1.00%
-1.17%
1.05%
21.55%
28.61%
27.02%
24.40%
29.32%
27.31%
20.55%
29.78%
25.97%
-1.99%-0.57%28.13%28.75%28.70%
2011-2013 Percentage of Adequate Prenatal Care
(as measured by the Kotelchuck Index)
USC Institute for Families in Society Division of Medicaid Policy Research
44
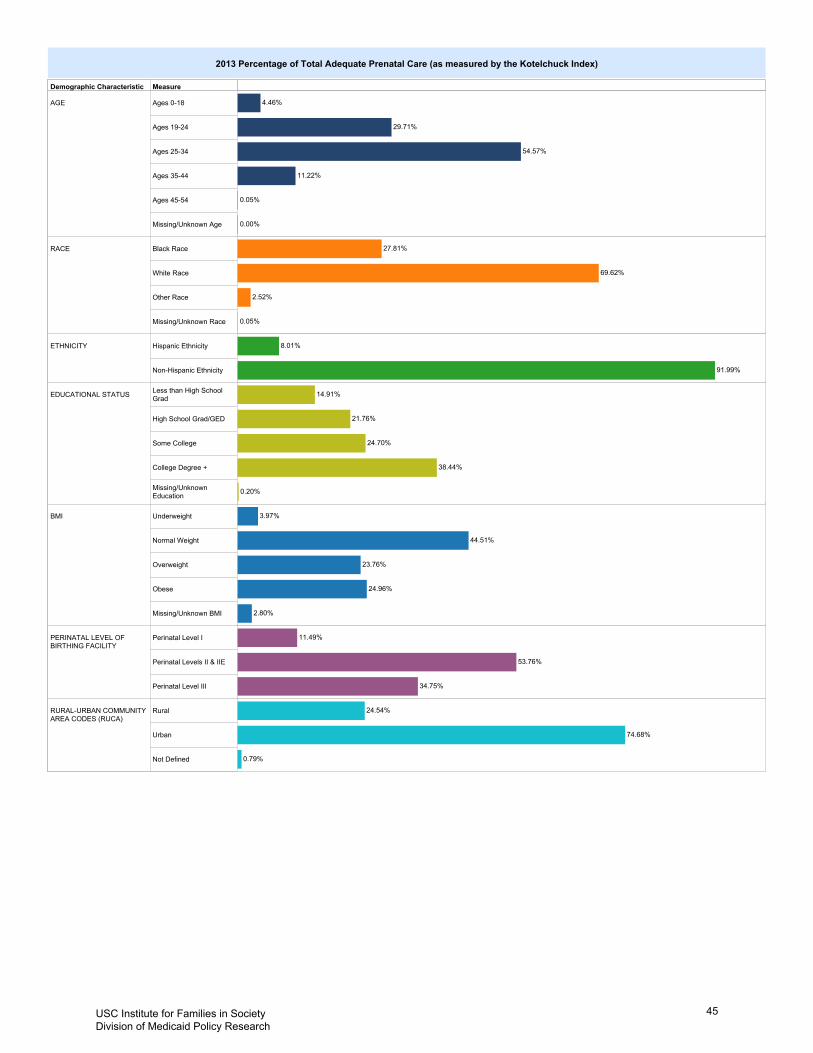
Demographic Characteristic Measure
AGE Ages 0-18
Ages 19-24
Ages 25-34
Ages 35-44
Ages 45-54
Missing/Unknown Age
RACE Black Race
White Race
Other Race
Missing/Unknown Race
ETHNICITY Hispanic Ethnicity
Non-Hispanic Ethnicity
EDUCATIONAL STATUS Less than High SchoolGrad
High School Grad/GED
Some College
College Degree +
Missing/UnknownEducation
BMI Underweight
Normal Weight
Overweight
Obese
Missing/Unknown BMI
PERINATAL LEVEL OFBIRTHING FACILITY
Perinatal Level I
Perinatal Levels II & IIE
Perinatal Level III
RURAL-URBAN COMMUNITYAREA CODES (RUCA)
Rural
Urban
Not Defined
29.71%
54.57%
11.22%
4.46%
0.05%
0.00%
27.81%
69.62%
2.52%
0.05%
91.99%
8.01%
14.91%
21.76%
24.70%
38.44%
0.20%
44.51%
23.76%
24.96%
3.97%
2.80%
11.49%
53.76%
34.75%
24.54%
74.68%
0.79%
2013 Percentage of Total Adequate Prenatal Care (as measured by the Kotelchuck Index)
USC Institute for Families in Society Division of Medicaid Policy Research
45
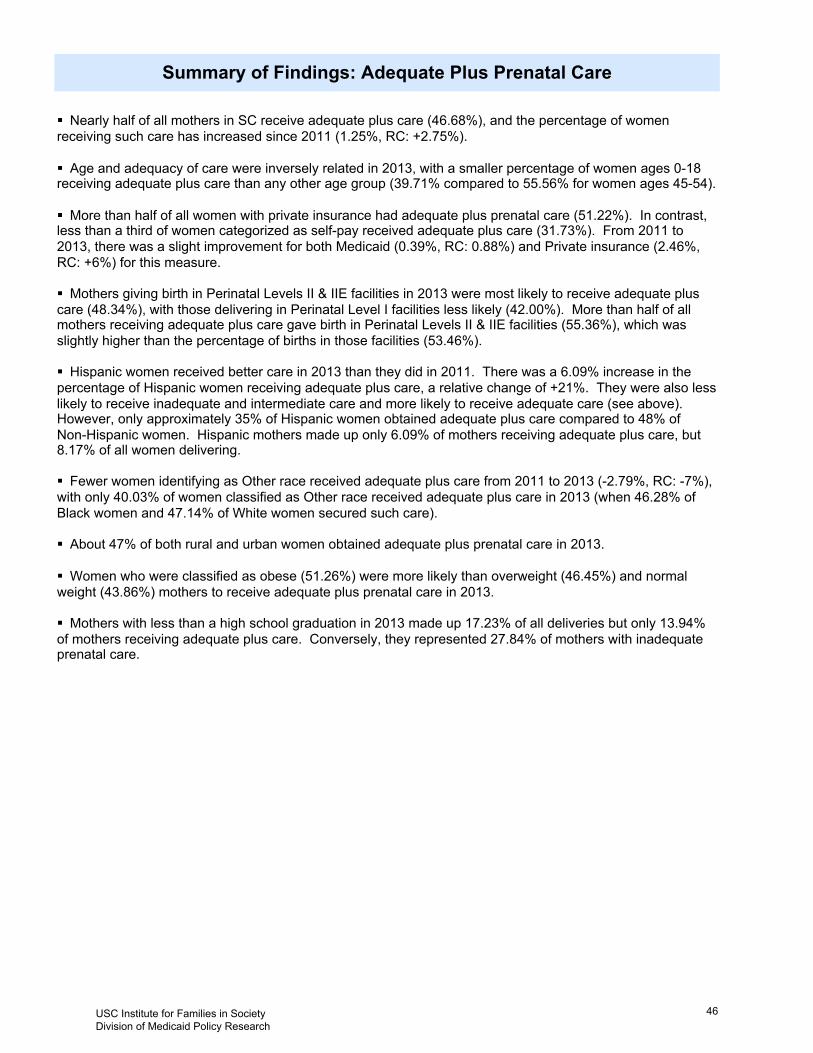
Summary of Findings: Adequate Plus Prenatal Care
§ Nearly half of all mothers in SC receive adequate plus care (46.68%), and the percentage of women receiving such care has increased since 2011 (1.25%, RC: +2.75%). § Age and adequacy of care were inversely related in 2013, with a smaller percentage of women ages 0-18receiving adequate plus care than any other age group (39.71% compared to 55.56% for women ages 45-54). § More than half of all women with private insurance had adequate plus prenatal care (51.22%). In contrast,less than a third of women categorized as self-pay received adequate plus care (31.73%). From 2011 to2013, there was a slight improvement for both Medicaid (0.39%, RC: 0.88%) and Private insurance (2.46%,RC: +6%) for this measure. § Mothers giving birth in Perinatal Levels II & IIE facilities in 2013 were most likely to receive adequate pluscare (48.34%), with those delivering in Perinatal Level I facilities less likely (42.00%). More than half of allmothers receiving adequate plus care gave birth in Perinatal Levels II & IIE facilities (55.36%), which wasslightly higher than the percentage of births in those facilities (53.46%). § Hispanic women received better care in 2013 than they did in 2011. There was a 6.09% increase in the percentage of Hispanic women receiving adequate plus care, a relative change of +21%. They were also lesslikely to receive inadequate and intermediate care and more likely to receive adequate care (see above). However, only approximately 35% of Hispanic women obtained adequate plus care compared to 48% of Non-Hispanic women. Hispanic mothers made up only 6.09% of mothers receiving adequate plus care, but8.17% of all women delivering. § Fewer women identifying as Other race received adequate plus care from 2011 to 2013 (-2.79%, RC: -7%),with only 40.03% of women classified as Other race received adequate plus care in 2013 (when 46.28% ofBlack women and 47.14% of White women secured such care). § About 47% of both rural and urban women obtained adequate plus prenatal care in 2013. § Women who were classified as obese (51.26%) were more likely than overweight (46.45%) and normalweight (43.86%) mothers to receive adequate plus prenatal care in 2013. § Mothers with less than a high school graduation in 2013 made up 17.23% of all deliveries but only 13.94%of mothers receiving adequate plus care. Conversely, they represented 27.84% of mothers with inadequateprenatal care.
USC Institute for Families in Society Division of Medicaid Policy Research
46
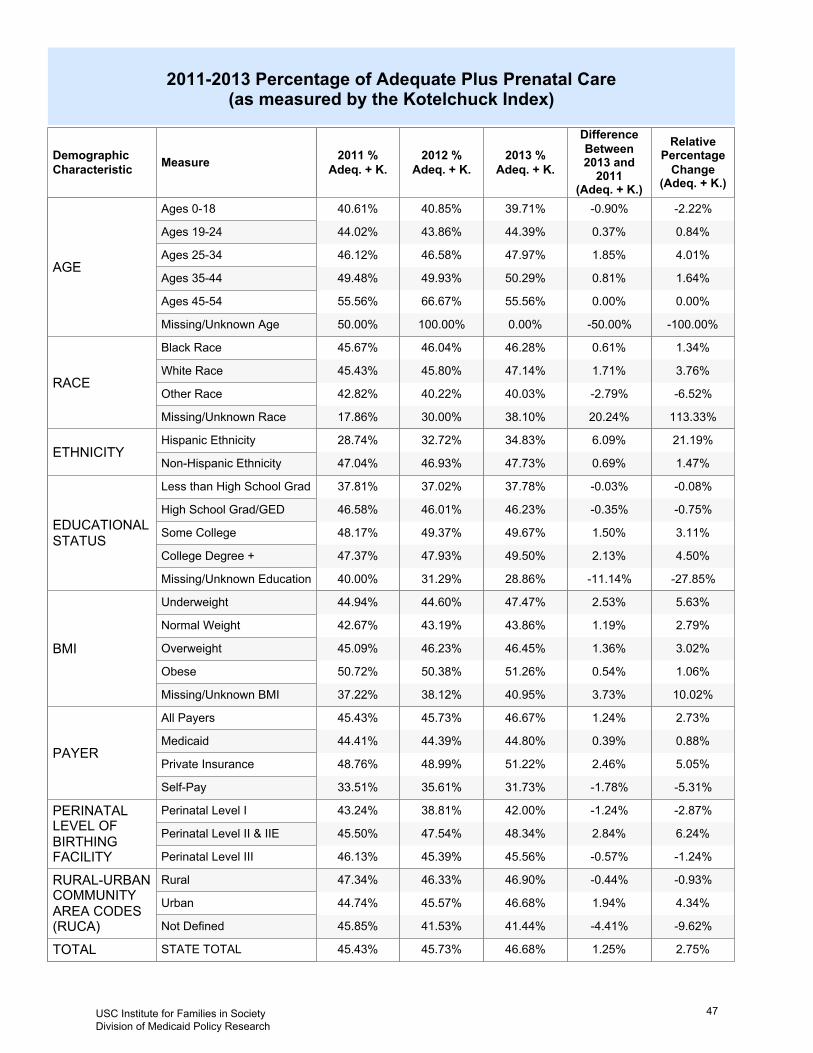
DemographicCharacteristic Measure 2011 %
Adeq. + K.2012 %Adeq. + K.
2013 %Adeq. + K.
DifferenceBetween2013 and2011
(Adeq. + K.)
RelativePercentageChange(Adeq. + K.)
AGE
Ages 0-18
Ages 19-24
Ages 25-34
Ages 35-44
Ages 45-54
Missing/Unknown Age
RACE
Black Race
White Race
Other Race
Missing/Unknown Race
ETHNICITYHispanic Ethnicity
Non-Hispanic Ethnicity
EDUCATIONALSTATUS
Less than High School Grad
High School Grad/GED
Some College
College Degree +
Missing/Unknown Education
BMI
Underweight
Normal Weight
Overweight
Obese
Missing/Unknown BMI
PAYER
All Payers
Medicaid
Private Insurance
Self-Pay
PERINATALLEVEL OFBIRTHINGFACILITY
Perinatal Level I
Perinatal Level II & IIE
Perinatal Level III
RURAL-URBANCOMMUNITYAREA CODES(RUCA)
Rural
Urban
Not Defined
TOTAL STATE TOTAL
-100.00%
0.00%
1.64%
4.01%
0.84%
-2.22%
-50.00%
0.00%
0.81%
1.85%
0.37%
-0.90%
0.00%
55.56%
50.29%
47.97%
44.39%
39.71%
100.00%
66.67%
49.93%
46.58%
43.86%
40.85%
50.00%
55.56%
49.48%
46.12%
44.02%
40.61%
113.33%
-6.52%
3.76%
1.34%
20.24%
-2.79%
1.71%
0.61%
38.10%
40.03%
47.14%
46.28%
30.00%
40.22%
45.80%
46.04%
17.86%
42.82%
45.43%
45.67%
1.47%
21.19%
0.69%
6.09%
47.73%
34.83%
46.93%
32.72%
47.04%
28.74%
-27.85%
4.50%
3.11%
-0.75%
-0.08%
-11.14%
2.13%
1.50%
-0.35%
-0.03%
28.86%
49.50%
49.67%
46.23%
37.78%
31.29%
47.93%
49.37%
46.01%
37.02%
40.00%
47.37%
48.17%
46.58%
37.81%
10.02%
1.06%
3.02%
2.79%
5.63%
3.73%
0.54%
1.36%
1.19%
2.53%
40.95%
51.26%
46.45%
43.86%
47.47%
38.12%
50.38%
46.23%
43.19%
44.60%
37.22%
50.72%
45.09%
42.67%
44.94%
-5.31%
5.05%
0.88%
2.73%
-1.78%
2.46%
0.39%
1.24%
31.73%
51.22%
44.80%
46.67%
35.61%
48.99%
44.39%
45.73%
33.51%
48.76%
44.41%
45.43%
-1.24%
6.24%
-2.87%
-0.57%
2.84%
-1.24%
45.56%
48.34%
42.00%
45.39%
47.54%
38.81%
46.13%
45.50%
43.24%
-9.62%
4.34%
-0.93%
-4.41%
1.94%
-0.44%
41.44%
46.68%
46.90%
41.53%
45.57%
46.33%
45.85%
44.74%
47.34%
2.75%1.25%46.68%45.73%45.43%
2011-2013 Percentage of Adequate Plus Prenatal Care
(as measured by the Kotelchuck Index)
USC Institute for Families in Society Division of Medicaid Policy Research
47

Demographic Characteristic Measure
AGE Ages 0-18
Ages 19-24
Ages 25-34
Ages 35-44
Ages 45-54
Missing/Unknown Age
RACE Black Race
White Race
Other Race
Missing/Unknown Race
ETHNICITY Hispanic Ethnicity
Non-Hispanic Ethnicity
EDUCATIONAL STATUS Less than High School Grad
High School Grad/GED
Some College
College Degree +
Missing/Unknown Education
BMI Underweight
Normal Weight
Overweight
Obese
Missing/Unknown BMI
PERINATAL LEVEL OFBIRTHING FACILITY
Perinatal Level I
Perinatal Levels II & IIE
Perinatal Level III
RURAL-URBAN COMMUNITYAREA CODES (RUCA)
Rural
Urban
Not Defined
30.50%
53.06%
12.14%
4.20%
0.10%
0.00%
32.58%
65.34%
2.05%
0.03%
93.91%
6.09%
13.94%
23.81%
27.73%
34.34%
0.17%
37.88%
23.96%
31.61%
4.07%
2.48%
55.36%
35.45%
9.19%
25.67%
73.42%
0.91%
2013 Percentage of Total Adequate Plus Prenatal Care (as measured by the Kotelchuck Index)
USC Institute for Families in Society Division of Medicaid Policy Research
48

Elective Inductions at 37-38 Weeks Gestation
USC Institute for Families in Society Division of Medicaid Policy Research
49
Summary of Findings: Elective Inductions at 37-38 Weeks Gestation
§ SC reduced early elective inductions at 37-38 weeks gestation by half from a rate of 8.81% in 2011 to4.43% in 2013. Every demographic group saw a decrease in this measure except for those women whose rural-urban category could not be defined. § Women ages 25-34, the age group most likely to have an elective induction (45.52%), had the largest reduction of any age group (-5.03%, RC: -56%). § Of the three perinatal levels, Perinatal Level III hospitals obtained the greatest reduction in early elective inductions from 2011 to 2013 with a decrease of 5.14% (RC: -64%). 65.67% of all early elective inductions occurred in Perinatal Level II & IIE hospitals in 2013; 5.15% of women treated at one of these hospitals hadan early elective induction. § Similarly, White women, the predominantly reported race, saw the largest reductions (-5.70%, RC: -53%), although women identifying as Other and Black also had substantial reductions (-49% and -43% RC, respectively). White women (5.08%) were more likely than Black women (4.10%) and Other women (2.75%)to have an induction at 37-38 weeks in 2013. They represented 58.58% of all early elective inductions thatyear. § Women identified as self-pay had less of a relative decrease, 25%, compared to women with private insurance (53%), Medicaid (49%), or all payers in general (50%), in elective inductions at 37-38 weeks gestation from 2011 to 2013. They also had the highest 2013 percentage of any payer type(4.88%). § A greater percentage of obese women were likely to have an early elective induction (5.28%) compared toall other BMI categories. Although the percentage of women receiving an early elective induction among thisgroup did decrease 2.72% from 2011 to 2013, the relative reduction was only 34% compared to 58% for normal weight and 49% for overweight women. Underweight women had the least change with a reduction ofonly 1.13% (RC: 20%). Normal weight women represented 39.93% of women receiving an early elective induction, followed by obese women (25.75%), overweight women (24.25%), and underweight women(5.60%). § Only 2.93% of women identifying as Hispanic had an early elective induction in 2013 (RC: -53%) as compared to 4.59% of women of Non-Hispanic ethnicity (RC: -49%).
USC Institute for Families in Society Division of Medicaid Policy Research
50
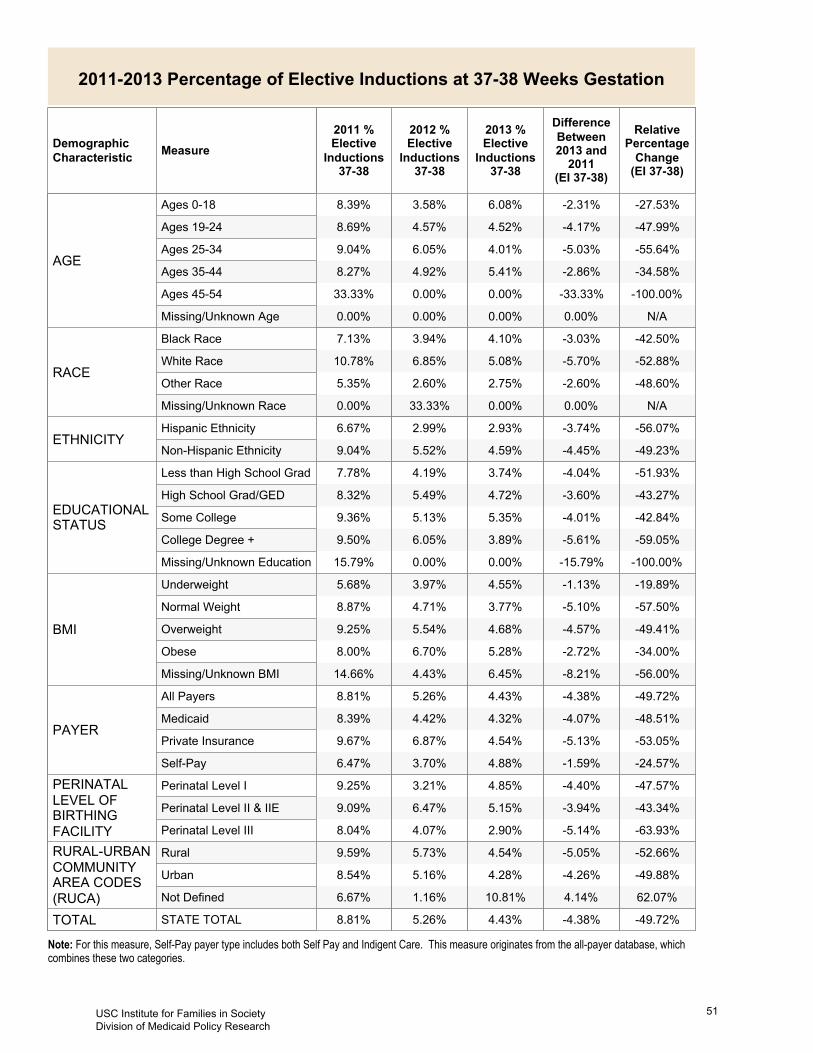
DemographicCharacteristic Measure
2011 %ElectiveInductions37-38
2012 %ElectiveInductions37-38
2013 %ElectiveInductions37-38
DifferenceBetween2013 and2011
(EI 37-38)
RelativePercentageChange(EI 37-38)
AGE
Ages 0-18
Ages 19-24
Ages 25-34
Ages 35-44
Ages 45-54
Missing/Unknown Age
RACE
Black Race
White Race
Other Race
Missing/Unknown Race
ETHNICITYHispanic Ethnicity
Non-Hispanic Ethnicity
EDUCATIONALSTATUS
Less than High School Grad
High School Grad/GED
Some College
College Degree +
Missing/Unknown Education
BMI
Underweight
Normal Weight
Overweight
Obese
Missing/Unknown BMI
PAYER
All Payers
Medicaid
Private Insurance
Self-Pay
PERINATALLEVEL OFBIRTHINGFACILITY
Perinatal Level I
Perinatal Level II & IIE
Perinatal Level III
RURAL-URBANCOMMUNITYAREA CODES(RUCA)
Rural
Urban
Not Defined
TOTAL STATE TOTAL
N/A
-100.00%
-34.58%
-55.64%
-47.99%
-27.53%
0.00%
-33.33%
-2.86%
-5.03%
-4.17%
-2.31%
0.00%
0.00%
5.41%
4.01%
4.52%
6.08%
0.00%
0.00%
4.92%
6.05%
4.57%
3.58%
0.00%
33.33%
8.27%
9.04%
8.69%
8.39%
N/A
-48.60%
-52.88%
-42.50%
0.00%
-2.60%
-5.70%
-3.03%
0.00%
2.75%
5.08%
4.10%
33.33%
2.60%
6.85%
3.94%
0.00%
5.35%
10.78%
7.13%
-49.23%
-56.07%
-4.45%
-3.74%
4.59%
2.93%
5.52%
2.99%
9.04%
6.67%
-100.00%
-59.05%
-42.84%
-43.27%
-51.93%
-15.79%
-5.61%
-4.01%
-3.60%
-4.04%
0.00%
3.89%
5.35%
4.72%
3.74%
0.00%
6.05%
5.13%
5.49%
4.19%
15.79%
9.50%
9.36%
8.32%
7.78%
-56.00%
-34.00%
-49.41%
-57.50%
-19.89%
-8.21%
-2.72%
-4.57%
-5.10%
-1.13%
6.45%
5.28%
4.68%
3.77%
4.55%
4.43%
6.70%
5.54%
4.71%
3.97%
14.66%
8.00%
9.25%
8.87%
5.68%
-24.57%
-53.05%
-48.51%
-49.72%
-1.59%
-5.13%
-4.07%
-4.38%
4.88%
4.54%
4.32%
4.43%
3.70%
6.87%
4.42%
5.26%
6.47%
9.67%
8.39%
8.81%
-63.93%
-43.34%
-47.57%
-5.14%
-3.94%
-4.40%
2.90%
5.15%
4.85%
4.07%
6.47%
3.21%
8.04%
9.09%
9.25%
62.07%
-49.88%
-52.66%
4.14%
-4.26%
-5.05%
10.81%
4.28%
4.54%
1.16%
5.16%
5.73%
6.67%
8.54%
9.59%
-49.72%-4.38%4.43%5.26%8.81%
2011-2013 Percentage of Elective Inductions at 37-38 Weeks Gestation
Note: For this measure, Self-Pay payer type includes both Self Pay and Indigent Care. This measure originates from the all-payer database, whichcombines these two categories.
USC Institute for Families in Society Division of Medicaid Policy Research
51
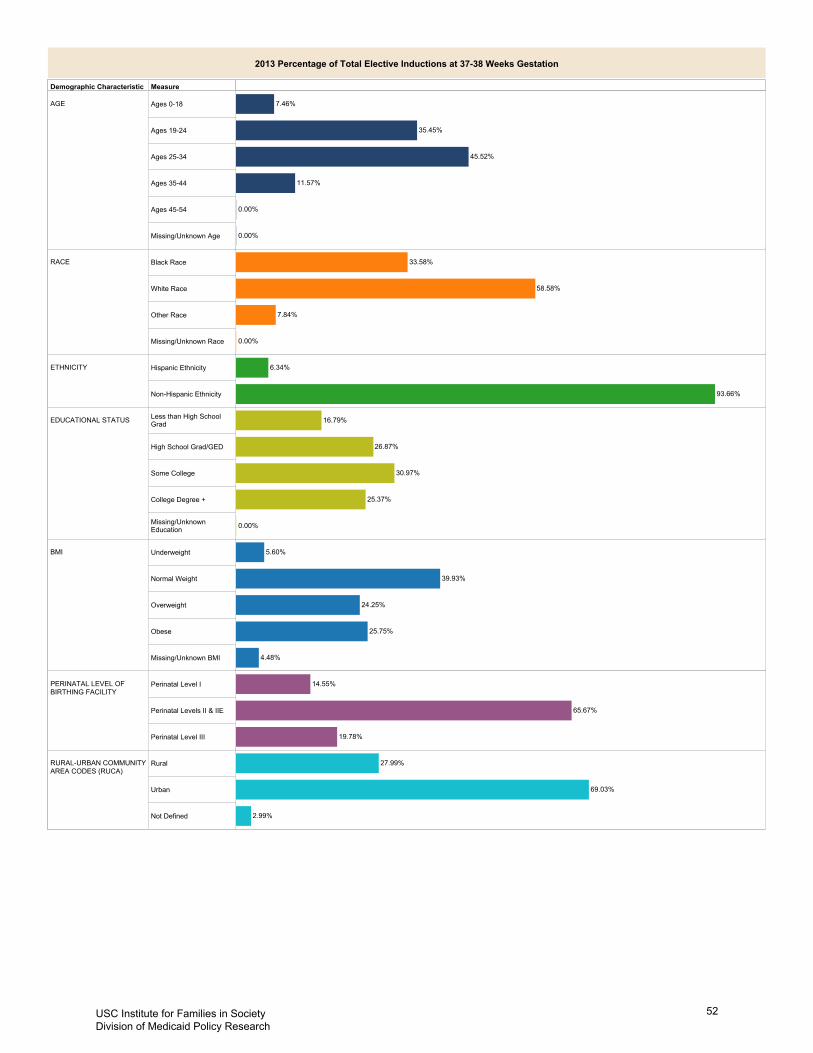
Demographic Characteristic Measure
AGE Ages 0-18
Ages 19-24
Ages 25-34
Ages 35-44
Ages 45-54
Missing/Unknown Age
RACE Black Race
White Race
Other Race
Missing/Unknown Race
ETHNICITY Hispanic Ethnicity
Non-Hispanic Ethnicity
EDUCATIONAL STATUS Less than High SchoolGrad
High School Grad/GED
Some College
College Degree +
Missing/UnknownEducation
BMI Underweight
Normal Weight
Overweight
Obese
Missing/Unknown BMI
PERINATAL LEVEL OFBIRTHING FACILITY
Perinatal Level I
Perinatal Levels II & IIE
Perinatal Level III
RURAL-URBAN COMMUNITYAREA CODES (RUCA)
Rural
Urban
Not Defined
35.45%
45.52%
11.57%
7.46%
0.00%
0.00%
33.58%
58.58%
7.84%
0.00%
93.66%
6.34%
16.79%
26.87%
30.97%
25.37%
0.00%
39.93%
24.25%
25.75%
5.60%
4.48%
14.55%
65.67%
19.78%
27.99%
69.03%
2.99%
2013 Percentage of Total Elective Inductions at 37-38 Weeks Gestation
USC Institute for Families in Society Division of Medicaid Policy Research
52
Total C-Sections at 37+ Weeks Gestation (with and without exclusions applied)
USC Institute for Families in Society Division of Medicaid Policy Research
53
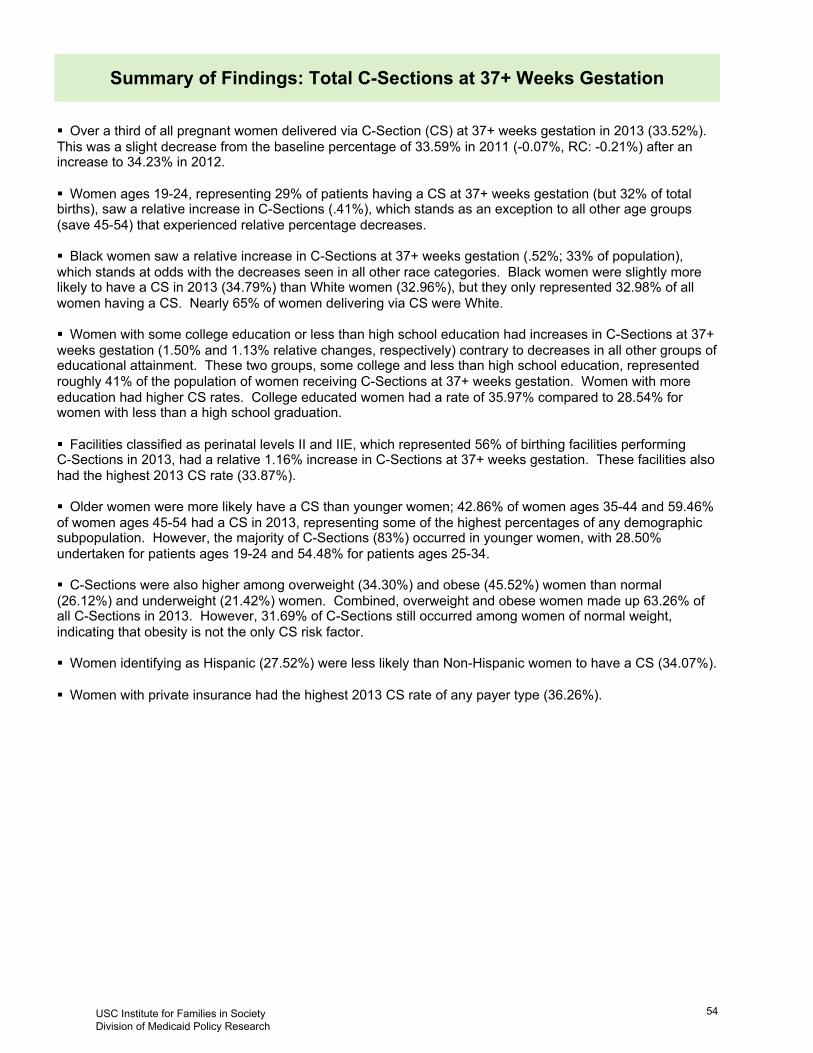
Summary of Findings: Total C-Sections at 37+ Weeks Gestation
§ Over a third of all pregnant women delivered via C-Section (CS) at 37+ weeks gestation in 2013 (33.52%).This was a slight decrease from the baseline percentage of 33.59% in 2011 (-0.07%, RC: -0.21%) after an increase to 34.23% in 2012. § Women ages 19-24, representing 29% of patients having a CS at 37+ weeks gestation (but 32% of totalbirths), saw a relative increase in C-Sections (.41%), which stands as an exception to all other age groups(save 45-54) that experienced relative percentage decreases. § Black women saw a relative increase in C-Sections at 37+ weeks gestation (.52%; 33% of population),which stands at odds with the decreases seen in all other race categories. Black women were slightly morelikely to have a CS in 2013 (34.79%) than White women (32.96%), but they only represented 32.98% of allwomen having a CS. Nearly 65% of women delivering via CS were White. § Women with some college education or less than high school education had increases in C-Sections at 37+weeks gestation (1.50% and 1.13% relative changes, respectively) contrary to decreases in all other groups ofeducational attainment. These two groups, some college and less than high school education, representedroughly 41% of the population of women receiving C-Sections at 37+ weeks gestation. Women with more education had higher CS rates. College educated women had a rate of 35.97% compared to 28.54% for women with less than a high school graduation. § Facilities classified as perinatal levels II and IIE, which represented 56% of birthing facilities performing C-Sections in 2013, had a relative 1.16% increase in C-Sections at 37+ weeks gestation. These facilities alsohad the highest 2013 CS rate (33.87%). § Older women were more likely have a CS than younger women; 42.86% of women ages 35-44 and 59.46%of women ages 45-54 had a CS in 2013, representing some of the highest percentages of any demographicsubpopulation. However, the majority of C-Sections (83%) occurred in younger women, with 28.50% undertaken for patients ages 19-24 and 54.48% for patients ages 25-34. § C-Sections were also higher among overweight (34.30%) and obese (45.52%) women than normal(26.12%) and underweight (21.42%) women. Combined, overweight and obese women made up 63.26% ofall C-Sections in 2013. However, 31.69% of C-Sections still occurred among women of normal weight, indicating that obesity is not the only CS risk factor. § Women identifying as Hispanic (27.52%) were less likely than Non-Hispanic women to have a CS (34.07%). § Women with private insurance had the highest 2013 CS rate of any payer type (36.26%).
USC Institute for Families in Society Division of Medicaid Policy Research
54

DemographicCharacteristic Measure
2011 %C-Sections37+
2012 %C-Sections37+
2013 %C-Sections37+
DifferenceBetween 2013and 2011(CS 37+)
RelativePercentageChange(CS 37+)
AGE
Ages 0-18
Ages 19-24
Ages 25-34
Ages 35-44
Ages 45-54
Missing/Unknown Age
RACE
Black Race
White Race
Other Race
Missing/Unknown Race
ETHNICITYHispanic Ethnicity
Non-Hispanic Ethnicity
EDUCATIONALSTATUS
Less than High School Grad
High School Grad/GED
Some College
College Degree +
Missing/Unknown Education
BMI
Underweight
Normal Weight
Overweight
Obese
Missing/Unknown BMI
PAYER
All Payers
Medicaid
Private Insurance
Self-Pay
PERINATALLEVEL OFBIRTHINGFACILITY
Perinatal Level I
Perinatal Level II & IIE
Perinatal Level III
RURAL-URBANCOMMUNITYAREA CODES(RUCA)
Rural
Urban
Not Defined
TOTAL STATE TOTAL
100.00%
4.92%
-5.99%
-0.25%
0.41%
-8.54%
50.00%
2.79%
-2.73%
-0.09%
0.12%
-1.84%
100.00%
59.46%
42.86%
35.30%
29.58%
19.70%
0.00%
44.44%
44.96%
36.13%
29.91%
23.03%
50.00%
56.67%
45.59%
35.39%
29.46%
21.54%
-52.63%
-1.68%
-0.45%
0.52%
-17.54%
-0.55%
-0.15%
0.18%
15.79%
32.28%
32.96%
34.79%
29.63%
33.60%
33.77%
35.22%
33.33%
32.83%
33.11%
34.61%
-0.09%
-3.20%
-0.03%
-0.91%
34.07%
27.52%
34.73%
29.03%
34.10%
28.43%
-22.19%
-3.72%
1.50%
-0.30%
1.13%
-6.80%
-1.39%
0.51%
-0.10%
0.32%
23.85%
35.97%
34.44%
32.83%
28.54%
30.22%
37.21%
34.37%
33.37%
30.20%
30.65%
37.36%
33.93%
32.93%
28.22%
-5.77%
1.00%
1.33%
-3.55%
-2.15%
-1.82%
0.45%
0.45%
-0.96%
-0.47%
29.70%
45.52%
34.30%
26.12%
21.42%
29.62%
46.29%
34.91%
27.47%
22.58%
31.52%
45.07%
33.85%
27.08%
21.89%
0.36%
-2.92%
0.87%
-0.21%
0.11%
-1.09%
0.28%
-0.07%
30.62%
36.26%
32.48%
33.52%
27.57%
37.93%
33.09%
34.24%
30.51%
37.35%
32.20%
33.59%
-0.39%
1.16%
-5.63%
-0.13%
0.39%
-1.94%
33.29%
33.87%
32.50%
34.46%
34.35%
33.10%
33.42%
33.48%
34.44%
-14.45%
0.69%
-2.15%
-5.01%
0.23%
-0.73%
29.66%
33.65%
33.29%
37.74%
34.53%
33.26%
34.67%
33.42%
34.02%
-0.21%-0.07%33.52%34.23%33.59%
2011-2013 Percentage of Total C-Sections at 37+ Weeks Gestation
USC Institute for Families in Society Division of Medicaid Policy Research
55
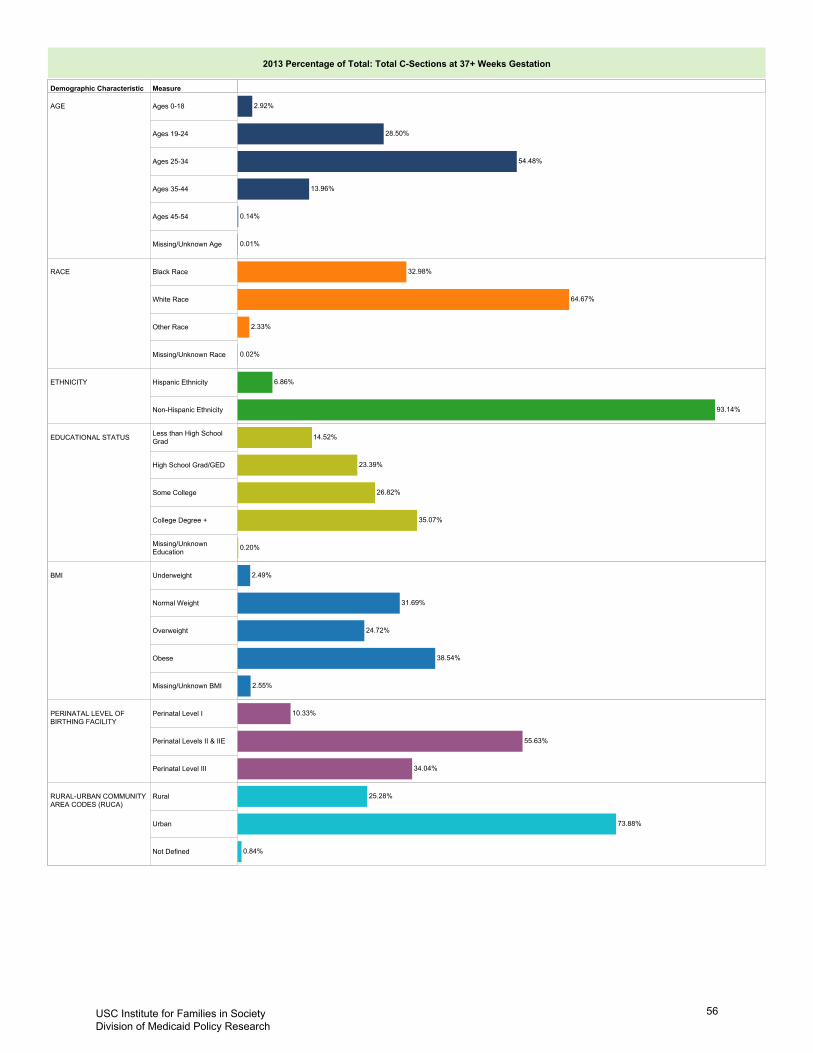
Demographic Characteristic Measure
AGE Ages 0-18
Ages 19-24
Ages 25-34
Ages 35-44
Ages 45-54
Missing/Unknown Age
RACE Black Race
White Race
Other Race
Missing/Unknown Race
ETHNICITY Hispanic Ethnicity
Non-Hispanic Ethnicity
EDUCATIONAL STATUS Less than High SchoolGrad
High School Grad/GED
Some College
College Degree +
Missing/UnknownEducation
BMI Underweight
Normal Weight
Overweight
Obese
Missing/Unknown BMI
PERINATAL LEVEL OFBIRTHING FACILITY
Perinatal Level I
Perinatal Levels II & IIE
Perinatal Level III
RURAL-URBAN COMMUNITYAREA CODES (RUCA)
Rural
Urban
Not Defined
28.50%
54.48%
13.96%
2.92%
0.14%
0.01%
32.98%
64.67%
2.33%
0.02%
93.14%
6.86%
14.52%
23.39%
26.82%
35.07%
0.20%
31.69%
24.72%
38.54%
2.49%
2.55%
10.33%
55.63%
34.04%
25.28%
73.88%
0.84%
2013 Percentage of Total: Total C-Sections at 37+ Weeks Gestation
USC Institute for Families in Society Division of Medicaid Policy Research
56
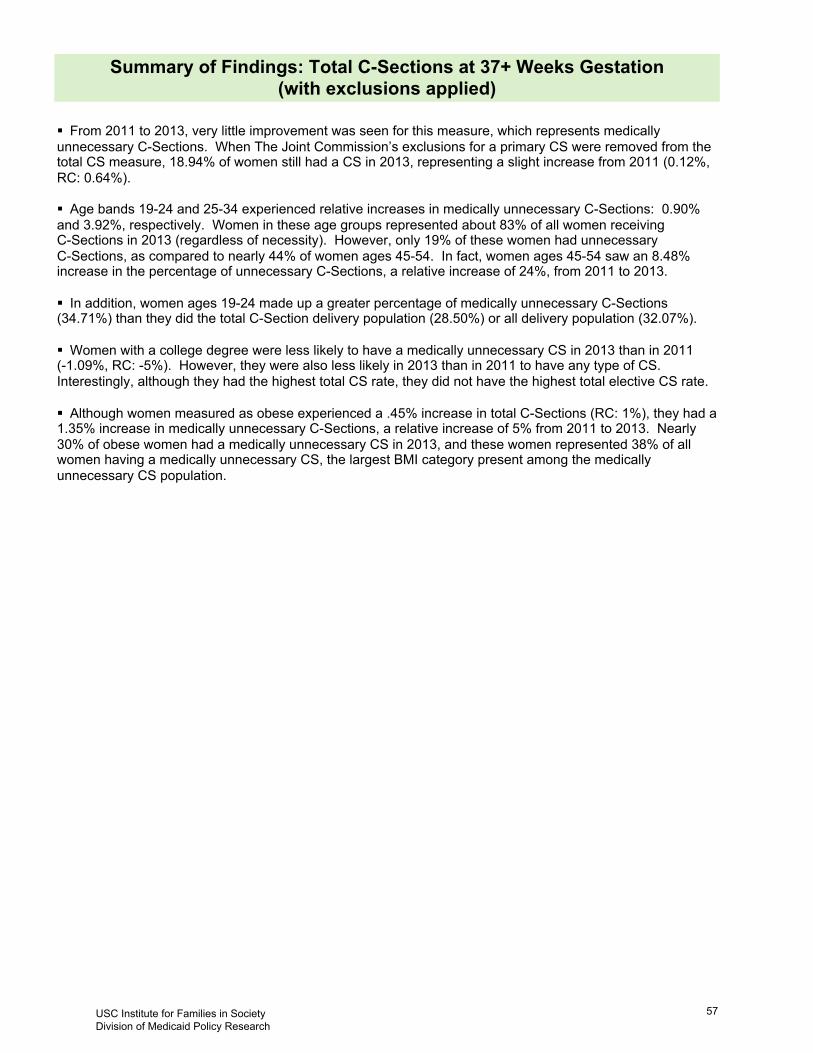
Summary of Findings: Total C-Sections at 37+ Weeks Gestation (with exclusions applied)
§ From 2011 to 2013, very little improvement was seen for this measure, which represents medically unnecessary C-Sections. When The Joint Commission’s exclusions for a primary CS were removed from thetotal CS measure, 18.94% of women still had a CS in 2013, representing a slight increase from 2011 (0.12%,RC: 0.64%). § Age bands 19-24 and 25-34 experienced relative increases in medically unnecessary C-Sections: 0.90%and 3.92%, respectively. Women in these age groups represented about 83% of all women receiving C-Sections in 2013 (regardless of necessity). However, only 19% of these women had unnecessary C-Sections, as compared to nearly 44% of women ages 45-54. In fact, women ages 45-54 saw an 8.48% increase in the percentage of unnecessary C-Sections, a relative increase of 24%, from 2011 to 2013. § In addition, women ages 19-24 made up a greater percentage of medically unnecessary C-Sections(34.71%) than they did the total C-Section delivery population (28.50%) or all delivery population (32.07%). § Women with a college degree were less likely to have a medically unnecessary CS in 2013 than in 2011 (-1.09%, RC: -5%). However, they were also less likely in 2013 than in 2011 to have any type of CS. Interestingly, although they had the highest total CS rate, they did not have the highest total elective CS rate. § Although women measured as obese experienced a .45% increase in total C-Sections (RC: 1%), they had a1.35% increase in medically unnecessary C-Sections, a relative increase of 5% from 2011 to 2013. Nearly30% of obese women had a medically unnecessary CS in 2013, and these women represented 38% of allwomen having a medically unnecessary CS, the largest BMI category present among the medically unnecessary CS population.
USC Institute for Families in Society Division of Medicaid Policy Research
57

DemographicCharacteristic Measure
2011 %C-Sections37+ Excl.
2012 %C-Sections37+ Excl.
2013 %C-Sections37+ Excl.
DifferenceBetween 2013and 2011
(CS 37+ Excl.)
RelativePercentageChange
(CS 37+ Excl.)
AGE
Ages 0-18
Ages 19-24
Ages 25-34
Ages 35-44
Ages 45-54
Missing/Unknown Age
RACE
Black Race
White Race
Other Race
Missing/Unknown Race
ETHNICITYHispanic Ethnicity
Non-Hispanic Ethnicity
EDUCATIONALSTATUS
Less than High School Grad
High School Grad/GED
Some College
College Degree +
Missing/Unknown Education
BMI
Underweight
Normal Weight
Overweight
Obese
Missing/Unknown BMI
PAYER
All Payers
Medicaid
Private Insurance
Self-Pay
PERINATALLEVEL OFBIRTHINGFACILITY
Perinatal Level I
Perinatal Level II & IIE
Perinatal Level III
RURAL-URBANCOMMUNITYAREA CODES(RUCA)
Rural
Urban
Not Defined
TOTAL STATE TOTAL
100.00%
24.23%
-9.84%
3.92%
0.90%
-8.31%
50.00%
8.48%
-2.39%
0.70%
0.17%
-1.53%
100.00%
43.48%
21.90%
18.56%
18.97%
16.88%
0.00%
25.00%
24.07%
19.15%
19.46%
19.57%
50.00%
35.00%
24.29%
17.86%
18.80%
18.41%
-100.00%
1.90%
1.22%
-0.10%
-25.00%
0.36%
0.22%
-0.02%
0.00%
19.31%
18.23%
20.42%
5.00%
19.25%
19.01%
21.29%
25.00%
18.95%
18.01%
20.44%
0.41%
0.46%
0.08%
0.06%
19.47%
13.10%
20.22%
14.83%
19.39%
13.04%
-44.11%
-5.12%
6.03%
-0.53%
0.62%
-8.27%
-1.09%
1.17%
-0.10%
0.09%
10.48%
20.18%
20.58%
18.70%
14.65%
19.30%
21.65%
20.61%
19.01%
16.45%
18.75%
21.27%
19.41%
18.80%
14.56%
-2.71%
5.08%
-0.05%
-4.24%
-9.90%
-0.46%
1.35%
-0.01%
-0.62%
-1.22%
16.53%
27.94%
19.68%
14.01%
11.10%
15.63%
28.85%
20.13%
15.42%
12.50%
16.99%
26.59%
19.69%
14.63%
12.32%
-4.96%
-0.72%
1.10%
0.64%
-0.77%
-0.15%
0.20%
0.12%
14.75%
20.61%
18.44%
18.94%
14.59%
21.99%
19.20%
19.75%
15.52%
20.76%
18.24%
18.82%
0.87%
1.35%
-5.03%
0.16%
0.26%
-0.91%
18.60%
19.49%
17.17%
20.10%
19.99%
17.74%
18.44%
19.23%
18.08%
-1.89%
1.05%
-0.55%
-0.37%
0.20%
-0.10%
19.20%
19.19%
18.21%
24.47%
20.09%
18.60%
19.57%
18.99%
18.31%
0.64%0.12%18.94%19.75%18.82%
2011-2013 Percentage of Total C-Sections at 37+ Weeks Gestation
(with exclusions applied)
USC Institute for Families in Society Division of Medicaid Policy Research
58
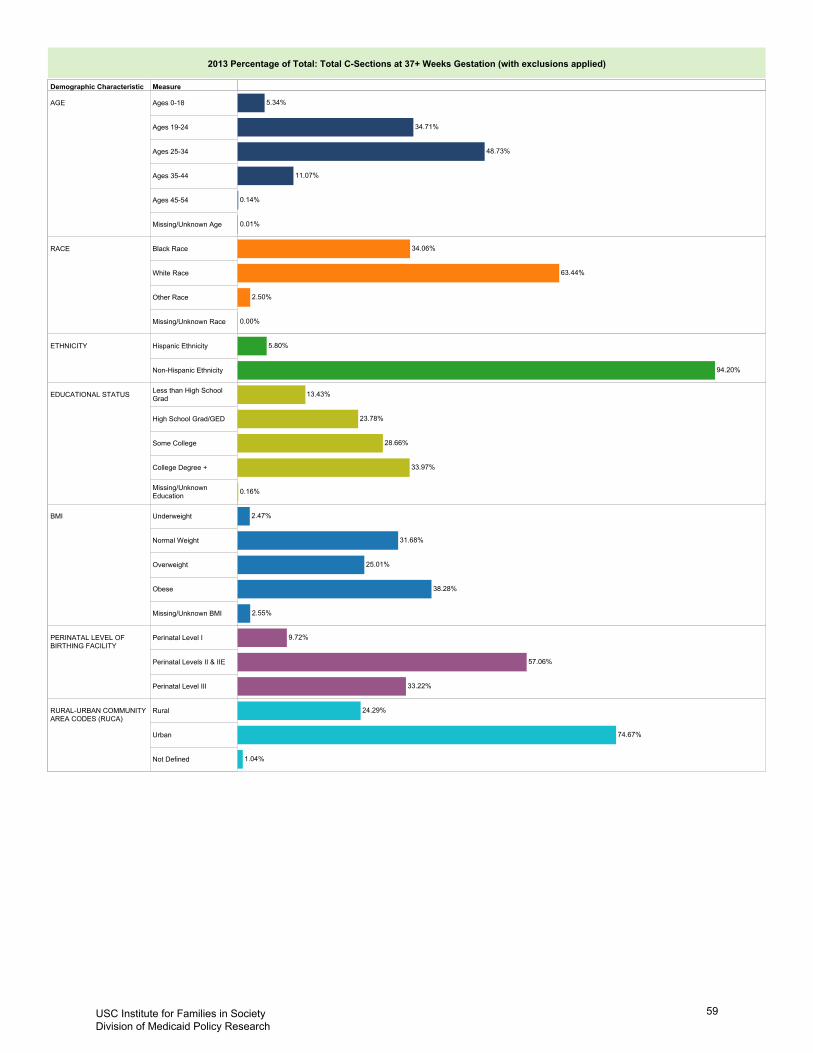
Demographic Characteristic Measure
AGE Ages 0-18
Ages 19-24
Ages 25-34
Ages 35-44
Ages 45-54
Missing/Unknown Age
RACE Black Race
White Race
Other Race
Missing/Unknown Race
ETHNICITY Hispanic Ethnicity
Non-Hispanic Ethnicity
EDUCATIONAL STATUS Less than High SchoolGrad
High School Grad/GED
Some College
College Degree +
Missing/UnknownEducation
BMI Underweight
Normal Weight
Overweight
Obese
Missing/Unknown BMI
PERINATAL LEVEL OFBIRTHING FACILITY
Perinatal Level I
Perinatal Levels II & IIE
Perinatal Level III
RURAL-URBAN COMMUNITYAREA CODES (RUCA)
Rural
Urban
Not Defined
34.71%
48.73%
11.07%
5.34%
0.14%
0.01%
34.06%
63.44%
2.50%
0.00%
94.20%
5.80%
13.43%
23.78%
28.66%
33.97%
0.16%
31.68%
25.01%
38.28%
2.47%
2.55%
57.06%
33.22%
9.72%
24.29%
74.67%
1.04%
2013 Percentage of Total: Total C-Sections at 37+ Weeks Gestation (with exclusions applied)
USC Institute for Families in Society Division of Medicaid Policy Research
59
Total Primary C-Sections at 37+ Weeks Gestation (with and without exclusions applied)
USC Institute for Families in Society Division of Medicaid Policy Research
60
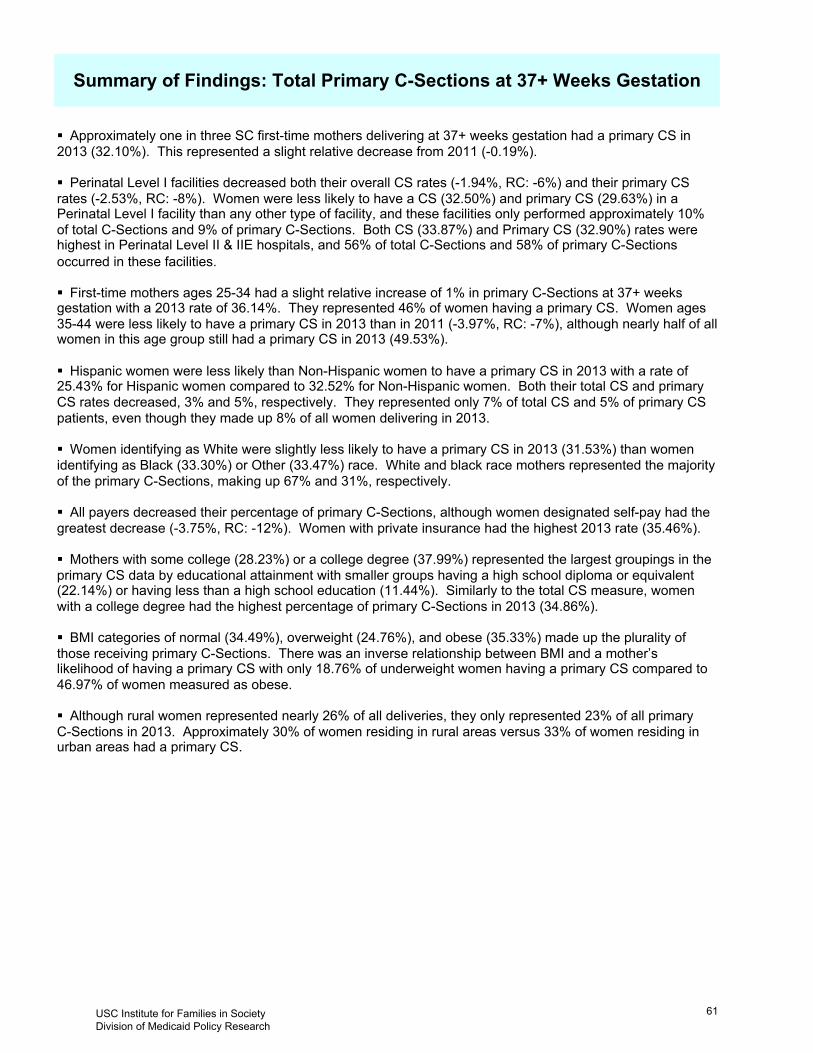
Summary of Findings: Total Primary C-Sections at 37+ Weeks Gestation
§ Approximately one in three SC first-time mothers delivering at 37+ weeks gestation had a primary CS in2013 (32.10%). This represented a slight relative decrease from 2011 (-0.19%). § Perinatal Level I facilities decreased both their overall CS rates (-1.94%, RC: -6%) and their primary CSrates (-2.53%, RC: -8%). Women were less likely to have a CS (32.50%) and primary CS (29.63%) in a Perinatal Level I facility than any other type of facility, and these facilities only performed approximately 10%of total C-Sections and 9% of primary C-Sections. Both CS (33.87%) and Primary CS (32.90%) rates werehighest in Perinatal Level II & IIE hospitals, and 56% of total C-Sections and 58% of primary C-Sections occurred in these facilities. § First-time mothers ages 25-34 had a slight relative increase of 1% in primary C-Sections at 37+ weeks gestation with a 2013 rate of 36.14%. They represented 46% of women having a primary CS. Women ages35-44 were less likely to have a primary CS in 2013 than in 2011 (-3.97%, RC: -7%), although nearly half of allwomen in this age group still had a primary CS in 2013 (49.53%). § Hispanic women were less likely than Non-Hispanic women to have a primary CS in 2013 with a rate of25.43% for Hispanic women compared to 32.52% for Non-Hispanic women. Both their total CS and primaryCS rates decreased, 3% and 5%, respectively. They represented only 7% of total CS and 5% of primary CSpatients, even though they made up 8% of all women delivering in 2013. § Women identifying as White were slightly less likely to have a primary CS in 2013 (31.53%) than womenidentifying as Black (33.30%) or Other (33.47%) race. White and black race mothers represented the majorityof the primary C-Sections, making up 67% and 31%, respectively. § All payers decreased their percentage of primary C-Sections, although women designated self-pay had thegreatest decrease (-3.75%, RC: -12%). Women with private insurance had the highest 2013 rate (35.46%). § Mothers with some college (28.23%) or a college degree (37.99%) represented the largest groupings in theprimary CS data by educational attainment with smaller groups having a high school diploma or equivalent(22.14%) or having less than a high school education (11.44%). Similarly to the total CS measure, womenwith a college degree had the highest percentage of primary C-Sections in 2013 (34.86%). § BMI categories of normal (34.49%), overweight (24.76%), and obese (35.33%) made up the plurality ofthose receiving primary C-Sections. There was an inverse relationship between BMI and a mother’s likelihood of having a primary CS with only 18.76% of underweight women having a primary CS compared to46.97% of women measured as obese. § Although rural women represented nearly 26% of all deliveries, they only represented 23% of all primary C-Sections in 2013. Approximately 30% of women residing in rural areas versus 33% of women residing in urban areas had a primary CS.
USC Institute for Families in Society Division of Medicaid Policy Research
61
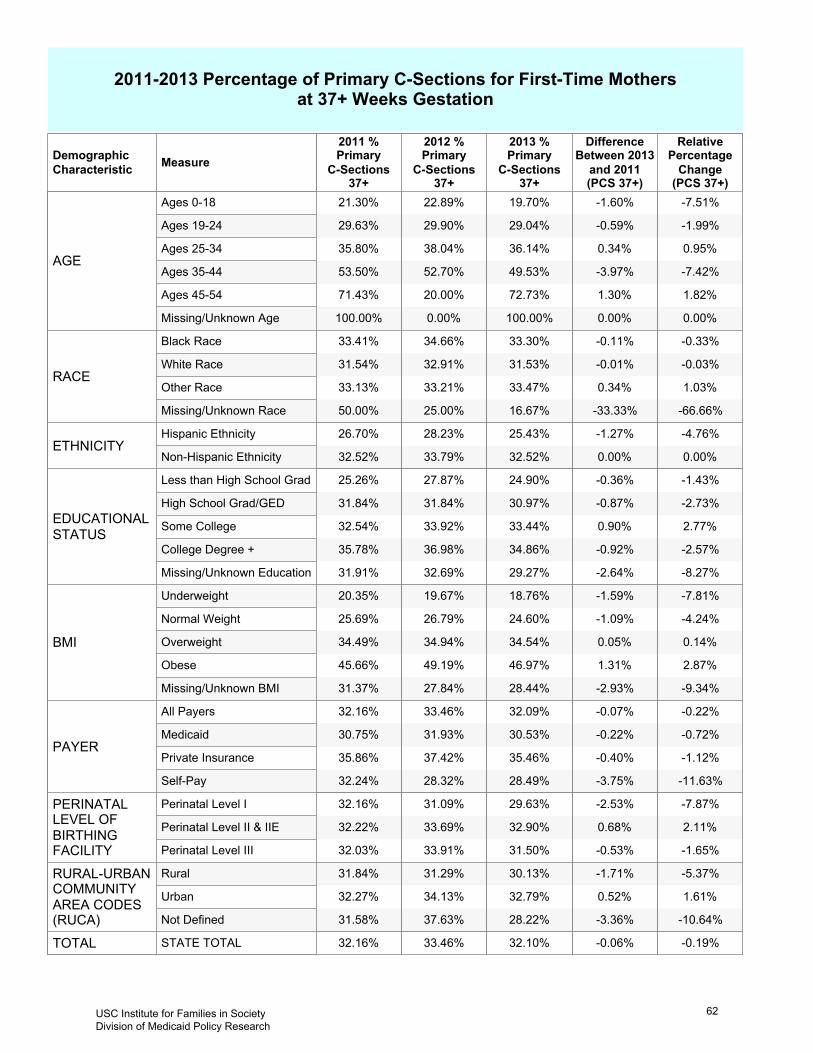
DemographicCharacteristic Measure
2011 %PrimaryC-Sections37+
2012 %PrimaryC-Sections37+
2013 %PrimaryC-Sections37+
DifferenceBetween 2013and 2011(PCS 37+)
RelativePercentageChange(PCS 37+)
AGE
Ages 0-18
Ages 19-24
Ages 25-34
Ages 35-44
Ages 45-54
Missing/Unknown Age
RACE
Black Race
White Race
Other Race
Missing/Unknown Race
ETHNICITYHispanic Ethnicity
Non-Hispanic Ethnicity
EDUCATIONALSTATUS
Less than High School Grad
High School Grad/GED
Some College
College Degree +
Missing/Unknown Education
BMI
Underweight
Normal Weight
Overweight
Obese
Missing/Unknown BMI
PAYER
All Payers
Medicaid
Private Insurance
Self-Pay
PERINATALLEVEL OFBIRTHINGFACILITY
Perinatal Level I
Perinatal Level II & IIE
Perinatal Level III
RURAL-URBANCOMMUNITYAREA CODES(RUCA)
Rural
Urban
Not Defined
TOTAL STATE TOTAL
0.00%
1.82%
-7.42%
0.95%
-1.99%
-7.51%
0.00%
1.30%
-3.97%
0.34%
-0.59%
-1.60%
100.00%
72.73%
49.53%
36.14%
29.04%
19.70%
0.00%
20.00%
52.70%
38.04%
29.90%
22.89%
100.00%
71.43%
53.50%
35.80%
29.63%
21.30%
-66.66%
1.03%
-0.03%
-0.33%
-33.33%
0.34%
-0.01%
-0.11%
16.67%
33.47%
31.53%
33.30%
25.00%
33.21%
32.91%
34.66%
50.00%
33.13%
31.54%
33.41%
0.00%
-4.76%
0.00%
-1.27%
32.52%
25.43%
33.79%
28.23%
32.52%
26.70%
-8.27%
-2.57%
2.77%
-2.73%
-1.43%
-2.64%
-0.92%
0.90%
-0.87%
-0.36%
29.27%
34.86%
33.44%
30.97%
24.90%
32.69%
36.98%
33.92%
31.84%
27.87%
31.91%
35.78%
32.54%
31.84%
25.26%
-9.34%
2.87%
0.14%
-4.24%
-7.81%
-2.93%
1.31%
0.05%
-1.09%
-1.59%
28.44%
46.97%
34.54%
24.60%
18.76%
27.84%
49.19%
34.94%
26.79%
19.67%
31.37%
45.66%
34.49%
25.69%
20.35%
-11.63%
-1.12%
-0.72%
-0.22%
-3.75%
-0.40%
-0.22%
-0.07%
28.49%
35.46%
30.53%
32.09%
28.32%
37.42%
31.93%
33.46%
32.24%
35.86%
30.75%
32.16%
-1.65%
2.11%
-7.87%
-0.53%
0.68%
-2.53%
31.50%
32.90%
29.63%
33.91%
33.69%
31.09%
32.03%
32.22%
32.16%
-10.64%
1.61%
-5.37%
-3.36%
0.52%
-1.71%
28.22%
32.79%
30.13%
37.63%
34.13%
31.29%
31.58%
32.27%
31.84%
-0.19%-0.06%32.10%33.46%32.16%
2011-2013 Percentage of Primary C-Sections for First-Time Mothers
at 37+ Weeks Gestation
USC Institute for Families in Society Division of Medicaid Policy Research
62
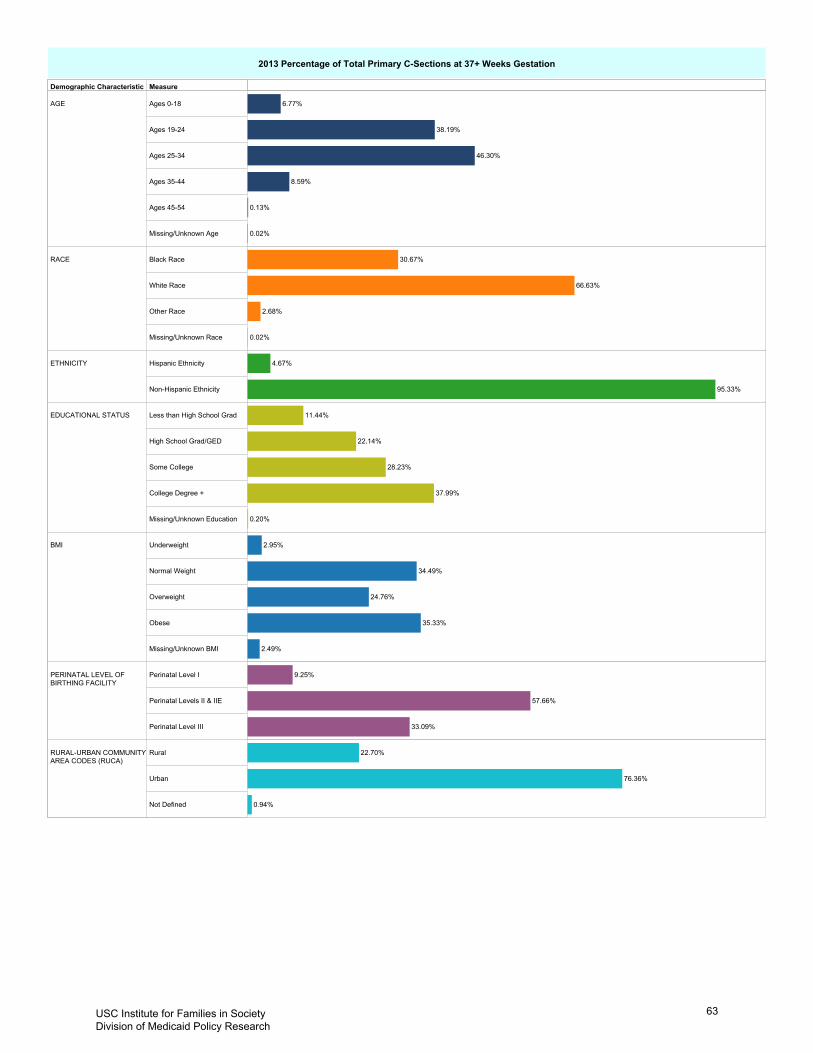
Demographic Characteristic Measure
AGE Ages 0-18
Ages 19-24
Ages 25-34
Ages 35-44
Ages 45-54
Missing/Unknown Age
RACE Black Race
White Race
Other Race
Missing/Unknown Race
ETHNICITY Hispanic Ethnicity
Non-Hispanic Ethnicity
EDUCATIONAL STATUS Less than High School Grad
High School Grad/GED
Some College
College Degree +
Missing/Unknown Education
BMI Underweight
Normal Weight
Overweight
Obese
Missing/Unknown BMI
PERINATAL LEVEL OFBIRTHING FACILITY
Perinatal Level I
Perinatal Levels II & IIE
Perinatal Level III
RURAL-URBAN COMMUNITYAREA CODES (RUCA)
Rural
Urban
Not Defined
38.19%
46.30%
6.77%
8.59%
0.13%
0.02%
30.67%
66.63%
2.68%
0.02%
95.33%
4.67%
11.44%
22.14%
28.23%
37.99%
0.20%
34.49%
24.76%
35.33%
2.95%
2.49%
57.66%
33.09%
9.25%
22.70%
76.36%
0.94%
2013 Percentage of Total Primary C-Sections at 37+ Weeks Gestation
USC Institute for Families in Society Division of Medicaid Policy Research
63

Summary of Findings: Total Primary C-Sections at 37+ Weeks Gestation(with exclusions applied)
§ When applying exclusions to the total CS rate, the rate dropped from 33.52% to 18.94%, a difference ofnearly 15%. However, when the same exclusions were applied to the primary CS rate, the difference was only 3.13% (with a decrease from 32.10% to 28.97%). § Women over 35 were more likely to have a medically unnecessary primary CS in 2013 than other agegroups (44.42% of women ages 35-44 and 71.43% of women ages 45-54). The rate for women ages 35-44did, however, decrease 3.99%, a relative decrease of nearly 8%. § Nevertheless, younger women in the age bands 19-24 and 25-34 formed the majority of medically unnecessary primary C-Sections at 37+ weeks gestation: 39.76% and 45.01%, respectively. § In 2013, Black women were more likely to have a medically unnecessary primary CS (31.68%) than womenidentifying as White (27.69%) or Other (30.99%) race. Women in the Other race group had a 4% relative increase in medically unnecessary primary C-Sections. § Black women represented nearly a third of mothers receiving medically unnecessary CS, with White mothers making up the majority (66%). These percentages matched the overall profile of births in 2013. § Ninety-five percent of medically unnecessary primary C-Sections were performed on Non-Hispanic mothersin 2013. Only 22.57% of mothers identifying as Hispanic had an elective primary CS compared to 29.37% ofNon-Hispanic mothers. § Women with more education formed the plurality of first-time mothers having medically unnecessary C-Sections in 2013; 36% had a college degree. § Again, most mothers experiencing a medically unnecessary primary C-Section were in the normal weight(33%), overweight (25%), or obese (37%) BMI categories in 2013. § Most medically unnecessary primary C-Sections in 2013 were performed in Perinatal Levels II & IIE facilities(57%) followed by Level II (33%) and Level I (9%). Contrasted, nearly 27% of women served in Perinatal Level I facilities and 30% of women served in Perinatal Levels II & IIE facilities had an elective primary CS. § About 76% of women having a medically unnecessary primary CS in 2013 were coded urban, and 23%were coded rural. Urban women (29.41%) were more likely than rural women (27.77%) to have an elective primary CS. § Compared to all other payer categories, women with private insurance in 2013 were most likely to have botha medically necessary (35.46%) and unnecessary (31.33%) primary CS.
USC Institute for Families in Society Division of Medicaid Policy Research
64

DemographicCharacteristic Measure
2011 %PrimaryC-Sections37+ Excl.
2012 %PrimaryC-Sections37+ Excl.
2013 %PrimaryC-Sections37+ Excl.
DifferenceBetween2013 and2011 (PCS37+ Excl.)
RelativePercentageChange(PCS 37+Excl.)
AGE
Ages 0-18
Ages 19-24
Ages 25-34
Ages 35-44
Ages 45-54
Missing/Unknown Age
RACE
Black Race
White Race
Other Race
Missing/Unknown Race
ETHNICITYHispanic Ethnicity
Non-Hispanic Ethnicity
EDUCATIONALSTATUS
Less than High School Grad
High School Grad/GED
Some College
College Degree +
Missing/Unknown Education
BMI
Underweight
Normal Weight
Overweight
Obese
Missing/Unknown BMI
PAYER
All Payers
Medicaid
Private Insurance
Self-Pay
PERINATALLEVEL OFBIRTHINGFACILITY
Perinatal Level I
Perinatal Level II & IIE
Perinatal Level III
RURAL-URBANCOMMUNITYAREA CODES(RUCA)
Rural
Urban
Not Defined
TOTAL STATE TOTAL
0.00%
0.00%
-8.24%
0.81%
-2.54%
-9.61%
0.00%
0.00%
-3.99%
0.26%
-0.70%
-1.93%
100.00%
71.43%
44.42%
32.18%
26.86%
18.15%
0.00%
33.33%
47.38%
34.21%
27.83%
20.95%
100.00%
71.43%
48.41%
31.92%
27.56%
20.08%
-100.00%
4.41%
-1.25%
0.06%
-50.00%
1.31%
-0.35%
0.02%
0.00%
30.99%
27.69%
31.68%
25.00%
28.96%
29.24%
33.02%
50.00%
29.68%
28.04%
31.66%
-0.51%
-8.21%
-0.15%
-2.02%
29.37%
22.57%
30.76%
25.16%
29.52%
24.59%
-31.96%
-3.73%
3.94%
-3.66%
-3.00%
-9.13%
-1.19%
1.16%
-1.08%
-0.71%
19.44%
30.69%
30.62%
28.45%
22.97%
30.00%
32.69%
31.41%
29.51%
25.71%
28.57%
31.88%
29.46%
29.53%
23.68%
-8.85%
2.91%
-1.57%
-5.35%
-13.86%
-2.51%
1.26%
-0.50%
-1.19%
-2.46%
25.86%
44.57%
31.40%
21.05%
15.29%
25.58%
46.69%
32.00%
23.42%
16.72%
28.37%
43.31%
31.90%
22.24%
17.75%
-8.84%
-0.73%
-2.27%
-0.86%
-2.48%
-0.23%
-0.65%
-0.25%
25.58%
31.33%
27.94%
28.96%
25.16%
33.30%
29.56%
30.42%
28.06%
31.56%
28.59%
29.21%
-1.60%
1.26%
-9.46%
-0.46%
0.37%
-2.80%
28.35%
29.74%
26.79%
30.81%
30.60%
28.44%
28.81%
29.37%
29.59%
-14.62%
0.58%
-4.60%
-4.37%
0.17%
-1.34%
25.52%
29.41%
27.77%
33.73%
30.91%
28.84%
29.89%
29.24%
29.11%
-0.82%-0.24%28.97%30.42%29.21%
2011-2013 Percentage of Primary C-Sections for First-Time Mothers
at 37+ Weeks Gestation (with exclusions applied)
USC Institute for Families in Society Division of Medicaid Policy Research
65

Demographic Characteristic Measure
AGE Ages 0-18
Ages 19-24
Ages 25-34
Ages 35-44
Ages 45-54
Missing/Unknown Age
RACE Black Race
White Race
Other Race
Missing/Unknown Race
ETHNICITY Hispanic Ethnicity
Non-Hispanic Ethnicity
EDUCATIONAL STATUS Less than High SchoolGrad
High School Grad/GED
Some College
College Degree +
Missing/UnknownEducation
BMI Underweight
Normal Weight
Overweight
Obese
Missing/Unknown BMI
PERINATAL LEVEL OFBIRTHING FACILITY
Perinatal Level I
Perinatal Levels II & IIE
Perinatal Level III
RURAL-URBAN COMMUNITYAREA CODES (RUCA)
Rural
Urban
Not Defined
39.76%
45.01%
7.09%
8.03%
0.10%
0.02%
32.94%
64.30%
2.76%
0.00%
95.36%
4.64%
11.89%
22.76%
28.81%
36.41%
0.14%
32.69%
24.95%
37.21%
2.64%
2.51%
57.40%
33.22%
9.38%
23.27%
75.77%
0.96%
2013 Percentage of Total Primary C-Sections at 37+ Weeks Gestation (with exclusions applied)
USC Institute for Families in Society Division of Medicaid Policy Research
66

Total Primary C-Sections at 39-40 Weeks Gestation (with and without exclusions applied)
USC Institute for Families in Society Division of Medicaid Policy Research
67
Summary of Findings: Total Primary C-Sections at 39-40 Weeks Gestation
§ The 2013 percentage of primary CS for first-time mothers at 39-40 weeks was similar to the percentage at37+ weeks (32.17% and 32.10%, respectively). The rate increased only .02% (RC: 0.06%). In fact, results forthis measure mirrored the findings for 37+ weeks primary C-Sections for most demographic characteristics. § When comparing different payers, women categorized as self-pay were least likely to have a primary CS at39-40 weeks (27.01%) in 2013 and saw the greatest improvement in this measure with a relative decrease of23%. This exceeded the improvement of 12% for primary CS at 37+ weeks. § CS rates among Hispanic women have decreased for all CS categories. They experienced a relative decrease of 11% for primary CS at 39-40 weeks. They also represented only 4.50% of all primary CS at 39-40 weeks, even though they comprised 8.17% of all births. § Women ages 0-18 (19.76%) and women categorized as underweight (19.93%) were least likely to have aprimary CS at 39-40 weeks gestation, as well as at 37+ weeks gestation (19.70% and 21.42%, respectively).These findings are consistent with higher CS percentages among mothers of advanced maternal age andobese mothers, as described previously.
USC Institute for Families in Society Division of Medicaid Policy Research
68

DemographicCharacteristic Measure
2011 %PrimaryC-Sections39-40
2012 %PrimaryC-Sections39-40
2013 %PrimaryC-Sections39-40
DifferenceBetween2013 and2011 (PCS39-40)
RelativePercentageChange(PCS 39-40)
AGE
Ages 0-18
Ages 19-24
Ages 25-34
Ages 35-44
Ages 45-54
Missing/Unknown Age
RACE
Black Race
White Race
Other Race
Missing/Unknown Race
ETHNICITYHispanic Ethnicity
Non-Hispanic Ethnicity
EDUCATIONALSTATUS
Less than High School Grad
High School Grad/GED
Some College
College Degree +
Missing/Unknown Education
BMI
Underweight
Normal Weight
Overweight
Obese
Missing/Unknown BMI
PAYER
All Payers
Medicaid
Private Insurance
Self-Pay
PERINATALLEVEL OFBIRTHINGFACILITY
Perinatal Level I
Perinatal Level II & IIE
Perinatal Level III
RURAL-URBANCOMMUNITYAREA CODES(RUCA)
Rural
Urban
Not Defined
TOTAL STATE TOTAL
-100.00%
0.00%
-5.99%
0.00%
-0.37%
-9.98%
-100.00%
0.00%
-3.25%
0.00%
-0.11%
-2.19%
0.00%
80.00%
51.00%
35.62%
29.53%
19.76%
0.00%
0.00%
51.91%
37.21%
30.30%
23.38%
100.00%
80.00%
54.25%
35.62%
29.64%
21.95%
-100.00%
-0.93%
1.05%
-1.71%
-40.00%
-0.31%
0.33%
-0.58%
0.00%
33.02%
31.68%
33.29%
25.00%
32.79%
32.17%
35.81%
40.00%
33.33%
31.35%
33.87%
0.62%
-10.83%
0.20%
-2.93%
32.68%
24.12%
33.70%
26.19%
32.48%
27.05%
-24.64%
-0.77%
0.85%
-1.61%
-2.14%
-9.54%
-0.27%
0.28%
-0.51%
-0.55%
29.17%
34.99%
33.16%
31.12%
25.15%
35.14%
36.34%
33.46%
32.53%
27.60%
38.71%
35.26%
32.88%
31.63%
25.70%
-8.07%
0.56%
0.00%
-1.75%
-1.73%
-2.34%
0.26%
0.00%
-0.44%
-0.35%
26.67%
46.43%
35.40%
24.76%
19.93%
26.28%
49.34%
35.33%
26.42%
18.38%
29.01%
46.17%
35.40%
25.20%
20.28%
-22.92%
-0.34%
-1.10%
0.03%
-8.03%
-0.12%
-0.34%
0.01%
27.01%
35.47%
30.43%
32.16%
24.27%
36.49%
32.30%
33.28%
35.04%
35.59%
30.77%
32.15%
-5.03%
3.88%
-4.66%
-1.63%
1.24%
-1.51%
30.75%
33.20%
30.90%
33.07%
33.77%
31.39%
32.38%
31.96%
32.41%
2.75%
1.93%
-5.61%
0.76%
0.62%
-1.82%
28.35%
32.72%
30.62%
39.20%
33.62%
32.01%
27.59%
32.10%
32.44%
0.06%0.02%32.17%33.27%32.15%
2011-2013 Percentage of Primary C-Sections for First-Time Mothers
at 39-40 Weeks Gestation
USC Institute for Families in Society Division of Medicaid Policy Research
69
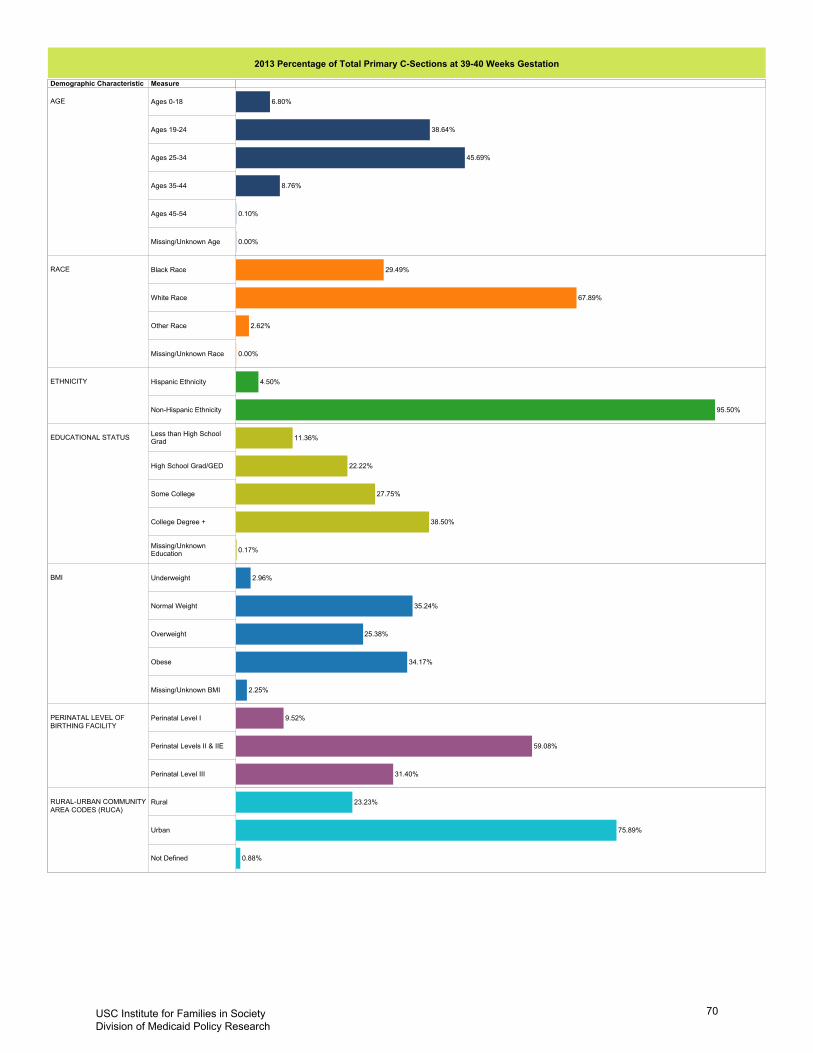
Demographic Characteristic Measure
AGE Ages 0-18
Ages 19-24
Ages 25-34
Ages 35-44
Ages 45-54
Missing/Unknown Age
RACE Black Race
White Race
Other Race
Missing/Unknown Race
ETHNICITY Hispanic Ethnicity
Non-Hispanic Ethnicity
EDUCATIONAL STATUS Less than High SchoolGrad
High School Grad/GED
Some College
College Degree +
Missing/UnknownEducation
BMI Underweight
Normal Weight
Overweight
Obese
Missing/Unknown BMI
PERINATAL LEVEL OFBIRTHING FACILITY
Perinatal Level I
Perinatal Levels II & IIE
Perinatal Level III
RURAL-URBAN COMMUNITYAREA CODES (RUCA)
Rural
Urban
Not Defined
38.64%
45.69%
6.80%
8.76%
0.10%
0.00%
29.49%
67.89%
2.62%
0.00%
95.50%
4.50%
11.36%
22.22%
27.75%
38.50%
0.17%
35.24%
25.38%
34.17%
2.96%
2.25%
59.08%
31.40%
9.52%
23.23%
75.89%
0.88%
2013 Percentage of Total Primary C-Sections at 39-40 Weeks Gestation
USC Institute for Families in Society Division of Medicaid Policy Research
70

Summary of Findings: Total Primary C-Sections at 39-40 Weeks Gestation(with exclusions applied)
§ There was a slight decrease in this measure for the state as a whole from 29.68% in 2011 to 29.32% in2013 (-0.36%, RC: -1.21%). § The percentage of medically unnecessary primary CS at 39-40 weeks decreased for both Perinatal Level I(-1.54%, RC: -5%) and III (-2.04%, RC: -7%) hospitals, but increased slightly for Perinatal Level II & IIE hospitals (0.81%, RC: +3%). § There was a relative decrease of 12% in the percentage of women identified as overweight having a medically unnecessary primary CS at 39-40 weeks (as compared to only a 2% decrease for all primary CS at39-40 weeks). Likewise, underweight women only represented 2.68% of all women included in this measure,and like all other CS measures, they had the lowest 2013 rate (16.58% for this measure). § Nearly 67% of mothers ages 45-54 had an elective primary CS at 39-40 weeks. However, caution shouldbe used when interpreting these data, as there were only 3 mothers in this age group that met measure criteria. § Mothers under the age of 35 (92%), identifying as White (66%), Non-Hispanic ethnicity (95%), served at aPerinatal Level II & IIE facility (59%), and who resided in urban areas (75%) made up the profile of the majority of mothers having medically unnecessary primary C-Sections at 39-40 weeks in 2013. These percentages were slightly higher than the general birth profile for 2013.
USC Institute for Families in Society Division of Medicaid Policy Research
71

DemographicCharacteristic Measure
2011 %PrimaryC-Sections39-40 Excl.
2012 %PrimaryC-Sections39-40 Excl.
2013 %PrimaryC-Sections39-40 Excl.
DifferenceBetween 2013and 2011(PCS 39-40Excl.)
RelativePercentageChange(PCS 39-40Excl.)
AGE
Ages 0-18
Ages 19-24
Ages 25-34
Ages 35-44
Ages 45-54
Missing/Unknown Age
RACE
Black Race
White Race
Other Race
Missing/Unknown Race
ETHNICITYHispanic Ethnicity
Non-Hispanic Ethnicity
EDUCATIONALSTATUS
Less than High School Grad
High School Grad/GED
Some College
College Degree +
Missing/Unknown Education
BMI
Underweight
Normal Weight
Overweight
Obese
Missing/Unknown BMI
PAYER
All Payers
Medicaid
Private Insurance
Self-Pay
PERINATALLEVEL OFBIRTHINGFACILITY
Perinatal Level I
Perinatal Level II & IIE
Perinatal Level III
RURAL-URBANCOMMUNITYAREA CODES(RUCA)
Rural
Urban
Not Defined
TOTAL STATE TOTAL
-100.00%
-16.66%
-8.69%
-0.83%
-1.22%
-12.19%
-100.00%
-13.33%
-4.39%
-0.27%
-0.34%
-2.55%
0.00%
66.67%
46.15%
32.08%
27.52%
18.37%
0.00%
0.00%
48.08%
33.87%
28.48%
22.26%
100.00%
80.00%
50.54%
32.35%
27.86%
20.92%
-100.00%
0.29%
-0.81%
-1.73%
-40.00%
0.09%
-0.23%
-0.56%
0.00%
31.07%
28.20%
31.81%
25.00%
28.74%
29.15%
34.50%
40.00%
30.98%
28.43%
32.37%
-0.53%
-13.92%
-0.16%
-3.56%
29.79%
22.01%
31.19%
23.63%
29.95%
25.57%
-57.99%
-3.21%
1.05%
-2.12%
-3.64%
-20.71%
-1.03%
0.32%
-0.63%
-0.88%
15.00%
31.01%
30.75%
29.05%
23.29%
33.33%
32.75%
31.33%
30.41%
26.29%
35.71%
32.04%
30.43%
29.68%
24.17%
-9.67%
0.20%
-1.95%
-3.28%
-11.57%
-2.61%
0.09%
-0.65%
-0.73%
-2.17%
24.39%
44.16%
32.71%
21.52%
16.58%
24.89%
47.25%
33.00%
23.53%
15.97%
27.00%
44.07%
33.36%
22.25%
18.75%
-25.07%
-1.06%
-2.80%
-1.25%
-8.03%
-0.34%
-0.81%
-0.37%
24.00%
31.82%
28.07%
29.31%
23.23%
33.10%
30.36%
30.76%
32.03%
32.16%
28.88%
29.68%
-6.85%
2.74%
-5.13%
-2.04%
0.81%
-1.54%
27.75%
30.37%
28.46%
30.36%
31.25%
29.39%
29.79%
29.56%
30.00%
-5.36%
0.10%
-4.93%
-1.44%
0.03%
-1.48%
25.41%
29.63%
28.54%
35.90%
30.89%
30.15%
26.85%
29.60%
30.02%
-1.21%-0.36%29.32%30.75%29.68%
2011-2013 Percentage of Primary C-Sections for First-Time Mothers
at 39-40 Weeks Gestation (with exclusions applied)
USC Institute for Families in Society Division of Medicaid Policy Research
72
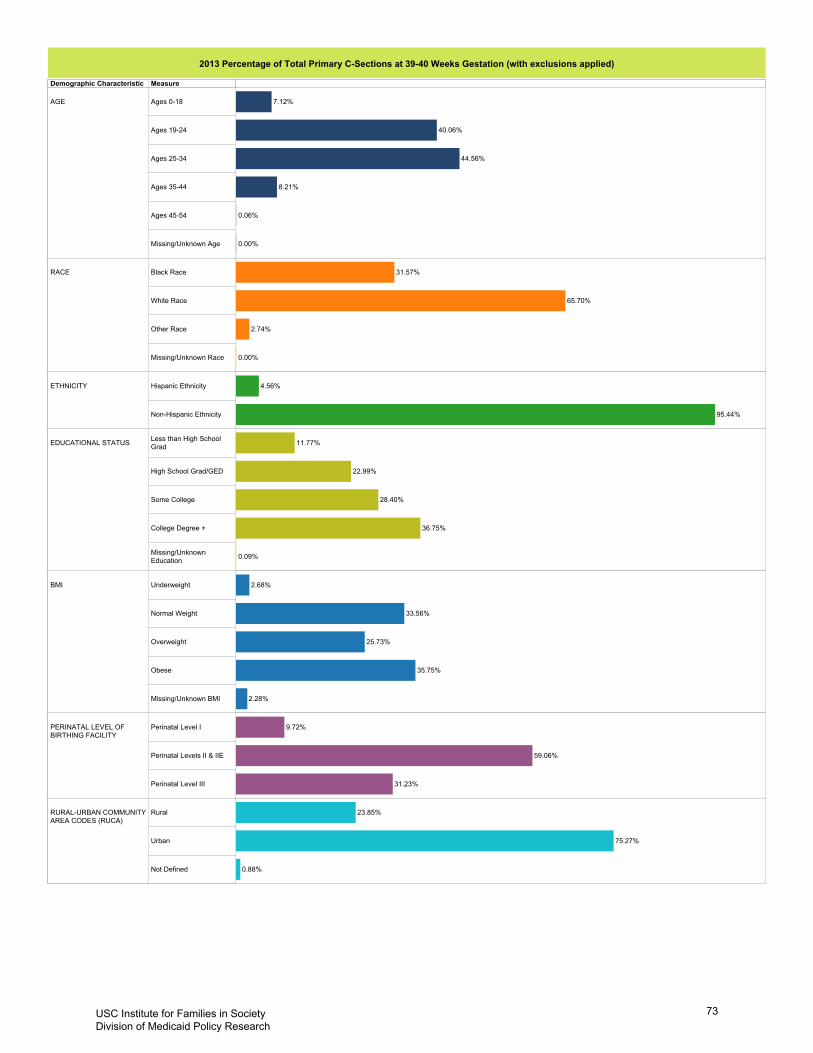
Demographic Characteristic Measure
AGE Ages 0-18
Ages 19-24
Ages 25-34
Ages 35-44
Ages 45-54
Missing/Unknown Age
RACE Black Race
White Race
Other Race
Missing/Unknown Race
ETHNICITY Hispanic Ethnicity
Non-Hispanic Ethnicity
EDUCATIONAL STATUS Less than High SchoolGrad
High School Grad/GED
Some College
College Degree +
Missing/UnknownEducation
BMI Underweight
Normal Weight
Overweight
Obese
Missing/Unknown BMI
PERINATAL LEVEL OFBIRTHING FACILITY
Perinatal Level I
Perinatal Levels II & IIE
Perinatal Level III
RURAL-URBAN COMMUNITYAREA CODES (RUCA)
Rural
Urban
Not Defined
40.06%
44.56%
7.12%
8.21%
0.06%
0.00%
31.57%
65.70%
2.74%
0.00%
95.44%
4.56%
11.77%
22.99%
28.40%
36.75%
0.09%
33.56%
25.73%
35.75%
2.68%
2.28%
59.06%
31.23%
9.72%
23.85%
75.27%
0.88%
2013 Percentage of Total Primary C-Sections at 39-40 Weeks Gestation (with exclusions applied)
USC Institute for Families in Society Division of Medicaid Policy Research
73

APPENDIX A DATA SOURCES: A. SC DHEC, Division of Biostatistics, Birth Certificate Data · Gestation· Birthweight · Total Cesarean Sections· Primary Cesarean Sections - (Note: This definition is limited to first-time mothers.)Note: These data are based on birth certificate data submitted to DHEC by delivering hospitals and are not based on billing codes. B. Linkage of the UB-04 all-payer database AND the Vital Records Birth file· All measures with the exclusions applied (including elective inductions at 37-38 weeks gestation whichwas the only measure which originated from UB-04 all-payer data) Note: All data sources are linked to Medicaid recipient records.
USC Institute for Families in Society Division of Medicaid Policy Research
74

APPENDIX B Detailed Information about the Joint Commission Exclusion Criteria Each of the C-section measures is presented twice, with and without the excluded populations removedfrom the denominator (i.e., the number of deliveries used to calculate the percentage). The percentage Total and Primary C-Sections represents the overall percentage as indicated on the vital records withoutany exclusions applied, and the percentage of Total and Primary C-Sections with the exclusions removed indicates the percentage that may have been elective or non-medically indicated. For these measures, as specified by The Joint Commission PC-02 measure criteria, excluded from the denominatorare the following populations: less than 8 years of age, greater than or equal to 65 years of age, length ofstay > 120 days, gestational age <37 weeks, and ICD-9-CM Principal Diagnosis Code or ICD-9-CM OtherDiagnosis Codes for contraindications to vaginal delivery. To apply the exclusions required the linkage ofthe UB-04 all-payer database and the Vital Records Birth file. However, exclusions cannot be made forclinical trials, which is an additional exclusion criteria; therefore, the numbers may differ based on a reviewof the patient clinical records. For the early elective delivery measure, based on The Joint Commission PC-01 measure criteria, excludedfrom the denominator are the following populations: less than 8 years of age, greater than or equal to 65years of age, length of stay > 120 days, and ICD-9-CM Principal Diagnosis Code or ICD-9-CM Other Diagnosis Codes for conditions possibly justifying elective delivery prior to 39 weeks gestation. Thesemeasures are also limited to 37-38 weeks gestation (early-term deliveries). However, exclusions cannotbe made for active labor, spontaneous rupture of membranes, clinical trials, and prior uterine surgery (apopulation characteristic added to the early elective measure definition as of July 1, 2012); therefore, thenumbers may differ based on a review of the patient clinical records.
USC Institute for Families in Society Division of Medicaid Policy Research
75