Embed Size (px)
Citation preview

Home Performance with ENERGY STAR® Program Impact
Evaluation Report (PY2010-2013) Final Report
Volume 1: Summary November 21, 2016
Prepared for:
The New York State Energy Research and Development Authority
Carley Murray
Project Manager
Prepared by:
ERS 120 Water Street, Suite 350 North Andover, MA 01845
Phone: 978-521-2550
Principal Investigator: West Hill Energy and Computing

ii
NOTICE
This report was prepared by the ERS Impact Evaluation Team, with West Hill Energy and
Computing as the primary investigator, in the course of performing work contracted for and
sponsored by the New York State Energy Research and Development Authority (hereinafter the
“Sponsor”). The opinions expressed in this report do not necessarily reflect those of the
Sponsor or the State of New York, and reference to any specific product, service, process, or
method does not constitute an implied or expressed recommendation or endorsement of it.
Further, the Sponsor, the State of New York, and the contractor make no warranties or
representations, expressed or implied, as to the fitness for particular purpose or merchantability
of any product, apparatus, or service, or the usefulness, completeness, or accuracy of any
processes, methods, or other information contained, described, disclosed, or referred to in this
report. The Sponsor, the State of New York, and the contractor make no representation that the
use of any product, apparatus, process, method, or other information will not infringe privately
owned rights and will assume no liability for any loss, injury, or damage resulting from, or
occurring in connection with, the use of information constrained, described, disclosed, or
referred to in this report.

iii
ABSTRACT
Volume 1 is the first volume in this 5-volume report of the impact evaluation of NYSERDA’s
Home Performance with ENERGY STAR® Program (“HPwES” or “Program”) for Program Years
(PYs) 2010–2013. It provides an overview of the evaluation components and integrates the
results from all of the evaluation activities.
This volume summarizes the approach and the findings from the HPwES impact evaluation
conducted from 2012 to early 2016. The overall objective of this evaluation was to develop a
deeper understanding of how the Program is performing to provide insight into effective
strategies to achieve energy efficiency in this challenging market. The evaluation involved a
combination of primary and secondary research.
This study included a billing analysis of HPwES participating homes to estimate natural gas
and electric savings, an assessment of the reasons for the low realization rates found in previous
evaluations, and an estimate of additional savings not currently claimed by HPwES, which are
generated by homeowners who received free energy audits through the Green Jobs/Green New
York (GJGNY) Program and installed energy efficiency measures outside of the HPwES
Program.
The detailed results from each component of the impact evaluation of the HPwES Program are
presented in the remaining four volumes.
KEYWORDS
Energy efficiency, residential energy efficiency, impact evaluation, program attribution, single-
family homes, heating and cooling equipment

iv
ACKNOWLEDGEMENTS
The ERS Impact Evaluation Team would like to thank Carley Murray and Judeen Byrne for the
assistance they provided throughout the process of implementing the HPwES impact
evaluation. The ERS Team would also like to thank NYSERDA staff, including Karen
Hamilton, Laura Geel, and Kim Lenihan, who provided critical support and information to help
us understand the Program procedures and policies. In addition, the ERS Team appreciates the
valuable feedback provided by William Saxonis of the Department of Public Service and Rick
Ridge and Ralph Prahl from the DPS contractor team, through the review of our planned work.
Finally, the ERS Team would like to acknowledge the efforts of the utility staff members who
provided the electric consumption information and records requested for participant projects.

v
TABLE OF CONTENTS
NOTICE ............................................................................................................ II ABSTRACT ..................................................................................................... III ACKNOWLEDGEMENTS ................................................................................ IV
LIST OF TABLES ............................................................................................ VI
LIST OF FIGURES .......................................................................................... VII
SECTION 1: INTRODUCTION .......................................................................... 1
1.1 Structure of the Evaluation Report ................................................................... 2
1.2 Program Description ........................................................................................ 3
1.3 Previous Evaluations ....................................................................................... 3
SECTION 2: EVALUATION COMPONENTS .................................................... 4
2.1 Volume 2: Phase 1 Billing Analysis .................................................................. 4
2.2 Volume 3: Phase 2 Investigation into Program Savings .................................... 5
2.2.1 Analysis of Program Quality Assurance Activities .............................................. 5
2.2.2 Review of the Participating Contractor Survey ................................................... 7
2.3 Volume 4: Green Jobs - Green New York Audit-Only Savings .......................... 8
2.3.1 Green Jobs - Green New York Audit-Only Screener Survey .............................. 9
2.3.2 Billing Analysis ................................................................................................. 11
2.3.3 Cognitive Interviews......................................................................................... 11
2.3.4 Program Influence Overview ............................................................................ 11 2.3.5 Cognitive Interview Objectives and Process .................................................... 13
2.3.6 Pairwise Program Influence Score ................................................................... 13
2.4 Volume 5: Appendices ................................................................................... 14
SECTION 3: INTEGRATION OF RESULTS .................................................... 15
3.1 Value of Modeling .......................................................................................... 15
3.2 Barriers to Modeling ....................................................................................... 16
3.3 Potential to Improve Modeling Accuracy ......................................................... 16
3.4 Approaches to Improving the Estimation of Savings ....................................... 17
3.5 Green Jobs-Green New York Audit-Only Savings ........................................... 18
SECTION 4: RECOMMENDATIONS ............................................................... 19
4.1 Program Recommendations ........................................................................... 19
4.1.1 Improving the Estimation of Program Savings for the HPwES Program .......... 19
4.1.2 GJGNY Audit-Only Impact Evaluation ............................................................. 19

vi
LIST OF TABLES
Table 1. Evaluation Components and Objectives ....................................................................... 2
Table 2. Comparison of Savings for HPwES Billing Analyses ..................................................... 4
Table 3. Summary of Hypothesis Testing ................................................................................... 7
Table 4. Summary of Areas for Future Research ........................................................................ 8
Table 5. Summary of Recommended Research Areas and Evaluation Activities ........................ 8
Table 6. Responses from the Contractor Survey ...................................................................... 15
Table 7. Estimated Annual Savings from the GJGNY Audit ...................................................... 18

vii
LIST OF FIGURES
Figure 1. Green Jobs/Green New York Screener Survey Responses ....................................... 10
Figure 2. Program Influence for GJGNY Audit-Only Participants .............................................. 12

1
SECTION 1: INTRODUCTION
Volume 1 is the summary of the impact evaluation of NYSERDA’s Home Performance with
ENERGY STAR® Program (“HPwES” or “Program”) for program years (PYs) 2010–2013. It
provides an overview of the components and integrates the results from the other four volumes.
From 2012 to early 2016, the ERS Impact Evaluation Team conducted a two-phase impact
evaluation of NYSERDA’s HPwES Program. This study included a billing analysis of HPwES
participant homes to estimate natural gas and electric savings, an assessment of the possible
reasons for the low realization rates found in previous evaluations, and an estimate of
additional savings not currently claimed by HPwES but which are generated by homeowners
who received free or reduced-cost energy audits through the Green Jobs - Green New York
(GJGNY) Program and installed energy efficiency measures outside of the HPwES Program.
The overall objective of this evaluation was to develop a deeper understanding of how the
Program is performing and how the performance could be improved. The evaluation involved a
combination of primary and secondary research.
The HPwES PY 2010 to 2011 Impact Evaluation had three main components:
• Phase 1 Billing Analysis (PY 2010–2011)
This was the third billing analysis performed to estimate electric and natural gas
savings. All three billing analyses showed that some measures are underperforming.
Fixed effects billing models were constructed to determine the evaluated gross program
savings both for natural gas and electricity.
• Phase 2 Investigation into Program Savings
This study was designed to understand the reasons behind the realization rates from the
billing analysis (PY 2010–2011). It consisted of two evaluation activities: analyzing the
program QA files for a sample of selected projects and reviewing the results of the
survey of participating contractors conducted by NYSERDA’s Process Evaluation
Team. The process evaluation survey covered relevant findings for the impact
evaluation and also provided insight into other potential areas of research of interest to
the Impact Evaluation Team.
• Green Jobs - Green New York Audit-Only Impact Evaluation (PY 2010–2013)
This component was designed to estimate the savings being generated outside of the
Program by GJGNY audit recipients who installed measures outside of the HPwES

HPwES Impact Evaluation Volume 1: Summary Introduction
2
Program. It included a screener survey to identify audit participants who installed
measures outside of the Program, a billing analysis of these audit recipients, and
cognitive interviews to investigate the decision making process and test an alternative
approach to quantifying the program influence.
The evaluation components and objectives are described in Table 1.
Table 1. Evaluation Components and Objectives Evaluation Component Objective Evaluation Activities
Phase 1 Billing Analysis
Estimate realization rate (RR) for electric and natural gas savings
1. Billing analysis
Phase 2 Investigation into Program Savings
Understand the reasons behind the RRs from recent billing analyses
1. Analysis of program QA files
2. Review contractor survey conducted by the Process Evaluation Team
GJGNY Audit-Only Impact Evaluation
Quantify potential savings from GJGNY audit-only participants
1. Screener survey
2. Billing analysis
3. Program influence cognitive interviews
The remainder of this section covers the structure of this evaluation report, a brief program
description, and a short discussion of previous evaluations of the HPwES Program.
1.1 STRUCTURE OF THE EVALUATION REPORT
Results of the data collection and analysis for the various components of this HPwES impact
evaluation study are presented in five volumes:
• Volume 1: Summary
• Volume 2: Phase 1 Billing Analysis (PY 2010–2011)
• Volume 3: Phase 2 Investigation into Program Savings
• Volume 4: GJGNY Audit-Only Savings
• Volume 5: Appendices
The following sections of this volume provide a brief summary of the contents of each volume,
a discussion of the integration of the results from the various components, and
recommendations.

HPwES Impact Evaluation Volume 1: Summary Introduction
3
1.2 PROGRAM DESCRIPTION
The HPwES Program encourages owners and tenants of existing one- to four-family homes to
implement comprehensive energy efficiency improvements by working with participating
contractors accredited by the Building Performance Institute.
NYSERDA began the GJGNY audit program in November 2010 to provide free or reduced-
cost audits and to encourage participation in the HPwES Program. HPwES eligible measures
include building shell measures, such as air sealing and insulation; appliances, such as
ENERGY STAR refrigerators; heating measures, such as boilers and furnaces; cooling
measures, such as ENERGY STAR room or central air conditioners; and certain renewable
energy technologies.
1.3 PREVIOUS EVALUATIONS
The previous evaluation is summarized in the 2007–2008 Home Performance with ENERGY
STAR Program Impact Evaluation Report, prepared by Megdal and Associates (now Analytical
Evaluation Consultants) with West Hill Energy and Computing as the primary investigator,
dated September 2012.1 A compilation of the results is presented in Table 2 in Section 2.1.
In addition, a process evaluation and market characterization of the GJGNY audit program was
completed in 2012 by the NMR Group.2 This evaluation provided the foundation for the
investigation into potential savings by GJGNY audit recipients who did not receive incentives
or services through HPwES.
1 NYSERDA 2007–2008 Home Performance with ENERGY STAR® Program Impact Evaluation Report, prepared for the New York State Energy Research and Development Authority, prepared by Megdal & Associates, LLC, September 2012, http://www.nyserda.ny.gov/-/media/Files/Publications/PPSER/Program-Evaluation/2012ContractorReports/2012-HPwES-Impact-Report-with-Appendices.pdf. 2 Process Evaluation and Market Characterization and Assessment, Green Jobs – Green New York Residential Program Final Report, prepared for the New York State Energy Research and Development Authority by NMR Group, Inc., Somerville, MA. Project Numbers #9835 and #9875, September 2012.

4
SECTION 2: EVALUATION COMPONENTS
This section provides a short description of the four remaining report volumes. A more
complete discussion of the methods and results can be found in the respective volumes.
2.1 VOLUME 2: PHASE 1 BILLING ANALYSIS
The objective of this evaluation component was to estimate first-year energy savings for project
years (PYs) 2010–2011 Home Performance with ENERGY STAR Program participants. The
fixed effects natural gas billing model included 5,009 participating homes, and the electric
model included 3,185 homes. The results for the Phase 1 analysis and the previous billing
analysis are presented in Table 2.
Table 2. Comparison of Savings for HPwES Billing Analyses
As shown in Table 2, realization rates (RRs) were found to be lower in the 2010–2011 analysis.
While the specific reasons for the lower RR could not be ascertained directly from the billing
analysis, a preliminary review of the program data identified one difference in program
implementation, in that more heat pumps were installed during PYs 2010 and 2011. The
impacts of heat pumps were easily identified in the electric billing data, and the results of the
modeling indicate that the additional electric use associated with these devices is substantially
higher than anticipated. When the RR excluded measures with extra use, it was within the
confidence intervals of the previous evaluation.
Phase 1 PY 2010–2011 PY 2007–2008 Evaluation
Annual Electric Savings
Annual Natural Gas Savings
Annual Electric Savings
Annual Savings for All Other Fuels
Realization rate (RR)
19% 48% 35% 65%
90% confidence interval
+/-9% +/-1% +/-22% +/-7%
Average evaluated savings per household
154 kWh 13.3 MMBtu 315 kWh 17.3 MMBtu
Percentage of pre-installation use saved1
2% 14% 3% 16%
Number of homes in the model
3,185 5,009 2,536 1,462
Number of utilities in the model
7 7 3 3
1 The annual consumption during the pre-installation period was averaged for all homes in the billing models. The “percentage of pre-installation use saved” is the average annual evaluated savings divided by the annual average pre-installation consumptions.

HPwES Impact Evaluation Volume 1: Summary Evaluation Components
5
The key findings from the Phase 1 billing analysis are as follows:
• Comparing program-reported heating and cooling savings to the pre-installation
consumption suggests that program-reported savings for these measures are overstated
for many homes.
• The impacts of heat pumps were easily identified in the electric billing data, and
additional electric use associated with these devices is substantially higher than estimated
by the Program.
• RRs vary substantially by contractor. Contractors who have been participating in the
Program longer have a higher RR than contractors who are newer to the Program.
• On average, homes with lower program-reported savings tend to have a higher realization
rate than homes with higher program-reported savings.
• There is a moderately strong and positive correlation between the percentage of
inspections passed and the RR for the largest ten contractors, suggesting that program
quality assurance (QA) efforts are having a positive impact on improving the accuracy of
program-reported savings.
2.2 VOLUME 3: PHASE 2 INVESTIGATION INTO PROGRAM SAVINGS
Two separate evaluation activities were conducted to investigate the program savings and
assess possible reasons for the low realization rates:
1. Analysis of program QA activities
2. Review of the Process Evaluation survey of participating contractors
This secondary research also assisted with identifying future evaluation activities to provide a
stronger basis for improving program performance.
2.2.1 Analysis of Program Quality Assurance Activities
For the analysis of the QA activities, 100 projects from each year from 2010 to 2012 and 150
projects from each year from 2013 to 2014 were randomly selected from the QA inspections
completed in those years. An additional 30 projects from 2010 to 2011 that had undergone

HPwES Impact Evaluation Volume 1: Summary Evaluation Components
6
administrative review were selected in the hopes they would have TREAT modeling files
available for review.3
Five hypotheses were developed to assess the reasons for the consistent overstatement of
program-reported savings:
1. Model inputs
Modeling inputs could substantially affect the savings if the pre-installation conditions or
recommended measures are not correctly characterized.
2. Software algorithms
Software algorithms could result in biased estimates of savings. While a comprehensive
investigation into the modeling software was outside the scope of this evaluation, the
Impact Evaluation Team assessed a few specific aspects of the software outputs,
including treatment of electric space-heating savings, interactive effects, and the accuracy
of the modeling for older homes.
3. Reconciliation to pre-installation consumption
If the modeling overstates pre-installation consumption, the savings are likely to be
overstated.
4. Errors in data transfers
If data from the modeling tools are not correctly entered into the program tracking
database, the program-reported savings could be incorrect.
5. Quality of the installations
Poor-quality installations could result in realized savings that are substantially lower than
expected. As site visits were outside the scope of the evaluation, the findings are
suggestive rather than definitive.
A summary of the results is provided in Table 3, below.
3 The Impact Evaluation Team later learned that TREAT modeling files were not available.

HPwES Impact Evaluation Volume 1: Summary Evaluation Components
7
Table 3. Summary of Hypothesis Testing
Hypothesis Evidence Impacts Potential Size of Impact on RR’s
Contractors’ inputs are not accurate
Strong indication
Efficiency of pre-installation conditions may be understated, increasing both pre-installation consumption and savings.
Large
Model algorithms are not accurate
Possible indication
Some interactive effects may slightly overstate savings; older homes may be more difficult to model accurately. The source of the electric space-heating savings is unclear, and the savings appear to be overstated.
Small for natural gas/ large for electric
No reconciliation to bills
Strong indication
Program files rarely have bills entered; if they were entered, the modeled consumption was much higher than bills. Comparison to bills provides an important reality check on savings.
Large
Errors in data transfer
No indication Model output was compared to program tracking, and the data matched.
None
Installation quality Possible indication
Review of QA records indicated 24% of homes had some installation issue that could affect savings. From the information available, it seems that issues may be small.
Possible, needs additional research
2.2.2 Review of the Participating Contractor Survey
Contractor interviews were planned by both the Process Evaluation and Impact Evaluation
Teams in the current evaluation cycle. In September 2014, the Process Evaluation Team
launched primary data collection and fielded a survey in September and October 2014. To
avoid survey fatigue and ensure the leveraging of evaluation efforts, NYSERDA requested that
the Impact Evaluation Team review the results from the Process Evaluation survey for two
purposes:
1. To gather information that may be relevant to understanding why the program RRs are low
2. To identify other areas of research to further investigate the reasons for low RRs
Through the review of the Process Evaluation survey, the Impact Evaluation Team identified
specific areas requiring additional information to assess the evaluated impacts of three of the
potential contributors to low RRs. Table 4, below, summarizes the potential additional research
to be conducted; it is organized by the Impact Evaluation Team’s five topic areas.

HPwES Impact Evaluation Volume 1: Summary Evaluation Components
8
Table 4. Summary of Areas for Future Research
Topic Process Evaluation Survey Relevant Findings Future Impact Evaluation Research Areas
Staff hiring and training
Frequency of BPI certified auditors, installers, and supervisors; value of BPI training
Specifics on how training is done, what is expected, who covers the costs, etc.
Internal QA/QC
Frequency of QA/QC inspections and call backs
Content of inspections, use of diagnostic equipment, and how projects are selected for QA site visits
Modeling/ customer billing records
Contractors’ perceptions on the value of modeling and issues with completing the modeling and obtaining customers’ bills
Accuracy of inputs and frequency of reconciliation to participants’ billing records
Use of diagnostic testing
Frequency of use of diagnostic tools, such as blower door tests and infrared scans, for audits
Use of diagnostic equipment during installations and to troubleshoot problems
Installation practices
Heating system sizing Wide range of other issues about installation practices
As a result of these analyses, the Impact Evaluation Team recommends conducting in-person
interviews along with direct data collection activities, including a combination of riding along
with contractors and pre- and post-installation inspections. Each of these activities provides the
opportunity to verify the various aspects of contractors’ participation in the HPwES Program
that may affect the RRs. Table 5 provides a summary of the recommended research areas and
evaluation activities.
Table 5. Summary of Recommended Research Areas and Evaluation Activities
Topic In-Person Interview Ride Alongs
Pre-Installation Site Visit
Post-Installation Site Visit
Hiring and training √ √
Internal QA/QC √ √
Modeling/customer billing records √ √
Use of diagnostic testing √ √ √
Installation practices √ √ √
2.3 VOLUME 4: GREEN JOBS - GREEN NEW YORK AUDIT-ONLY SAVINGS
This component of the evaluation was designed to investigate whether Green Jobs- Green New
York (GJGNY) audit-only participants were generating energy savings outside of the HPwES
Program and to estimate the savings from these installations. Savings can occur as a result of
the GJGNY audit but not be reported by the HPwES Program for the following reasons:

HPwES Impact Evaluation Volume 1: Summary Evaluation Components
9
• The audit recipient decides to use a different contractor to install the recommended
measures
• The audit recipient decides to do the installation him/herself
• The audit recipient uses a HPwES contractor but decides not to submit the paperwork or
receive an incentive through the HPwES Program
The recent Market Characterization Assessment (MCA) report on the GJGNY Program4
indicated that about 38% of GJGNY audit-only participants went on to install energy efficiency
measures.
This component of the evaluation had three parts:
1. Initial screening survey to identify GJGNY audit-only participants who had installed
major measures and to create the sampling frame for the billing analysis
2. Billing analysis to estimate the savings from the measures that were recommended in the
audit report but installed outside of the Program
3. Cognitive interviews to gain insights into decision making, assess program influence, and
test an alternative approach to quantifying program influence through the use of pairwise
comparisons
Each of these evaluation activities is described briefly below.
2.3.1 Green Jobs - Green New York Audit-Only Screener Survey
The Impact Evaluation Team designed this survey for the following purposes:
1. Determine the frequency of installations outside of the HPwES Program.
2. Collect detailed information necessary for a billing analysis of GJGNY audit-only
recipients who have natural gas space heating.
3. Request data release forms to request utility billing records.
The survey was fielded via the web with follow-up phone calls to GJGNY audit recipients who
did not respond electronically. NYSERDA’s survey contractor, Abt/SBRI, conducted the
4 Op. cit., NMR Group, Table 94.

HPwES Impact Evaluation Volume 1: Summary Evaluation Components
10
survey. No incentives were offered for completing the survey or returning the utility
consumption release form.
A total of 3,930 surveys were completed, which represented a 21% response rate. The survey
responses are shown in Figure 1.
Figure 1. Green Jobs/Green New York Screener Survey Responses
To be eligible for inclusion in the billing analysis, respondents had to meet the following
criteria:
• Received a GJGNY audit but did not install measures through the HPwES Program
• Installed one or more of four major measures (insulation, air sealing, energy efficient
windows/doors, or a new heating system)
• Spent more than $2,000 on major energy efficiency upgrades
• Lived in their home at least one year before and one year after the GJGNY audit
• Use natural gas as their primary space-heating fuel
Out of the 3,930 participants who completed the survey, 358 respondents met all of the criteria
for billing analysis; and of those, 209 participants returned the release forms.

HPwES Impact Evaluation Volume 1: Summary Evaluation Components
11
2.3.2 Billing Analysis
From the screener survey, the Impact Evaluation Team received utility billing records for 186
of the 209 respondents who provided the release forms. The billing analysis was restricted to
natural gas savings, as there were only a few respondents with electric measures (92 of the 186
homes), and the primary electric measure was lighting, which tends to have small savings that
are difficult to estimate through a billing analysis.
After cleaning the data, there were 133 homes in the final billing analysis model. These
GJGNY audit recipients saved about 7.4 MMBtu per year on average per home, which is about
half of the HPwES per-home savings estimated in the Phase 1 billing analysis. The 7.4 MMBtu
per year corresponds to about 8% of the pre-installation consumption of these homes, and the
relative precision of the estimated savings was 18%.5 Attempts to model measure savings at a
more granular level were unsuccessful, most likely due to the low number of homes in the
model.
As the savings do not account for program influence, the actual savings attributable to the
GJGNY audit are lower.
2.3.3 Cognitive Interviews
The Impact Evaluation Team designed an alternative approach to estimating program influence,
the Barriers Approach, and tested this new method through cognitive interviews. The Barriers
Approach is based on identifying the barriers to measuring installation, the relative importance
of these barriers, and the extent to which the Program helped the participants overcome the
barriers. The framework for the alternative approach to the program influence is discussed
below, followed by a description of the cognitive interviews.
2.3.4 Program Influence Overview
Efficiency programs are designed to help customers overcome barriers to installation. For the
installation of efficiency measures to be influenced by the GJGNY energy audit, the
homeowner had to meet two criteria:
5 All estimators were statistically significant at the 90% level.
HPwES Impact Evaluation Volume 1: Summary Evaluation Components
12
• They had one or more barriers to measure installation that could be addressed by the
Program.
• The GJGNY energy audit helped the homeowner to overcome the barrier(s).
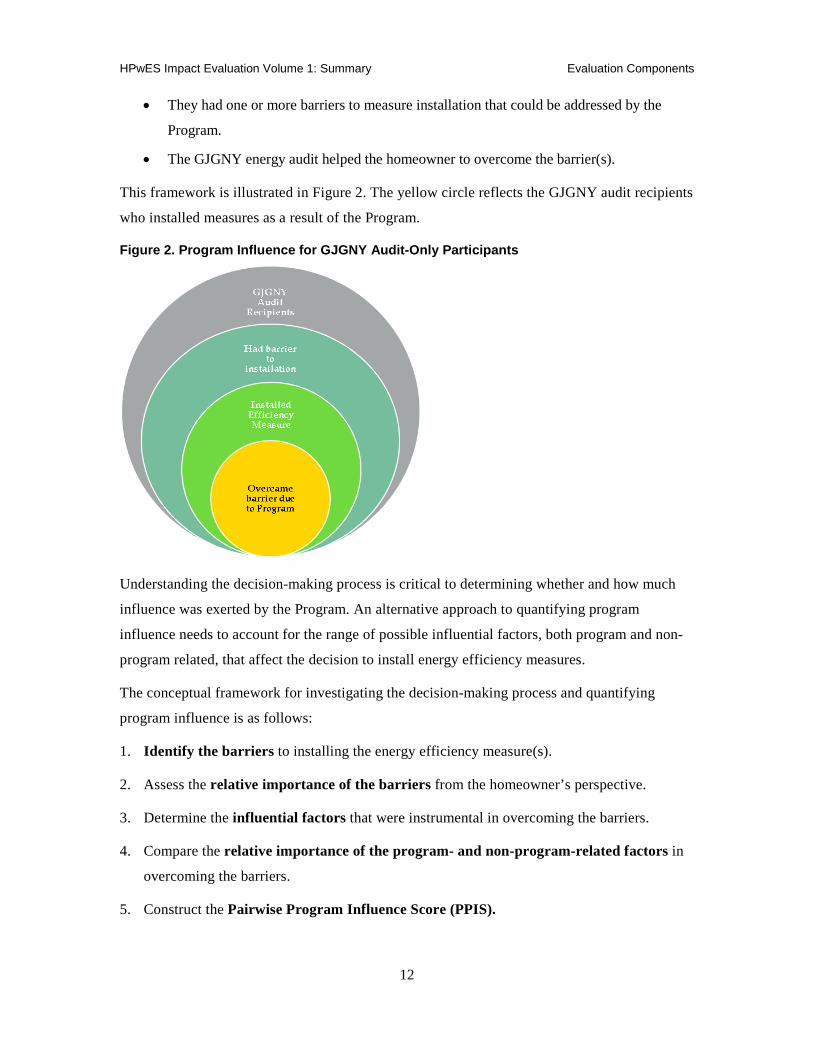
This framework is illustrated in Figure 2. The yellow circle reflects the GJGNY audit recipients
who installed measures as a result of the Program.
Figure 2. Program Influence for GJGNY Audit-Only Participants
Understanding the decision-making process is critical to determining whether and how much
influence was exerted by the Program. An alternative approach to quantifying program
influence needs to account for the range of possible influential factors, both program and non-
program related, that affect the decision to install energy efficiency measures.
The conceptual framework for investigating the decision-making process and quantifying
program influence is as follows:
1. Identify the barriers to installing the energy efficiency measure(s).
2. Assess the relative importance of the barriers from the homeowner’s perspective.
3. Determine the influential factors that were instrumental in overcoming the barriers.
4. Compare the relative importance of the program- and non-program-related factors in
overcoming the barriers.
5. Construct the Pairwise Program Influence Score (PPIS).

HPwES Impact Evaluation Volume 1: Summary Evaluation Components
13
This approach directly measures how the program intervention is working and can provide
valuable feedback to program staff.
2.3.5 Cognitive Interview Objectives and Process
The cognitive interviews were designed to provide insight into the following areas:
• Do the identified barriers (lack of information, time, money, and finding a contractor)
cover the full range of barriers experienced by homeowners?
• Are we using terminology that homeowners understand?
• Do the pairwise comparisons make sense to the survey respondents?
• Does the approach to quantifying program influence provide numerical scores that seem
reasonable in the context of the story told by the survey respondent?
The sample frame for the GJGNY cognitive interviews consisted of the respondents to the
initial screener survey who had installed at least one major efficiency measure outside of the
HPwES Program and had agreed to participate in a second survey. The sample frame was
randomly ordered.
All interviews were audio recorded, and recordings were provided to four expert reviewers.
Each reviewer came to an independent assessment of the PPIS, which was compared to the
story told by the respondent to assess consistency.
2.3.6 Pairwise Program Influence Score
Pairwise comparisons are used to quantify the relative importance of the barriers (money,
information, time, and finding a contractor); the resulting priority score reflects the proportion
of the decision related to the barrier. A second level of pairwise comparisons is asked for each
priority to establish the Program’s contribution to overcoming each of the barriers.
Some findings and lessons learned from the survey process are provided below:
• Respondents were interested and engaged and they wanted to tell their story, even though
the average survey was 30 minutes. Starting with open-ended questions helped to build
rapport and gain their attention and cooperation.
• Respondents had already participated in the screener survey and were, on average,
substantially more educated and in a higher income bracket than the population as a
whole.
• Structured questioning worked better as it generated more thoughtful responses.

HPwES Impact Evaluation Volume 1: Summary Evaluation Components
14
• Four major barriers were confirmed; no additional barriers were mentioned.
• Understanding of the wording and content of influential factors tended to vary from
respondent to respondent.
• Responses were generally fluid and pairwise questions were understandable. Comparing
lack of information to money constraints, for example, was easily comprehended by the
respondents.
• In some cases, the respondents first gave one answer and on further reflection decided to
change it. Survey design needs to allow for this.
2.4 VOLUME 5: APPENDICES
Volume 5 includes six appendices. The first appendix is the glossary of terms, the following
two appendices are the GJGNY audit-only survey instrument and the billing model details, and
the final three volumes include the GJGNY audit-only program influence survey and more
information on the Analytic Hierarchy Process (AHP) and Barriers Approach method of
analyzing complex decisions.

15
SECTION 3: INTEGRATION OF RESULTS
In aggregate, these evaluation activities provide strong indicators about why NYSERDA’s
Home Performance with ENERGY STAR Program (“HPwES” or “Program”)-reported savings
are overstated and what can be done to improve the program-reported saving estimation.
Considering the evaluation as a whole, four major questions emerge:
1. What is the value of modeling?
2. What are the barriers to modeling, and is it worth pursuing?
3. What can be done to improve the estimated savings?
4. What is the magnitude of the savings from the Green Jobs-Green New York (GJGNY)
audit that occur outside of the HPwES Program?
In addition, this evaluation led to the identification of areas to be considered for future research
into methods to improve program savings.
3.1 VALUE OF MODELING
Conducting a diagnostic audit and modeling the household energy consumption and potential
savings is a cornerstone of the HPwES Program. While modeling is a complex task and the
results are imperfect, it is still the best alternative for estimating energy savings from both the
contractors’ and homeowners’ perspectives, as is evident from the responses to the contractor
survey fielded by NYSERDA’s Process Evaluation Team, shown in Table 6.
Table 6. Responses from the Contractor Survey
Survey Responses Participating contractors reported conducting highly comprehensive audits and demonstrated strong support for the diagnostic audit approach to home performance.
90% of surveyed contractors said modeling gives their firm an advantage. • Two-thirds (67%) said that being able to demonstrate savings and/or payback was a unique
advantage.
81% indicated they always recommend a diagnostic audit, and half reported that they will not provide simple walk-through audits.
• Contractors who provide walk-through audits indicated these cases apply only to homeowners who had an audit recently or had a single specific issue.
The responses outlined in Table 6 indicates that the contractors see value in performing the
diagnostic audit.

HPwES Impact Evaluation Volume 1: Summary Integration of Results
16
3.2 BARRIERS TO MODELING
Contractors also reported downsides to modeling in the contractor survey, with 85%
mentioning at least one of these issues:
• Modeling takes too much time (52%).
• Modeled results can be inaccurate (25%), the software is too complex (13%), and
modeling can be a staff-training burden (12%).
• There are difficulties with acquiring the consumption data needed to calibrate the model,
which improves model accuracy (88%).
• There are challenges with acquiring delivered fuel consumption data (oil, propane, or
kerosene) (20%), and it is difficult to calculate usage based on delivered fuel data (13%).
In combination, these responses suggest that modeling is an important and valuable part of the
program implementation, but there are also hurdles for the contractors. While pre-installation
billing records are critical for the accurate estimation of savings, they are difficult to obtain.
3.3 POTENTIAL TO IMPROVE MODELING ACCURACY
Given the low realization rates (RRs) over the past several evaluations, one may ask whether it
is possible to improve the accuracy of the modeling. While constructing an accurate estimate of
savings for every single home is unlikely to be feasible due to the wide variations in behavioral
patterns and living conditions from one home to the next, it certainly is possible to develop
reasonably accurate estimated savings (on average) for groups of homes.
A survey of residential retrofit programs (including HPwES) in the Northeast found that the
RRs were 89% and 99% for two of the seven programs, suggesting that some programs have
been able to successfully model average savings.6 The three programs with the lowest RRs
estimated the average program-reported savings at 25% to 35% of the pre-installation annual
consumption, which is well above the expected range for the level of investment resulting from
these programs and should trigger a review of the savings methodology.
6 Bartsch, A. and C. Danaher, “The Shell Game: Finding Thermal Savings in Residential Retrofit Programs,” International Energy Policy and Programme Evaluation Conference, Berlin, Germany, September, 2014.

HPwES Impact Evaluation Volume 1: Summary Integration of Results
17
3.4 APPROACHES TO IMPROVING THE ESTIMATION OF SAVINGS
The research activities conducted as part of this evaluation demonstrate that the value of the
diagnostic audit and modeling are clear to the contractors, particularly as there is no effective
alternative to estimating savings.
In combination, the HPwES Impact Evaluation activities identify some key potential sources of
the low RRs. The sources of the findings are given in parentheses below.
1. Savings are often estimated without effectively accounting for pre-installation consumption
(Phase 1 Billing Analysis, Review of Program Quality Assurance records, Review of
Process Evaluation Contractor Survey).
2. Contractors may be underestimating the efficiency of the home prior to the installation,
leading to the overestimation of savings (Review of Program Quality Assurance records).
3. The modeling software does not appear to be accurately estimating electric savings for
heating-related measures and extra electric use due to the installation of heat pumps (Phase
1 Billing Analysis).
Other possible reasons that savings are overestimated were eliminated from consideration. For
example, there is no evidence that there are data errors occurring between the contractors’
modeling files and the program tracking database.
The evidence from this evaluation suggests three specific areas of focus for improving the
program-reported savings:
1. Improve the access to pre-installation billing records and ensure that they are used in the
modeling process.
a. The actual and modeled pre-installation energy use are substantially more
aligned for contractors with higher RRs, suggesting that reconciliation to bills
will improve the accuracy of the estimated savings.
b. When asked how the Program could be improved, 15% of the surveyed
contractors requested easier access to prior consumption data.
2. Ensure that the pre-installation conditions are accurately reflected in the model.
a. The evidence indicates that contractors tend to understate the efficiency of the
home prior to the efficiency upgrades, which results in overestimated savings.
HPwES Impact Evaluation Volume 1: Summary Integration of Results
18
3. Review the algorithms and inputs used to estimate electric savings for heating-related
measures.
a. The source of these savings is not clear, and they represented over 50% of the
electric savings for program year (PY) 2010–2011.
b. Twenty-seven percent of surveyed contractors proposed changing the software
used or improving/simplifying TREAT.
A final consideration is whether installation quality could be affecting the realization of
savings. This issue was largely outside of the scope of work for Phase 1 and 2 of this HPwES
impact evaluation and should be considered for future research activities.
3.5 GREEN JOBS-GREEN NEW YORK AUDIT-ONLY SAVINGS
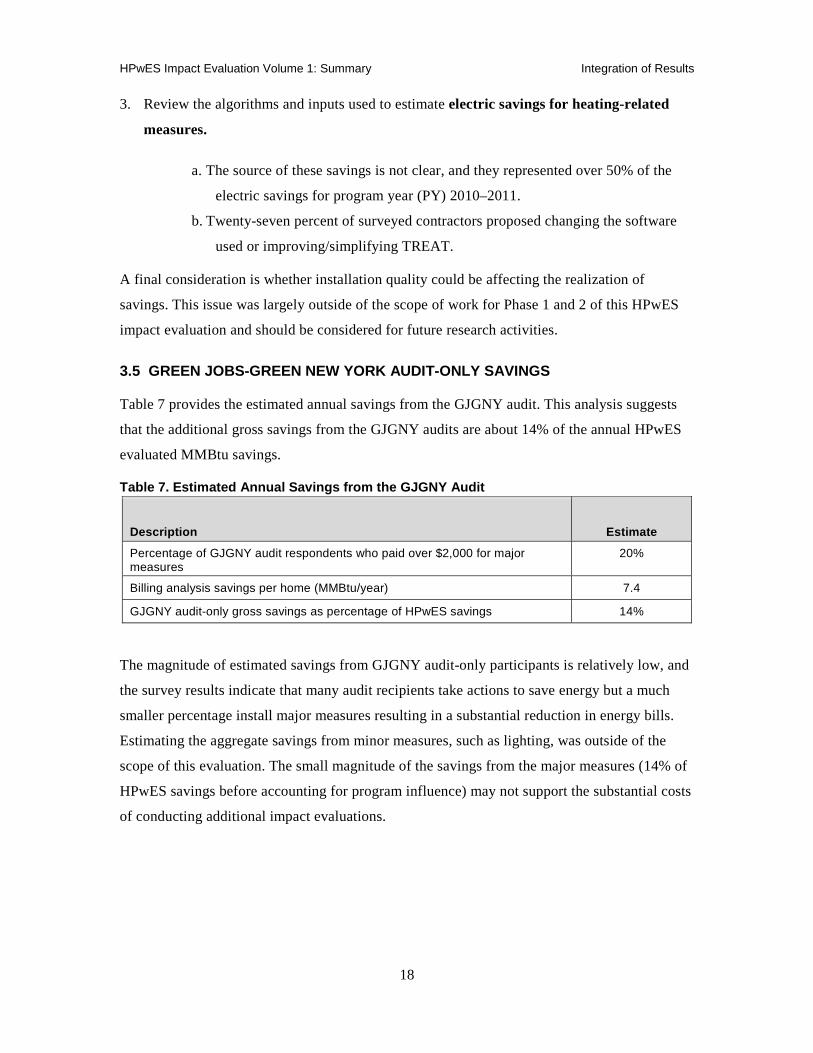
Table 7 provides the estimated annual savings from the GJGNY audit. This analysis suggests
that the additional gross savings from the GJGNY audits are about 14% of the annual HPwES
evaluated MMBtu savings.
Table 7. Estimated Annual Savings from the GJGNY Audit
Description Estimate
Percentage of GJGNY audit respondents who paid over $2,000 for major measures
20%
Billing analysis savings per home (MMBtu/year) 7.4
GJGNY audit-only gross savings as percentage of HPwES savings 14%
The magnitude of estimated savings from GJGNY audit-only participants is relatively low, and
the survey results indicate that many audit recipients take actions to save energy but a much
smaller percentage install major measures resulting in a substantial reduction in energy bills.
Estimating the aggregate savings from minor measures, such as lighting, was outside of the
scope of this evaluation. The small magnitude of the savings from the major measures (14% of
HPwES savings before accounting for program influence) may not support the substantial costs
of conducting additional impact evaluations.

19
SECTION 4: RECOMMENDATIONS
This section presents the recommendations from the impact evaluation study.
4.1 PROGRAM RECOMMENDATIONS
We recommend the following steps to improve the NYSERDA’s Home Performance with
ENERGY STAR Program (“HPwES” or “Program”) and the Green Jobs-Green New York
(GJGNY) audit-only impact evaluation.
4.1.1 Improving the Estimation of Program Savings for the HPwES Program
Program Recommendation #1: Continue the Diagnostic Audit and Modeling as Core
Components of the HPwES program
The diagnostic audit and modeling should remain core components of the Program as they were
clearly identified as valuable tools by both contractors and participants. Work with contractors
to underscore the value of modeling and the importance of accurately modelling the pre-
installation conditions. Specific areas for improving modeling accuracy are discussed in
Section 3.4.
Evaluation Recommendation #2: Expand Evaluation Methods
Consider alternative approaches to investigate the reliability of modeling inputs and installation
quality, such as pre- and/or post-installation inspections, riding along with contractors and/or
work-site inspections. As the Program seeks to adapt to changing conditions, evaluators can
provide insight into strategies used in other jurisdictions and methods to ensure that the impacts
of innovations can be compared to traditional NYSERDA HPwES programs.
4.1.2 GJGNY Audit-Only Impact Evaluation
Evaluation Recommendation #3: Expand Barrier Research
The cognitive interviews suggest that the barriers to installation of measures can be effectively
researched through methods such as pairwise comparisons. This approach has the potential to
provide useful information for the design and development of future interventions in this
market. Understanding the homeowners’ perspectives is the key to developing effective market
transformation interventions, outreach, and services.