Embed Size (px)
Citation preview


FINANCIAL HIGHLIGHTS
New World Development Company Limited FINANCIAL HIGHLIGHTS 2
UnauditedFor the six months ended
31 December2015 2014
HK$m HK$m
Revenues 33,778.2 26,986.3
Total segment results, including share of results of joint ventures
and associated companies(1) 7,487.0 7,778.9
Other (losses)/gains, net (163.5) 425.9
Changes in fair value of investment properties 36.7 1,811.3
Profit attributable to shareholders of the Company 3,300.0 5,854.6
Underlying profit, excluding exchange difference attributable to NWD 4,349.4 4,363.8
Underlying profit 3,281.4 4,408.2
As at 31 December
2015
As at
30 June
2015
HK$m HK$m
Cash and bank balances 64,698.5 59,465.2
Net debt(2) 68,162.7 53,539.1
Total equity 217,352.4 222,358.0
Gearing ratio(3) 31.4%(4) 24.1%
(1) Excluding changes in fair value of investment properties (net of taxation) and other (losses)/gains of joint ventures and associated
companies
(2) The aggregate of bank loans, other loans, fixed rate bonds and notes payable less cash and bank balances
(3) Net debt divided by total equity
(4) Net gearing of NWD (excluding NWSH, NWCL and NWDS): 25.6%

CHAIRMAN’S STATEMENT
Interim Report 2015/2016 CHAIRMAN’S STATEMENT 3
To Our Shareholders,
“Life belongs to the living, and he who lives must be prepared for changes.”
This is a famous quote by Johann Wolfgang von Goethe, a German literary maestro in the eighteenth century.
Continental Europe underwent the French Revolution in the eighteenth century, which changed the fate of the whole
Europe. In the course of exploring new ways of life and struggling amidst difficulties and obstacles, thinkers and artists
wished to have their try in making some changes to an era of turmoil, by creating works of eternity as their calls for
idealities. The course of history is a cyclical loop. In the present day of the twenty-first century, the world is also facing
challenges posed by economic changes and impacts caused by contradicting forces.
In the latest issue of the World Economic Outlook, the International Monetary Fund pointed out that risks were being
tilted towards emerging markets, under the weak rally of the global economic growth and the uneven pace of picking
up in different economies. Developed economies will recover moderately, whilst emerging markets and developing
economies will find themselves in the new reality of slackened growth. According to the latest forecast, the global
economy will grow by 3.4% in 2016 and 3.6% in 2017, a slight dip from the forecast released in October 2015.
As the second largest economy in the world, China still represents an important engine to drive the global economy.
Nevertheless, the transformation of China’s economy from investment and manufacturing to consumption and service
industries has brought forth slowdown in the nation’s economic development. China’s focus will be on how to create
favourable economic conditions, foster reform of industrial structure and maintain moderate economic growth.
According to Xi Jinping, the president of China, year 2016 will be the first year of the nation’s 13th Five-year Plan.
Reforms shall steer towards building a “comprehensively well-off society” and towards establishing new development
mechanisms, grasping key areas, focusing on key issues, clarifying responsibilities and enforcing strictly, to ensure that
the expected results will be delivered in all aspects of the reform. The forces to drive the nation’s economic growth will
come, firstly, from the deeds and determinations for the comprehensive intensification of reforms and establishment
of a new mechanism of an open economy and, secondly, from the internal force to be generated from China’s robust
economic momentum and the strong and effective policy guidance from the government.
Hong Kong is facing multiple challenges, including economic slowdown in Mainland China, rising trend of interest rate in
the United States, as well as deceleration of industrial development internally. Buoyed by the flexible policy management
and advanced regulatory standards, Hong Kong’s capital market, commodities market and labour market are expected to
swiftly adjust themselves. It is generally expected that the territory has sufficient buffer in place to guard itself against
the risks arising from downside pressure.
For more than four decades since its inception, New World Group has worked in tandem with the development of
China as well as Hong Kong. The vision of flexible management, extensive experience and the steadfast belief of our
team have contributed to a solid development foundation of the Group and enabled it to weather the ups and downs
of global economic development. “Be reminded to be vigilant in peace time, get prepared for dangers, and stay free
from calamity with such preparations”, as a Chinese saying goes, shall be the best ways to prepare for any impending
challenges and future economic changes.

New World Development Company Limited CHAIRMAN’S STATEMENT 4
Adhering to its creative and open mindset, the Group will continue to listen attentively to its customers, pursue
development opportunities and room for improvement, and work strenuously on its property development business, to
create for the general public a new experience of life and living which is uniquely available from the New World brand,
and maximise the interests of our stakeholders.
Dr. Cheng Kar-Shun, HenryChairman
23 February 2016
EXECUTIVE VICE CHAIRMAN’S REPORT
Interim Report 2015/2016 EXECUTIVE VICE-CHAIRMAN’S REPORT 5
Business ReviewFor the first half of FY2016, the Group recorded revenues amounted to HK$33,778.2 million, up 25%. Profit attributable
to shareholders of the Company amounted to HK$3,300.0 million. The Group’s underlying profit amounted to
HK$3,281.4 million. If excluding exchange difference attributable to NWD, the Group’s underlying profit amounted to
HK$4,349.4 million, maintained stable year-on-year.
Hong Kong Property DevelopmentAmidst the international economic sentiment, the development of interest rate hike in the United States, and the
Hong Kong SAR Government policies on the property market, Hong Kong’s residential property transaction volume
experienced volatile in 2015. According to the Hong Kong Rating and Valuation Department, the total transaction volume
of first-hand sales and purchases of private residential units in 2015 was 16,826, representing a slight decrease of 0.2%
from the previous year. Taking the macro economic environment into account, some potential home-buyers adjusted
their pace of purchases. In view of such trend, most developers were eager to provide various concessionary offers or
adopt a close-to-market pricing strategy to boost market sentiment. With the more prudent attitude taken by potential
home-buyers as well as the ongoing inadequacy of supply on the market, buyers’ resources tend to be steered towards
premium brands and products with superior quality at prime locations, enabling high-quality projects to stand out from
the crowd.
New World Development emphasises the need to create bespoke products and listen attentively to the voice of
customers, blending artisanal elements to exemplify the tastes and atmosphere which are uniquely embraced by the
Group’s brand, to provide the best choice to home-buyers. Together with the revenue from the joint-development
projects, the Group’s revenue and segment contributions from property development in Hong Kong during the period
under review amounted to HK$11,450.8 million and HK$2,767.2 million respectively, representing an increase of 146%
and 14% year-on-year. The contributions from property sales was mainly attributable to the sales of residential units
completed and recognised within this financial year, including “THE PAVILIA HILL” in North Point, “THE PARKHILL” in
Yuen Long and “Double Cove Starview Prime” in Ma On Shan, together with the sales of residential projects completed
in previous financial years.
During the period under review, the Group’s attributable contracted sales in Hong Kong amounted to HK$2.8 billion.
Taking into account the full year from January to December in 2015, the Group’s attributable contracted sales in Hong
Kong would have amounted to HK$6.6 billion. The four residential projects launched by the Group during the period
under review are as follows:
Initial sales Name of projectAttributable
to the Group Location
Total number ofresidential
units July 2015 SKYPARK 100% Mong Kok 439August 2015 Double Cove Grandview 32% Ma On Shan 474October 2015 THE PARKHILL 100% Tong Yan San Tsuen 141December 2015 55 Conduit Road 30% Mid Level West 35
The Group has actively reviewed the momentum of launching new residential projects by assessing market conditions
and the needs of home-buyers. “BOHEMIAN HOUSE” in Western District, which is the latest residential project of
the Group under the BOHEMIAN series on Hong Kong Island and located at close proximity to Sai Ying Pun MTR
station, provides 191 residential units which are mostly one-bedroom or two-bedroom units. The project will uphold the
uniqueness of spirit of artisanal architecture embodied by “EIGHT SOUTH LANE” in Western District and “EIGHT KWAI
FONG” in Happy Valley, to provide distinctive experience to the home-buyers.

New World Development Company Limited EXECUTIVE VICE-CHAIRMAN’S REPORT 6
MOUNT PAVILIA, a project of the Group at a luxury residence on Clear Water Bay, will provide 680 residential units
offering a blended mix of layouts. Apart from the aforesaid, the Group also plans to launch new residential projects
including “FLEUR PAVILIA” in North Point, “Double Cove Summit” in Ma On Shan and Tsuen Wan West Station
project, to bring strong momentum to the Group’s Hong Kong property sales business.
Hong Kong LandbankThe Group has made use of various channels to replenish its Hong Kong landbank. Apart from public auction and tender,
the Group has also pursued diversified means, including old building acquisition and agricultural land conversion, so that
a stable supply of land resources will be available to the Group for property development as well as strategic planning
in the long run. As at 31 December 2015, the Group possessed a landbank with attributable GFA of around 8.9 million
sq ft for immediate development. Of which, attributable residential GFA amounted to approximately 5.3 million sq ft.
Meanwhile, the Group had a total of approximately 17.0 million sq ft of attributable agricultural land area reserve in the
New Territories pending for conversion, which are mainly located in the northwest of New Territories.
Attributable GFA
Landbank by location (sq ft)
Central and Western District 175,346Eastern District 1,053,888Yau Tsim Mong District and Kwun Tong District 3,605,269Tsuen Wan District, Yuen Long District and Tuen Mun District 786,180Sha Tin District and Sai Kung District 3,220,188Others 107,920
Total 8,948,791
Total land area
Attributable land area
Agricultural landbank by location (sq ft) (sq ft)
Yuen Long District 12,951,976 11,949,418Fanling District 2,329,460 1,987,460Sha Tin District and Tai Po District 1,945,090 1,945,090Sai Kung District 1,357,540 1,160,529Tuen Mun District 28,260 28,260
Total 18,612,326 17,070,757
The Group has been actively carrying out old building acquisitions for sizeable redevelopment projects. Acquisition of
over 80% ownership of 4A-4P Seymour Road in Mid-levels has been completed under a joint-development old building
redevelopment project that the Group has 35% stake. The site area is 52,466 sq ft. With reference to the government’s
latest town planning, the permitted attributable GFA of this project upon redevelopment is approximately 472,000 sq ft
and 165,300 sq ft attributable for the Group. This project has proceeded to the court for compulsory sale under the “Land
(Compulsory Sale for Redevelopment) Ordinance”.

Interim Report 2015/2016 EXECUTIVE VICE-CHAIRMAN’S REPORT 7
Furthermore, acquisition of over 80% ownership of 74–74C Waterloo Road and 15–25 Yau Moon Street in Ho Man
Tin has been completed under a joint-development old building redevelopment project that the Group has 51% stake.
This project has a site area of 10,682 sq ft. With reference to the government’s latest town planning, the expected
attributable residential GFA of this project upon redevelopment is approximately 49,000 sq ft. This project has proceeded
to the court for compulsory sale under the “Land (Compulsory Sale for Redevelopment) Ordinance”.
In January 2016, the Group won the development contract of Urban Renewal Authority’s Kowloon City Road/Sheung
Heung Road project in Ma Tau Kok. Located alongside the Kowloon section of the Shatin to Central Link of the MTR
under construction, the project has a site area of approximately 15,000 sq ft. Upon completion, the project is expected
to provide residential GFA of approximately 110,000 sq ft, about 216 residential units.
Hong Kong Investment PropertyThe excess demand for superior offices at prime commercial areas and the continual trend of China enterprises
establishing their presence in Hong Kong, have continued to provide sound support for the rental performance of Grade
A office buildings in Hong Kong. In November 2015, the vacancy of Grade A office buildings in Central dropped to 1.2%,
while the vacancy of Grade A office buildings in Hong Kong in general maintained at a low level of 2.9%.
For the leasing of retail shops, the retail market of Hong Kong has reached a critical point of structural adjustment, after
a period of stable development of local consumption under favourable economic sentiment and low unemployment
rate, following the change of mix of inbound travelers from Mainland China and their consumption pattern, and in the
aftermath of the spanking expansion of selected major international luxury brands in Hong Kong over the past years.
Vacancy rate of those retail shops at core retail areas has been rising, after the removals of certain high-end luxury
brands. For shopping malls, on the other hand, many landlords had in recent years proactively reviewed their projects,
enhanced the variability in physical facilities and reshuffled the brand and retail mix, catering for the changing consumer
taste and in turn stabilising the rental performance of the projects.
During the period under review, the Group’s gross rental income in Hong Kong amounted to HK$780.0 million,
representing an increase of 8%. The leasing projects also attained satisfactory occupancy. Tsim Sha Tsui K11, which is
located in a traditional core retail and tourism district, recorded an occupancy of almost 100% during the period under
review, with an average monthly pedestrian flow of approximately 1.4 million. As an international high-end artisanal
brand, a revolutionary museum with retail experience, K11 has been a popular spot for local consumers, with up to 80%
of its traffic from local customers. In order to uplifting the shopping experience, several new brands have been recruited
at Tsim Sha Tsui K11 in 2015.
For D•PARK in Tsuen Wan, a cross-border transportation hub in the western part of Hong Kong, the renovation works
were nearing full completion. Aiming at optimising its tenant mix, D•PARK will deliver a brand-new image under a new
logo, to signify a hotspot for pleasant enjoyment of family activities as well as a great place for shopping. To cater the
needs of local families and those young customers who are keen on tastes of living, tenant mix has been carefully
selected, including the exclusive introduction of E•LAND, the largest apparel group in Korea. In addition, 70% of the
stores in D•PARK incorporated kid elements to fully address the demand of children products.
Qianhai Chow Tai Fook Global Goods Shopping Center, which has been jointly developed by wholly owned subsidiaries
of Chow Tai Fook Enterprises, Chow Tai Fook Jewellery and New World Development, opened under its phase 1 and
started trial run in December 2015. Located in Qianhai, Shenzhen with a site area of approximately 11,000 sq m and a
total GFA of approximately 19,000 sq m, the project will be completed in two phases, with phase 1 occupying a total
floor area of 7,000 sq m and phase 2 occupying a total floor area of 12,000 sq m. An innovative shopping platform which
gathers online and offline resources and integrates smartness, shopping and recreation, Qianhai Chow Tai Fook Global

New World Development Company Limited EXECUTIVE VICE-CHAIRMAN’S REPORT 8
Goods Shopping Center is a marketplace where Hong Kong merchants establish their presence and primarily provide
high-quality globally-sourced commodities and Hong Kong-style services. It offers a good variety of products to fully
address the shopping, catering and entertainment needs of families. An innovative dual operation model is adopted,
comprising both “bonded display” and “cross-border e-commerce”. Apart from sales service available in a physical
shop, online shopping service is also available from a number of merchants under “bonded display” and “cross-border
e-commerce”, providing consumers with the enjoyment and convenience under diversified shopping options. Pedestrian
flow already reached 250,000 on the first Sunday after the trial run started.
For office buildings, New World Tower and Manning House, both being Grade A office buildings located in the traditional
prime commercial area in Central, achieved satisfactory performance in terms of occupancy and rental rates. New World
Tower is undergoing an asset enhancement programme to meet the new market leasing demand. The enhancement
works of the lobby on ground floor was completed. Its office lobbies and other major facilities are gradually being
upgraded.
New World Centre redevelopment project located at the core area of Tsim Sha Tsui promenade is currently progressing
as scheduled. The underground retail space at 12 Salisbury Road Tsim Sha Tsui will be altered in parallel with the
redevelopment project of the adjacent New World Centre.
Hotel OperationsThe change in external market environment and policies in the region have varied the previous pattern of development
of the tourism and hospitality industry, with heavy reliance on the rapid year-on-year growth in visitor arrivals at Hong
Kong over the past few years. Adjustment in the overall occupancy and average room rate of hotels in Hong Kong was
experienced. However, for those Tariff A hotels which target business travellers, the consolidation were relatively minor
under the robust economic activities in the region and the drive from the customer loyalty programme, in addition to the
limited availability of new supply of hotels in the same grading in recent years.
During the period under review, the segment results in hotel operations reported a decrease, mainly due to three
causes: first, the aforesaid changes of the industrial landscape of Hong Kong tourism and hospitality; second, as a result
of the disposed of interest in three hotels in Hong Kong, namely Grand Hyatt Hong Kong, Renaissance Harbour View
Hotel and Hyatt Regency Hong Kong, Tsim Sha Tsui, to a joint venture company formed with Abu Dhabi Investment
Authority in June 2015, the share of result contribution of the three hotels have been reduced and; third, financing cost
was incurred by that joint venture company for the acquisition of the hotels.
The Group’s premium hotels in Hong Kong targeted at business travellers have become major contributors to the result
of the Group’s hotel operations. The phase two renovation of approximately 158 guest rooms at Grand Hyatt Hong
Kong is currently underway with good progress. Despite the impact on occupancy caused by the renovation during the
period under review, the hotel’s average room rate achieved at a satisfactory level. Benefiting from the continual growth
of conventions and exhibitions, Renaissance Harbour View Hotel, which is adjacent to Hong Kong Convention and
Exhibition Centre, reported satisfactory occupancy rate, with solid performance in its average room rate.
Hyatt Regency Hong Kong, Tsim Sha Tsui, centrally located in the core of Kowloon peninsula, achieved an average
occupancy of 89% and an average room rate around HK$2,000 per night during the period under review. Hyatt Regency
Hong Kong, Sha Tin, which is adjacent to University Station on MTR East Rail Line, reached an average occupancy
of 83% and average room rate around HK$1,300 per night during the period under review. pentahotel Hong Kong,
Kowloon, which is located near the Kai Tak Cruise Terminal in Kowloon East, targets young fashionable gurus and
travellers looking for novel experience. It attained an average occupancy of 82% and reported satisfactory performance
in its average room rate during the period under review.
Interim Report 2015/2016 EXECUTIVE VICE-CHAIRMAN’S REPORT 9
On 20 November 2015, the Group entered into an agreement with Chow Tai Fook Enterprises Limited to purchase
36% of the entire issued shares of Beames Holdings Limited (“Beames”) and the entire amount of unsecured and non-
interest bearing shareholder’s loan at an adjusted consideration of approximately HK$3,592.8 million. Beames owns and
operates various hotel properties in Hong Kong and Southeast Asia, including certain attributable interests in Rosewood
Beijing, Renaissance Riverside Hotel Saigon, New Word Hotel Saigon, New World Makati Hotel, Grand Hyatt Hong
Kong, Renaissance Harbour View Hotel and Hyatt Regency Hong Kong, Tsim Sha Tsui and Shun Tak Centre Shopping
Mall in Hong Kong.
Through the acquisition of further interests in Beames, the Group will effectively consolidate the Group’s interest in
hotel properties, which is consistent with the core business strategies of the Group. Besides streamlining the structure
of Beames, the increase in stake in the hotel properties will provide flexibility and a wider platform for investments
which will enhance recurrent income and facilitate future merger or joint venture opportunities.
As at 31 December 2015, the Group had a total of 18 hotel properties providing over 8,000 guest rooms in Hong Kong,
Mainland China and Southeast Asia.
Mainland China PropertiesDuring the period under review, New World China Land Limited (“NWCL”) achieved a profit attributable to shareholders
of HK$542.2 million. Taking into account the revenue from the joint-development projects, the revenue and segment
results from property development in Mainland China during the period under review amounted to HK$6,369.7 million
and HK$1,286.1 million respectively. The contribution from property development in Mainland China was mainly
attributable to the sales of the projects located in Guangzhou, Shenzhen, Shenyang, Tianjin, Langfang, Wuhan and
Zhaoqing.
During the period under review, the overall contracted property sales of NWCL reached a total GFA of 734,426 sq m and
the gross sales proceeds amounted to RMB12.3 billion.
During the period under review, NWCL’s completed property development projects for sale in Mainland China amounted
to a total GFA of 237,535 sq m, of which residential GFA amounted to 114,021 sq m. In FY2016, it is anticipated to
complete property development projects totalling a GFA of 813,765 sq m in Mainland China, of which residential GFA
will amount to 578,059 sq m.
For property leasing in Mainland China, the opening of Shanghai K11 Art Mall has enhanced the patronage, occupancy
and rental performance of Shanghai Hong Kong New World Tower. Furthermore, positive rental reversion has been
achieved for Wuhan New World International Trade Tower upon tenancy renewal. The abovementioned factors have
provided upside support to NWCL’s rental businesses.
In December 2015, NWCL successively disposed of interests of several projects in Wuhan, Haikou, Huiyang, Guiyang
and Chengdu, involving a total amount of RMB20.8 billion. The aforesaid transactions are in line with the Group’s existing
strategy and have evidenced the Group’s achievements in effective allocation of resources and asset enhancement. It
will also simplify the Group’s strategy of optimising its project development and investment portfolio by scaling down
investment in second and third-tier cities and putting more resources in first-tier and 1.5 tier cities.

New World Development Company Limited EXECUTIVE VICE-CHAIRMAN’S REPORT 10
InfrastructureRiding on the economic development in the Pearl River Delta Region and implementation of toll-by-weight policy since
June 2015, all the expressways in Guangdong registered growth in both traffic volume and toll revenue. Toll revenue
of Hangzhou Ring Road grew by 2% despite a 1% drop in traffic volume. The improvement works to alleviate the
bottleneck in the western section during peak hours will be completed in the second half of FY2016. Average daily traffic
flow of Tangjin Expressway (Tianjin North Section) surged by 58% due to the resumption of two-way traffic after the
completion of expansion works in December 2014 and traffic diversion from the temporary closure of a competing road
following the local explosion incident in August 2015.
Notwithstanding the decline in fuel prices, weakening electricity demand, competition from renewable energy and
rigorous emission controls continued to exert pressure on coal-fired power plant operators. Electricity sales of both
Zhujiang Power Plants and Chengdu Jintang Power Plant fell by 19% during the period under review. In January 2016,
the average coal-fired benchmark on-grid tariff in Mainland China was cut by RMB0.03/kWh or 7%.
Sales volume of Chongqing Water Plant and Jiangsu Water Company increased by 7% and 13% respectively during
the period under review. In Macau, sales volume of Macau Water Plant grew slightly by 1% and a tariff hike of 4.3%
became effective in October 2015.
Pursuant to the agreement between Chongqing Water Assets Management Co., Ltd and a joint venture with Suez
Environment, NWS Holdings Limited (“NWSH”) attained an indirect interest of 12.55% in Chongqing Derun Environment
Co., Ltd (“Derun Environment”), a RMB30.0 billion platform to invest in environmental-related business in Mainland
China in December 2015. The consideration for the interest in Derun Environment was substantially met by the injection
of NWSH’s indirect interest in Chongqing Water Group Co., Ltd. Accordingly, NWSH shared a deemed disposal gain of
HK$179.3 million during the period under review.
To capture the growing demand for air transportation, NWSH entered the commercial aircraft leasing business by
acquiring 40% equity interest in Goshawk Aviation Limited (“Goshawk”) in February 2015. As evidenced by Goshawk’s
fast expanding fleet that grew from 27 aircrafts at time of acquisition to 53 aircrafts as at 31 December 2015, this
business will serve as an important growth impetus for NWSH in the years to come.
Throughput handled by Xiamen Container Terminal Group Co., Ltd. (“XCTG”) reached 4,079,000 TEUs for the current
period, representing a healthy growth of 12%. Following the acquisition of 6.2% interest in September 2015 as
previously reported, NWSH’s stake in XCTG has increased to 20%.
With the introduction of containerized break-bulk cargoes transportation in January 2015 and the increasing demand for
international block train services, throughput handled by China United International Rail Containers Co., Limited grew
6% to 979,000 TEUs during the period under review. To meet the business growth, the expansion works to double the
handling capacity at Chongqing terminal were completed in December 2015 while the new Tianjin and Urumqi terminals
are scheduled to be completed in 2016 and 2017 respectively.
ATL Logistics Centre continued to register strong growth as average rental increased by 16% in the period under
review, which was partly boosted by the rental adjustment of a major tenant. Its occupancy rate decreased from 99.5%
to 97.8% due to transitional vacancy upon lease renewals during the period under review.

Interim Report 2015/2016 EXECUTIVE VICE-CHAIRMAN’S REPORT 11
ServiceDuring the period under review, 587 events were held at Hong Kong Convention and Exhibition Centre (“HKCEC”) with
a total patronage of approximately 3.7 million. Furthermore, HKCEC reached a significant milestone in its sustainability
efforts by becoming the first organisation in Hong Kong to achieve the ISO 20121 Event Sustainability Management
System recognition.
A reduction in the number of high-spending visitors from Mainland China and the continual contraction of inbound
tourism have negatively impacted Free Duty’s business. Coupled with the rising operating costs, the profit contribution
from this business declined. However, in light of the promising growth potential at the Lok Ma Chau terminal and the
Macau International Airport and the successful renewal of concession contracts at Macau Ferry Terminal and China
Hong Kong Ferry Terminal to 2018, NWSH remains cautiously optimistic on the sales outlook despite the headwinds.
Contribution from the construction business increased encouragingly in the first half of FY2016 mainly due to the
continuous improvement in gross profit through effective project management. As at 31 December 2015, the gross
value of contracts on hand for the construction business was approximately HK$75.3 billion.
The competition from the MTR West Island Line continues to exert pressure on ridership of transport business although
such impact was compensated by the patronage increase for airport bus services and the lower fuel costs.
The construction of Gleneagles Hong Kong Hospital is making good progress and the hospital is expected to commence
operations in early 2017.
Department StoresChina’s economic growth continued to slow down. The intensified competition brought by e-commerce and shopping
malls, coupled with consumers’ diverse needs and rising operating expenses, continued to impact the operating
environment of the department store sector in Mainland China. In response to the structural changes in the market
and the industry, the department store sector was actively pursuing fundamental transformation, such as more precise
market positioning and optimised merchandise and service portfolio, especially the focus on developing online and
offline shopping platform.
During the period under review, New World Department Store China Limited (“NWDS”) recorded a profit attributable to
shareholders of HK$59.8 million. The commission income from concessionaire sales was the major income contributor
to NWDS, accounting for 55% of the total revenue. Proceeds from direct sales and rental income accounted for 27%
and 17% respectively of the total revenue. The remaining 1% was derived from management and consultancy fees.
Region-wise, Northern China Region contributed the most to the revenue of NWDS, amounting to 50.6% of total
revenue, followed by the South Eastern China Region and the Central Western China Region, which accounted for
31.2% and 18.2% of the total revenue respectively.
As at 31 December 2015, NWDS operated and managed a total of 41 stores and two shopping malls spreading across
21 cities in Mainland China with total GFA of over 1.6 million sq m.
OutlookThe contradictions arising from the complicated economic landscape around the globe further intensified in 2015.
Among developed economies, the United States stood out from the crowd in its economic performance. Despite the
unstable engines which drove its key economic indicators, the United States delivered sound attainments which were
sufficient to lead their Federal Reserve System to kick off, towards the end of 2015, the first interest rate rise ever since
the financial crisis in 2008. Other advanced markets in Europe still remained fragile in their economic recovery. The
overall economic performance of the Eurozone is worrying, with an elevating risk of deflation.

New World Development Company Limited EXECUTIVE VICE-CHAIRMAN’S REPORT 12
Various emerging markets experienced suppressed economic performance, and their contribution to the global
economic growth decreased for the fifth consecutive year. Market concerns over the prospects of growth of emerging
markets have resulted in waves of fluctuations in the financial market and triggered tightened external financial
conditions, diminished capital flow and depreciation of currency, which contributed to the deterioration of capital outflow
in parallel with the eventual kicking off of interest rate rise in the United States in 2015. Measures to introduce negative
interest rate have been adopted recently in Japan to stimulate its weak economy.
China economic growth was up to market expectations, albeit a faster-than-expected slowdown of its import and export
under dampened investment and manufacturing activities. The Central Government of China had previously warned
of a new norm of transformation under which its economy would progress while maintaining stability, as opposed to
the rapid growth in the past, pursuant to the structural adjustment of the nation’s economy. Nevertheless, the risk of
China’s economic correction has been augmented, given the Central Government’s forthcoming enforcement of its goal
of eliminating excessive capacity and lowering leverage, which will imply the suspension of the initiative of speeding up
investment spending or the expansion of the balance sheets of local governments in the coming years, and in light of
the heightened downward pressure of the Renminbi and the impending reform of exchange rate of the Renminbi.
The International Monetary Fund (“IMF”) is of the view that the transformation of Mainland China’s economy from
investment and manufacturing to consumption and service industries, together with the strengthened United States
Dollar, plummeting oil price and political turmoil, may likely bring forth more tremendous impact on those economies in
struggle, including Russia, Brazil and Middle East countries, posing challenges to the recovery of the global economy in
2016. The forecast for global economic growth has been downward-adjusted by the IMF to 3.4% in 2016 and 3.6% in
2017.
As a small and open economy, Hong Kong is facing multiple challenges, including economic slowdown in Mainland
China, the trend of rising interest rate in the United States, as well as development deceleration of different sectors
internally. Fortunately, moderate growth was still recorded for Hong Kong in the third quarter of 2015, with a year-on-
year growth of 2.3%, which compared to 2.8% in the second quarter of the year. The labour market remained stable
in general. The seasonally-adjusted unemployment rate stayed at 3.3%, close to the lowest level in 17 years. Private
spending maintained its robust growth, benefiting from the fairly stable employment and income in the past few
quarters.
The expected slower and uneven economic growth around the world will represent the major challenges to all industries
in 2016. For the property market in Hong Kong, the kicking off of interest rate rise in December 2015 in the United
States has already relieved the property market from a major hindrance. It is generally expected that the pace of further
rate rise in the United States in 2016 will be fine-tuned depending on the actual market development on the whole.
Regarding customer demand, product quality and geographic advantages of particular projects are the primary factors
to consider for home upgraders who have adequate monetary resources, following the low-interest environment and
appreciation of fixed assets over the years. In fact, excess demand still remained for first-hand residential dwellings,
especially for competitive products. That shall add to the sustainably-rising household income and population as well
as the reasonable level of mortgage-to-income ratios to support the healthy and stable development of the residential
property market of Hong Kong.
The endless pursuit of idealities, the continual development amidst challenges, the tackling of obstacles and difficulties
upon flexible mindsets, the harmonious reconciliation of contradictions and the eventual accomplishments, are the sole
gateway to the continuation of the human spirits in the contemporary world.
Interim Report 2015/2016 EXECUTIVE VICE-CHAIRMAN’S REPORT 13
“We Create, We are Artisans!” Under The Artisanal Movement, which marks a new page for the development of the
New World brand, unique brand characters will be seen in all developments of the Group. This will be a journey of
exploring unlimited imagination, one that will gather all of New World Group’s bespoke craftsmanship and innovative
living experience in bringing modern life to a standard close to historic perpetuity. Through The Artisanal Movement, the
Group looks forward to providing customers with fine living experience with a mix of superb craftsmanship, traditional
culture and the use of upmarket materials. The customised living environment embraced by craftsmanship and
aesthetics, where dreams come true and imagination is explored, ideally gives rise to a type of unique culture and quality
of modern life.
For property development in Hong Kong, the Group launched a series of finely-designed bespoke projects which
received overwhelming market responses. The Group will work hard on the preparations for new launches for projects
including “BOHEMIAN HOUSE” in Western District, “MOUNT PAVILIA” in Clear Water Bay, “FLEUR PAVILIA” in North
Point and Tsuen Wan West Station project. It is expected that a total of more than 2,900 new residential units will be
launched to the market, becoming new driver for the Group’s property sales in Hong Kong.
For sustaining a quality landbank in Hong Kong, the Group will carefully identify and select development opportunities to
expand its landbank in Hong Kong with reference to future market supply and consumption preference of home buyers.
Taking into account the flexibility provided for under the development conditions of the respective projects, the Group
will strive to secure unique land resources of premium quality to support the Group’s sustainable development.
For property rental in Hong Kong, in response to the changing structure and consumption patterns of local consumers
and those from Mainland China, the revolutionary formation of the world’s first museum retail concept by K11
represented a ground-breaking initiative for the retail market to depart from tradition and mingle art with business,
creating new consumption experience and brand equity. Riding on various brand concepts, the Group solidified the
tenant mix and introduced new logos and mall design, turning D•PARK into the first land-marking shopping mall in the
western part of New Territories for the enjoyment of family activities, and extending the reach of its retail presence
with a multitude of brands. For the redevelopment of New World Centre, located at the core area of Tsim Sha Tsui
promenade, construction is being carried out as scheduled.
The Group will continue to uplift the value of the New World brand and focus on the two core businesses namely
property sales and property rental, adhering to the key strategy of structure and resources optimisation and
strengthening synergy internally to further enhance its competitiveness. Meanwhile, the Group will listen attentively to
market needs and customers’ feedback. With our spiritual unity, forward-looking vision and bespoke craftsmanship, we
strive to create differentiated products and services of top quality, explore and generate bespoke and unique experience
for customers, so as to consolidate the superior market standing of the New World brand and maximise the interests of
our stakeholders.
Dr. Cheng Chi-Kong, AdrianExecutive Vice-chairman and Joint General Manager
23 February 2016

CONDENSED CONSOLIDATED INCOMESTATEMENT UNAUDITEDFor the six months ended 31 December 2015
New World Development Company Limited CONDENSED CONSOLIDATED INCOME STATEMENT – UNAUDITED 14
2015 2014
Note HK$m HK$m
Revenues 3 33,778.2 26,986.3
Cost of sales (23,708.9) (17,230.5)
Gross profit 10,069.3 9,755.8
Other income 71.1 4.3
Other (losses)/gains, net (163.5) 425.9
Selling and marketing expenses (806.5) (854.2)
Administrative and other operating expenses (3,893.5) (4,132.2)
Changes in fair value of investment properties 36.7 1,811.3
Operating profit 4 5,313.6 7,010.9
Financing income 435.4 518.8
Financing costs (744.7) (910.7)
5,004.3 6,619.0
Share of results of
Joint ventures 863.0 3,351.8
Associated companies 376.7 (805.2)
Profit before taxation 6,244.0 9,165.6
Taxation 5 (1,752.4) (1,941.1)
Profit for the period 4,491.6 7,224.5
Attributable to:
Shareholders of the Company 3,300.0 5,854.6
Non-controlling interests 1,191.6 1,369.9
4,491.6 7,224.5
Earnings per share (HK$) 6
Basic 0.37 0.68
Diluted 0.37 0.68

CONDENSED CONSOLIDATED STATEMENT OF COMPREHENSIVE INCOME UNAUDITEDFor the six months ended 31 December 2015
Interim Report 2015/2016 CONDENSED CONSOLIDATED STATEMENT OF COMPREHENSIVE INCOME – UNAUDITED 15
2015 2014
HK$m HK$m
Profit for the period 4,491.6 7,224.5
Other comprehensive incomeItems that will not be reclassified to profit or loss
Remeasurement of post employment benefit obligation (0.3) –
Reversal of reserve upon reclassification of an available-for-sale
financial asset as an associated company – 717.2
Items that had been reclassified/may be reclassified subsequently to profit or loss
Fair value changes of available-for-sale financial assets (633.9) 224.2
– deferred tax arising from fair value changes thereof (1.1) (103.2)
Release of reserve upon disposal of available-for-sale financial assets (239.7) (13.4)
Release of reserves upon disposal of subsidiaries (4.2) (10.1)
Share of other comprehensive income of joint ventures and
associated companies (1,230.9) 104.9
Cash flow hedges (0.4) 9.1
Translation differences (2,827.1) 980.6
Other comprehensive income for the period (4,937.6) 1,909.3
Total comprehensive income for the period (446.0) 9,133.8
Attributable to:
Shareholders of the Company (96.7) 7,228.7
Non-controlling interests (349.3) 1,905.1
(446.0) 9,133.8

CONDENSED CONSOLIDATED STATEMENT OF FINANCIAL POSITION UNAUDITEDAs at 31 December 2015
New World Development Company Limited CONDENSED CONSOLIDATED STATEMENT OF FINANCIAL POSITION – UNAUDITED 16
As at31 December
2015
As at
30 June
2015
Note HK$m HK$m
ASSETSNon-current assets
Investment properties 89,903.3 91,625.0
Property, plant and equipment 21,436.4 20,483.8
Land use rights 2,129.6 2,343.4
Intangible concession rights 8 13,633.4 14,797.8
Intangible assets 9 2,805.0 2,864.1
Interests in joint ventures 48,971.8 49,451.9
Interests in associated companies 18,263.2 17,731.7
Available-for-sale financial assets 12,660.9 6,909.2
Held-to-maturity investments 42.1 41.4
Financial assets at fair value through profit or loss 706.2 847.0
Derivative financial instruments 39.5 39.5
Properties for development 21,220.0 26,604.5
Deferred tax assets 664.0 673.3
Other non-current assets 1,727.1 1,770.4
234,202.5 236,183.0
Current assetsProperties under development 43,877.4 51,578.4
Properties held for sale 22,224.9 26,375.5
Inventories 843.6 707.5
Debtors and prepayments 10 20,209.1 21,227.9
Financial assets at fair value through profit or loss 0.2 0.2
Derivative financial instruments 21.2 30.4
Restricted bank balances 148.5 113.5
Cash and bank balances 64,550.0 59,351.7
151,874.9 159,385.1
Non-current assets classified as assets held for sale 11 23,605.4 2,362.6
175,480.3 161,747.7
Total assets 409,682.8 397,930.7
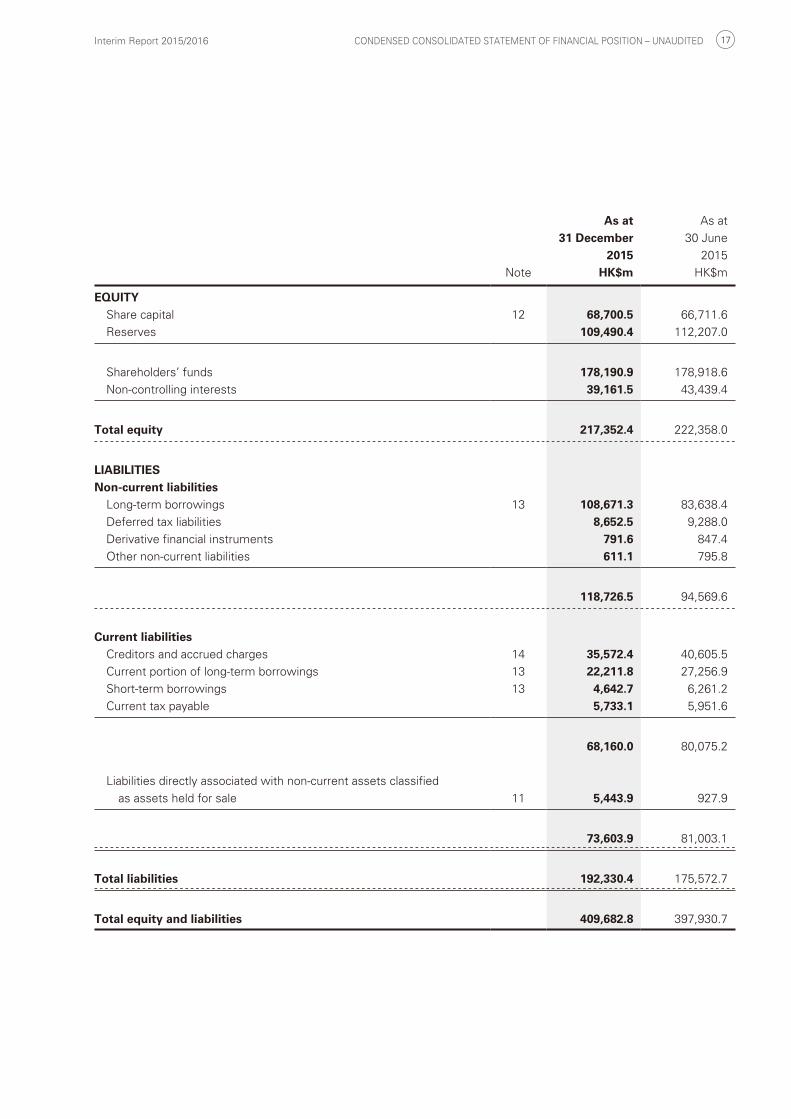
Interim Report 2015/2016 CONDENSED CONSOLIDATED STATEMENT OF FINANCIAL POSITION – UNAUDITED 17
As at31 December
2015
As at
30 June
2015
Note HK$m HK$m
EQUITYShare capital 12 68,700.5 66,711.6
Reserves 109,490.4 112,207.0
Shareholders’ funds 178,190.9 178,918.6
Non-controlling interests 39,161.5 43,439.4
Total equity 217,352.4 222,358.0
LIABILITIESNon-current liabilities
Long-term borrowings 13 108,671.3 83,638.4
Deferred tax liabilities 8,652.5 9,288.0
Derivative financial instruments 791.6 847.4
Other non-current liabilities 611.1 795.8
118,726.5 94,569.6
Current liabilitiesCreditors and accrued charges 14 35,572.4 40,605.5
Current portion of long-term borrowings 13 22,211.8 27,256.9
Short-term borrowings 13 4,642.7 6,261.2
Current tax payable 5,733.1 5,951.6
68,160.0 80,075.2
Liabilities directly associated with non-current assets classified
as assets held for sale 11 5,443.9 927.9
73,603.9 81,003.1
Total liabilities 192,330.4 175,572.7
Total equity and liabilities 409,682.8 397,930.7
CONDENSED CONSOLIDATED STATEMENT OF CHANGES IN EQUITY UNAUDITEDFor the six months ended 31 December 2015
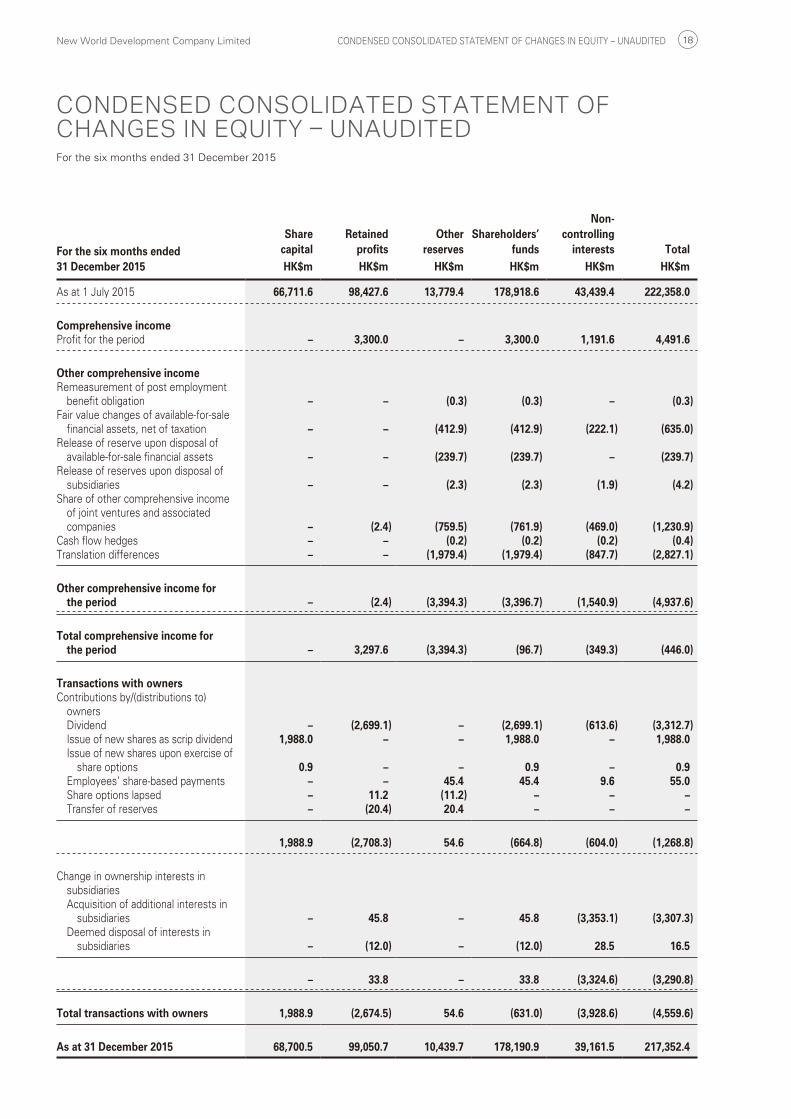
New World Development Company Limited CONDENSED CONSOLIDATED STATEMENT OF CHANGES IN EQUITY – UNAUDITED 18
For the six months ended 31 December 2015
Sharecapital
Retained profits
Otherreserves
Shareholders’funds
Non-controlling
interests TotalHK$m HK$m HK$m HK$m HK$m HK$m
As at 1 July 2015 66,711.6 98,427.6 13,779.4 178,918.6 43,439.4 222,358.0
Comprehensive incomeProfit for the period – 3,300.0 – 3,300.0 1,191.6 4,491.6
Other comprehensive incomeRemeasurement of post employment
benefit obligation – – (0.3) (0.3) – (0.3)Fair value changes of available-for-sale
financial assets, net of taxation – – (412.9) (412.9) (222.1) (635.0)Release of reserve upon disposal of
available-for-sale financial assets – – (239.7) (239.7) – (239.7)Release of reserves upon disposal of
subsidiaries – – (2.3) (2.3) (1.9) (4.2)Share of other comprehensive income
of joint ventures and associated companies – (2.4) (759.5) (761.9) (469.0) (1,230.9)
Cash flow hedges – – (0.2) (0.2) (0.2) (0.4)Translation differences – – (1,979.4) (1,979.4) (847.7) (2,827.1)
Other comprehensive income for the period – (2.4) (3,394.3) (3,396.7) (1,540.9) (4,937.6)
Total comprehensive income for the period – 3,297.6 (3,394.3) (96.7) (349.3) (446.0)
Transactions with ownersContributions by/(distributions to)
ownersDividend – (2,699.1) – (2,699.1) (613.6) (3,312.7)Issue of new shares as scrip dividend 1,988.0 – – 1,988.0 – 1,988.0Issue of new shares upon exercise of
share options 0.9 – – 0.9 – 0.9Employees’ share-based payments – – 45.4 45.4 9.6 55.0Share options lapsed – 11.2 (11.2) – – –Transfer of reserves – (20.4) 20.4 – – –
1,988.9 (2,708.3) 54.6 (664.8) (604.0) (1,268.8)
Change in ownership interests in subsidiariesAcquisition of additional interests in
subsidiaries – 45.8 – 45.8 (3,353.1) (3,307.3)Deemed disposal of interests in
subsidiaries – (12.0) – (12.0) 28.5 16.5
– 33.8 – 33.8 (3,324.6) (3,290.8)
Total transactions with owners 1,988.9 (2,674.5) 54.6 (631.0) (3,928.6) (4,559.6)
As at 31 December 2015 68,700.5 99,050.7 10,439.7 178,190.9 39,161.5 217,352.4

Interim Report 2015/2016 CONDENSED CONSOLIDATED STATEMENT OF CHANGES IN EQUITY – UNAUDITED 19
For the six months ended 31 December 2014
Sharecapital
Retainedprofits
Otherreserves
Shareholders’funds
Non-controlling
interests TotalHK$m HK$m HK$m HK$m HK$m HK$m
As at 1 July 2014 63,761.3 82,746.4 13,300.6 159,808.3 40,468.2 200,276.5
Comprehensive incomeProfit for the period – 5,854.6 – 5,854.6 1,369.9 7,224.5
Other comprehensive incomeFair value changes of available-for-sale
financial assets, net of taxation – – 210.1 210.1 (89.1) 121.0Release of reserve upon disposal of
available-for-sale financial assets – – (13.4) (13.4) – (13.4)Reversal of reserve upon reclassification
of an available-for-sale financial asset as an associated company – – 439.7 439.7 277.5 717.2
Release of reserves upon disposal of subsidiaries – – (7.3) (7.3) (2.8) (10.1)
Share of other comprehensive income of joint ventures and associated companies – – 66.6 66.6 38.3 104.9
Cash flow hedges – – 5.5 5.5 3.6 9.1Translation differences – – 672.9 672.9 307.7 980.6
Other comprehensive income for the period – – 1,374.1 1,374.1 535.2 1,909.3
Total comprehensive income for the period – 5,854.6 1,374.1 7,228.7 1,905.1 9,133.8
Transactions with ownersContributions by/(distributions to)
ownersDividend – (2,599.5) – (2,599.5) (455.5) (3,055.0)Issue of new shares as scrip dividend 1,991.9 – – 1,991.9 – 1,991.9Issue of new shares upon exercise of
share options 9.2 – – 9.2 – 9.2Employees’ share-based payments – – 32.8 32.8 1.4 34.2Share options lapsed – 6.5 (6.5) – – –Transfer of reserves – 142.8 (142.8) – – –
2,001.1 (2,450.2) (116.5) (565.6) (454.1) (1,019.7)
Change in ownership interests in subsidiariesAcquisition of additional interests in
subsidiaries – (56.7) – (56.7) 65.7 9.0Deemed disposal of interests in
subsidiaries – (4.5) – (4.5) 10.3 5.8
– (61.2) – (61.2) 76.0 14.8
Total transactions with owners 2,001.1 (2,511.4) (116.5) (626.8) (378.1) (1,004.9)
As at 31 December 2014 65,762.4 86,089.6 14,558.2 166,410.2 41,995.2 208,405.4

CONDENSED CONSOLIDATED STATEMENT OF CASH FLOWS UNAUDITEDFor the six months ended 31 December 2015
New World Development Company Limited CONDENSED CONSOLIDATED STATEMENT OF CASH FLOWS – UNAUDITED 20
2015 2014
HK$m HK$m
Net cash from operating activities 3,277.6 2,162.3
Cash flows from investing activities (including the Disposal Property Group)
Additions of investment properties, property, plant and equipment,
land use rights and intangible concession rights (5,487.0) (4,260.6)
(Increase)/decrease in interests in joint ventures (574.8) 1,100.4
(Increase)/decrease in interests in associated companies (513.0) 20.1
Refund of deposits paid for potential investments in prior years – 2,375.0
Purchase of available-for-sale financial assets and financial assets
at fair value through profit or loss (7,547.5) (292.6)
Acquisition of subsidiaries (4,099.4) –
Disposal of subsidiaries 2,966.4 –
Others 1,344.6 1,598.6
Net cash (used in)/from investing activities (13,910.7) 540.9
Cash flows from financing activities (including the Disposal Property Group)
Net increase in borrowings 18,493.1 140.8
Dividend paid to shareholders of the Company (711.1) (607.6)
Dividend paid to non-controlling shareholders (613.6) (455.5)
Others (32.4) 3.2
Net cash from/(used in) financing activities 17,136.0 (919.1)
Net increase in cash and cash equivalents 6,502.9 1,784.1
Cash and cash equivalents at beginning of the period 58,860.5 61,077.4
Translation differences (609.7) 223.7
Cash and cash equivalents at end of the period 64,753.7 63,085.2
Analysis of cash and cash equivalents:
Cash and bank balances 63,905.6 63,085.2
Cash and bank balances of subsidiaries transferred to non-current assets
classified as assets held for sale 848.1 –
64,753.7 63,085.2

NOTES TO CONDENSED ACCOUNTS
Interim Report 2015/2016 NOTES TO CONDENSED ACCOUNTS 21
1 Basis of preparation and accounting policiesThe unaudited condensed consolidated interim financial statements (the “interim financial statements”) for the
six months ended 31 December 2015 have been prepared in accordance with Hong Kong Accounting Standard 34
“Interim Financial Reporting” issued by the Hong Kong Institute of Certified Public Accountants (“HKICPA”) and
Appendix 16 of the Rules Governing the Listing of Securities on The Stock Exchange of Hong Kong Limited (the
“Hong Kong Stock Exchange”) (the “Listing Rules”). The interim financial statements should be read in conjunction
with the 30 June 2015 annual financial statements.
The accounting policies used in the preparation of these interim financial statements are consistent with those
set out in the annual report for the year ended 30 June 2015. There are no standard, amendment to standard or
interpretation that are effective for the first time for the period.
The following new standards and amendments to standards are mandatory for accounting periods beginning on or
after 1 July 2016 or later periods but which the Group has not early adopted:
HKFRS 9 (2014) Financial Instruments
HKFRS 14 Regulatory Deferral Accounts
HKFRS 15 Revenue from Contracts with Customers
Amendments to HKFRS 11 Accounting for Acquisition of Interests in Joint Operations
Amendments to HKFRS 10 and HKAS 28 Sale or Contribution of Assets between an Investor and its
Associate or Joint Venture
Amendments to HKFRS 10,
HKFRS 12 and HKAS 28 (2011)
Investment Entities: Applying the Consolidation Exception
Amendments to HKAS 1 Disclosure Initiative
Amendments to HKAS 16 and HKAS 38 Clarification of Acceptable Methods of Depreciation and
Amortisation
Amendments to HKAS 27 Equity Method in Separate Financial Statements
Annual Improvement Project Annual Improvements 2012–2014 Cycle
The Group has already commenced an assessment of the impact of these new standards and amendments to
standards, certain of which may be relevant to the Group’s operations and may give rise to changes in accounting
policies, changes in disclosures and remeasurement of certain items in the consolidated financial statements. The
Group is not yet in a position to ascertain their impact on its results of operations and financial position.

New World Development Company Limited NOTES TO CONDENSED ACCOUNTS 22
2 Financial risk management and fair value estimation
(a) Financial risk factorsThe Group’s activities expose it to a variety of financial risks: market risk (interest rate risk, foreign exchange
risk and price risk), credit risk and liquidity risk.
The interim financial statements do not include all financial risk management information and disclosures
required in the annual financial statements, and should be read in conjunction with the Group’s 30 June 2015
annual financial statements.
There have been no changes in the Group’s financial risk management policies and procedures since the last
year end.
(b) Fair value estimationThe Group’s financial instruments that are measured at fair value are disclosed by levels of the following fair
value measurement hierarchy:
• Quoted prices (unadjusted) in active markets for identical assets or liabilities (level 1).
• Inputs other than quoted prices included within level 1 that are observable for the asset or liability, either
directly (that is, as prices) or indirectly (that is, derived from prices) (level 2).
• Inputs for the asset or liability that are not based on observable market data (that is, unobservable inputs)
(level 3).
The carrying amounts of the financial instruments of the Group are as follows:
(i) Listed investments are stated at market prices. The quoted market price used for financial assets held by
the Group is the bid price at the end of the reporting period. They are included in level 1.
Unlisted investments are stated at fair values which are estimated using other prices observed in recent
transactions or valuation techniques when the market price is not readily available. The fair value of
interest rate swaps is calculated as the present value of the estimated future cash flows. If all significant
inputs required to estimate the fair value of an instrument are observable, the instrument is included in
level 2. If one or more of the significant inputs is not based on observable market data, the instrument is
included in level 3.

Interim Report 2015/2016 NOTES TO CONDENSED ACCOUNTS 23
2 Financial risk management and fair value estimation (continued)
(b) Fair value estimation (continued)(ii) The fair value of long-term financial liabilities is estimated by discounting the future contractual cash flows
at the current market interest rate that is available to the Group for similar financial instruments.
The following table presents the Group’s financial instruments that are measured at fair value at 31
December 2015:
Level 1 Level 2 Level 3 Total HK$m HK$m HK$m HK$m
Available-for-sale financial assets 2,270.2 54.4 10,336.3 12,660.9Financial assets at fair value
through profit or loss 0.2 – 706.2 706.4Derivative financial instruments
Derivative financial assets – 1.9 58.8 60.7
2,270.4 56.3 11,101.3 13,428.0
Derivative financial instruments
Derivative financial liabilities – (764.3) (27.3) (791.6)
The following table presents the Group’s financial instruments that are measured at fair value at 30 June
2015:
Level 1 Level 2 Level 3 Total
HK$m HK$m HK$m HK$m
Available-for-sale financial assets 3,115.7 60.7 3,732.8 6,909.2
Financial assets at fair value through
profit or loss 0.2 – 847.0 847.2
Derivative financial instruments
Derivative financial assets – 11.1 58.8 69.9
3,115.9 71.8 4,638.6 7,826.3
Derivative financial instruments
Derivative financial liabilities – (817.3) (30.1) (847.4)
There were no significant transfer of financial assets between level 1 and level 2 fair value hierarchy
classifications.

New World Development Company Limited NOTES TO CONDENSED ACCOUNTS 24
2 Financial risk management and fair value estimation (continued)
(b) Fair value estimation (continued)(ii) (continued)
The following table presents the changes in level 3 financial instruments for the six months ended 31
December 2015:
Available-for-sale
financial assets
Financial assets at fair value
through profit or loss
Derivative financial
assets
Derivative financial
liabilitiesHK$m HK$m HK$m HK$m
At 1 July 2015 3,732.8 847.0 58.8 (30.1)Additions 7,395.6 139.7 – –Net (loss)/gain recognised in
the condensed consolidated
statement of
comprehensive income/
condensed consolidated
income statement (8.7) (11.7) – 2.8Disposals (783.4) (268.8) – –
At 31 December 2015 10,336.3 706.2 58.8 (27.3)

Interim Report 2015/2016 NOTES TO CONDENSED ACCOUNTS 25
3 Revenues and segment informationRevenues (representing turnover) recognised during the period are as follows:
For the six months ended 31 December2015 2014
HK$m HK$m
Revenues
Property sales 17,820.5 11,861.4
Rental 1,255.8 1,198.9
Contracting 6,143.6 4,506.9
Provision of services 3,847.1 3,581.8
Infrastructure operations 1,252.4 1,324.4
Hotel operations 1,074.8 2,041.7
Department store operations 1,893.3 2,006.9
Others 490.7 464.3
Total 33,778.2 26,986.3
The Executive Committee of the Company, being the chief operating decision-maker, determines and reviews
the Group’s internal reporting in order to assess performance and allocate resources. The operating segments
are determined based on the afore-mentioned internal reporting. The Executive Committee considers the
business from products and services perspectives, which comprises property development, property investment,
service, infrastructure, hotel operations, department stores and others (including telecommunications, media and
technology and other strategic businesses) segments.
The Executive Committee assesses the performance of the operating segments based on each segment’s
operating profit. The measurement of segment operating profit excludes the effects of changes in fair value of
investment properties, unallocated corporate expenses and non-recurring events. In addition, financing income and
costs are not allocated to segments.
Sales between segments are carried out in accordance with terms agreed by the parties involved.

New World Development Company Limited NOTES TO CONDENSED ACCOUNTS 26
3 Revenues and segment information (continued)
Property development
Property investment Service Infrastructure
Hotel operations
Department stores Others Consolidated
HK$m HK$m HK$m HK$m HK$m HK$m HK$m HK$m For the six months ended
31 December 2015Total revenues 17,820.5 1,376.4 13,673.0 1,252.4 1,074.8 1,894.4 532.8 37,624.3Inter–segment – (120.6) (3,682.3) – – (1.1) (42.1) (3,846.1)
Revenues–external 17,820.5 1,255.8 9,990.7 1,252.4 1,074.8 1,893.3 490.7 33,778.2
Segment results 4,155.2 774.5 511.0 530.8 (11.2) 155.6 (45.0) 6,070.9Other (losses)/gains, net (Note d) 91.6 5.1 110.8 92.4 768.7 (6.5) (1,225.6) (163.5)Changes in fair value of
investment properties – (548.1) 584.8 – – – – 36.7Unallocated corporate expenses (630.5)
Operating profit 5,313.6Financing income 435.4Financing costs (744.7)
5,004.3Share of results of
Joint ventures (Note a) (101.4) 246.9 (94.6) 900.4 (37.9) – (50.4) 863.0Associated companies (Note b) (0.5) 75.7 (31.6) 329.9 – – 3.2 376.7
Profit before taxation 6,244.0Taxation (1,752.4)
Profit for the period 4,491.6
As at 31 December 2015Segment assets 123,745.4 93,884.7 13,614.0 15,096.6 13,091.9 6,256.5 11,335.5 277,024.6Interests in joint ventures 11,701.4 12,085.5 3,737.0 14,414.9 6,015.8 – 1,017.2 48,971.8Interests in associated companies 1,059.4 2,856.0 6,521.7 7,482.9 1.1 – 342.1 18,263.2Unallocated assets 65,423.2
Total assets 409,682.8
Segment liabilities 25,152.6 1,632.6 7,294.8 652.4 653.7 4,487.6 1,753.7 41,627.4Unallocated liabilities 150,703.0
Total liabilities 192,330.4
For the six months ended 31 December 2015
Additions to non-current assets (Note c) 7,201.2 3,001.7 399.2 159.4 1,574.8 97.2 457.1 12,890.6
Depreciation and amortisation 44.4 19.9 89.9 412.2 217.8 189.0 69.7 1,042.9Impairment charge and provision – – – – – – – –
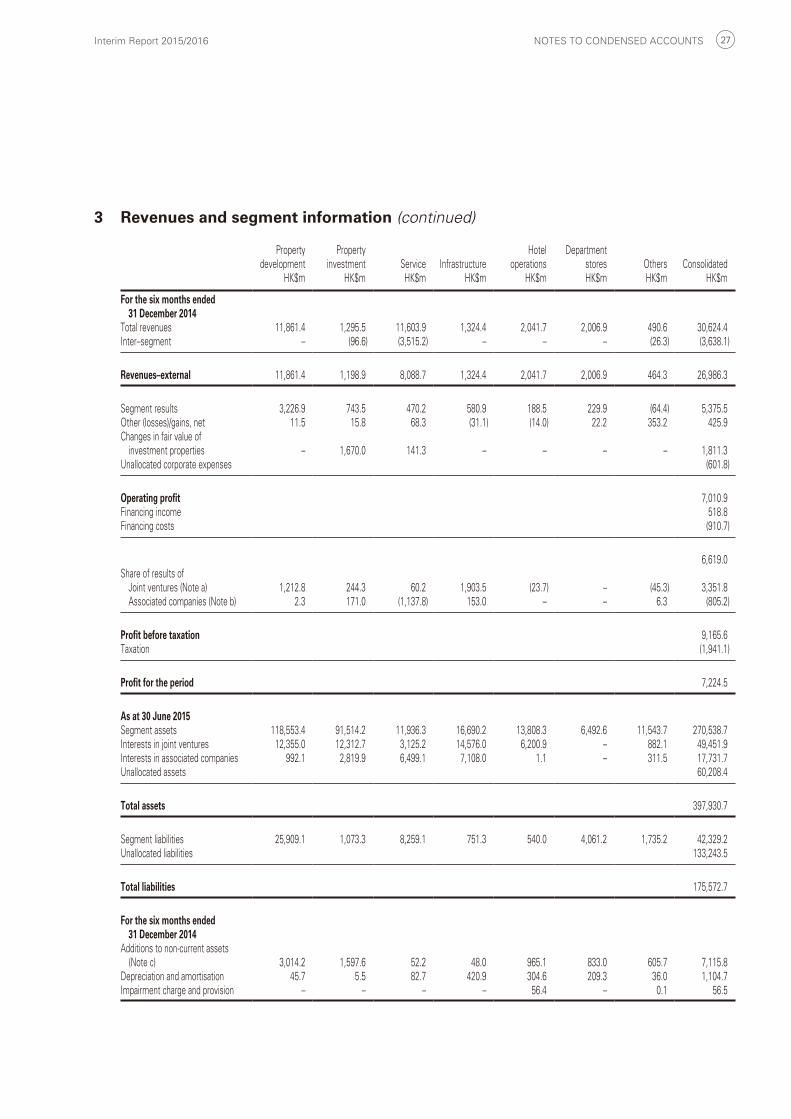
Interim Report 2015/2016 NOTES TO CONDENSED ACCOUNTS 27
3 Revenues and segment information (continued)
Property development
Property investment Service Infrastructure
Hotel operations
Department stores Others Consolidated
HK$m HK$m HK$m HK$m HK$m HK$m HK$m HK$m For the six months ended
31 December 2014Total revenues 11,861.4 1,295.5 11,603.9 1,324.4 2,041.7 2,006.9 490.6 30,624.4Inter–segment – (96.6) (3,515.2) – – – (26.3) (3,638.1)
Revenues–external 11,861.4 1,198.9 8,088.7 1,324.4 2,041.7 2,006.9 464.3 26,986.3
Segment results 3,226.9 743.5 470.2 580.9 188.5 229.9 (64.4) 5,375.5Other (losses)/gains, net 11.5 15.8 68.3 (31.1) (14.0) 22.2 353.2 425.9Changes in fair value of
investment properties – 1,670.0 141.3 – – – – 1,811.3Unallocated corporate expenses (601.8)
Operating profit 7,010.9Financing income 518.8Financing costs (910.7)
6,619.0Share of results of
Joint ventures (Note a) 1,212.8 244.3 60.2 1,903.5 (23.7) – (45.3) 3,351.8Associated companies (Note b) 2.3 171.0 (1,137.8) 153.0 – – 6.3 (805.2)
Profit before taxation 9,165.6Taxation (1,941.1)
Profit for the period 7,224.5
As at 30 June 2015Segment assets 118,553.4 91,514.2 11,936.3 16,690.2 13,808.3 6,492.6 11,543.7 270,538.7Interests in joint ventures 12,355.0 12,312.7 3,125.2 14,576.0 6,200.9 – 882.1 49,451.9Interests in associated companies 992.1 2,819.9 6,499.1 7,108.0 1.1 – 311.5 17,731.7Unallocated assets 60,208.4
Total assets 397,930.7
Segment liabilities 25,909.1 1,073.3 8,259.1 751.3 540.0 4,061.2 1,735.2 42,329.2Unallocated liabilities 133,243.5
Total liabilities 175,572.7
For the six months ended 31 December 2014
Additions to non-current assets (Note c) 3,014.2 1,597.6 52.2 48.0 965.1 833.0 605.7 7,115.8
Depreciation and amortisation 45.7 5.5 82.7 420.9 304.6 209.3 36.0 1,104.7Impairment charge and provision – – – – 56.4 – 0.1 56.5
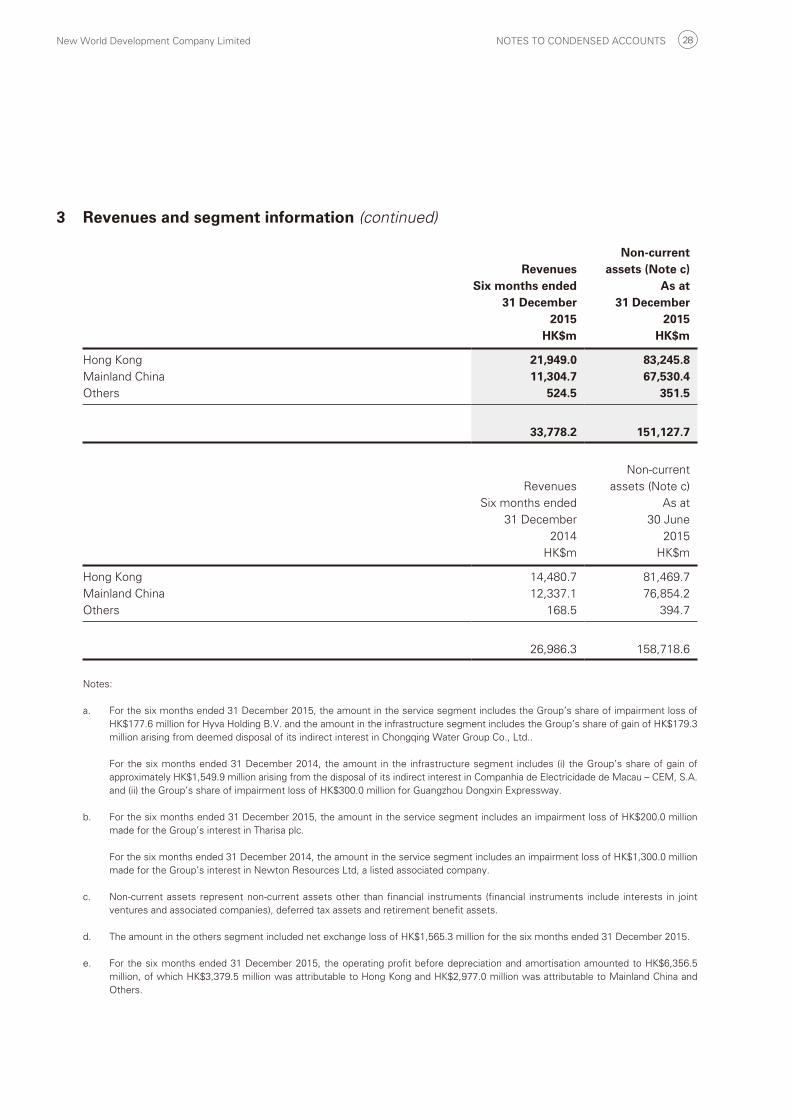
New World Development Company Limited NOTES TO CONDENSED ACCOUNTS 28
3 Revenues and segment information (continued)
RevenuesNon-current
assets (Note c)Six months ended
31 December 2015
As at31 December
2015HK$m HK$m
Hong Kong 21,949.0 83,245.8Mainland China 11,304.7 67,530.4Others 524.5 351.5
33,778.2 151,127.7
Revenues
Non-current
assets (Note c)
Six months ended
31 December
2014
As at
30 June
2015
HK$m HK$m
Hong Kong 14,480.7 81,469.7
Mainland China 12,337.1 76,854.2
Others 168.5 394.7
26,986.3 158,718.6
Notes:
a. For the six months ended 31 December 2015, the amount in the service segment includes the Group’s share of impairment loss of HK$177.6 million for Hyva Holding B.V. and the amount in the infrastructure segment includes the Group’s share of gain of HK$179.3 million arising from deemed disposal of its indirect interest in Chongqing Water Group Co., Ltd..
For the six months ended 31 December 2014, the amount in the infrastructure segment includes (i) the Group’s share of gain of approximately HK$1,549.9 million arising from the disposal of its indirect interest in Companhia de Electricidade de Macau – CEM, S.A. and (ii) the Group’s share of impairment loss of HK$300.0 million for Guangzhou Dongxin Expressway.
b. For the six months ended 31 December 2015, the amount in the service segment includes an impairment loss of HK$200.0 million made for the Group’s interest in Tharisa plc.
For the six months ended 31 December 2014, the amount in the service segment includes an impairment loss of HK$1,300.0 million made for the Group’s interest in Newton Resources Ltd, a listed associated company.
c. Non-current assets represent non-current assets other than financial instruments (financial instruments include interests in joint ventures and associated companies), deferred tax assets and retirement benefit assets.
d. The amount in the others segment included net exchange loss of HK$1,565.3 million for the six months ended 31 December 2015.
e. For the six months ended 31 December 2015, the operating profit before depreciation and amortisation amounted to HK$6,356.5 million, of which HK$3,379.5 million was attributable to Hong Kong and HK$2,977.0 million was attributable to Mainland China and Others.

Interim Report 2015/2016 NOTES TO CONDENSED ACCOUNTS 29
4 Operating profitOperating profit of the Group is arrived at after crediting/(charging) the following:
For the six months ended 31 December2015 2014
HK$m HK$m
Write back of provision for loans and other receivable 131.2 343.0
Gain on partial disposal of interests in subsidiaries and remeasurement
of retained interest at fair value after reclassification to a joint venture 40.0 –
Loss on remeasurement of previously held interests of a joint venture
at fair value upon further acquisition to become a subsidiary (8.0) –
Net profit/(loss) on disposal/liquidation of
Available-for-sale financial assets, financial assets at fair value
through profit or loss and a derivative financial instrument 113.5 25.5
Investment properties, property, plant and equipment and
intangible concession rights 67.9 (8.7)
Subsidiaries 95.0 10.1
Assets held for sale 783.9 30.3
Net gain on fair value of financial assets at fair value through profit or loss 148.2 16.9
Cost of inventories and properties sold (14,546.2) (8,920.4)
Cost of services rendered (8,415.2) (7,830.0)
Depreciation and amortisation (1,042.9) (1,104.7)
Impairment charge and provision – (56.5)
Net exchange (loss)/gain (1,565.3) 67.3
5 Taxation
For the six months ended 31 December2015 2014
HK$m HK$m
Current taxation
Hong Kong profits tax 548.9 403.9
Mainland China and overseas taxation 865.9 756.4
Mainland China land appreciation tax 213.2 698.7
Deferred taxation 124.4 82.1
1,752.4 1,941.1
Hong Kong profits tax has been provided at the rate of 16.5% (2014: 16.5%) on the estimated assessable profit for
the period.

New World Development Company Limited NOTES TO CONDENSED ACCOUNTS 30
5 Taxation (continued)Taxation on Mainland China and overseas profits has been calculated on the estimated taxable profit for the period
at the rates of taxation prevailing in the countries in which the Group operates. These rates range from 12% to
25% (2014: 9% to 25%).
Mainland China land appreciation tax is provided at progressive rates ranging from 30% to 60% (2014: 30% to
60%) on the appreciation of land value, being the proceeds of sale of properties less deductible expenditures
including costs of land use rights and property development expenditures.
Share of results of joint ventures and associated companies is stated after deducting the share of taxation of
joint ventures and associated companies of HK$372.4 million and HK$102.8 million (2014: HK$677.5 million and
HK$66.4 million) respectively.
6 Earnings per shareThe calculation of basic and diluted earnings per share for the period is based on the following:
For the six months ended 31 December2015 2014
HK$m HK$m
Profit attributable to shareholders of the Company 3,300.0 5,854.6
Adjustment on the effect of dilution in the results of subsidiaries (0.6) (1.0)
Profit for calculating diluted earnings per share 3,299.4 5,853.6
Number of shares (million)For the six months ended
31 December2015 2014
Weighted average number of shares for calculating basic earnings per share 8,999.9 8,665.9
Effect of dilutive potential ordinary shares upon the exercise of share options – 0.2
Weighted average number of shares for calculating diluted earnings per share 8,999.9 8,666.1
Diluted earnings per share for the six months ended 31 December 2015 did not assume the exercise of share
options outstanding during the period since the exercise would have an anti-dilutive effect. This effect had been
assumed for the six months ended 31 December 2014 since the exercise would have a dilutive effect.
7 Capital expenditureFor the six months ended 31 December 2015, the Group has acquired investment properties, property, plant and
equipment, land use rights and intangible concession rights of HK$5,487.0 million (2014: HK$4,260.6 million). The
Group has disposed of investment properties, property, plant and equipment and intangible concession rights of net
book value of HK$537.4 million (2014: HK$179.2 million).
Interim Report 2015/2016 NOTES TO CONDENSED ACCOUNTS 31
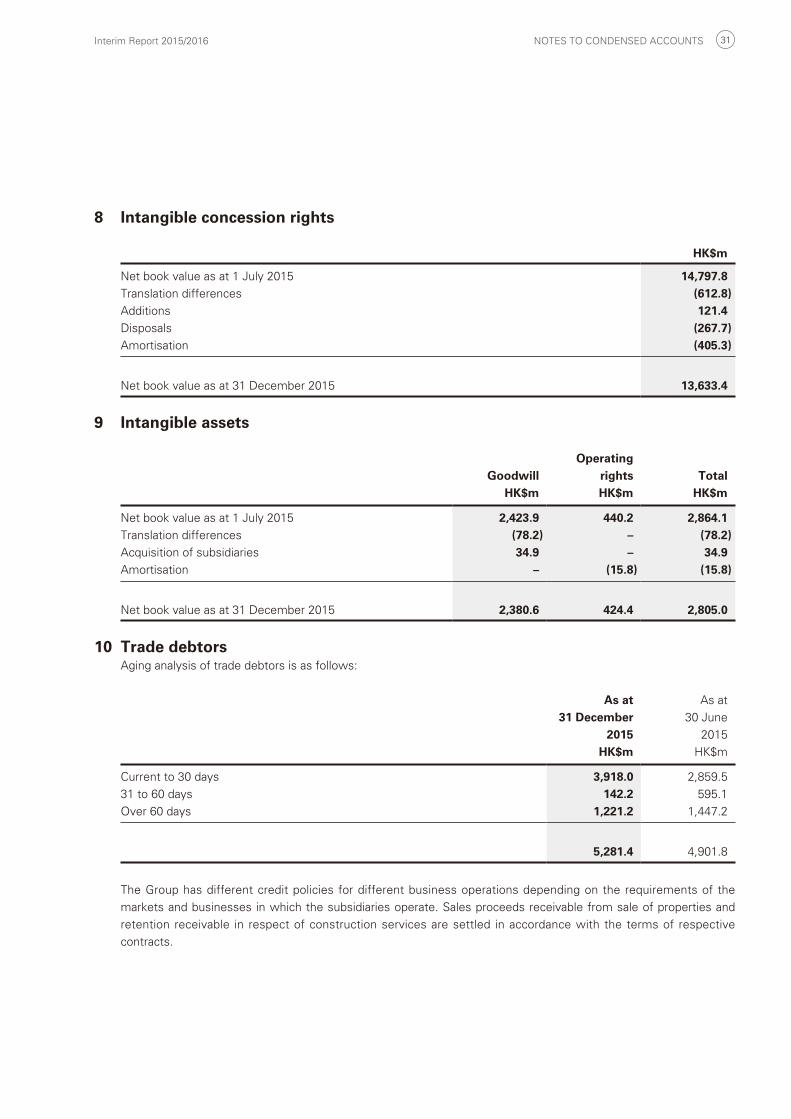
8 Intangible concession rights
HK$m
Net book value as at 1 July 2015 14,797.8Translation differences (612.8)Additions 121.4Disposals (267.7)Amortisation (405.3)
Net book value as at 31 December 2015 13,633.4
9 Intangible assets
GoodwillOperating
rights TotalHK$m HK$m HK$m
Net book value as at 1 July 2015 2,423.9 440.2 2,864.1Translation differences (78.2) – (78.2)Acquisition of subsidiaries 34.9 – 34.9Amortisation – (15.8) (15.8)
Net book value as at 31 December 2015 2,380.6 424.4 2,805.0
10 Trade debtorsAging analysis of trade debtors is as follows:
As at31 December
2015
As at
30 June
2015
HK$m HK$m
Current to 30 days 3,918.0 2,859.5
31 to 60 days 142.2 595.1
Over 60 days 1,221.2 1,447.2
5,281.4 4,901.8
The Group has different credit policies for different business operations depending on the requirements of the
markets and businesses in which the subsidiaries operate. Sales proceeds receivable from sale of properties and
retention receivable in respect of construction services are settled in accordance with the terms of respective
contracts.

New World Development Company Limited NOTES TO CONDENSED ACCOUNTS 32
11 Non-current assets classified as assets held for sale/liabilities directly associated with non-current assets classified as assets held for sale
Non-current assets classified as assets held for sale
As at31 December
2015
As at
30 June
2015
HK$m HK$m
Listed equity securities, Hong Kong – 7.8
Investment properties 1,262.2 257.0
Assets of the Disposal Property Group classified as held for sale (Note a) 22,343.2 –
Assets of the Disposal Hotel Group classified as held for sale (Note b) – 2,097.8
23,605.4 2,362.6
Liabilities directly associated with non-current assets classified as assets held for sale
As at31 December
2015
As at
30 June
2015
HK$m HK$m
Liabilities of the Disposal Property Group classified as held for sale (Note a) 5,443.9 –
Liabilities of the Disposal Hotel Group classified as held for sale (Note b) – 927.9
5,443.9 927.9
Notes:
a. On 2 December 2015 and 29 December 2015, New World Development (China) Limited (“NWDCL”), a wholly owned subsidiary
of New World China Land Limited (“NWCL”), had entered into sale and purchase agreements with a wholly owned subsidiary of
Evergrande Real Estate Group Limited, a company listed on the Main Board of the Hong Kong Stock Exchange to sell its entire
interest in certain subsidiaries and joint ventures (collectively referred to as the “Disposal Property Group”) and the shareholders’
loan for an aggregate consideration of RMB20,800 million (equivalent to approximately HK$25,106.1 million), subject to adjustments.
The Disposal Property Group is engaged in the provision of property sale and investment in Wuhan, Huiyang, Haikou, Guiyang and
Chengdu.
b. On 3 July 2015, NWDCL entered into the sale and purchase agreement with Chow Tai Fook Enterprises Limited, the substantial
shareholder of the Group, to sell its entire interest in New World Hotel Management (BVI) Limited, its subsidiaries and a joint venture
(collectively referred to as the “Disposal Hotel Group”) and to assign and transfer of the shareholder’s loan. The Disposal Hotel
Group is engaged in the provision of worldwide hotel management services, which is not the core business of NWCL. The disposal
of Disposal Hotel Group was completed on 29 December 2015 for an aggregate consideration of HK$2,753.0 million, and NWCL
recognised a gain of approximately HK$768.9 million.

Interim Report 2015/2016 NOTES TO CONDENSED ACCOUNTS 33
12 Share capital
As at 31 December 2015 As at 30 June 2015
Number of shares
Number of
shares
(million) HK$m (million) HK$m
Issued and fully paid:
At beginning of the period 8,996.9 66,711.6 8,664.0 63,761.3
Issue of new shares as scrip dividend
(Note a) 269.9 1,988.0 316.8 2,802.0
Issue of new shares upon exercise
of share options 0.1 0.9 16.1 148.3
At end of the period 9,266.9 68,700.5 8,996.9 66,711.6
Notes:
a. Issue of new shares as scrip dividend
During the period, 269,941,032 new shares were issued at HK$7.3644 per share for the settlement of 2015 final scrip dividend.
b. Share option scheme
A share option scheme was adopted by the Company on 24 November 2006 (the “Scheme”) which will be valid and effective for a period of ten years from the date of adoption.
On 13 March 2012, certain rules of the Scheme was amended. Under the Scheme, the Board may, at their discretion, grant options to any participants (as defined under the Scheme) to subscribe for the shares in the Company. The total number of shares which may be issued upon exercise of all options to be granted under the Scheme must not in aggregate exceed 10% of the share capital of the Company in issue as at 24 November 2006, i.e. 366,388,464 shares.
On 19 March 2012, 107,300,000 share options were granted by the Company to directors and certain eligible participants at an initial exercise price of HK$9.770 per share, subject to adjustments.
On 16 November 2012, 9,400,000 share options were granted by the Company to certain eligible participants at an initial exercise price of HK$11.996 per share, subject to adjustments.
On 22 January 2014, 30,100,000 share options were granted by the Company to directors and certain eligible participants at an initial exercise price of HK$10.400 per share, subject to adjustments.
On 27 October 2014, 34,400,000 share options were granted by the Company to certain eligible participants at an initial exercise price of HK$9.510 per share, subject to adjustments.
On 7 July 2015, 20,100,000 share options were granted by the Company to certain eligible participants at an initial exercise price of HK$9.976 per share, subject to adjustments.
The number of share options at 31 December 2015 amounted to 165,455,967 and the number of share options lapsed and exercised for the six months ended 31 December 2015 amounted to 3,091,704 and 95,000 respectively.

New World Development Company Limited NOTES TO CONDENSED ACCOUNTS 34
13 Borrowings
As at31 December
2015
As at
30 June
2015
HK$m HK$m
Long-term borrowings
Secured bank loans 22,053.5 22,958.5
Unsecured bank loans 64,142.2 52,393.8
Other secured loans 1,365.3 –
Other unsecured loans 1,676.8 1,062.9
Fixed rate bonds and notes payable 40,640.5 33,311.5
Loans from non-controlling shareholders 1,004.8 1,168.6
130,883.1 110,895.3
Current portion of long-term borrowings (22,211.8) (27,256.9)
108,671.3 83,638.4
Short-term borrowings
Secured bank loans 41.7 65.4
Unsecured bank loans 2,936.2 2,330.9
Other secured loans – 625.0
Other unsecured loans 5.0 256.3
Loans from non-controlling shareholders 1,659.8 2,983.6
4,642.7 6,261.2
Current portion of long-term borrowings 22,211.8 27,256.9
26,854.5 33,518.1
Total borrowings 135,525.8 117,156.5
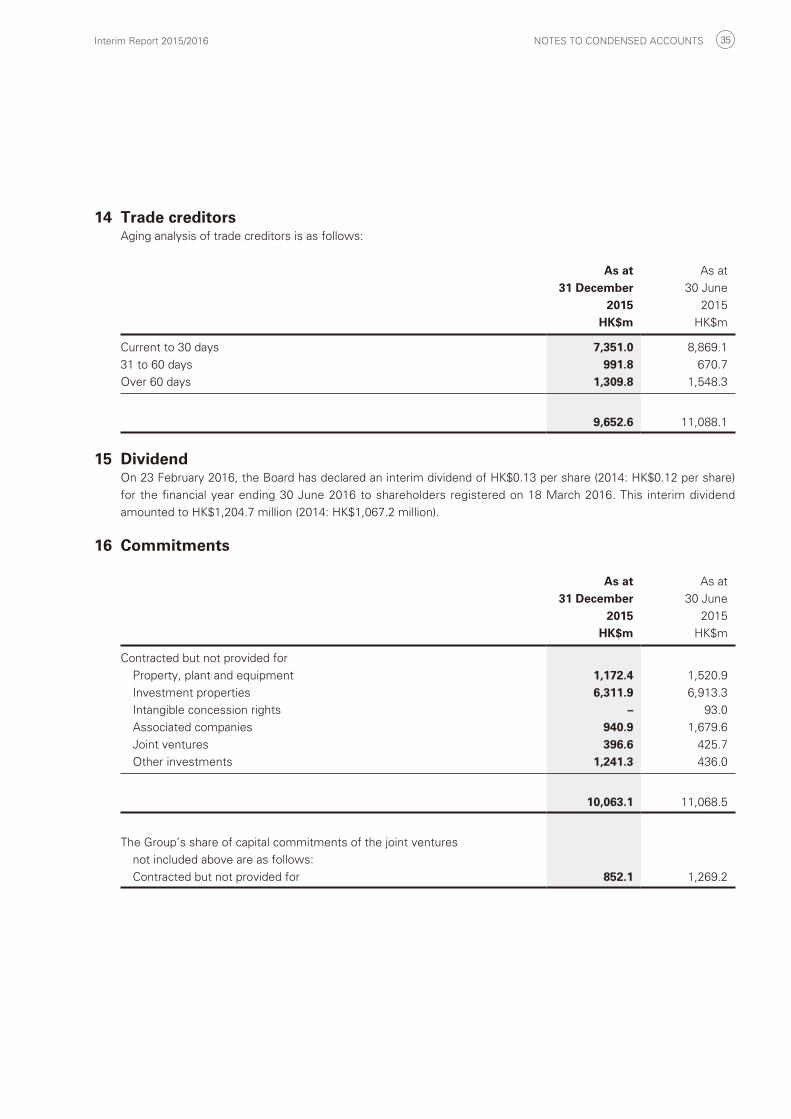
Interim Report 2015/2016 NOTES TO CONDENSED ACCOUNTS 35
14 Trade creditorsAging analysis of trade creditors is as follows:
As at31 December
2015
As at
30 June
2015
HK$m HK$m
Current to 30 days 7,351.0 8,869.1
31 to 60 days 991.8 670.7
Over 60 days 1,309.8 1,548.3
9,652.6 11,088.1
15 DividendOn 23 February 2016, the Board has declared an interim dividend of HK$0.13 per share (2014: HK$0.12 per share)
for the financial year ending 30 June 2016 to shareholders registered on 18 March 2016. This interim dividend
amounted to HK$1,204.7 million (2014: HK$1,067.2 million).
16 Commitments
As at31 December
2015
As at
30 June
2015
HK$m HK$m
Contracted but not provided for
Property, plant and equipment 1,172.4 1,520.9
Investment properties 6,311.9 6,913.3
Intangible concession rights – 93.0
Associated companies 940.9 1,679.6
Joint ventures 396.6 425.7
Other investments 1,241.3 436.0
10,063.1 11,068.5
The Group’s share of capital commitments of the joint ventures
not included above are as follows:
Contracted but not provided for 852.1 1,269.2

New World Development Company Limited NOTES TO CONDENSED ACCOUNTS 36
17 Financial guarantee and contingent liabilities
As at31 December
2015
As at30 June
2015HK$m HK$m
Financial guarantee contracts:Mortgage facilities for certain purchasers of properties 2,595.8 2,240.0Guarantees for credit facilities granted to
Joint ventures 4,020.1 4,229.4Associated companies 1,340.9 20.0A related company 44.7 49.7
Indemnity to non-wholly owned subsidiaries for Mainland China tax liabilities 1,318.0 1,415.0
9,319.5 7,954.1
18 Related party transactionsThe following is a summary of significant related party transactions during the period which were carried out in thenormal course of the Group’s business:
For the six months ended31 December2015 2014
HK$m HK$m
Transactions with joint ventures and associated companiesProvision of construction work services 415.4 334.9Interest income 43.4 64.3Rental expenses 135.5 159.7
Transactions with other related partiesProvision of construction work services 20.1 237.8Rental income 60.9 71.2Concessionaires commissions 42.9 51.2Hotel management services fee income 52.5 19.3Sales of goods, prepaid shopping cards and vouchers 32.1 26.7Purchase of goods 8.5 41.5Engineering and mechanical services 708.6 380.4Management fee expenses 11.0 66.8
These related party transactions were conducted in accordance with the terms as disclosed in the last annual report.
No significant transactions have been entered with the directors of the Company (being the key management personnel) during the period other than the emoluments paid to them (being the key management personnel compensation).
19 Event subsequent to period endAs referred to Note 11(a), the disposals entered on 2 December 2015 and 29 December 2015, with the exception of the disposal of property project in Chengdu signed on 29 December 2015, were completed in January and February 2016 respectively. The consideration for contracts entered on 2 December 2015 will be received by instalments within two years after the completion.
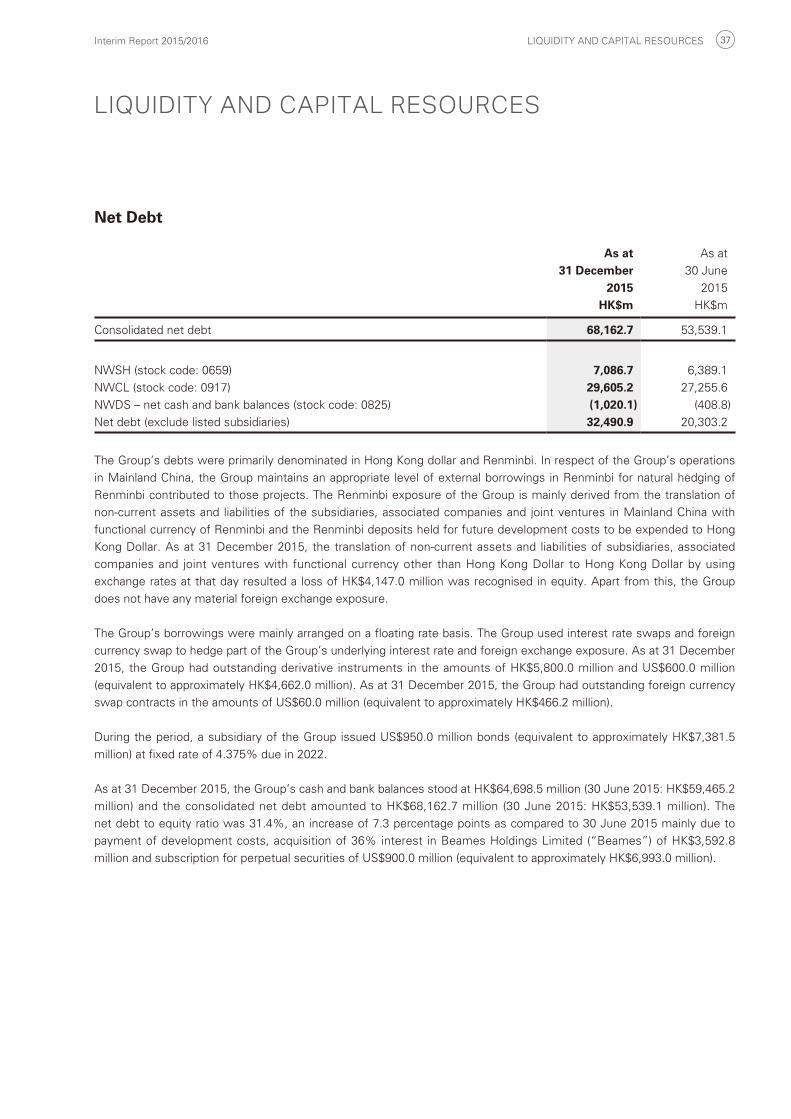
LIQUIDITY AND CAPITAL RESOURCES
Interim Report 2015/2016 LIQUIDITY AND CAPITAL RESOURCES 37
Net Debt
As at31 December
2015
As at
30 June
2015
HK$m HK$m
Consolidated net debt 68,162.7 53,539.1
NWSH (stock code: 0659) 7,086.7 6,389.1
NWCL (stock code: 0917) 29,605.2 27,255.6
NWDS – net cash and bank balances (stock code: 0825) (1,020.1) (408.8)
Net debt (exclude listed subsidiaries) 32,490.9 20,303.2
The Group’s debts were primarily denominated in Hong Kong dollar and Renminbi. In respect of the Group’s operations
in Mainland China, the Group maintains an appropriate level of external borrowings in Renminbi for natural hedging of
Renminbi contributed to those projects. The Renminbi exposure of the Group is mainly derived from the translation of
non-current assets and liabilities of the subsidiaries, associated companies and joint ventures in Mainland China with
functional currency of Renminbi and the Renminbi deposits held for future development costs to be expended to Hong
Kong Dollar. As at 31 December 2015, the translation of non-current assets and liabilities of subsidiaries, associated
companies and joint ventures with functional currency other than Hong Kong Dollar to Hong Kong Dollar by using
exchange rates at that day resulted a loss of HK$4,147.0 million was recognised in equity. Apart from this, the Group
does not have any material foreign exchange exposure.
The Group’s borrowings were mainly arranged on a floating rate basis. The Group used interest rate swaps and foreign
currency swap to hedge part of the Group’s underlying interest rate and foreign exchange exposure. As at 31 December
2015, the Group had outstanding derivative instruments in the amounts of HK$5,800.0 million and US$600.0 million
(equivalent to approximately HK$4,662.0 million). As at 31 December 2015, the Group had outstanding foreign currency
swap contracts in the amounts of US$60.0 million (equivalent to approximately HK$466.2 million).
During the period, a subsidiary of the Group issued US$950.0 million bonds (equivalent to approximately HK$7,381.5
million) at fixed rate of 4.375% due in 2022.
As at 31 December 2015, the Group’s cash and bank balances stood at HK$64,698.5 million (30 June 2015: HK$59,465.2
million) and the consolidated net debt amounted to HK$68,162.7 million (30 June 2015: HK$53,539.1 million). The
net debt to equity ratio was 31.4%, an increase of 7.3 percentage points as compared to 30 June 2015 mainly due to
payment of development costs, acquisition of 36% interest in Beames Holdings Limited (“Beames”) of HK$3,592.8
million and subscription for perpetual securities of US$900.0 million (equivalent to approximately HK$6,993.0 million).

New World Development Company Limited LIQUIDITY AND CAPITAL RESOURCES 38
As at 31 December 2015, the Group’s long-term bank loans, other loans and fixed rate bonds and notes payable
amounted to HK$129,878.3 million (secured portion: HK$23,418.8 million and unsecured portion: HK$106,459.5 million).
Short-term bank and other loans as at 31 December 2015 were HK$2,982.9 million (secured portion: HK$41.7 million and
unsecured portion: HK$2,941.2 million). The maturity of bank loans, other loans and fixed rate bonds and notes payable as
at 31 December 2015 is as follows:
HK$m Within one year 25,194.7In the second year 16,894.7In the third to fifth year 68,659.8After the fifth year 22,112.0
Total 132,861.2
Unsecured loans from non-controlling shareholders as at 31 December 2015 amounted to HK$2,664.6 million. Included
in liabilities directly associated with non-current assets classified as assets held for sale as at 31 December 2015 were
secured bank loan of HK$883.4 million and unsecured bank loans of HK$648.5 million.
Equity of the Group as at 31 December 2015 decreased to HK$217,352.4 million against HK$222,358.0 million as at 30
June 2015.

OTHER INFORMATION
Interim Report 2015/2016 OTHER INFORMATION 39
Disclosure Pursuant to Rules 13.20 and 13.22 of the Listing RulesAt 31 December 2015, the Group had given financial assistance and guarantees to its joint ventures and associated companies (collectively “affiliated companies”) as set out below:
As at 31 December
2015
As at 30 June
2015HK$m HK$m
Amounts due by affiliated companies (Note) 26,071.0 24,181.7Guarantees given for affiliated companies in respect of banking and
other credit facilities 5,361.0 4,249.4Commitments to capital injections and loan contributions 1,337.5 2,105.3
32,769.5 30,536.4
Note:
The advances were unsecured and were interest free except for an aggregate amount of HK$6,148.1 million (30 June 2015: HK$6,012.2
million) which carried interest ranging from 1.3% above HIBOR to 10% per annum (30 June 2015: 1.3% above HIBOR to 10% per annum). The
advances had no fixed repayment terms.
Pursuant to Rule 13.22 of the Listing Rules, a combined statement of financial position of those affiliated companies with financial assistance from the Group and the Group’s attributable interest in those affiliated companies as at 31 December 2015 are presented as follows:
Combined statement of
financial position
Group’s attributable
interestsHK$m HK$m
Non-current assets 129,259.2 60,659.3Current assets 30,634.4 15,896.0Current liabilities (30,511.7) (15,425.7)
Total assets less current liabilities 129,381.9 61,129.6Non-current liabilities (68,945.2) (30,465.5)
Net assets 60,436.7 30,664.1
The combined statement of financial position of the affiliated companies was prepared by combining their statements of financial position, after making adjustments to conform with the Group’s significant accounting policies and re-grouping into significant classification in the statement of financial position, as at 31 December 2015.

New World Development Company Limited OTHER INFORMATION 40
Interim DividendThe Board has declared an interim dividend of HK$0.13 per share for the financial year ending 30 June 2016 to
shareholders registered on 18 March 2016.
The interim dividend will be payable in cash but shareholders will be given the option of electing to receive the interim
dividend in the form of new shares in lieu of cash in respect of part or all of such dividend. The new shares to be issued
pursuant to the scrip dividend scheme are subject to their listing being granted by the Listing Committee of the Hong
Kong Stock Exchange. A circular containing details of the scrip dividend scheme will be despatched to shareholders
together with the form of election for scrip dividend on or about 12 April 2016. It is expected that dividend warrants and
certificates for the scrip shares will be posted to shareholders on or before 20 May 2016.
Book Close DatesBook close dates (both days inclusive) : 15 March 2016 to 18 March 2016
Latest time to lodge transfer with share registrar : 4:30 pm on Monday, 14 March 2016
Address of share registrar : Tricor Tengis Limited
Level 22, Hopewell Centre,
183 Queen’s Road East,
Hong Kong
Purchase, Sale or Redemption of Listed SecuritiesThe Company has not redeemed any of its listed securities during the six months ended 31 December 2015. Neither the
Company nor any of its subsidiaries has purchased or sold any of the Company’s listed securities during the six months
ended 31 December 2015.
Major Acquisition and Disposal1. On 3 July 2015, New World Development (China) Limited (the “NWDCL”), a wholly owned subsidiary of NWCL,
entered into a sale and purchase agreement with Chow Tai Fook Enterprises Limited (“CTF”) pursuant to
which NWDCL agreed to sell and CTF agreed to acquire the entire issued share capital of, and the outstanding
shareholder’s loans owing from, New World Hotel Management (BVI) Limited (“NWHM”) for a cash consideration
of HK$2,753.0 million. NWHM is the holding company of certain companies which are principally engaged in
the provision of hotel management services. The transaction was completed on 29 December 2015, and NWCL
recognised a gain of approximately HK$768.9 million.
2. On 20 November 2015, the Company entered into a sale and purchase agreement with CTF pursuant to which
CTF agreed to sell and assign, and the Company agreed to purchase and accept the assignment of 36% of the
issued shares of Beames and the entire amount of unsecured and non-interest bearing shareholder’s loan owing
from Beames to CTF for a total adjusted consideration of approximately HK$3,592.8 million. Beames, through
its subsidiaries, associated companies and joint ventures, is principally engaged in hotel business operations and
property investment in Hong Kong and Southeast Asia. The transaction was completed on 23 November 2015.
3. On 2 December 2015, three sale and purchase agreements were entered into between Shengyu (BVI) Limited
(“Shengyu”) and NWDCL in relation to the disposal of NWCL Group’s interests in the property projects in Haikou,
Huiyang and Hankou of Wuhan City, all three projects are in the PRC, for a total consideration of RMB8,600 million
(equivalent to approximately HK$10,424.2 million), RMB1,100 million (equivalent to approximately HK$1,333.3
million) and RMB3,800 million (equivalent to approximately HK$4,606.1 million) respectively. These transactions
were completed in January 2016 and the estimated gain for NWCL was approximately HK$6,577.0 million.

Interim Report 2015/2016 OTHER INFORMATION 41
Major Acquisition and Disposal (continued)4. On 29 December 2015, two sale and purchase agreements were entered into between Shengyu and NWDCL
in relation to the disposal of NWCL Group’s interests in the property projects in Chengdu and Guiyang, both in
the PRC, for a total cash consideration of RMB2,000 million (equivalent to approximately HK$2,395.2 million) and
RMB5,300 million (equivalent to approximately HK$6,347.3 million) respectively. The estimated attributable gain
for the Group was approximately HK$1,466.7 million. The sale and purchase agreement for the property project in
Guiyang was completed in February 2016.
Review of Interim ResultsThe Company’s unaudited interim results for the six months ended 31 December 2015 have not been reviewed by
external auditor, but have been reviewed by the Audit Committee of the Company.
Corporate Governance CodeThe Company has complied with all the applicable code provisions of the Corporate Governance Code (the “CG Code”)
contained in Appendix 14 of the Listing Rules throughout the six months ended 31 December 2015, with the exception
of code provision A.6.4.
Code provision A.6.4 is in relation to guidelines for securities dealings by relevant employees. As required under code
provision A.6.4, the Board should establish for its relevant employees written guidelines no less exacting than the
Model Code for Securities Transactions by Directors of Listed Issuers (the “Model Code”) as set out in Appendix 10
of the Listing Rules in respect of their dealings in the securities of the Company. Instead of following the Model Code
strictly, the Board has established its own guidelines which are not on no less exacting terms than the Model Code.
Such deviation from the CG Code is considered necessary, mainly because of the huge size of employees of the Group
which is over 48,000, and the Group’s diversified businesses. For these reasons, to follow the exact guidelines of the
Model Code will cause immense administrative burden to the Company in processing written notifications from the
relevant employees when they deal in the securities of the Company, which can be avoided under the Company’s own
guidelines.
Requirement in connection with Publication of “Non-statutory Accounts” under Section 436 of the Hong Kong Companies Ordinance Cap. 622The financial information relating to the year ended 30 June 2015 that is included in the Interim Report 2015/2016 as
comparative information does not constitute the Company’s statutory annual consolidated financial statements for that
year but is derived from those financial statements. Further information relating to these statutory financial statements
required to be disclosed in accordance with section 436 of the Hong Kong Companies Ordinance is as follows:
The Company had delivered the financial statements for the year ended 30 June 2015 to the Registrar of Companies as
required by section 662(3) of, and Part 3 of Schedule 6 to, the Hong Kong Companies Ordinance.
The Company’s auditor had reported on those financial statements. The auditor’s report was unqualified; did not include
a reference to any matters to which the auditor drew attention by way of emphasis without qualifying its report; and did
not contain a statement under sections 406(2), 407(2) or (3) of the Hong Kong Companies Ordinance.
Model Code for Securities Transactions by DirectorsThe Group has adopted a code of conduct regarding directors’ securities transactions on terms no less exacting than
the required standard of the Model Code. Having made specific enquiry of all Directors, the Directors of the Company
confirmed that they have complied with the required standard set out in the Model Code during the six months ended
31 December 2015.

New World Development Company Limited OTHER INFORMATION 42
Update on Directors’ InformationPursuant to Rule 13.51B(1) of the Listing Rules, the changes in information of the Directors of the Company since the
date of the Company’s 2015 Annual Report are set out below:
1. Dr. Cheng Kar-Shun, Henry was appointed as the chairman and non-executive director of FSE Engineering Holdings
Limited, the shares of which have been listed on the Hong Kong Stock Exchange since 10 December 2015, on 28
August 2015.
2. Mr. Lee Luen-Wai, John retired from the chairmanship of the Board of Trustee of the Hospital Authority Provident
Fund Scheme (“HAPFS”) on 19 November 2015 and he was re-appointed as a trustee of the HAPFS. Mr. Lee was
also appointed as an independent non-executive director of UMP Healthcare Holdings Limited, the shares of which
have been listed on the Hong Kong Stock Exchange since 27 November 2015, on 6 November 2015.
3. Mr. Liang Cheung-Biu, Thomas was appointed as a member of the Board of Governors, Hang Seng Management
College on 16 November 2015.
Investor RelationsThe Group values good investor relations and has been committed to maintaining effective communication with
investors. We have always offered in a high level of transparency and strived to ensure shareholders’ comprehensive
and thorough understanding of the Group. Announcements, interim and annual reports, and investor relations website
are treated as important public disclosure channels to facilitate investors assessing the company holistically. Besides, we
have actively participated in different investor forums and roadshows (both domestic and international), and conducted
numerous site visits and meetings with the investment community for effective communication. Feedbacks from the
investment community are directly reverted to the management to promote two-way communications between the
Board and the investors.
Corporate SustainabilityTo achieve sustainable growth, the Group is committed to minimising potential environmental impacts, improving the
quality of communities where we operate while providing a reasonable return to our investors. This commitment is
translated into the three pillars of the Group‘s corporate sustainability – Profit, People and Planet. Considerations of the
three pillars are rooted in the Group’s decision making process and operational practices. The Group recognises the
importance of transparency to stakeholders and has published its sustainability report (sr.nwd.com.hk) to report the
progress and performance of sustainability programmes in the past year.
Employees and Remuneration PoliciesThe Group has over 48,000 employees as at 31 December 2015 employed by entities under the Group’s management.
Remuneration policies are reviewed annually. Remuneration and bonuses are awarded to employees based on individual
performances and market practices. Education subsidies will be granted to employees who are taking job-related
courses. Periodic in-house training programs are also offered. Under the share option schemes of the Company and all
the listed subsidiaries of the Group, options may be granted to certain Directors of the Company and certain employees
of the Group to subscribe for shares in the Company and/or the respective subsidiaries.

Interim Report 2015/2016 OTHER INFORMATION 43
Directors’ Interests in SecuritiesAs at 31 December 2015, the interests of the Directors in shares, underlying shares and debentures of the Company or
any of its associated corporations which were recorded in the register required to be kept by the Company under section
352 of the Securities and Futures Ordinance (“SFO”) were as follows:
(A) Long position in shares
Number of shares Approximate % of
shareholding
Personal interests
Spouse interests
Corporate interests Total
New World Development Company Limited
(Ordinary shares)
Dr. Cheng Kar-Shun, Henry – 600,000 – 600,000 0.01Mr. Doo Wai-Hoi, William – – 7,955,000(1) 7,955,000 0.09Mr. Cheng Kar-Shing, Peter – 506,545 – 506,545 0.01Mr. Ho Hau-Hay, Hamilton – – 878,353(2) 878,353 0.01Mr. Liang Cheung-Biu, Thomas 10,429 – – 10,429 0.00Ms. Ki Man-Fung, Leonie 90,000 – – 90,000 0.00
New World China Land Limited(Ordinary shares of HK$0.10 each)
Mr. Doo Wai-Hoi, William 1,254,663 – 1,317,000(3) 2,571,663 0.03Mr. Cheng Kar-Shing, Peter 755,961 – – 755,961 0.01Mr. Lee Luen-Wai, John 387,448 – – 387,448 0.00Ms. Ki Man-Fung, Leonie 45,000 – – 45,000 0.00
New World Department Store China Limited(Ordinary shares of HK$0.10 each)
Ms. Ki Man-Fung, Leonie 20,000 – – 20,000 0.00Ms. Cheng Chi-Man, Sonia 92,000 – – 92,000 0.01
NWS Holdings Limited(Ordinary shares of HK$1.00 each)
Dr. Cheng Kar-Shun, Henry 18,349,571 – 12,000,000(4) 30,349,571 0.80Mr. Doo Wai-Hoi, William 1,939,834 – 8,330,782(3) 10,270,616 0.27Mr. Cheng Kar-Shing, Peter 295,838 – 5,973,374(5) 6,269,212 0.16Ms. Ki Man-Fung, Leonie 15,000 – – 15,000 0.00
Sun Legend Investments Limited(Ordinary shares)
Mr. Cheng Kar-Shing, Peter – – 500(6) 500 50.00

New World Development Company Limited OTHER INFORMATION 44
Directors’ Interests in Securities (continued)
(A) Long position in shares (continued)Notes:
(1) These shares are beneficially owned by companies which are wholly owned by Mr. Doo Wai-Hoi, William.
(2) These shares are beneficially owned by a company in which Mr. Ho Hau-Hay, Hamilton owns 40.0% of its issued share capital.
(3) These shares are beneficially owned by a company which is wholly owned by Mr. Doo Wai-Hoi, William.
(4) These shares are beneficially owned by a company which is wholly owned by Dr. Cheng Kar-Shun, Henry.
(5) These shares are beneficially owned by a company which is wholly owned by Mr. Cheng Kar-Shing, Peter.
(6) These shares are beneficially owned by a controlled corporation of Mr. Cheng Kar-Shing, Peter.

Interim Report 2015/2016 OTHER INFORMATION 45
Directors’ Interests in Securities (continued)
(B) Long position in underlying shares – share optionsDuring the six months ended 31 December 2015, certain Directors of the Company have interests in share options
to subscribe for shares in the Company and certain of its subsidiaries. Details of such interests and movement of
share options granted by the Company and its subsidiaries under their respective share option schemes are shown
below:
(1) Long position in underlying shares of the Company – share options
Share options granted to Directors of the Company
Number of share options
Name Date of grantExercisable
period
Balance as at
1 July 2015
Adjusted during the
period(4)
Exercised during the
period
Balance as at
31 December 2015
Exercise price per
share(4)
(Note) HK$ Dr. Cheng Kar-Shun, Henry 19 March 2012 (1) 10,664,813 10,824 – 10,675,637 9.152
Mr. Doo Wai-Hoi, William 22 January 2014 (2) 532,442 540 – 532,982 9.756
Dr. Cheng Chi-Kong, Adrian 19 March 2012 (1) 3,732,683 3,788 – 3,736,471 9.152
Mr. Chen Guanzhan 19 March 2012 (1) 3,732,683 3,788 – 3,736,471 9.152
Mr. Yeung Ping-Leung, Howard 19 March 2012 (1) 533,238 541 – 533,779 9.152
Mr. Cha Mou-Sing, Payson 19 March 2012 (1) 533,238 541 – 533,779 9.152
Mr. Cheng Kar-Shing, Peter 19 March 2012 (1) 533,238 541 – 533,779 9.152
Mr. Ho Hau-Hay, Hamilton 19 March 2012 (1) 533,238 541 – 533,779 9.152
Mr. Lee Luen-Wai, John 19 March 2012 (1) 533,238 541 – 533,779 9.152
Mr. Liang Cheung-Biu, Thomas 19 March 2012 (1) 533,238 541 – 533,779 9.152
Ms. Ki Man-Fung, Leonie 19 March 2012 (1) 3,199,441 3,247 – 3,202,688 9.152
Mr. Cheng Chi-Heng 19 March 2012 (1) 533,238 541 – 533,779 9.152
Ms. Cheng Chi-Man, Sonia 19 March 2012 (1) 3,199,441 3,247 – 3,202,688 9.152
Mr. Au Tak-Cheong 19 March 2012 (3) 1,345,328 1,365 – 1,346,693 9.152
22 January 2014 (2) 532,442 540 – 532,982 9.756
30,671,939 31,126 – 30,703,065

New World Development Company Limited OTHER INFORMATION 46
Directors’ Interests in Securities (continued)
(B) Long position in underlying shares – share options (continued)(1) Long position in underlying shares of the Company – share options (continued)
Share options granted to Directors of the Company (continued)Notes:
(1) Divided into 4 tranches exercisable from 19 March 2012, 19 March 2013, 19 March 2014 and 19 March 2015 respectively to
18 March 2016.
(2) Divided into 4 tranches exercisable from 22 January 2014, 22 January 2015, 22 January 2016 and 22 January 2017 respectively
to 21 January 2018.
(3) Divided into 3 tranches exercisable from 19 March 2013, 19 March 2014 and 19 March 2015 respectively to 18 March 2016.
(4) The Company declared final dividend for the year ended 30 June 2015 in cash (with scrip option) during the period.
Accordingly, adjustments were made to the number of outstanding share options and the exercise price. The exercise price
per share of the share options granted on 19 March 2012 was adjusted from HK$9.161 to HK$9.152 on 29 December 2015.
The exercise price per share of the share options granted on 22 January 2014 was adjusted from HK$9.766 to HK$9.756 on
29 December 2015.
(5) The cash consideration paid by each Director for the grant of share options is HK$10.0.
Share options granted to other eligible participants
Number of share options
Date of grantExercisable
period
Balance as at
1 July 2015
Granted during the
period(6)
Exercised during the
period
Adjusted during the
period(9)
Lapsed during the
period
Balance as at
31 December 2015
Exercise price per
share(9)
(Note) HK$ 19 March 2012 (1) 48,472,228 – (20,000)(7) 48,279 (853,182) 47,647,325 9.152
16 November 2012 (2) 6,958,068 – – 7,057 – 6,965,125 11.238
22 January 2014 (3) 29,270,884 – – 29,093 (585,687) 28,714,290 9.756
27 October 2014 (4) 33,001,582 – (75,000)(8) 32,023 (1,352,531) 31,606,074 9.485
7 July 2015 (5) – 20,100,000 – 20,392 (300,304) 19,820,088 9.966
117,702,762 20,100,000 (95,000) 136,844 (3,091,704) 134,752,902

Interim Report 2015/2016 OTHER INFORMATION 47
Directors’ Interests in Securities (continued)
(B) Long position in underlying shares – share options (continued)(1) Long position in underlying shares of the Company – share options (continued)
Share options granted to other eligible participants (continued)Notes:
(1) Divided into 4 tranches exercisable from 19 March 2012, 19 March 2013, 19 March 2014 and 19 March 2015 respectively to
18 March 2016.
(2) Divided into 4 tranches exercisable from 16 November 2012, 16 November 2013, 16 November 2014 and 16 November 2015
respectively to 15 November 2016.
(3) Divided into 4 tranches exercisable from 22 January 2014, 22 January 2015, 22 January 2016 and 22 January 2017 respectively
to 21 January 2018.
(4) Divided into 4 tranches exercisable from 27 October 2014, 27 October 2015, 27 October 2016 and 27 October 2017
respectively to 26 October 2018.
(5) Divided into 4 tranches exercisable from 7 July 2015, 7 July 2016, 7 July 2017 and 7 July 2018 respectively to 6 July 2019.
(6) The closing price per share immediately before 7 July 2015, the date of grant, was HK$9.72.
(7) The exercise date was 10 July 2015. On the trading date immediately before the exercise date, the closing price per share was
HK$9.24.
(8) The exercise date was 2 July 2015. On the trading date immediately before the exercise date, the closing price per share was
HK$10.14.
(9) The Company declared final dividend for the year ended 30 June 2015 in cash (with scrip option) during the period.
Accordingly, adjustments were made to the number of outstanding share options and the exercise price. The exercise price
per share of the share options granted on 19 March 2012 was adjusted from HK$9.161 to HK$9.152 on 29 December 2015.
The exercise price per share of the share options granted on 16 November 2012 was adjusted from HK$11.249 to HK$11.238
on 29 December 2015. The exercise price per share of the share options granted on 22 January 2014 was adjusted from
HK$9.766 to HK$9.756 on 29 December 2015. The exercise price per share of the share options granted on 27 October 2014
was adjusted from HK$9.495 to HK$9.485 on 29 December 2015. The exercise price per share of the share options granted on
7 July 2015 was adjusted from HK$9.976 to HK$9.966 on 29 December 2015.
(10) The cash consideration paid by each participant for the grant of share options is HK$10.0.
The fair value of the share options granted during the period is estimated at HK$1.574 per share using the
Binomial pricing model. Value is estimated based on the risk-free rate at 0.923% per annum with reference
to the market yield rates of the Hong Kong Government Bond (maturing 30 September 2019) as of the value
date, a historical volatility of 30.98% calculated based on the historical price with period equals to the life of
the options, assuming dividend yield of 3.82% based on the average dividend yield in the past five years and
an expected option life of four years.
The Binomial pricing model requires input of subjective assumptions such as the expected stock price
volatility. Change in the subjective input may materially affect the fair value estimates.

New World Development Company Limited OTHER INFORMATION 48
Directors’ Interests in Securities (continued)
(B) Long position in underlying shares – share options (continued)(2) Long position in underlying shares of New World China Land Limited (“NWCL”) – share options
On 26 November 2002, NWCL adopted a share option scheme (“NWCL 2002 Share Option Scheme”)
pursuant to which employees, including directors of NWCL and its subsidiaries, were given opportunity to
obtain equity holdings in NWCL. In anticipation of the expiry of the NWCL 2002 Share Option Scheme, NWCL
adopted a new share option scheme (“NWCL 2011 Share Option Scheme”) at the annual general meeting of
NWCL held on 22 November 2011 and terminated the operation of the NWCL 2002 Share Option Scheme.
Any share options which were granted under the NWCL 2002 Share Option Scheme prior to such termination
shall continue to be valid and exercisable in accordance with the terms of the NWCL 2002 Share Option
Scheme.
Details of movement of share options granted under the NWCL 2002 Share Option Scheme and the NWCL
2011 Share Option Scheme during the six months ended 31 December 2015 are as follows:
Share options granted to Directors of the Company
NWCL 2002 Share Option Scheme
Number of share options
Name Date of grantExercisable
period
Balance as at
1 July 2015
Exercised during the
period
Lapsed during the
period
Balance as at
31 December 2015
Exercise price per
share (Note) HK$
Dr. Cheng Kar-Shun, Henry 18 January 2011 (1) 2,077,922 – – 2,077,922 3.036
Dr. Cheng Chi-Kong, Adrian 18 January 2011 (2) 935,066 – – 935,066 3.036
Mr. Cheng Kar-Shing, Peter 18 January 2011 (1) 831,169 – – 831,169 3.036
Mr. Lee Luen-Wai, John 18 January 2011 (1) 311,688 – – 311,688 3.036
4,155,845 – – 4,155,845
Notes:
(1) Divided into 5 tranches exercisable from 19 February 2011, 19 February 2012, 19 February 2013, 19 February 2014 and
19 February 2015, respectively to 18 February 2016.
(2) Divided into 3 tranches exercisable from 19 February 2013, 19 February 2014 and 19 February 2015, respectively to
18 February 2016.
(3) The cash consideration paid by each of the above Directors for each grant of share options is HK$10.0.

Interim Report 2015/2016 OTHER INFORMATION 49
Directors’ Interests in Securities (continued)
(B) Long position in underlying shares – share options (continued)(2) Long position in underlying shares of New World China Land Limited (“NWCL”) – share options (continued)
Share options granted to other eligible participants
NWCL 2002 Share Option Scheme
Number of share options(1)
Date of grant
Balance as at
1 July 2015
Exercised during the
period(2)
Lapsed during the
period
Balance as at
31 December 2015
Exercise price
per shareHK$
31 May 2010 to 25 June 2010 39,480 (39,480) – – 2.349
10 November 2010 to 7 December 2010 593,278 (581,936) (11,342) – 3.013
18 January 2011 to 14 February 2011 3,933,085 (1,053,249) – 2,879,836 3.036
26 July 2011 to 22 August 2011 517,242 (290,362) – 226,880 2.705
5,083,085 (1,965,027) (11,342) 3,106,716

New World Development Company Limited OTHER INFORMATION 50
Directors’ Interests in Securities (continued)
(B) Long position in underlying shares – share options (continued)(2) Long position in underlying shares of New World China Land Limited (“NWCL”) – share options (continued)
Share options granted to other eligible participants (continued)
NWCL 2011 Share Option Scheme
Number of share options(1)
Date of grant
Balance as at
1 July 2015
Granted during the
period(3)
Exercised during
the period(2)
Lapsed during the
period
Balance as at
31 December 2015
Exercise price
per shareHK$
3 May 2012 to 30 May 2012 2,798,400 – (609,640) (120,000) 2,068,760 2.450
22 October 2012 to 16 November 2012 199,100 – (77,600) – 121,500 3.370
7 January 2013 to 1 February 2013 2,738,560 – (225,580) – 2,512,980 3.880
2 April 2013 to 29 April 2013 1,791,990 – (108,000) – 1,683,990 3.350
24 June 2013 to 25 June 2013 892,400 – (149,200) (99,200) 644,000 2.762
15 October 2013 to 17 October 2013 1,475,100 – (616,000) – 859,100 4.010
9 January 2014 to 13 January 2014 3,371,020 – (334,477) (34,800) 3,001,743 3.970
10 July 2014 to 11 July 2014 874,000 – (34,000) – 840,000 4.720
23 October 2014 to 24 October 2014 802,000 – (320,800) – 481,200 4.420
11 March 2015 to 12 March 2015 10,852,400 – (319,600) (172,000) 10,360,800 4.968
8 May 2015 to 11 May 2015 914,000 – – – 914,000 5.420
23 July 2015 to 24 July 2015 – 3,206,000 (71,600) – 3,134,400 4.504
26,708,970 3,206,000 (2,866,497) (426,000) 26,622,473
Notes:
(1) The share options are exercisable within five years commencing from one month after the dates of grant, provided that the
maximum number of share options that can be exercised during each anniversary year is 20.0% of the total number of the
share options granted together with any unexercised share options carried forward from the previous anniversary years.
(2) The weighted average closing prices of the shares immediately before the dates on which share options were exercised
under the NWCL 2002 Share Option Scheme and the NWCL 2011 Share Option Scheme were HK$5.204 and HK$5.460,
respectively.
(3) The closing price per share immediately before 23 July 2015, the date of offer to grant, was HK$4.390.
(4) The cash consideration paid by each eligible participant for each grant of share options is HK$10.0.
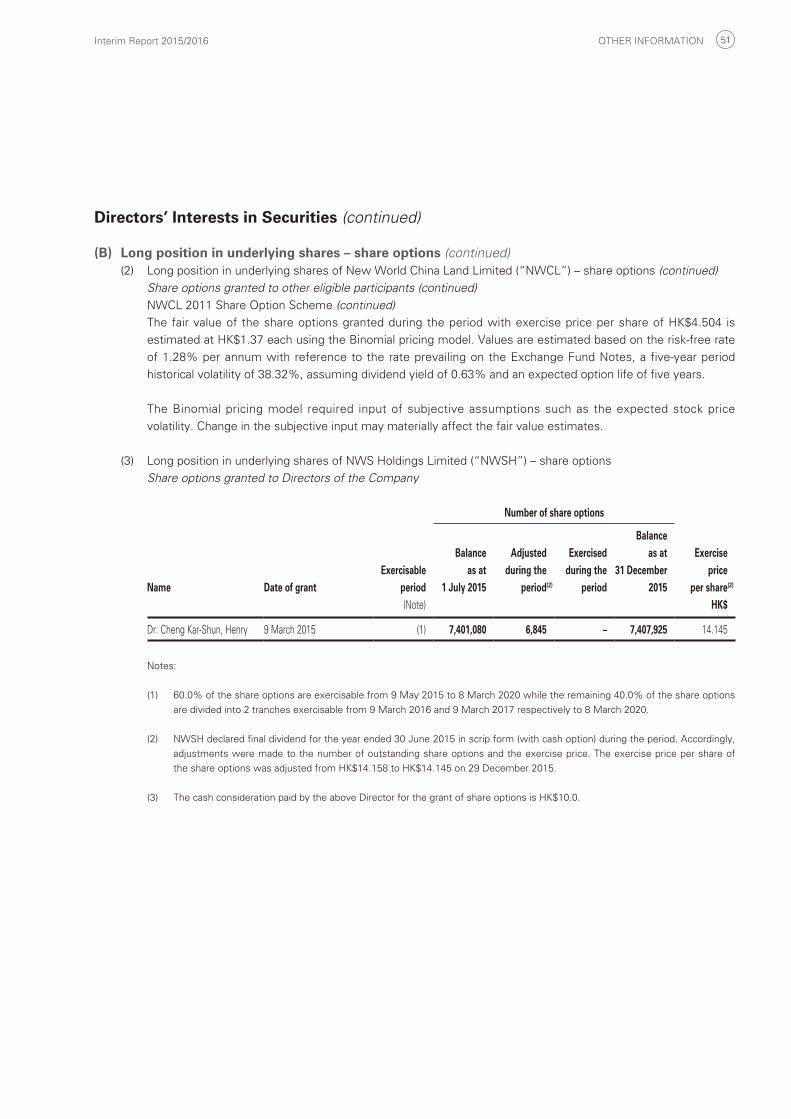
Interim Report 2015/2016 OTHER INFORMATION 51
Directors’ Interests in Securities (continued)
(B) Long position in underlying shares – share options (continued)(2) Long position in underlying shares of New World China Land Limited (“NWCL”) – share options (continued)
Share options granted to other eligible participants (continued)
NWCL 2011 Share Option Scheme (continued)
The fair value of the share options granted during the period with exercise price per share of HK$4.504 is
estimated at HK$1.37 each using the Binomial pricing model. Values are estimated based on the risk-free rate
of 1.28% per annum with reference to the rate prevailing on the Exchange Fund Notes, a five-year period
historical volatility of 38.32%, assuming dividend yield of 0.63% and an expected option life of five years.
The Binomial pricing model required input of subjective assumptions such as the expected stock price
volatility. Change in the subjective input may materially affect the fair value estimates.
(3) Long position in underlying shares of NWS Holdings Limited (“NWSH”) – share options
Share options granted to Directors of the Company
Number of share options
Name Date of grantExercisable
period
Balance as at
1 July 2015
Adjusted during the
period(2)
Exercised during the
period
Balance as at
31 December 2015
Exercise price
per share(2)
(Note) HK$
Dr. Cheng Kar-Shun, Henry 9 March 2015 (1) 7,401,080 6,845 – 7,407,925 14.145
Notes:
(1) 60.0% of the share options are exercisable from 9 May 2015 to 8 March 2020 while the remaining 40.0% of the share options
are divided into 2 tranches exercisable from 9 March 2016 and 9 March 2017 respectively to 8 March 2020.
(2) NWSH declared final dividend for the year ended 30 June 2015 in scrip form (with cash option) during the period. Accordingly,
adjustments were made to the number of outstanding share options and the exercise price. The exercise price per share of
the share options was adjusted from HK$14.158 to HK$14.145 on 29 December 2015.
(3) The cash consideration paid by the above Director for the grant of share options is HK$10.0.

New World Development Company Limited OTHER INFORMATION 52
Directors’ Interests in Securities (continued)
(B) Long position in underlying shares – share options (continued)(3) Long position in underlying shares of NWS Holdings Limited (“NWSH”) – share options (continued)
Share options granted to other eligible participants
Number of share options
Date of grantExercisable
period
Balance as at
1 July 2015
Adjusted during the
period(2)
Exercised during the
period
Lapsed during the
period
Balance as at
31 December 2015
Exercise price
per share(2)
(Note) HK$
9 March 2015 (1) 48,076,973 44,382 – (60,008) 48,061,347 14.145
Notes:
(1) 60.0% of the share options are exercisable from 9 May 2015 to 8 March 2020 while the remaining 40.0% of the share options
are divided into 2 tranches exercisable from 9 March 2016 and 9 March 2017 respectively to 8 March 2020.
(2) NWSH declared final dividend for the year ended 30 June 2015 in scrip form (with cash option) during the period. Accordingly,
adjustments were made to the number of outstanding share options and the exercise price. The exercise price per share of
the share options was adjusted from HK$14.158 to HK$14.145 on 29 December 2015.
(3) The cash consideration paid by each eligible participant for each grant of share options is HK$10.0.
(C) Long position in debentures(1) Fita International Limited (“Fita”)
Amount of debentures in US$ issued by Fita
Approximate % to the total
amount of debentures in
issue as at
NamePersonal interests
Family interests
Corporate interests Total
31 December 2015
US$ US$ US$ US$ Mr. Doo Wai-Hoi, William – 2,900,000 12,890,000(1) 15,790,000 2.11Mr. Lee Luen-Wai, John 1,000,000 1,000,000 – 2,000,000 0.27
1,000,000 3,900,000 12,890,000 17,790,000
Note:
(1) These debentures are beneficially owned by companies which are wholly owned by Mr. Doo Wai-Hoi, William.

Interim Report 2015/2016 OTHER INFORMATION 53
Directors’ Interests in Securities (continued)
(C) Long position in debentures (continued)(2) NWCL
Amount of debentures issued by NWCL
Approximate % to the total
amount of debentures in
issue as at
NamePersonal interests
Family interests
Corporate interests Total
31 December 2015
RMB RMB RMB RMB Mr. Doo Wai-Hoi, William – 65,896,000(1) 1,142,041,200(2) 1,207,937,200 12.89Mr. Cheng Kar-Shing, Peter – 12,256,000(3) 16,000,000(4) 28,256,000 0.30
– 78,152,000 1,158,041,200 1,236,193,200
Notes:
(1) These debentures are held by the spouse of Mr. Doo Wai-Hoi, William, of which RMB42,896,000 debentures were issued in
US$ and had been translated into RMB using the rate of US$1.0 = RMB6.128.
(2) These debentures are held by companies which are wholly owned by Mr. Doo Wai-Hoi, William, of which RMB584,611,200
debentures were issued in US$ and had been translated into RMB using the rate of US$1.0 = RMB6.128 and RMB118,800,000
were issued in HK$ and had been translated into RMB using the rate of HK$1.0 = RMB0.8.
(3) These debentures are jointly-held by Mr. Cheng Kar-Shing, Peter and his spouse, all of which were issued in US$ and had been
translated into RMB using the rate of US$1.0 = RMB6.128.
(4) These debentures are beneficially owned by a company which is wholly owned by Mr. Cheng Kar-Shing, Peter.
(3) NWD (MTN) Limited (“NWD (MTN)”)
Amount of debentures issued by NWD (MTN)
Approximate % to the total
amount of debentures in
issue as at
NamePersonal interests
Family interests
Corporate interests Total
31 December 2015
HK$ HK$ HK$ HK$ Mr. Doo Wai-Hoi, William – 23,400,000(1) 156,000,000(2) 179,400,000 0.96Ms. Ki Man-Fung, Leonie 11,800,000(3) – – 11,800,000 0.06
11,800,000 23,400,000 156,000,000 191,200,000

New World Development Company Limited OTHER INFORMATION 54
Directors’ Interests in Securities (continued)
(C) Long position in debentures (continued)(3) NWD (MTN) Limited (“NWD (MTN)”) (continued)
Notes:
(1) These debentures were issued in US$ and had been translated into HK$ using the rate of US$1.0 = HK$7.8.
(2) These debentures are beneficially owned by a company which is wholly owned by Mr. Doo Wai-Hoi, William and were issued
in US$ and had been translated into HK$ using the rate of US$1.0 = HK$7.8.
(3) HK$7,800,000 debentures were issued in US$ and had been translated into HK$ using the rate of US$1.0 = HK$7.8.
(4) Rosy Unicorn Limited (“Rosy Unicorn”)
Amount of debentures in US$ issued by Rosy Unicorn
Approximate % to the total
amount of debentures in
issue as at
NamePersonal interests
Family interests
Corporate interests Total
31 December 2015
US$ US$ US$ US$ Mr. Doo Wai-Hoi, William – 51,500,000 22,840,000(1) 74,340,000 14.87
Note:
(1) These debentures are beneficially owned by a company which is wholly owned by Mr. Doo Wai-Hoi, William.
Save as disclosed above, as at 31 December 2015, none of the Directors or chief executive had or deemed to
have any interest or short positions in the shares, underlying shares and debentures of the Company or any of
its associated corporations as defined in the SFO that were required to be entered into the register kept by the
Company pursuant to section 352 of the SFO or were required to be notified to the Company and the Hong Kong
Stock Exchange pursuant to the Model Code.
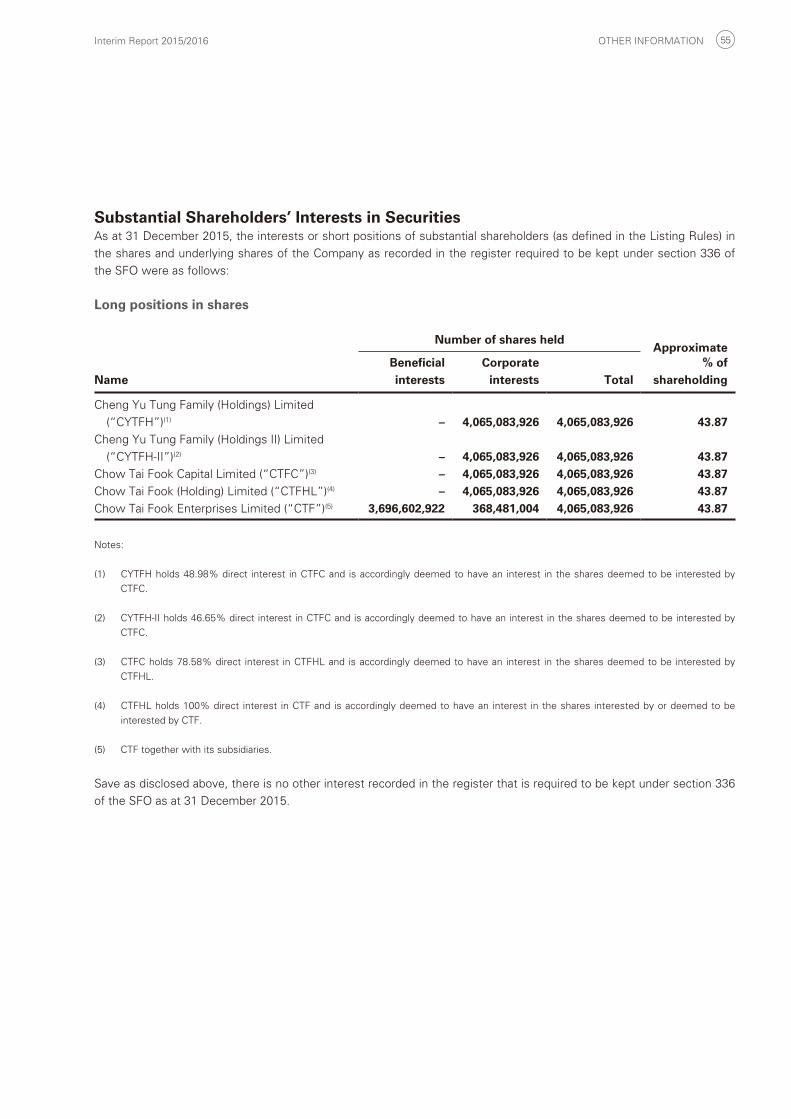
Interim Report 2015/2016 OTHER INFORMATION 55
Substantial Shareholders’ Interests in SecuritiesAs at 31 December 2015, the interests or short positions of substantial shareholders (as defined in the Listing Rules) in
the shares and underlying shares of the Company as recorded in the register required to be kept under section 336 of
the SFO were as follows:
Long positions in shares
Number of shares heldApproximate
NameBeneficial interests
Corporate interests Total
% of shareholding
Cheng Yu Tung Family (Holdings) Limited
(“CYTFH”)(1) – 4,065,083,926 4,065,083,926 43.87Cheng Yu Tung Family (Holdings II) Limited
(“CYTFH-II”)(2) – 4,065,083,926 4,065,083,926 43.87Chow Tai Fook Capital Limited (“CTFC”)(3) – 4,065,083,926 4,065,083,926 43.87Chow Tai Fook (Holding) Limited (“CTFHL”)(4) – 4,065,083,926 4,065,083,926 43.87Chow Tai Fook Enterprises Limited (“CTF”)(5) 3,696,602,922 368,481,004 4,065,083,926 43.87
Notes:
(1) CYTFH holds 48.98% direct interest in CTFC and is accordingly deemed to have an interest in the shares deemed to be interested by
CTFC.
(2) CYTFH-II holds 46.65% direct interest in CTFC and is accordingly deemed to have an interest in the shares deemed to be interested by
CTFC.
(3) CTFC holds 78.58% direct interest in CTFHL and is accordingly deemed to have an interest in the shares deemed to be interested by
CTFHL.
(4) CTFHL holds 100% direct interest in CTF and is accordingly deemed to have an interest in the shares interested by or deemed to be
interested by CTF.
(5) CTF together with its subsidiaries.
Save as disclosed above, there is no other interest recorded in the register that is required to be kept under section 336
of the SFO as at 31 December 2015.
CORPORATE INFORMATION
New World Development Company Limited CORPORATE INFORMATION 56
Emeritus ChairmanDato’ Dr. Cheng Yu-Tung
Board of DirectorsExecutive DirectorsDr. Cheng Kar-Shun, Henry GBS (Chairman)
Dr. Cheng Chi-Kong, Adrian (Executive Vice-chairman and
Joint General Manager)
Mr. Chen Guanzhan (Joint General Manager)
Ms. Ki Man-Fung, Leonie SBS JP
Mr. Cheng Chi-Heng
Ms. Cheng Chi-Man, Sonia
Mr. Au Tak-Cheong
Non-executive DirectorsMr. Doo Wai-Hoi, William JP (Non-executive Vice-chairman)
Mr. Cheng Kar-Shing, Peter
Independent Non-executive DirectorsMr. Yeung Ping-Leung, Howard
Mr. Cha Mou-Sing, Payson JP
Mr. Cha Mou-Zing, Victor
(Alternate Director to Mr. Cha Mou-Sing, Payson)
Mr. Ho Hau-Hay, Hamilton
Mr. Lee Luen-Wai, John BBS JP
Mr. Liang Cheung-Biu, Thomas
Company SecretaryMr. Wong Man-Hoi
AuditorPricewaterhouseCoopers
SolicitorsWoo, Kwan, Lee & Lo
Kao, Lee & Yip
Vincent T.K. Cheung, Yap & Co
Iu, Lai & Li
Eversheds
Share Registrar and Transfer OfficeTricor Tengis Limited
Level 22, Hopewell Centre,
183 Queen’s Road East,
Hong Kong
Registered Office30/F., New World Tower,
18 Queen’s Road Central, Hong Kong
Tel: (852) 2523 1056
Fax: (852) 2810 4673
Principal BankersAgricultural Bank of China
Bank of China (Hong Kong)
Bank of Communications
Bank of East Asia
China Construction Bank (Asia)
China Development Bank
China Merchants Bank
Citibank N.A.
DBS Bank
Hang Seng Bank
Industrial and Commercial Bank of China (Asia)
Mizuho Bank
Nanyang Commercial Bank
Sumitomo Mitsui Banking Corporation
Standard Chartered Bank
The Hongkong and Shanghai Banking Corporation
The Bank of Tokyo-Mitsubishi UFJ
Stock CodeHong Kong Stock Exchange 0017
Reuters 0017.HK
Bloomberg 17 HK
Information for InvestorsFor more information about the Group,
please contact the Investor Relations Department of
the Company at:
30/F., New World Tower,
18 Queen’s Road Central,
Hong Kong
Tel: (852) 2523 1056
Fax: (852) 2810 4673
e-mail: [email protected]
Websitewww.nwd.com.hk