Embed Size (px)
Citation preview
FY17 Half Year ResultspresentationPresented by John Flavell (CEO)and Susan Mitchell (CFO)
Half Year ending December 2016
FY17
For
per
sona
l use
onl
y
Mortgage Choice FY17 Half Year Results presentation 2
Today:
1. Introduction
2. Financial performance
3. Progress against FY17 focus
4. Appendices
For
per
sona
l use
onl
y

Introduction
Mortgage Choice FY17 Half Year Results presentation 3
For
per
sona
l use
onl
y
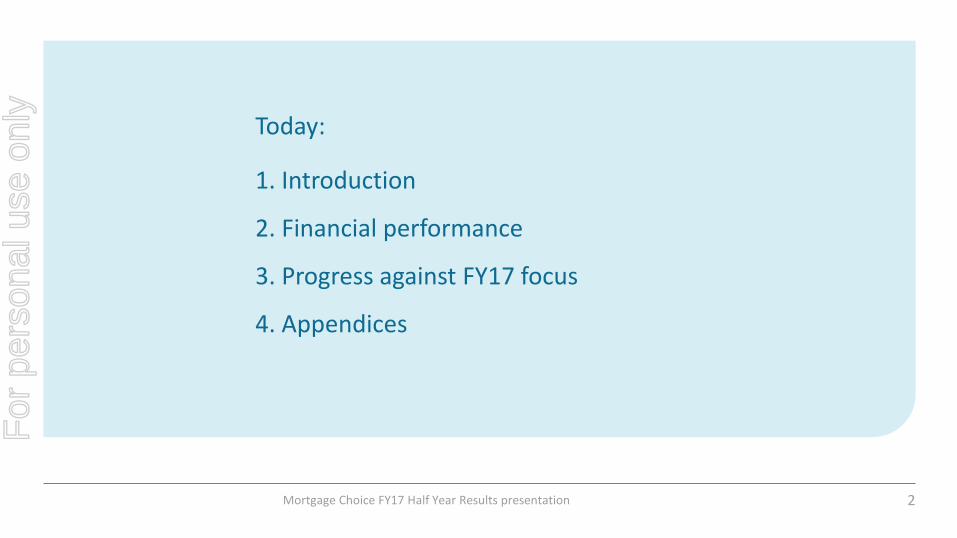
Highlights summary
Mortgage Choice FY17 Half Year Results presentation 4
Cash NPAT up by 16.2% Assisted by closure of HMC
Financial Planning profitableConsistently profitable on a monthly basis
Record half year lending resultSettlements of $6.4b
Dividend 8.5c Record interim dividend - up from 8.0c 1H16
For
per
sona
l use
onl
y
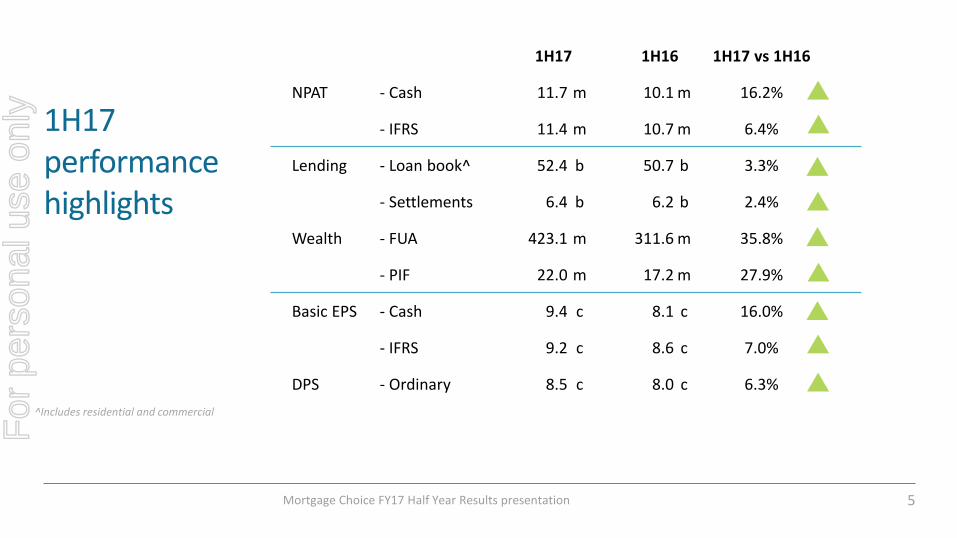
1H17performancehighlights
Mortgage Choice FY17 Half Year Results presentation 5
^Includes residential and commercial
1H17 1H16 1H17 vs 1H16
NPAT - Cash 11.7 m 10.1 m 16.2%
- IFRS 11.4 m 10.7 m 6.4%
Lending - Loan book^ 52.4 b 50.7 b 3.3%
- Settlements 6.4 b 6.2 b 2.4%
Wealth - FUA 423.1 m 311.6 m 35.8%
- PIF 22.0 m 17.2 m 27.9%
Basic EPS - Cash 9.4 c 8.1 c 16.0%
- IFRS 9.2 c 8.6 c 7.0%
DPS - Ordinary 8.5 c 8.0 c 6.3%
For
per
sona
l use
onl
y

Financial performance
Mortgage Choice FY17 Half Year Results presentation 6
For
per
sona
l use
onl
y
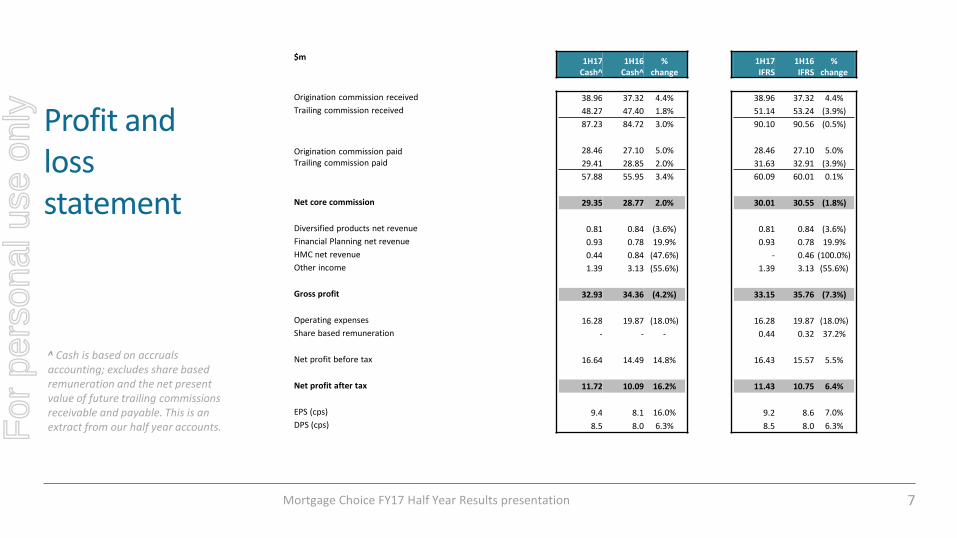
Profit and loss statement
Mortgage Choice FY17 Half Year Results presentation 7
^ Cash is based on accruals accounting; excludes share based remuneration and the net present value of future trailing commissions receivable and payable. This is an extract from our half year accounts.
$m 1H17 Cash^
1H16 Cash^
% change
1H17IFRS
1H16 IFRS
% change
Origination commission received 38.96 37.32 4.4% 38.96 37.32 4.4%
Trailing commission received 48.27 47.40 1.8% 51.14 53.24 (3.9%)
87.23 84.72 3.0% 90.10 90.56 (0.5%)
Origination commission paid 28.46 27.10 5.0% 28.46 27.10 5.0%
Trailing commission paid 29.41 28.85 2.0% 31.63 32.91 (3.9%)
57.88 55.95 3.4% 60.09 60.01 0.1%
Net core commission 29.35 28.77 2.0% 30.01 30.55 (1.8%)
Diversified products net revenue 0.81 0.84 (3.6%) 0.81 0.84 (3.6%)
Financial Planning net revenue 0.93 0.78 19.9% 0.93 0.78 19.9%
HMC net revenue 0.44 0.84 (47.6%) - 0.46 (100.0%)
Other income 1.39 3.13 (55.6%) 1.39 3.13 (55.6%)
Gross profit 32.93 34.36 (4.2%) 33.15 35.76 (7.3%)
Operating expenses 16.28 19.87 (18.0%) 16.28 19.87 (18.0%)
Share based remuneration - - - 0.44 0.32 37.2%
Net profit before tax 16.64 14.49 14.8% 16.43 15.57 5.5%
Net profit after tax 11.72 10.09 16.2% 11.43 10.75 6.4%
EPS (cps) 9.4 8.1 16.0% 9.2 8.6 7.0%
DPS (cps) 8.5 8.0 6.3% 8.5 8.0 6.3%For
per
sona
l use
onl
y

NPBT records strong growth
Mortgage Choice FY17 Half Year Results presentation 8
15,345
16,202
16,644
8 28
583
155 155
442
1H16 Cash NPBT(excluding HMC)
MC Net Commission FP net revenue Other income excl.PD events
OPEX excl. PDevents
PD events net cost 1H17 Cash NPBT(excluding HMC)
HMC Cash NPBT 1H17 Cash NPBT
Net profit before tax
$'000
• Cash net profit for the half is driven by an increase in net commission income, an increase in revenue generated by FP, and a strong control on OPEX
• The timing of the national professional development events has changed. In FY16 the professional development events occurred in the first half of the year, but in FY17, these events will occur in the second half of the year. This affects the direct comparison for ‘other income’ and ‘operating expense’ between the two periods, but the impact to the net profit before tax result is essentially neutral
• In comparison to 1H17, 1H16 absorbed all of the costs associated with the closure of the Help Me Choose division. The division continues the orderly collection of trailing commission for products introduced prior to closure
For
per
sona
l use
onl
y
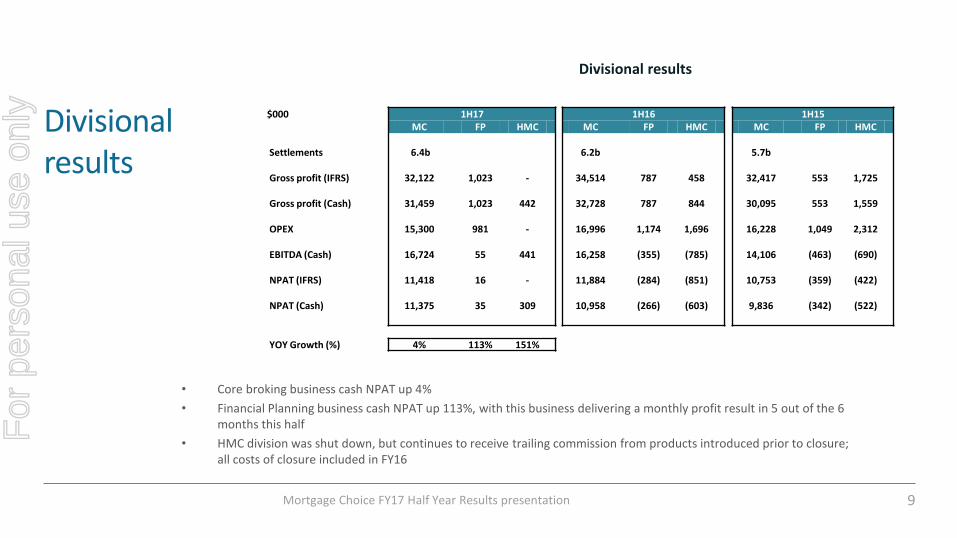
Divisional results
Mortgage Choice FY17 Half Year Results presentation 9
Divisional results
$000 1H17 1H16 1H15MC FP HMC MC FP HMC MC FP HMC
Settlements 6.4b 6.2b 5.7b
Gross profit (IFRS) 32,122 1,023 - 34,514 787 458 32,417 553 1,725
Gross profit (Cash) 31,459 1,023 442 32,728 787 844 30,095 553 1,559
OPEX 15,300 981 - 16,996 1,174 1,696 16,228 1,049 2,312
EBITDA (Cash) 16,724 55 441 16,258 (355) (785) 14,106 (463) (690)
NPAT (IFRS) 11,418 16 - 11,884 (284) (851) 10,753 (359) (422)
NPAT (Cash) 11,375 35 309 10,958 (266) (603) 9,836 (342) (522)
YOY Growth (%) 4% 113% 151%
• Core broking business cash NPAT up 4%
• Financial Planning business cash NPAT up 113%, with this business delivering a monthly profit result in 5 out of the 6 months this half
• HMC division was shut down, but continues to receive trailing commission from products introduced prior to closure; all costs of closure included in FY16
For
per
sona
l use
onl
y

Average upfront commission rates have improved
Mortgage Choice FY17 Half Year Results presentation 10
Average rate total book
Average rate total book (estimated)
Average rate new settlements*
* Settlements post GFC changing commission rates
• Average upfront rate for 1H17 is 0.655%
• Average trail rate for 1H17 is 0.189%
0.520%
0.540%
0.560%
0.580%
0.600%
0.620%
0.640%
0.660%
0.680%
Jan
15
Feb
15
Mar
15
Ap
r15
May
15
Jun
15
Jul1
5
Au
g15
Sep
15
Oct
15
No
v15
Dec
15
Jan
16
Feb
16
Mar
16
Ap
r16
May
16
Jun
16
Jul1
6
Au
g16
Sep
16
Oct
16
No
v16
Dec
16
Average upfront rate
0.120%
0.140%
0.160%
0.180%
0.200%
1H16
2H16
1H17
2H17
1H18
2H18
1H19
2H19
1H20
2H20
1H21
2H21
Average trail rate
For
per
sona
l use
onl
y
Progress against FY17 focus areas
Mortgage Choice FY17 Half Year Results presentation 11
For
per
sona
l use
onl
y
FY17 focus areas
Mortgage Choice FY17 Half Year Results presentation 12
Market share growth
NPAT growth(positive jaws)
Increase and diversify franchisee revenue
Brand awareness and engagement
For
per
sona
l use
onl
y
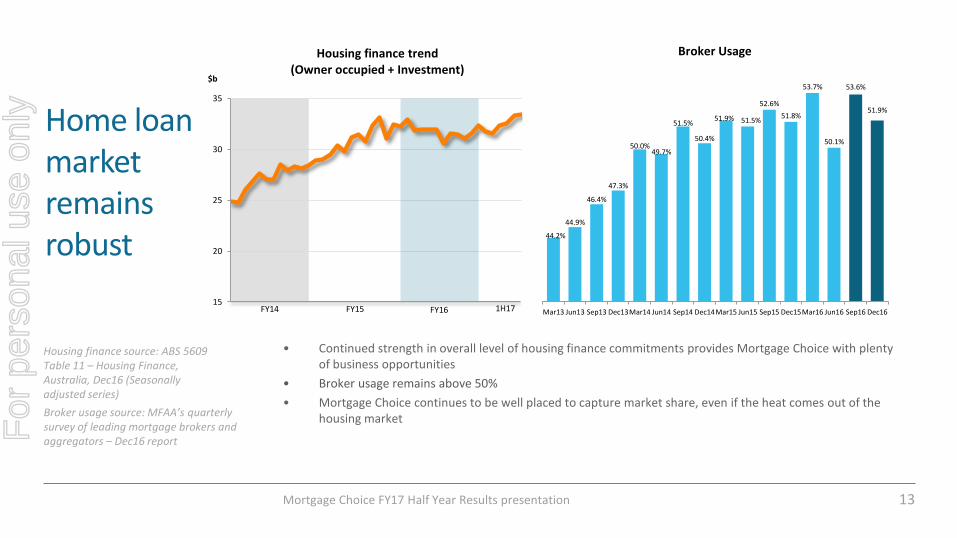
Home loan market remains robust
Mortgage Choice FY17 Half Year Results presentation 13
Broker usage source: MFAA’s quarterly survey of leading mortgage brokers and aggregators – Dec16 report
Housing finance source: ABS 5609 Table 11 – Housing Finance, Australia, Dec16 (Seasonally adjusted series)
15
20
25
30
35
$b
Housing finance trend(Owner occupied + Investment)
FY14 FY15 FY16 1H17
44.2%
44.9%
46.4%
47.3%
50.0%49.7%
51.5%
50.4%
51.9% 51.5%
52.6%
51.8%
53.7%
50.1%
53.6%
51.9%
Mar13 Jun13 Sep13 Dec13Mar14 Jun14 Sep14 Dec14Mar15 Jun15 Sep15 Dec15Mar16 Jun16 Sep16 Dec16
Broker Usage
• Continued strength in overall level of housing finance commitments provides Mortgage Choice with plenty of business opportunities
• Broker usage remains above 50%
• Mortgage Choice continues to be well placed to capture market share, even if the heat comes out of the housing marketF
or p
erso
nal u
se o
nly
Mortgage Choice FY17 Half Year Results presentation 14
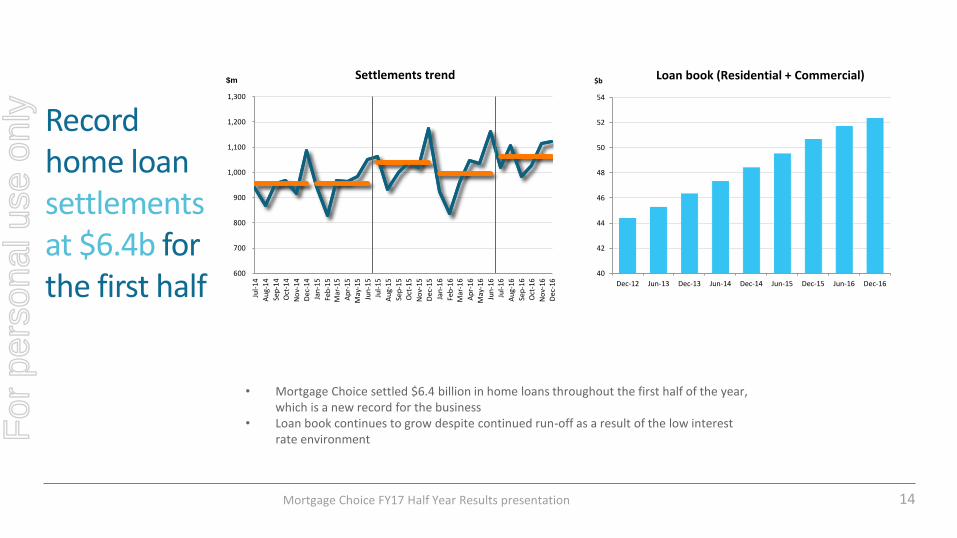
Record home loan settlements at $6.4b for the first half
40
42
44
46
48
50
52
54
Dec-12 Jun-13 Dec-13 Jun-14 Dec-14 Jun-15 Dec-15 Jun-16 Dec-16
$b Loan book (Residential + Commercial)
600
700
800
900
1,000
1,100
1,200
1,300
Jul-
14
Au
g-14
Sep
-14
Oct
-14
No
v-14
Dec
-14
Jan
-15
Feb
-15
Mar
-15
Ap
r-15
May
-15
Jun
-15
Jul-
15
Au
g-15
Sep
-15
Oct
-15
No
v-15
Dec
-15
Jan
-16
Feb
-16
Mar
-16
Ap
r-16
May
-16
Jun
-16
Jul-
16
Au
g-16
Sep
-16
Oct
-16
No
v-16
Dec
-16
$mSettlements trend
• Mortgage Choice settled $6.4 billion in home loans throughout the first half of the year, which is a new record for the business
• Loan book continues to grow despite continued run-off as a result of the low interest rate environmentF
or p
erso
nal u
se o
nly
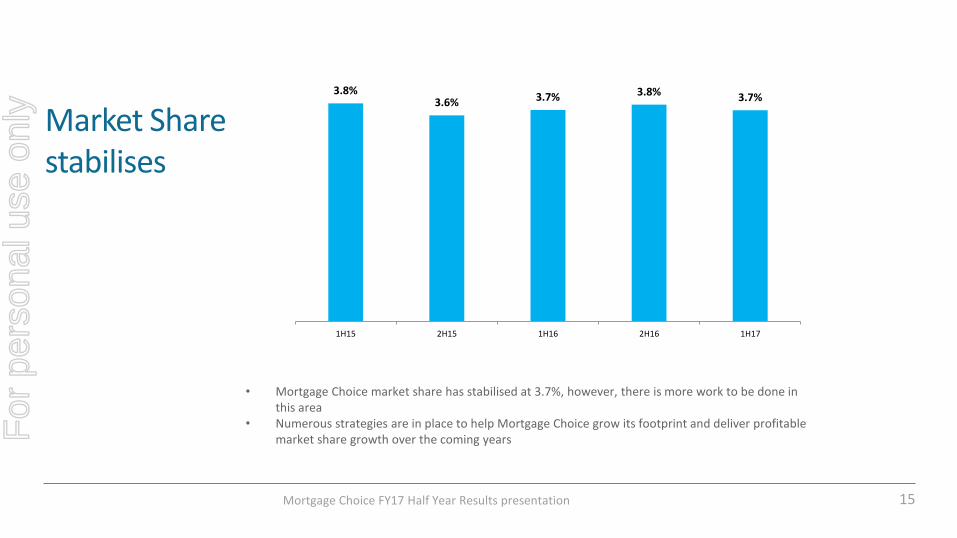
Market Share stabilises
Mortgage Choice FY17 Half Year Results presentation 15
• Mortgage Choice market share has stabilised at 3.7%, however, there is more work to be done in this area
• Numerous strategies are in place to help Mortgage Choice grow its footprint and deliver profitable market share growth over the coming years
3.8%3.6% 3.7% 3.8% 3.7%
1H15 2H15 1H16 2H16 1H17
For
per
sona
l use
onl
y
Mortgage Choice FY17 Half Year Results presentation 16
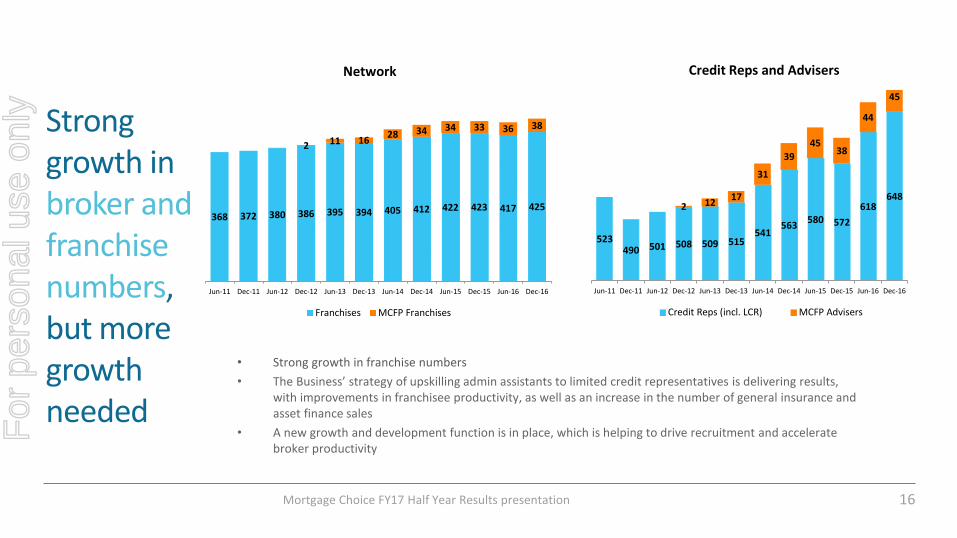
Strong growth in broker and franchise numbers, but more growth needed
368 372 380 386 395 394 405 412 422 423 417 425
2 11 1628 34 34 33 36 38
Jun-11 Dec-11 Jun-12 Dec-12 Jun-13 Dec-13 Jun-14 Dec-14 Jun-15 Dec-15 Jun-16 Dec-16
Network
Franchises MCFP Franchises
523490 501 508 509 515
541563
580 572
618648
2 1217
31
39
4538
44
45
Jun-11 Dec-11 Jun-12 Dec-12 Jun-13 Dec-13 Jun-14 Dec-14 Jun-15 Dec-15 Jun-16 Dec-16
Credit Reps and Advisers
Credit Reps (incl. LCR) MCFP Advisers
• Strong growth in franchise numbers
• The Business’ strategy of upskilling admin assistants to limited credit representatives is delivering results, with improvements in franchisee productivity, as well as an increase in the number of general insurance and asset finance sales
• A new growth and development function is in place, which is helping to drive recruitment and accelerate broker productivity
For
per
sona
l use
onl
y
Mortgage Choice FY17 Half Year Results presentation 17
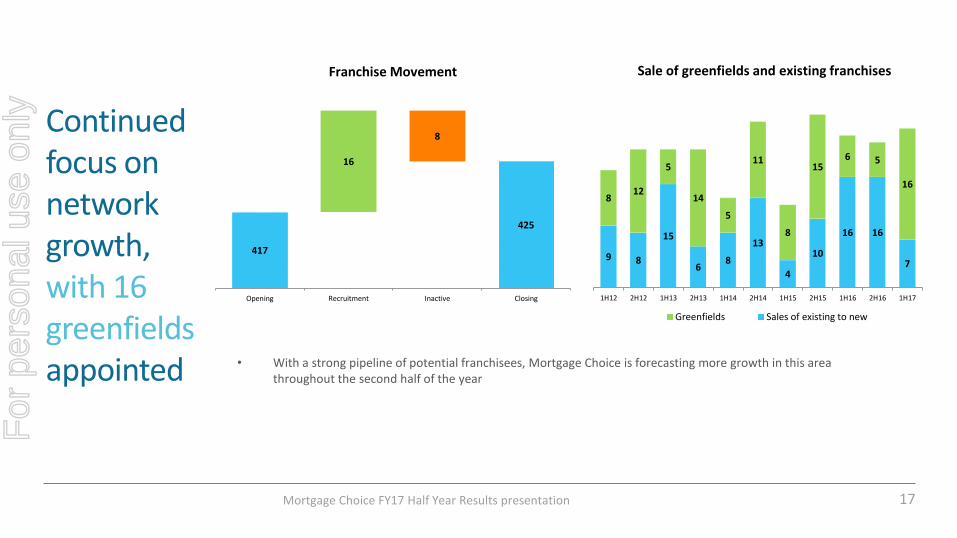
Continued focus on network growth, with 16 greenfieldsappointed • With a strong pipeline of potential franchisees, Mortgage Choice is forecasting more growth in this area
throughout the second half of the year
9 8
15
68
13
4
10
16 16
7
812
5
14
5
11
8
156 5
16
1H12 2H12 1H13 2H13 1H14 2H14 1H15 2H15 1H16 2H16 1H17
Sale of greenfields and existing franchises
Greenfields Sales of existing to new
417
425
16
8
Opening Recruitment Inactive Closing
Franchise Movement
For
per
sona
l use
onl
y
Mortgage Choice FY17 Half Year Results presentation 18
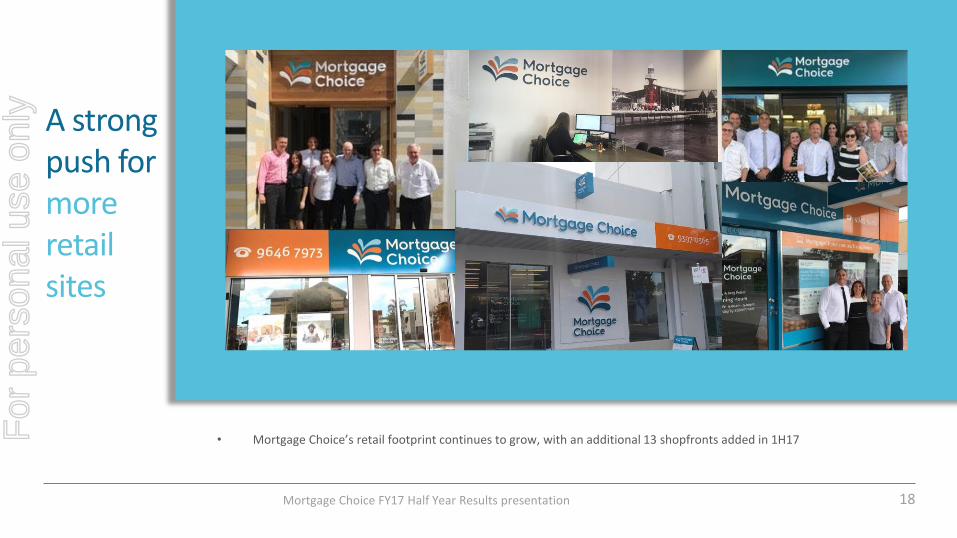
A strong push for more retail sites
• Mortgage Choice’s retail footprint continues to grow, with an additional 13 shopfronts added in 1H17For
per
sona
l use
onl
y
Mortgage Choice FY17 Half Year Results presentation 19
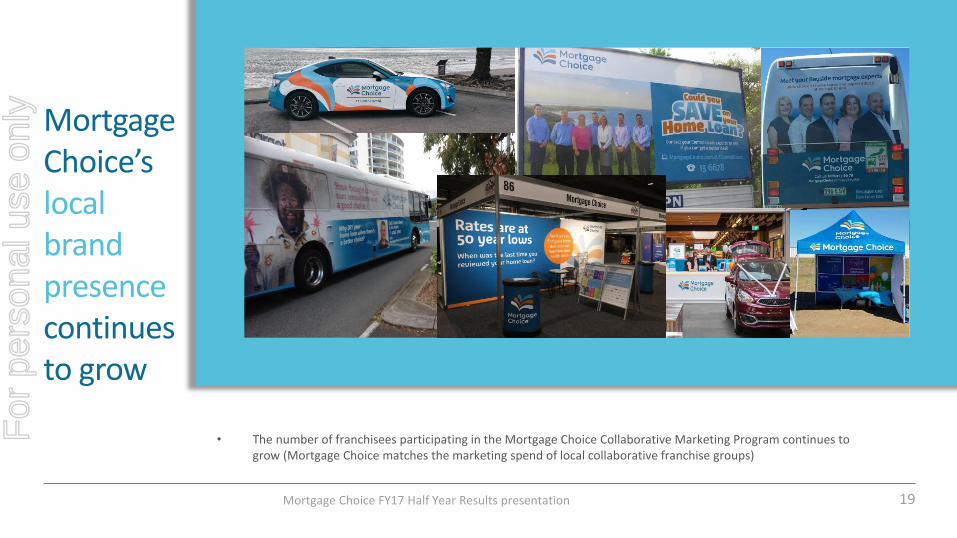
Mortgage Choice’s local brand presence continues to grow
• The number of franchisees participating in the Mortgage Choice Collaborative Marketing Program continues to grow (Mortgage Choice matches the marketing spend of local collaborative franchise groups)
For
per
sona
l use
onl
y
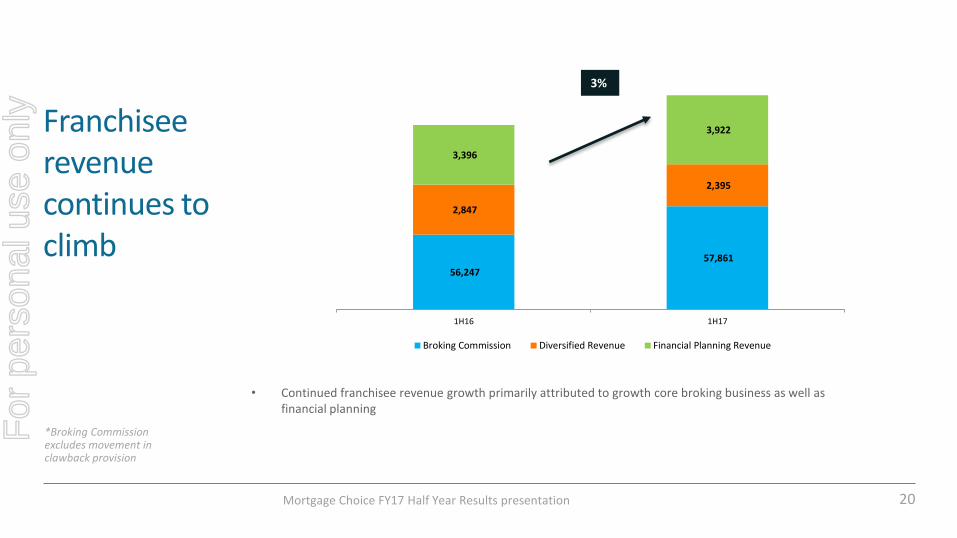
Mortgage Choice FY17 Half Year Results presentation 20
3%
*Broking Commission excludes movement in clawback provision
56,247
57,861
2,847
2,395
3,396
3,922
1H16 1H17
Broking Commission Diversified Revenue Financial Planning Revenue
• Continued franchisee revenue growth primarily attributed to growth core broking business as well as financial planning
Franchisee revenuecontinues to climb
For
per
sona
l use
onl
y
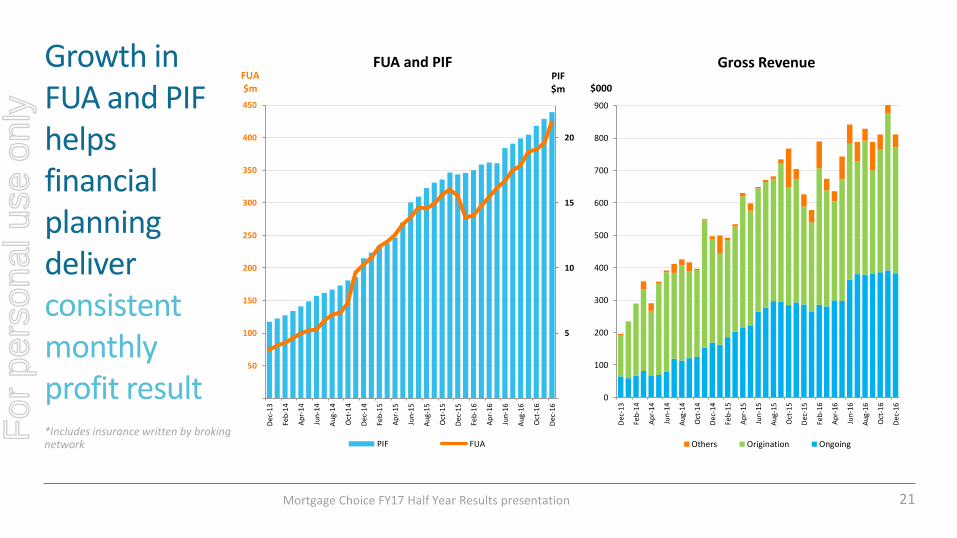
Mortgage Choice FY17 Half Year Results presentation 21
*Includes insurance written by broking network
Growth in FUA and PIF helps financial planning deliver consistent monthly profit result 0
100
200
300
400
500
600
700
800
900
Dec
-13
Feb
-14
Ap
r-14
Jun
-14
Au
g-14
Oct
-14
Dec
-14
Feb
-15
Ap
r-15
Jun
-15
Au
g-15
Oct
-15
Dec
-15
Feb
-16
Ap
r-16
Jun
-16
Au
g-16
Oct
-16
Dec
-16
$000
Gross Revenue
Others Origination Ongoing
5
10
15
20
50
100
150
200
250
300
350
400
450
Dec
-13
Feb
-14
Ap
r-14
Jun
-14
Au
g-14
Oct
-14
Dec
-14
Feb
-15
Ap
r-15
Jun
-15
Au
g-15
Oct
-15
Dec
-15
Feb
-16
Ap
r-16
Jun
-16
Au
g-16
Oct
-16
Dec
-16
PIF $m
FUA $m
FUA and PIF
PIF FUA
For
per
sona
l use
onl
y
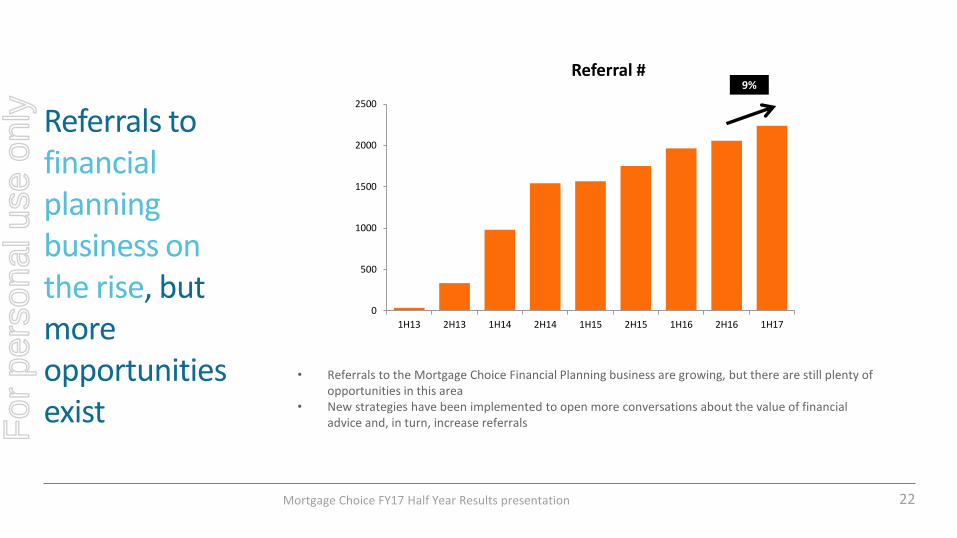
Referrals to financial planning business on the rise, but more opportunities exist
Mortgage Choice FY17 Half Year Results presentation 22
• Referrals to the Mortgage Choice Financial Planning business are growing, but there are still plenty of opportunities in this area
• New strategies have been implemented to open more conversations about the value of financial advice and, in turn, increase referrals
0
500
1000
1500
2000
2500
1H13 2H13 1H14 2H14 1H15 2H15 1H16 2H16 1H17
Referral #9%
For
per
sona
l use
onl
y
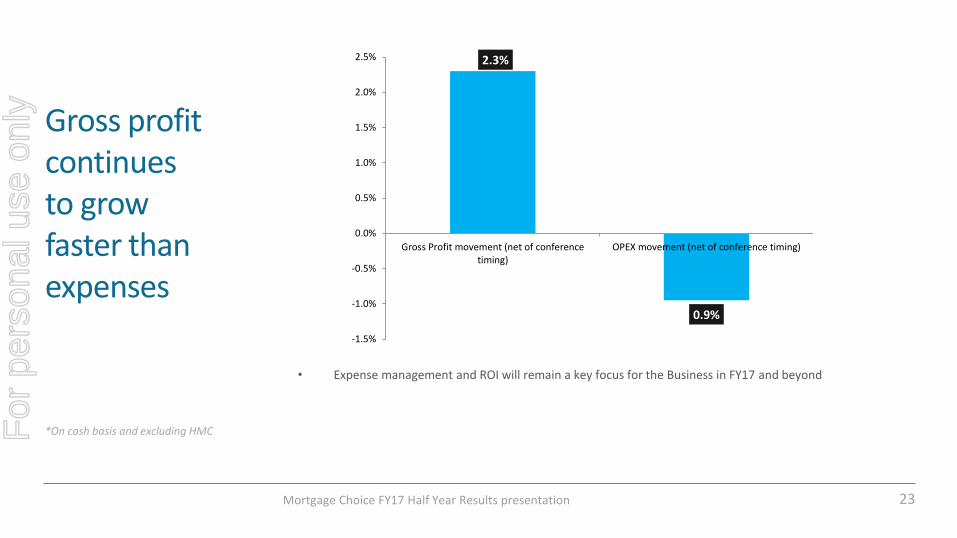
Gross profit continues to grow faster than expenses
Mortgage Choice FY17 Half Year Results presentation 23
*On cash basis and excluding HMC
• Expense management and ROI will remain a key focus for the Business in FY17 and beyond
2.3%
0.9%
-1.5%
-1.0%
-0.5%
0.0%
0.5%
1.0%
1.5%
2.0%
2.5%
Gross Profit movement (net of conferencetiming)
OPEX movement (net of conference timing)
For
per
sona
l use
onl
y
Summary
Mortgage Choice FY17 Half Year Results presentation 24
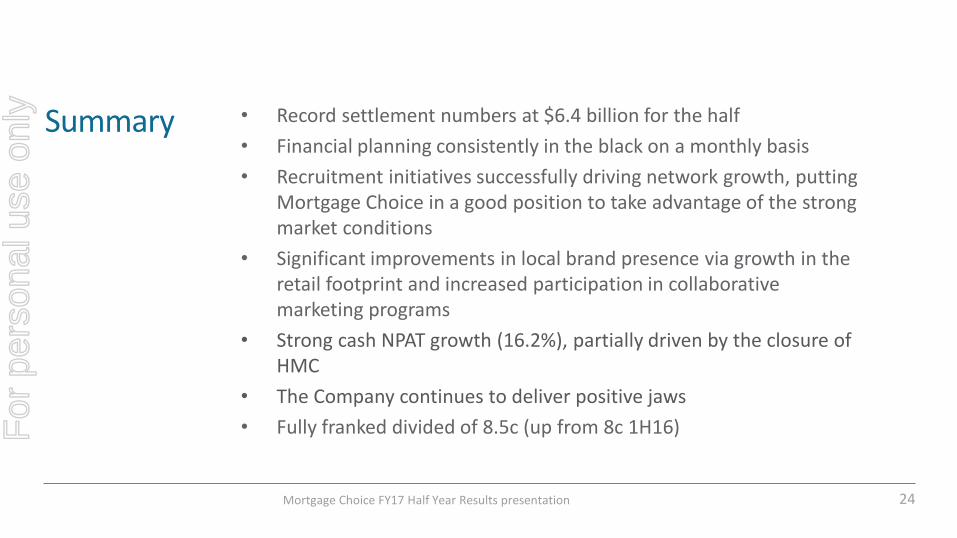
• Record settlement numbers at $6.4 billion for the half
• Financial planning consistently in the black on a monthly basis
• Recruitment initiatives successfully driving network growth, putting Mortgage Choice in a good position to take advantage of the strong market conditions
• Significant improvements in local brand presence via growth in the retail footprint and increased participation in collaborative marketing programs
• Strong cash NPAT growth (16.2%), partially driven by the closure of HMC
• The Company continues to deliver positive jaws
• Fully franked divided of 8.5c (up from 8c 1H16)For
per
sona
l use
onl
y
Strategy on a page
Mortgage Choice FY17 Half Year Results presentation 25
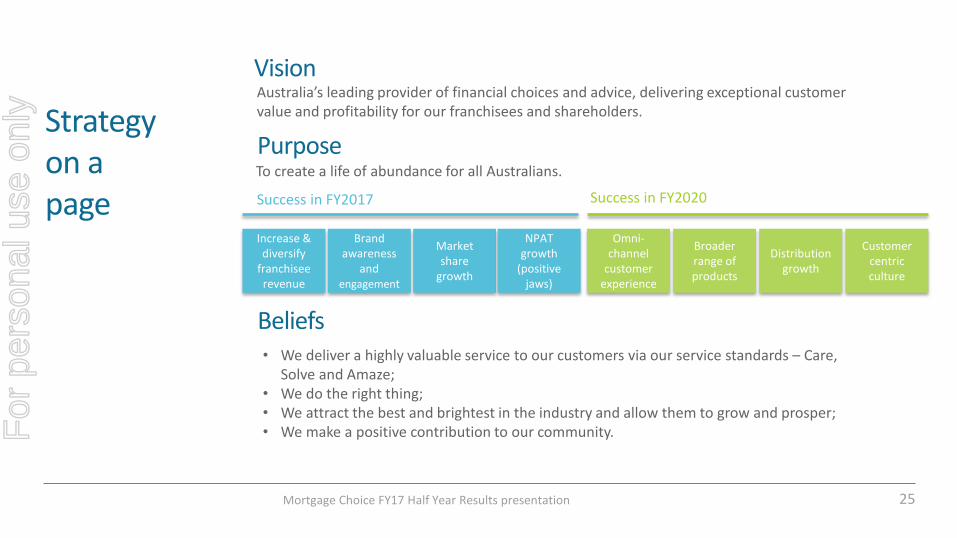
VisionAustralia’s leading provider of financial choices and advice, delivering exceptional customer value and profitability for our franchisees and shareholders.
PurposeTo create a life of abundance for all Australians.
Beliefs• We deliver a highly valuable service to our customers via our service standards – Care,
Solve and Amaze;• We do the right thing;• We attract the best and brightest in the industry and allow them to grow and prosper;• We make a positive contribution to our community.
Increase & diversify
franchisee revenue
Brand awareness
and engagement
Market share
growth
NPAT growth
(positive jaws)
Omni-channel
customer experience
Broader range of products
Distribution growth
Customer centric culture
Success in FY2017 Success in FY2020
For
per
sona
l use
onl
y

Questions?
Mortgage Choice FY17 Half Year Results presentation 26
For
per
sona
l use
onl
y
Appendices
Mortgage Choice FY17 Half Year Results presentation 27
For
per
sona
l use
onl
y
Yearly stats – P/L
Mortgage Choice FY17 Half Year Results presentation 28
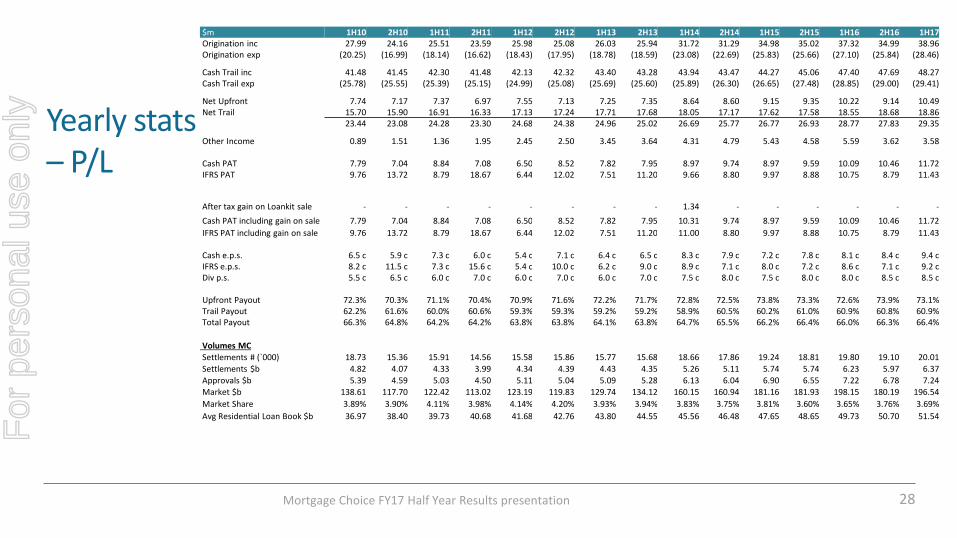
$m 1H10 2H10 1H11 2H11 1H12 2H12 1H13 2H13 1H14 2H14 1H15 2H15 1H16 2H16 1H17 Origination inc 27.99 24.16 25.51 23.59 25.98 25.08 26.03 25.94 31.72 31.29 34.98 35.02 37.32 34.99 38.96 Origination exp (20.25) (16.99) (18.14) (16.62) (18.43) (17.95) (18.78) (18.59) (23.08) (22.69) (25.83) (25.66) (27.10) (25.84) (28.46)
Cash Trail inc 41.48 41.45 42.30 41.48 42.13 42.32 43.40 43.28 43.94 43.47 44.27 45.06 47.40 47.69 48.27 Cash Trail exp (25.78) (25.55) (25.39) (25.15) (24.99) (25.08) (25.69) (25.60) (25.89) (26.30) (26.65) (27.48) (28.85) (29.00) (29.41)
Net Upfront 7.74 7.17 7.37 6.97 7.55 7.13 7.25 7.35 8.64 8.60 9.15 9.35 10.22 9.14 10.49 Net Trail 15.70 15.90 16.91 16.33 17.13 17.24 17.71 17.68 18.05 17.17 17.62 17.58 18.55 18.68 18.86
23.44 23.08 24.28 23.30 24.68 24.38 24.96 25.02 26.69 25.77 26.77 26.93 28.77 27.83 29.35
Other Income 0.89 1.51 1.36 1.95 2.45 2.50 3.45 3.64 4.31 4.79 5.43 4.58 5.59 3.62 3.58
Cash PAT 7.79 7.04 8.84 7.08 6.50 8.52 7.82 7.95 8.97 9.74 8.97 9.59 10.09 10.46 11.72 IFRS PAT 9.76 13.72 8.79 18.67 6.44 12.02 7.51 11.20 9.66 8.80 9.97 8.88 10.75 8.79 11.43
After tax gain on Loankit sale - - - - - - - - 1.34 - - - - - -
Cash PAT including gain on sale 7.79 7.04 8.84 7.08 6.50 8.52 7.82 7.95 10.31 9.74 8.97 9.59 10.09 10.46 11.72
IFRS PAT including gain on sale 9.76 13.72 8.79 18.67 6.44 12.02 7.51 11.20 11.00 8.80 9.97 8.88 10.75 8.79 11.43
Cash e.p.s. 6.5 c 5.9 c 7.3 c 6.0 c 5.4 c 7.1 c 6.4 c 6.5 c 8.3 c 7.9 c 7.2 c 7.8 c 8.1 c 8.4 c 9.4 cIFRS e.p.s. 8.2 c 11.5 c 7.3 c 15.6 c 5.4 c 10.0 c 6.2 c 9.0 c 8.9 c 7.1 c 8.0 c 7.2 c 8.6 c 7.1 c 9.2 cDiv p.s. 5.5 c 6.5 c 6.0 c 7.0 c 6.0 c 7.0 c 6.0 c 7.0 c 7.5 c 8.0 c 7.5 c 8.0 c 8.0 c 8.5 c 8.5 c
Upfront Payout 72.3% 70.3% 71.1% 70.4% 70.9% 71.6% 72.2% 71.7% 72.8% 72.5% 73.8% 73.3% 72.6% 73.9% 73.1%Trail Payout 62.2% 61.6% 60.0% 60.6% 59.3% 59.3% 59.2% 59.2% 58.9% 60.5% 60.2% 61.0% 60.9% 60.8% 60.9%Total Payout 66.3% 64.8% 64.2% 64.2% 63.8% 63.8% 64.1% 63.8% 64.7% 65.5% 66.2% 66.4% 66.0% 66.3% 66.4%
Volumes MC
Settlements # (`000) 18.73 15.36 15.91 14.56 15.58 15.86 15.77 15.68 18.66 17.86 19.24 18.81 19.80 19.10 20.01
Settlements $b 4.82 4.07 4.33 3.99 4.34 4.39 4.43 4.35 5.26 5.11 5.74 5.74 6.23 5.97 6.37
Approvals $b 5.39 4.59 5.03 4.50 5.11 5.04 5.09 5.28 6.13 6.04 6.90 6.55 7.22 6.78 7.24
Market $b 138.61 117.70 122.42 113.02 123.19 119.83 129.74 134.12 160.15 160.94 181.16 181.93 198.15 180.19 196.54
Market Share 3.89% 3.90% 4.11% 3.98% 4.14% 4.20% 3.93% 3.94% 3.83% 3.75% 3.81% 3.60% 3.65% 3.76% 3.69%
Avg Residential Loan Book $b 36.97 38.40 39.73 40.68 41.68 42.76 43.80 44.55 45.56 46.48 47.65 48.65 49.73 50.70 51.54
For
per
sona
l use
onl
y
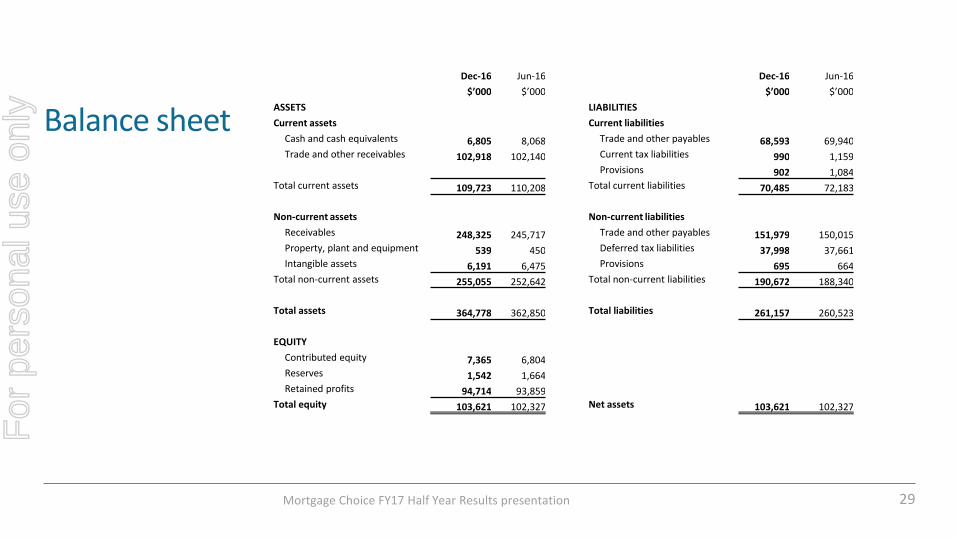
Balance sheet
Mortgage Choice FY17 Half Year Results presentation 29
Dec-16 Jun-16 Dec-16 Jun-16
$’000 $’000 $’000 $’000
ASSETS LIABILITIES
Current assets Current liabilities
Cash and cash equivalents 6,805 8,068 Trade and other payables 68,593 69,940Trade and other receivables 102,918 102,140 Current tax liabilities 990 1,159
Provisions 902 1,084Total current assets 109,723 110,208 Total current liabilities 70,485 72,183
Non-current assets Non-current liabilities
Receivables 248,325 245,717 Trade and other payables 151,979 150,015Property, plant and equipment 539 450 Deferred tax liabilities 37,998 37,661Intangible assets 6,191 6,475 Provisions 695 664
Total non-current assets 255,055 252,642 Total non-current liabilities 190,672 188,340
Total assets 364,778 362,850 Total liabilities 261,157 260,523
EQUITY
Contributed equity 7,365 6,804Reserves 1,542 1,664Retained profits 94,714 93,859
Total equity 103,621 102,327 Net assets 103,621 102,327
For
per
sona
l use
onl
y
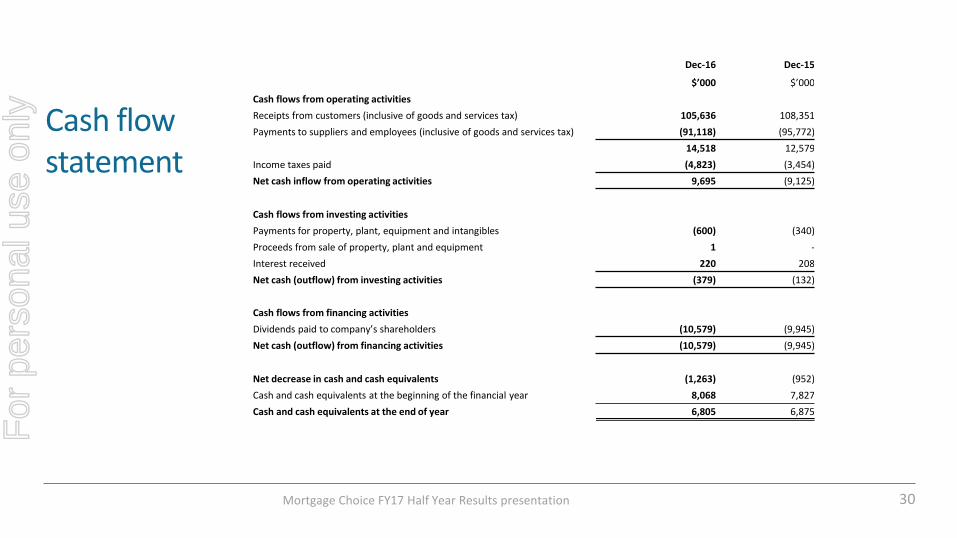
Cash flow statement
Mortgage Choice FY17 Half Year Results presentation 30
Dec-16 Dec-15
$’000 $’000
Cash flows from operating activities
Receipts from customers (inclusive of goods and services tax) 105,636 108,351
Payments to suppliers and employees (inclusive of goods and services tax) (91,118) (95,772)
14,518 12,579
Income taxes paid (4,823) (3,454)
Net cash inflow from operating activities 9,695 (9,125)
Cash flows from investing activities
Payments for property, plant, equipment and intangibles (600) (340)
Proceeds from sale of property, plant and equipment 1 -
Interest received 220 208
Net cash (outflow) from investing activities (379) (132)
Cash flows from financing activities
Dividends paid to company’s shareholders (10,579) (9,945)
Net cash (outflow) from financing activities (10,579) (9,945)
Net decrease in cash and cash equivalents (1,263) (952)
Cash and cash equivalents at the beginning of the financial year 8,068 7,827
Cash and cash equivalents at the end of year 6,805 6,875
For
per
sona
l use
onl
y
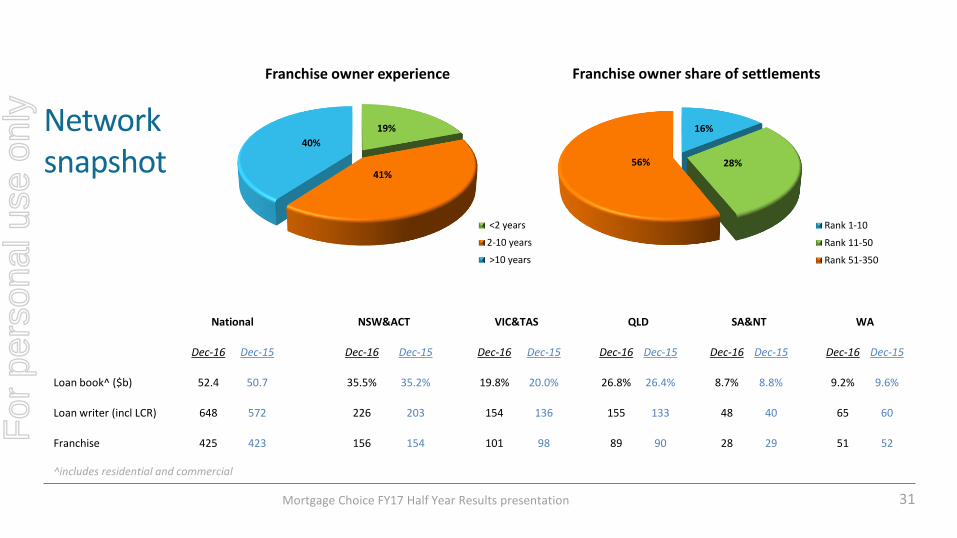
Network snapshot
Mortgage Choice FY17 Half Year Results presentation 31
16%
28%56%
Franchise owner share of settlements
Rank 1-10
Rank 11-50
Rank 51-350
National NSW&ACT VIC&TAS QLD SA&NT WA
Dec-16 Dec-15 Dec-16 Dec-15 Dec-16 Dec-15 Dec-16 Dec-15 Dec-16 Dec-15 Dec-16 Dec-15
Loan book^ ($b) 52.4 50.7 35.5% 35.2% 19.8% 20.0% 26.8% 26.4% 8.7% 8.8% 9.2% 9.6%
Loan writer (incl LCR) 648 572 226 203 154 136 155 133 48 40 65 60
Franchise 425 423 156 154 101 98 89 90 28 29 51 52
19%
41%
40%
Franchise owner experience
<2 years
2-10 years
>10 years
^includes residential and commercial
For
per
sona
l use
onl
y
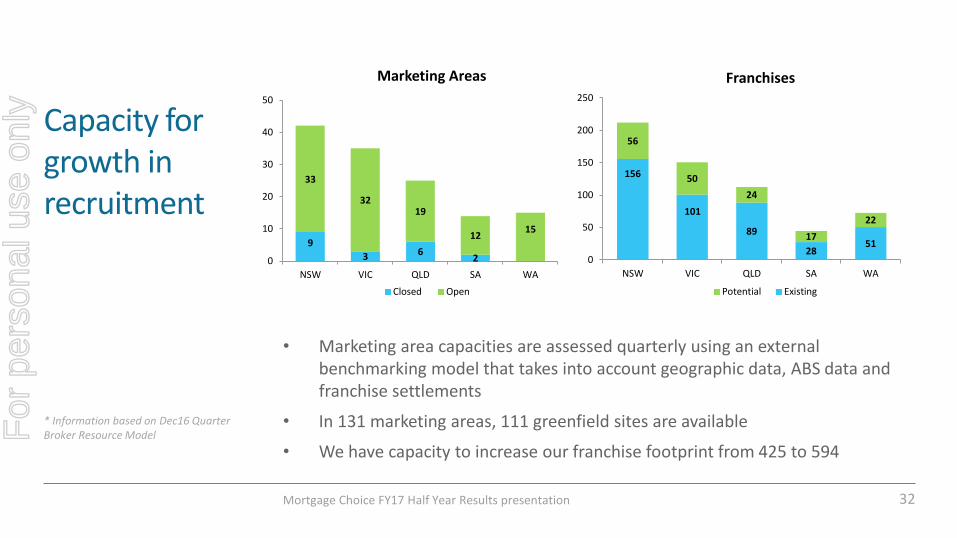
Capacity for growth in recruitment
• Marketing area capacities are assessed quarterly using an external benchmarking model that takes into account geographic data, ABS data and franchise settlements
• In 131 marketing areas, 111 greenfield sites are available
• We have capacity to increase our franchise footprint from 425 to 594
Mortgage Choice FY17 Half Year Results presentation 32
* Information based on Dec16 Quarter Broker Resource Model
9
3 62
33
3219
1215
0
10
20
30
40
50
NSW VIC QLD SA WA
Marketing Areas
Closed Open
156
101
89
2851
56
50
24
17
22
0
50
100
150
200
250
NSW VIC QLD SA WA
Franchises
Potential Existing
For
per
sona
l use
onl
y
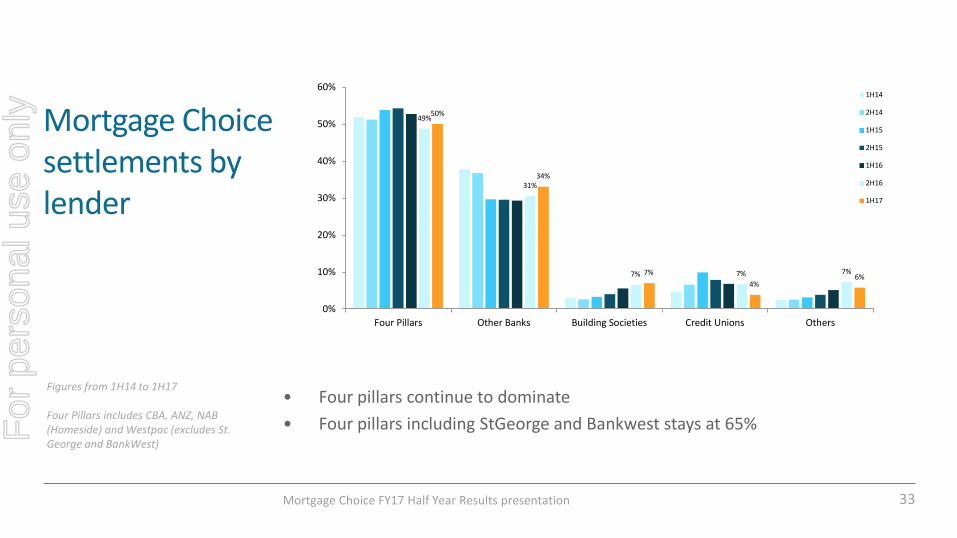
Mortgage Choice settlements by lender
• Four pillars continue to dominate
• Four pillars including StGeorge and Bankwest stays at 65%
Mortgage Choice FY17 Half Year Results presentation 33
Figures from 1H14 to 1H17
Four Pillars includes CBA, ANZ, NAB (Homeside) and Westpac (excludes St. George and BankWest)
49%
31%
7% 7% 7%
50%
34%
7%
4%6%
0%
10%
20%
30%
40%
50%
60%
Four Pillars Other Banks Building Societies Credit Unions Others
1H14
2H14
1H15
2H15
1H16
2H16
1H17
For
per
sona
l use
onl
y
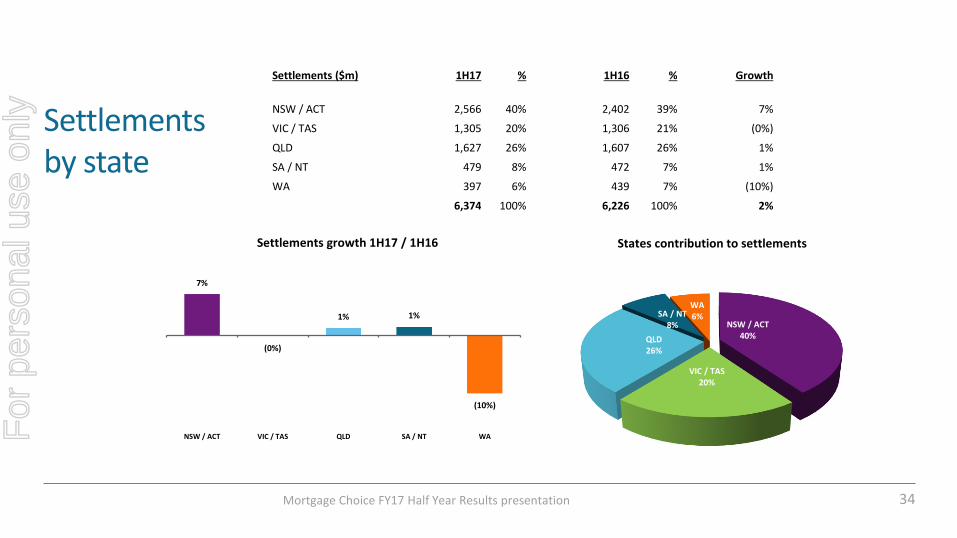
Settlements by state
Mortgage Choice FY17 Half Year Results presentation 34
Settlements ($m) 1H17 % 1H16 % Growth
NSW / ACT 2,566 40% 2,402 39% 7%
VIC / TAS 1,305 20% 1,306 21% (0%)
QLD 1,627 26% 1,607 26% 1%
SA / NT 479 8% 472 7% 1%
WA 397 6% 439 7% (10%)
6,374 100% 6,226 100% 2%
NSW / ACT40%
VIC / TAS20%
QLD26%
SA / NT8%
WA6%
States contribution to settlements
7%
(0%)
1% 1%
(10%)
NSW / ACT VIC / TAS QLD SA / NT WA
Settlements growth 1H17 / 1H16
For
per
sona
l use
onl
y
Disclaimer
Mortgage Choice FY17 Half Year Results presentation 35
The information contained in this presentation is intended to be a general summary of Mortgage Choice Limited (Mortgage Choice) and its activities as at 31 December 2016, and does not purport to be complete in any respect.
The information in this presentation is not advice about shares in Mortgage Choice (or any other financial product), nor is it intended to influence, or be relied upon by, any person in making a decision in relation to Mortgage Choice shares (or any other financial product). This presentation does not take into account the objectives, financial situation or needs of any particular individual. You should consider your own objectives, financial situation and needs when considering this presentation and seek independent investment, legal, tax, accounting or such other advice as you find appropriate before making any financial or investment decision.
This presentation contains some forward looking statements. Such statements only reflect views held by Mortgage Choice as at the date of this presentation and are subject to certain risks, uncertainties and assumptions. Actual events and results may vary from the events or results expressed or implied in these statements. You should not place undue reliance on any of these statements.
No representation or warranty is made in respect of the accuracy or completeness of any information in this presentation, or the likelihood of any of the forward looking statements in the presentation being fulfilled.
For further information visitwww.mortgagechoice.com.au
or contactJessica Darnbrough - Head of Corporate AffairsPh: (02) 8907 0472Email: [email protected]
or p
erso
nal u
se o
nly