Embed Size (px)
Citation preview
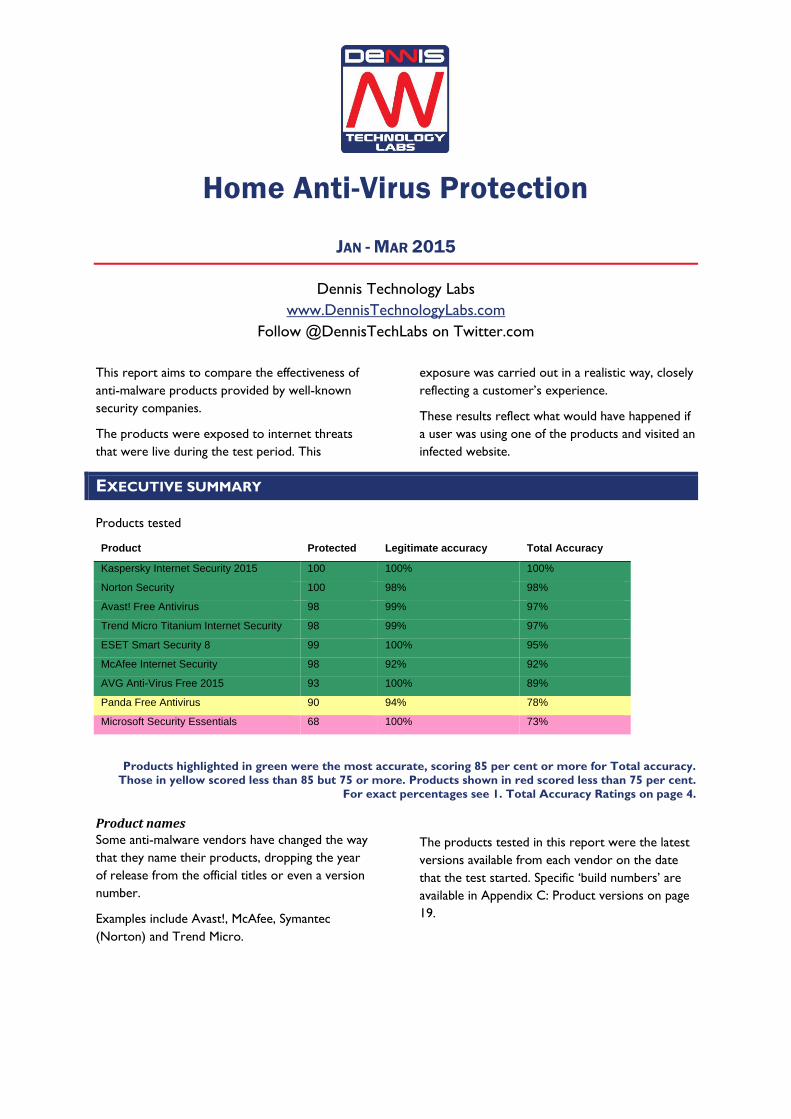
Home Anti-Virus Protection
JAN - MAR 2015
Dennis Technology Labs
www.DennisTechnologyLabs.com
Follow @DennisTechLabs on Twitter.com
This report aims to compare the effectiveness of
anti-malware products provided by well-known
security companies.
The products were exposed to internet threats
that were live during the test period. This
exposure was carried out in a realistic way, closely
reflecting a customer’s experience.
These results reflect what would have happened if
a user was using one of the products and visited an
infected website.
EXECUTIVE SUMMARY
Products tested
Product Protected Legitimate accuracy Total Accuracy
Kaspersky Internet Security 2015 100 100% 100%
Norton Security 100 98% 98%
Avast! Free Antivirus 98 99% 97%
Trend Micro Titanium Internet Security 98 99% 97%
ESET Smart Security 8 99 100% 95%
McAfee Internet Security 98 92% 92%
AVG Anti-Virus Free 2015 93 100% 89%
Panda Free Antivirus 90 94% 78%
Microsoft Security Essentials 68 100% 73%
Products highlighted in green were the most accurate, scoring 85 per cent or more for Total accuracy.
Those in yellow scored less than 85 but 75 or more. Products shown in red scored less than 75 per cent.
For exact percentages see 1. Total Accuracy Ratings on page 4.
Product names Some anti-malware vendors have changed the way
that they name their products, dropping the year
of release from the official titles or even a version
number.
Examples include Avast!, McAfee, Symantec
(Norton) and Trend Micro.
The products tested in this report were the latest
versions available from each vendor on the date
that the test started. Specific ‘build numbers’ are
available in Appendix C: Product versions on page
19.
Home Anti-Virus Protection, Jan - Mar 2015 Page 2 of 20
The effectiveness of free and paid-for anti-malware security suites varies widely.
The most effective protected against between 98 to 100 per cent of threats, while the least effective
(Microsoft Security Essentials) was compromised by 32 per cent of the threats.
In terms of protection, the top five products were from Kaspersky Lab, Symantec (Norton), McAfee,
Trend Micro and Avast!. All but Avast! require a license that costs money.
Blocking malicious sites based on reputation is an effective approach.
Those products that prevented users from visiting the malicious sites in the first place gained a significant
advantage. If the malware can’t download onto the victim’s computer then the anti-malware software
faces less of an ongoing challenge.
Some anti-malware programs are too harsh when evaluating legitimate software
Most of the products would delegate some decisions to users when installing legitimate software. Panda
Free Antivirus was the most paranoid and onerous to use, closely followed by McAfee Internet Security.
Products from AVG, ESET, Kaspersky Lab and Microsoft were unobtrusive, asking no questions and not
blocking a single program.
Which was the best product?
The most accurate programs were Kaspersky Internet Security 2015, Norton Security, Avast! Free
Antivirus, Trend Micro Titanium Internet Security and ESET Smart Security 8, all of which won our AAA
award in this test.
Simon Edwards, Dennis Technology Labs, 17th Apr 2015
Home Anti-Virus Protection, Jan - Mar 2015 Page 3 of 20
CONTENTS
Executive summary ................................................................................................................................................................ 1
Contents .................................................................................................................................................................................. 3
1. Total Accuracy Ratings ..................................................................................................................................................... 4
2. Protection Ratings ............................................................................................................................................................. 6
3. Protection Scores .............................................................................................................................................................. 8
4. Protection Details .............................................................................................................................................................. 9
5. Legitimate Software Ratings ......................................................................................................................................... 10
6. The Tests .......................................................................................................................................................................... 13
7. Test Details ...................................................................................................................................................................... 14
8. Conclusions ...................................................................................................................................................................... 17
Appendix A: Terms Used .................................................................................................................................................. 18
Appendix B: FAQs ............................................................................................................................................................... 19
Appendix C: Product versions ......................................................................................................................................... 20
Document version 1. 0. Written 17th Apr 2015. 1.1 Edited 21st April 2015: Removed one product.
Home Anti-Virus Protection, Jan - Mar 2015 Page 4 of 20
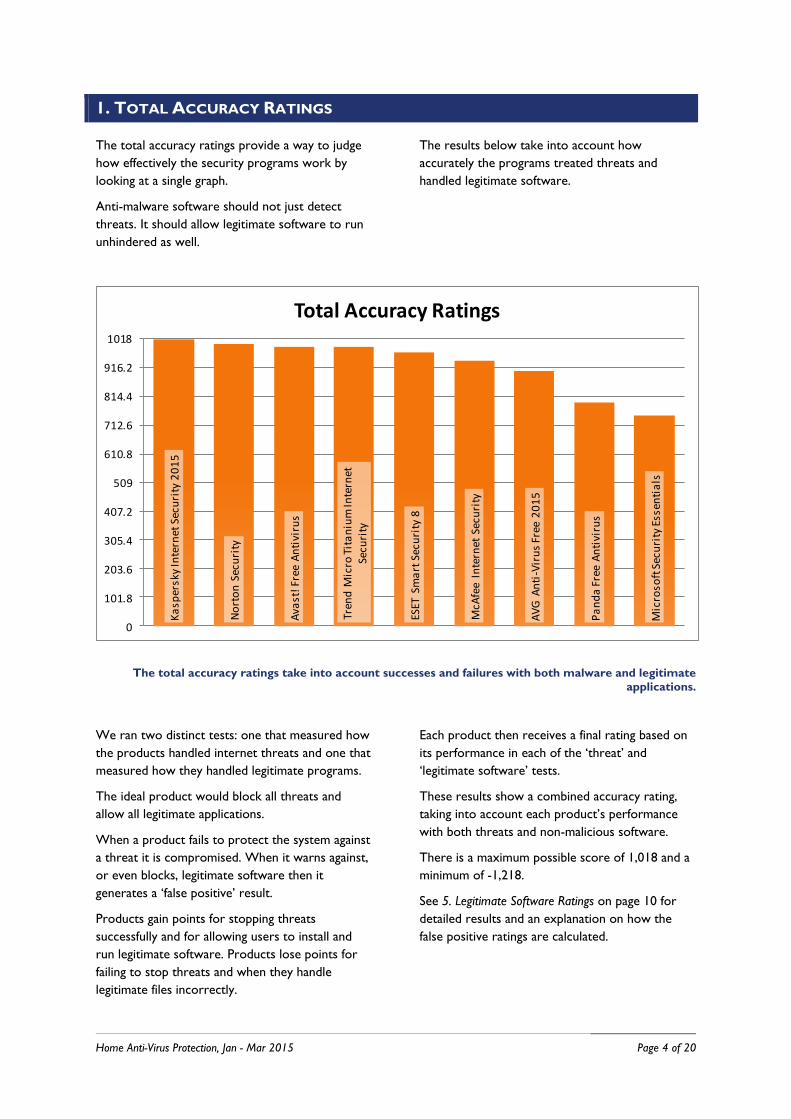
1. TOTAL ACCURACY RATINGS
The total accuracy ratings provide a way to judge
how effectively the security programs work by
looking at a single graph.
Anti-malware software should not just detect
threats. It should allow legitimate software to run
unhindered as well.
The results below take into account how
accurately the programs treated threats and
handled legitimate software.
Ka
sper
sky
Inte
rnet
Sec
uri
ty 2
01
5
No
rto
n S
ecu
rity
Ava
st!
Free
An
tivi
rus
Tren
d M
icro
Tit
an
ium
Inte
rnet
Se
curi
ty
ESET
Sm
art
Sec
uri
ty 8
McA
fee
Inte
rnet
Sec
uri
ty
AV
G A
nti
-Vir
us
Free
20
15
Pa
nd
a F
ree
An
tivi
rus
Mic
roso
ft S
ecu
rity
Ess
enti
als
0
101.8
203.6
305.4
407.2
509
610.8
712.6
814.4
916.2
1018
Total Accuracy Ratings
The total accuracy ratings take into account successes and failures with both malware and legitimate
applications.
We ran two distinct tests: one that measured how
the products handled internet threats and one that
measured how they handled legitimate programs.
The ideal product would block all threats and
allow all legitimate applications.
When a product fails to protect the system against
a threat it is compromised. When it warns against,
or even blocks, legitimate software then it
generates a ‘false positive’ result.
Products gain points for stopping threats
successfully and for allowing users to install and
run legitimate software. Products lose points for
failing to stop threats and when they handle
legitimate files incorrectly.
Each product then receives a final rating based on
its performance in each of the ‘threat’ and
‘legitimate software’ tests.
These results show a combined accuracy rating,
taking into account each product’s performance
with both threats and non-malicious software.
There is a maximum possible score of 1,018 and a
minimum of -1,218.
See 5. Legitimate Software Ratings on page 10 for
detailed results and an explanation on how the
false positive ratings are calculated.
Home Anti-Virus Protection, Jan - Mar 2015 Page 5 of 20
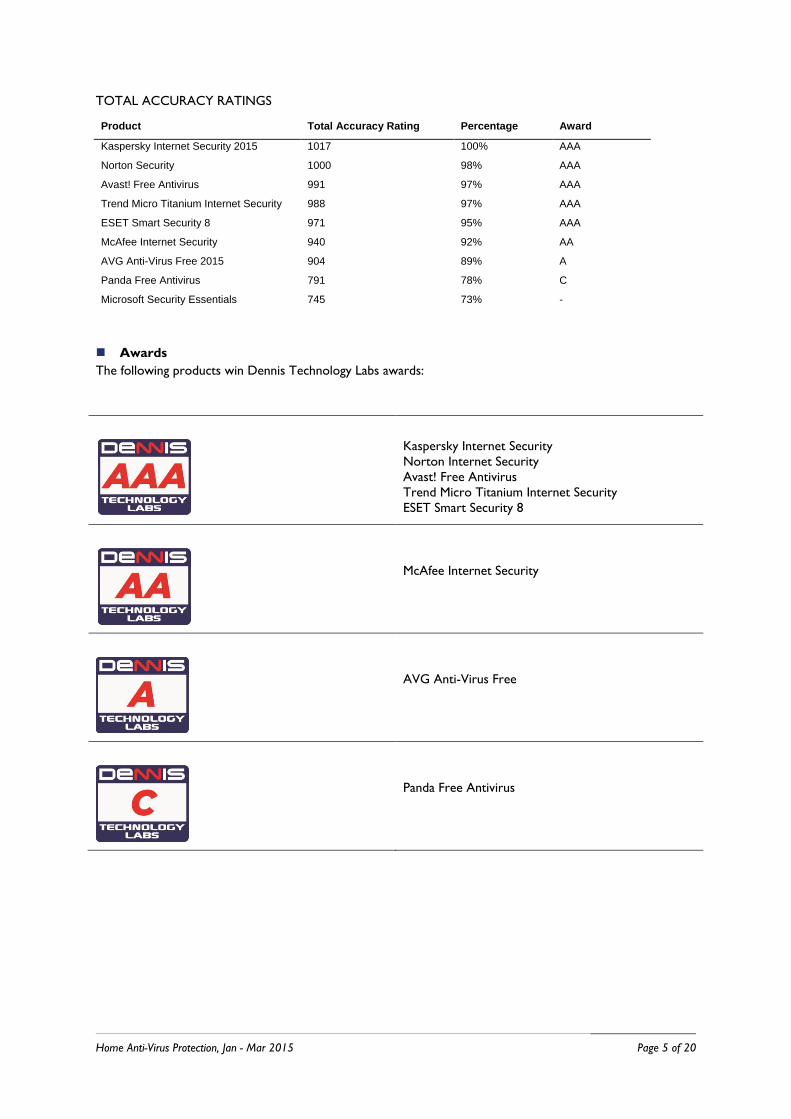
TOTAL ACCURACY RATINGS
Product Total Accuracy Rating Percentage Award
Kaspersky Internet Security 2015 1017 100% AAA
Norton Security 1000 98% AAA
Avast! Free Antivirus 991 97% AAA
Trend Micro Titanium Internet Security 988 97% AAA
ESET Smart Security 8 971 95% AAA
McAfee Internet Security 940 92% AA
AVG Anti-Virus Free 2015 904 89% A
Panda Free Antivirus 791 78% C
Microsoft Security Essentials 745 73% -
Awards
The following products win Dennis Technology Labs awards:
Kaspersky Internet Security
Norton Internet Security
Avast! Free Antivirus
Trend Micro Titanium Internet Security
ESET Smart Security 8
McAfee Internet Security
AVG Anti-Virus Free
Panda Free Antivirus
Home Anti-Virus Protection, Jan - Mar 2015 Page 6 of 20
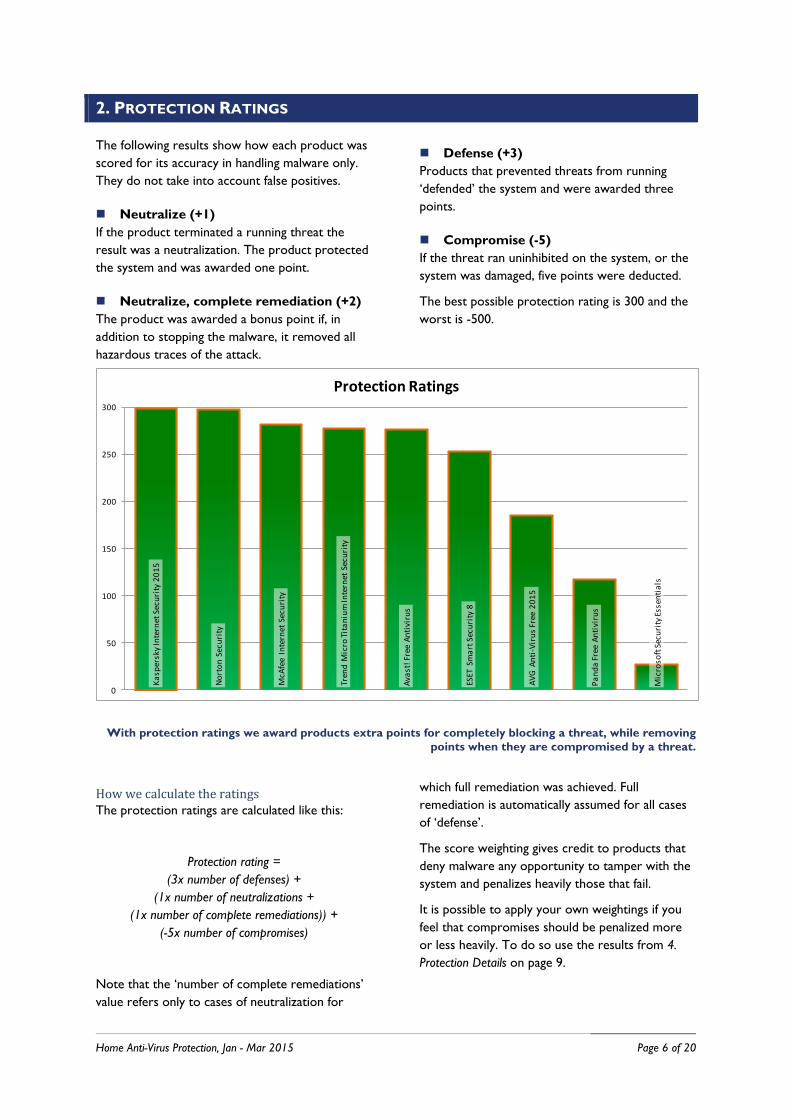
2. PROTECTION RATINGS
The following results show how each product was
scored for its accuracy in handling malware only.
They do not take into account false positives.
Neutralize (+1)
If the product terminated a running threat the
result was a neutralization. The product protected
the system and was awarded one point.
Neutralize, complete remediation (+2)
The product was awarded a bonus point if, in
addition to stopping the malware, it removed all
hazardous traces of the attack.
Defense (+3)
Products that prevented threats from running
‘defended’ the system and were awarded three
points.
Compromise (-5)
If the threat ran uninhibited on the system, or the
system was damaged, five points were deducted.
The best possible protection rating is 300 and the
worst is -500.
Ka
sper
sky
Inte
rnet
Sec
uri
ty 2
01
5
No
rto
n S
ecu
rity
McA
fee
Inte
rnet
Sec
uri
ty
Tren
d M
icro
Tit
an
ium
Inte
rnet
Sec
uri
ty
Ava
st!
Free
An
tivi
rus
ESET
Sm
art
Sec
uri
ty 8
AV
G A
nti
-Vir
us
Free
20
15
Pa
nd
a F
ree
An
tivi
rus
Mic
roso
ft S
ecu
rity
Ess
enti
als
0
50
100
150
200
250
300
Protection Ratings
With protection ratings we award products extra points for completely blocking a threat, while removing
points when they are compromised by a threat.
How we calculate the ratings The protection ratings are calculated like this:
Protection rating =
(3x number of defenses) +
(1x number of neutralizations +
(1x number of complete remediations)) +
(-5x number of compromises)
Note that the ‘number of complete remediations’
value refers only to cases of neutralization for
which full remediation was achieved. Full
remediation is automatically assumed for all cases
of ‘defense’.
The score weighting gives credit to products that
deny malware any opportunity to tamper with the
system and penalizes heavily those that fail.
It is possible to apply your own weightings if you
feel that compromises should be penalized more
or less heavily. To do so use the results from 4.
Protection Details on page 9.
Home Anti-Virus Protection, Jan - Mar 2015 Page 7 of 20
PROTECTION RATINGS
Product Protection Rating
Kaspersky Internet Security 2015 299
Norton Security 298
McAfee Internet Security 282
Trend Micro Titanium Internet Security 278
Avast! Free Antivirus 277
ESET Smart Security 8 253
AVG Anti-Virus Free 2015 186
Panda Free Antivirus 117
Microsoft Security Essentials 27
Home Anti-Virus Protection, Jan - Mar 2015 Page 8 of 20
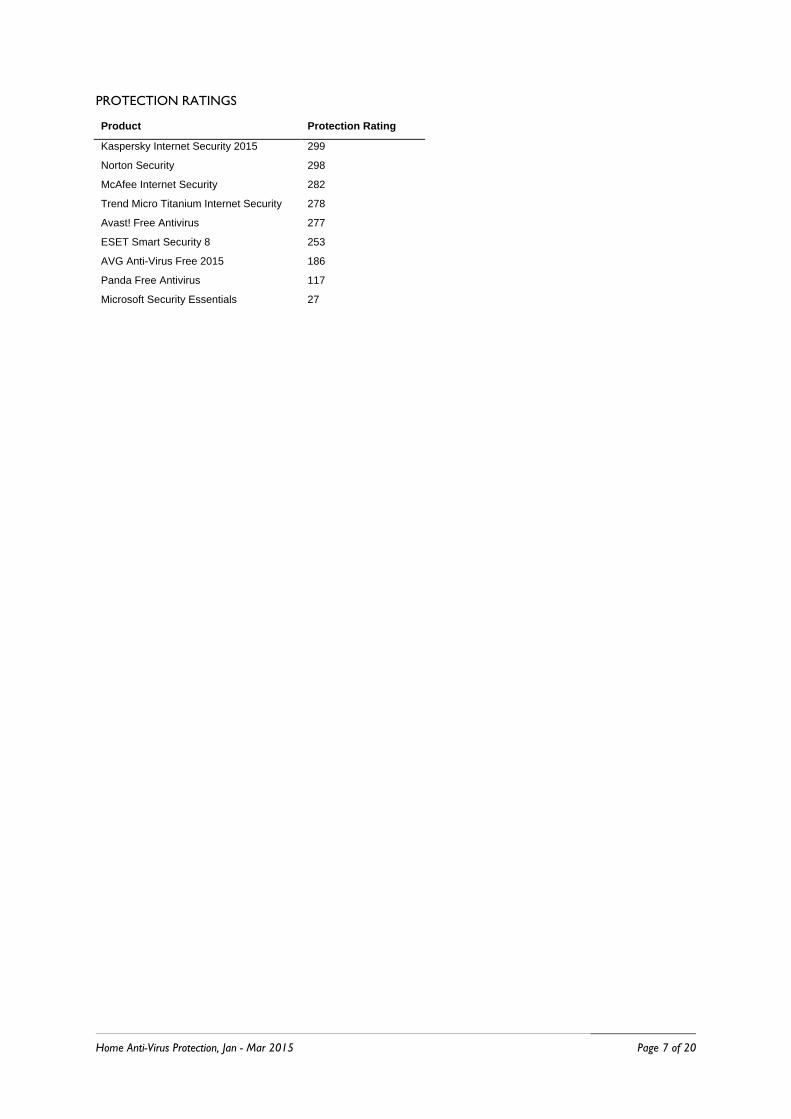
3. PROTECTION SCORES
The following illustrates the general level of
protection, combining defended and neutralized
results. There is no distinction made between
these different levels of protection. Either a system
is protected or it is not.K
asp
ersk
y In
tern
et S
ecu
rity
2
01
5
No
rto
n S
ecu
rity
ESET
Sm
art
Sec
uri
ty 8
Tren
d M
icro
Tit
an
ium
In
tern
et S
ecu
rity
McA
fee
Inte
rnet
Sec
uri
ty
Ava
st!
Free
An
tivi
rus
AV
G A
nti
-Vir
us
Free
20
15
Pa
nd
a F
ree
An
tivi
rus
Mic
roso
ft S
ecu
rity
Ess
enti
als
0
10
20
30
40
50
60
70
80
90
100
Protection Scores
The protection scores simply indicate how many time each product prevented a threat from
compromising the system.
PROTECTION SCORES
Product Protected Scores
Kaspersky Internet Security 2015 100
Norton Security 100
ESET Smart Security 8 99
Trend Micro Titanium Internet Security 98
McAfee Internet Security 98
Avast! Free Antivirus 98
AVG Anti-Virus Free 2015 93
Panda Free Antivirus 90
Microsoft Security Essentials 68
(Average: 94 per cent)
Home Anti-Virus Protection, Jan - Mar 2015 Page 9 of 20
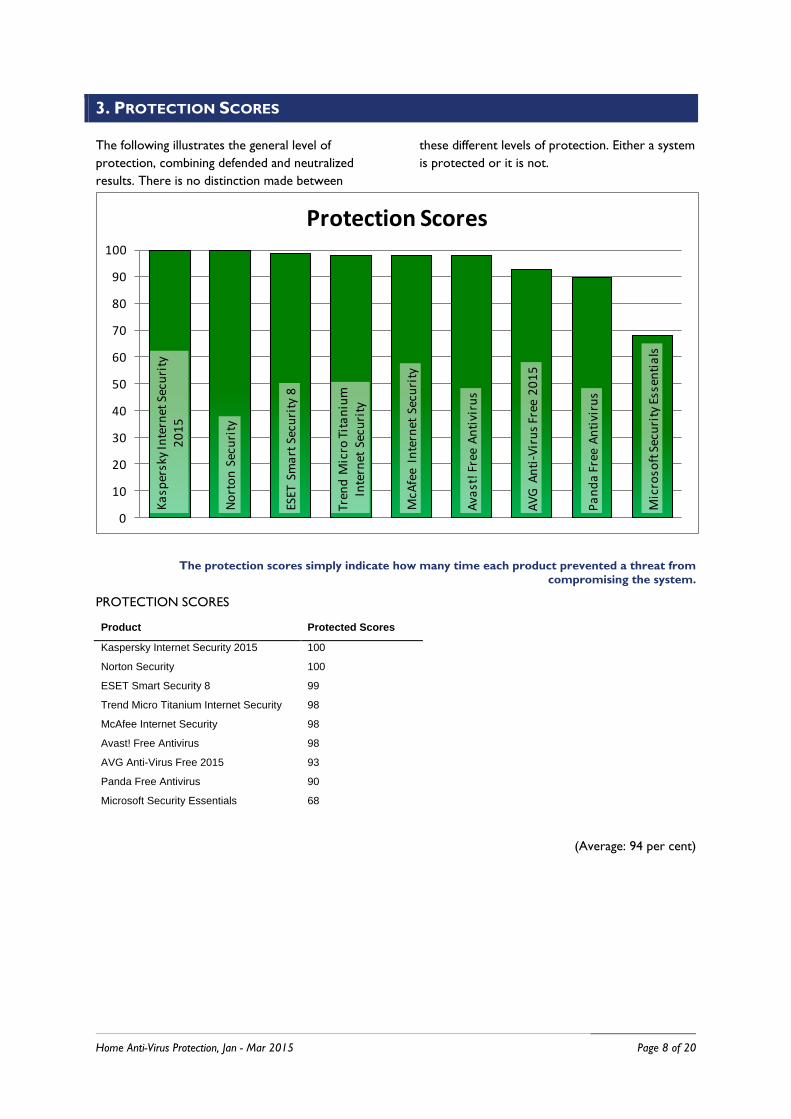
4. PROTECTION DETAILS
The security products provided different levels of
protection. When a product defended against a
threat, it prevented the malware from gaining a
foothold on the target system. A threat might have
been able to exploit or infect the system and, in
some cases, the product neutralized it either after
the exploit ran or later. When it couldn’t the
system was compromised.
Ka
sper
sky
Inte
rnet
Sec
uri
ty 2
01
5
No
rto
n S
ecu
rity
McA
fee
Inte
rnet
Sec
uri
ty
Tren
d M
icro
Tit
an
ium
Inte
rnet
Se
curi
ty
Ava
st!
Free
An
tivi
rus
ESET
Sm
art
Sec
uri
ty 8
AV
G A
nti
-Vir
us
Free
20
15
Pa
nd
a F
ree
An
tivi
rus
Mic
roso
ft S
ecu
rity
Ess
enti
als
0
10
20
30
40
50
60
70
80
90
100
Protection Details
Sum of Protection accuracy Compromised Neutralized Defended
The graph shows details on how the products handled the attacks. They are ordered according to their
protection scores. For overall protection scores see 3. Protection Scores on page 8.
PROTECTION DETAILS
Product Defended Neutralized Compromised
Kaspersky Internet Security 2015 99 1 0
Norton Security 99 1 0
McAfee Internet Security 97 1 2
Trend Micro Titanium Internet Security 95 3 2
Avast! Free Antivirus 93 5 2
ESET Smart Security 8 78 21 1
AVG Anti-Virus Free 2015 57 36 7
Panda Free Antivirus 34 56 10
Microsoft Security Essentials 56 12 32
Home Anti-Virus Protection, Jan - Mar 2015 Page 10 of 20
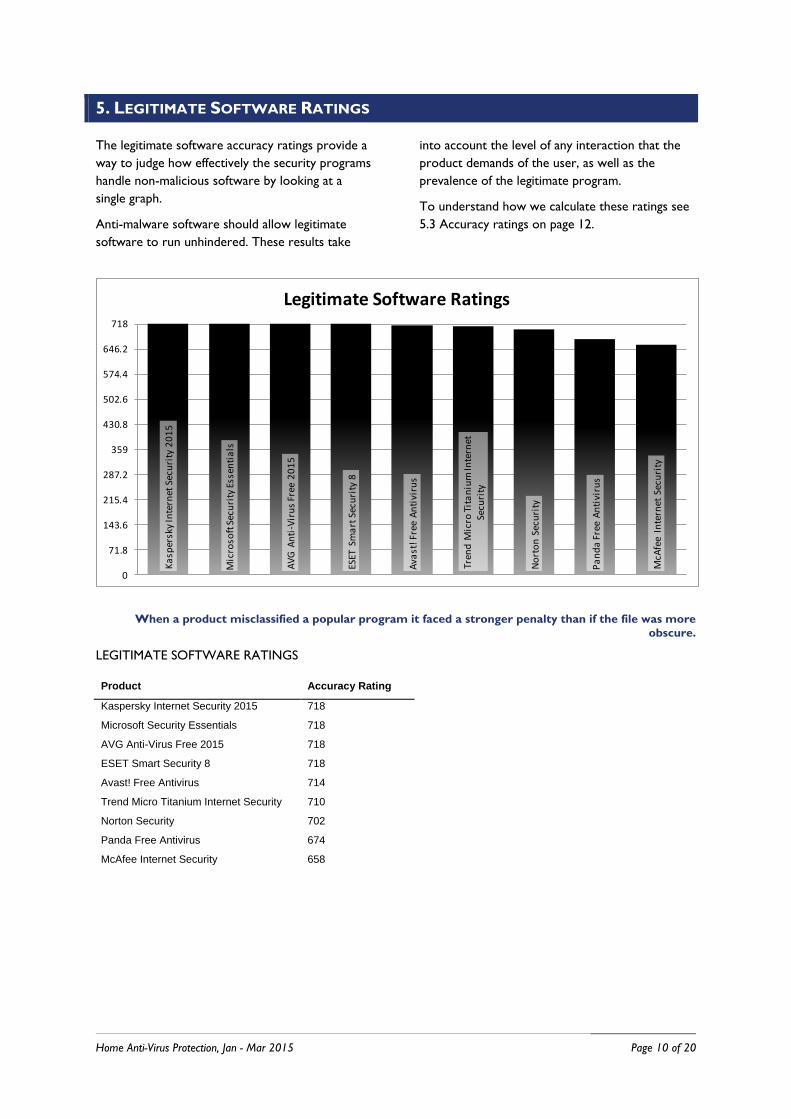
5. LEGITIMATE SOFTWARE RATINGS
The legitimate software accuracy ratings provide a
way to judge how effectively the security programs
handle non-malicious software by looking at a
single graph.
Anti-malware software should allow legitimate
software to run unhindered. These results take
into account the level of any interaction that the
product demands of the user, as well as the
prevalence of the legitimate program.
To understand how we calculate these ratings see
5.3 Accuracy ratings on page 12.
Ka
sper
sky
Inte
rnet
Sec
uri
ty 2
01
5
Mic
roso
ft S
ecu
rity
Ess
enti
als
AV
G A
nti
-Vir
us
Free
20
15
ESET
Sm
art
Sec
uri
ty 8
Ava
st!
Free
An
tivi
rus
Tren
d M
icro
Tit
an
ium
Inte
rnet
Se
curi
ty
No
rto
n S
ecu
rity
Pa
nd
a F
ree
An
tivi
rus
McA
fee
Inte
rnet
Sec
uri
ty
0
71.8
143.6
215.4
287.2
359
430.8
502.6
574.4
646.2
718
Legitimate Software Ratings
When a product misclassified a popular program it faced a stronger penalty than if the file was more
obscure.
LEGITIMATE SOFTWARE RATINGS
Product Accuracy Rating
Kaspersky Internet Security 2015 718
Microsoft Security Essentials 718
AVG Anti-Virus Free 2015 718
ESET Smart Security 8 718
Avast! Free Antivirus 714
Trend Micro Titanium Internet Security 710
Norton Security 702
Panda Free Antivirus 674
McAfee Internet Security 658
Home Anti-Virus Protection, Jan - Mar 2015 Page 11 of 20
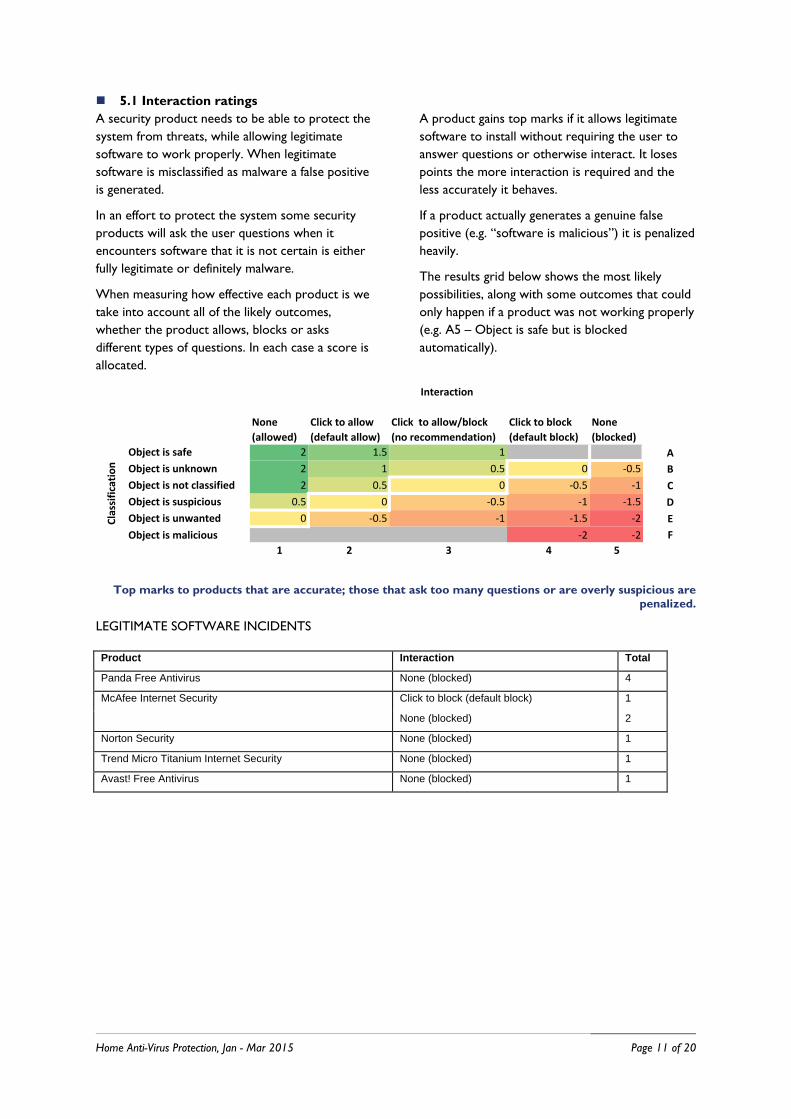
5.1 Interaction ratings
A security product needs to be able to protect the
system from threats, while allowing legitimate
software to work properly. When legitimate
software is misclassified as malware a false positive
is generated.
In an effort to protect the system some security
products will ask the user questions when it
encounters software that it is not certain is either
fully legitimate or definitely malware.
When measuring how effective each product is we
take into account all of the likely outcomes,
whether the product allows, blocks or asks
different types of questions. In each case a score is
allocated.
A product gains top marks if it allows legitimate
software to install without requiring the user to
answer questions or otherwise interact. It loses
points the more interaction is required and the
less accurately it behaves.
If a product actually generates a genuine false
positive (e.g. “software is malicious”) it is penalized
heavily.
The results grid below shows the most likely
possibilities, along with some outcomes that could
only happen if a product was not working properly
(e.g. A5 – Object is safe but is blocked
automatically).
None
(allowed)
Click to allow
(default allow)
Click to allow/block
(no recommendation)
Click to block
(default block)
None
(blocked)
Object is safe 2 1.5 1 X X A
Object is unknown 2 1 0.5 0 -0.5 B
Object is not classified 2 0.5 0 -0.5 -1 C
Object is suspicious 0.5 0 -0.5 -1 -1.5 D
Object is unwanted 0 -0.5 -1 -1.5 -2 E
Object is malicious X X X -2 -2 F
1 2 3 4 5
Interaction
Cla
ssif
icat
ion
Top marks to products that are accurate; those that ask too many questions or are overly suspicious are
penalized.
LEGITIMATE SOFTWARE INCIDENTS
Product Interaction Total
Panda Free Antivirus None (blocked) 4
McAfee Internet Security Click to block (default block) 1
None (blocked) 2
Norton Security None (blocked) 1
Trend Micro Titanium Internet Security None (blocked) 1
Avast! Free Antivirus None (blocked) 1
Home Anti-Virus Protection, Jan - Mar 2015 Page 12 of 20
5.2 Prevalence ratings
The prevalence of each piece of software is
significant. If a security product interferes with
common applications then the situation is more
serious than if it does so with rare ones. That said,
it is usually expected that anti-malware programs
should not interfere with any legitimate software.
The programs selected for the legitimate software
testing were organized into five groups:
Very High Impact; High Impact; Medium Impact;
Low Impact; and Very Low Impact.
The table below shows the relative importance of
each group expressed as a numerical value. A Very
High Impact application is ranked as being five
times more significant than a Very Low Impact
program.
LEGITIMATE SOFTWARE
PREVALENCE RATING MODIFIERS
Impact category Rating modifier
Very High Impact 5
High Impact 4
Medium Impact 3
Low Impact 2
Very Low Impact 1
These categories were attributed to software
programs based on their individual weekly
download numbers as reported by third-party
download sites including Download.com at the
time of testing.
Files were downloaded from their original sources,
excluding third-party download sites, such as
Download.com, wherever possible. This was to
reduce the chances that the software had been
altered in any way, perhaps having potentially
unwanted add-ons included with the installer.
The presence of potentially unwanted add-ons
transforms the legitimate software into a product
that could be blocked or altered justifiably by anti-
malware software. As such they are not suitable
for this legitimate software test.
The ranges for these categories, in terms of
weekly downloads, are recorded in the table
Legitimate Software Prevalence Categories.
LEGITIMATE SOFTWARE
PREVALENCE CATEGORIES
Impact category Prevalence
Very High Impact >20,000
High Impact 1,000 – 20,000
Medium Impact 100 – 999
Low Impact 25 – 99
Very Low Impact < 25
5.3 Accuracy ratings
The legitimate software accuracy ratings are
calculated by multiplying together the interaction
and prevalence ratings.
accuracy rating = number of programs x
(interaction rating x prevalence rating)
For example, if a product allows 10 legitimate,
Medium Impact programs to install without any
interference then its rating would be calculated
like this:
accuracy rating = 10 x (2 x 3)
= 60
This formula creates the impact-weighted accuracy
ratings used in the graph 5. Legitimate Software
Ratings on page 10.
5.4 Distribution of impact categories
Products that scored highest were the most
accurate when handling the legitimate applications
used in the test.
The best theoretical score possible is 1,000, while
the worst would be -1,000 (assuming that all
applications were classified as Very High Impact).
In fact the distribution of applications in the impact
categories was not restricted only to Very High
Impact. The table below shows the true
distribution:
LEGITIMATE SOFTWARE
CATEGORY FREQUENCY
Prevalence Rating Frequency
Very High Impact 26
High Impact 38
Medium Impact 16
Low Impact 9
Very Low Impact 11
Home Anti-Virus Protection, Jan - Mar 2015 Page 13 of 20
6. THE TESTS
6.1 The threats
Providing a realistic user experience was important
in order to illustrate what really happens when a
user encounters a threat on the internet.
For example, in these tests web-based malware
was accessed by visiting an original, infected
website using a web browser, and not downloaded
from a CD or internal test website.
All target systems were fully exposed to the
threats. This means that any exploit code was
allowed to run, as were other malicious files, They
were run and permitted to perform exactly as they
were designed to, subject to checks made by the
installed security software.
A minimum time period of five minutes was
provided to allow the malware an opportunity to
act.
6.2 Test rounds
Tests were conducted in rounds. Each round
recorded the exposure of every product to a
specific threat. For example, in ‘round one’ each of
the products was exposed to the same malicious
website.
At the end of each round the test systems were
completely reset to remove any possible trace of
malware before the next test began.
6.3 Monitoring
Close logging of the target systems was necessary
to gauge the relative successes of the malware and
the anti-malware software. This included recording
activity such as network traffic, the creation of files
and processes and changes made to important
files.
6.4 Levels of protection
The products displayed different levels of
protection. Sometimes a product would prevent a
threat from executing, or at least making any
significant changes to the target system.
In other cases a threat might be able to perform
some tasks on the target (such as exploiting a
security vulnerability or executing a malicious
program), after which the security product would
intervene and remove some or all of the malware.
Finally, a threat may be able to bypass the security
product and carry out its malicious tasks
unhindered. It may even be able to disable the
security software.
Occasionally Windows' own protection system
might handle a threat while the anti-virus program
ignored it. Another outcome is that the malware
may crash for various reasons.
The different levels of protection provided by each
product were recorded following analysis of the
log files.
If malware failed to perform properly in a given
incident, perhaps because of the very presence of
the security product, rather than any specific
defending action that the product took, the
product was given the benefit of the doubt and a
Defended result was recorded.
If the test system was damaged, becoming hard to
use following an attempted attack, this was
counted as a compromise even if the active parts
of the malware had eventually been removed by
the product.
6.5 Types of protection
All of the products tested provided two main
types of protection: real-time and on-demand.
Real-time protection monitors the system
constantly in an attempt to prevent a threat from
gaining access.
On-demand protection is essentially a ‘virus scan’
that is run by the user at an arbitrary time.
The test results note each product’s behavior
when a threat is introduced and afterwards. The
real-time protection mechanism was monitored
throughout the test, while an on-demand scan was
run towards the end of each test to measure how
safe the product determined the system to be.
Manual scans were run only when a tester
determined that malware had made an interaction
with the target system. In other words, if the
security product claimed to block the attack at the
initial stage, and the monitoring logs supported this
claim, the case was considered closed and a
Defended result was recorded.
Home Anti-Virus Protection, Jan - Mar 2015 Page 14 of 20
7. TEST DETAILS
7.1 The targets
To create a fair testing environment, each product
was installed on a clean Windows 7 Home
Premium 64-bit target system. The operating
system was updated with Service Pack 1 (SP1),
although no later patches or updates were applied.
We test with Windows 7 SP1 due to the high
prevalence of internet threats that work with this
operating system. The prevalence of these threats
suggests that there are many systems with this
level of patching currently connected to the
internet.
At the time of testing Windows 7 was being used
heavily by consumers and businesses.
According to Net Applications, which monitors
the popularity of operating systems and web
browsers, Windows 7 accounted for 48 per cent
of the desktop operating system market at the
time of testing. It was the market leader, with
Windows XP coming second (29 per cent).
Windows 8 and Windows Vista came a distant
third and fifth (11 per cent and three per cent)
respectively1. Mac OS X came fourth.
Our aim is to test the security product and not the
protection provided by keeping systems
completely up to date with patches and other
mechanisms.
Patching will inevitably improve the security of the
system and readers are advised to keep all
software updated.
A selection of legitimate but vulnerable software
was pre-installed on the target systems. These
posed security risks, as they contained known
security issues. They included versions of Adobe
Flash Player, Adobe Reader and Java.
A different security product was then installed on
each system. Each product’s update mechanism
was used to download the latest version with the
most recent definitions and other elements.
Due to the dynamic nature of the tests, which
were carried out in real-time with live malicious
1Net Market Share (Net Applications),
http://www.netmarketshare.com/
websites, the products' update systems were
allowed to run automatically and were also run
manually before each test round was carried out.
The products were also allowed to 'call home'
should they be programmed to query databases in
real-time. Some products might automatically
upgrade themselves during the test. At any given
time of testing, the very latest version of each
program was used.
Each target systems was a physical PC, not a
virtual machine, and was connected to the internet
via its own virtual network (VLAN) to avoid cross-
infection of malware.
7.2 Threat selection
The malicious web links (URLs) used in the tests
were not provided by any anti-malware vendor.
They were picked from lists generated by Dennis
Technology Labs’ own malicious site detection
system, which uses popular search engine
keywords submitted to Google. It analyses sites
that are returned in the search results from a
number of search engines and adds them to a
database of malicious websites.
In all cases, a control system (Verification Target
System - VTS) was used to confirm that the URLs
linked to actively malicious sites.
Malicious URLs and files are not shared with any
vendors during the testing process.
7.3 Test stages
There were three main stages in each individual
test:
1. Introduction
2. Observation
3. Remediation
During the Introduction stage, the target system
was exposed to a threat. Before the threat was
introduced, a snapshot was taken of the system.
This created a list of Registry entries and files on
the hard disk. The threat was then introduced.
Immediately after the system’s exposure to the
threat, the Observation stage is reached. During this
time, which typically lasted at least 10 minutes, the
tester monitored the system both visually and
using a range of third-party tools.
Home Anti-Virus Protection, Jan - Mar 2015 Page 15 of 20
The tester reacted to pop-ups and other prompts
according to the directives described below (see
7.5 Observation and intervention below.
In the event that hostile activity to other internet
users was observed, such as when spam was being
sent by the target, this stage was cut short.
The Observation stage concluded with another
system snapshot. This ‘exposed’ snapshot was
compared to the original ‘clean’ snapshot and a
report generated. The system was then rebooted.
The Remediation stage is designed to test the
products’ ability to clean an infected system. If it
defended against the threat in the Observation stage
then we skipped it. An on-demand scan was run
on the target, after which a ‘scanned’ snapshot was
taken. This was compared to the original ‘clean’
snapshot and a report was generated.
All log files, including the snapshot reports and the
product’s own log files, were recovered from the
target.
In some cases the target may become so damaged
that log recovery is considered impractical. The
target was then reset to a clean state, ready for
the next test.
7.4 Threat introduction
Malicious websites were visited in real-time using
the web browser. This risky behavior was
conducted using live internet connections. URLs
were typed manually into the browser.
Web-hosted malware often changes over time.
Visiting the same site over a short period of time
can expose systems to what appear to be a range
of threats (although it may be the same threat,
slightly altered to avoid detection).
Also, many infected sites will only attack a
particular IP address once, which makes it hard to
test more than one product against the same
threat.
In order to improve the chances that each target
system received the same experience from a
malicious web server, we used a web replay
system.
When the verification target systems visited a
malicious site, the page’s content, including
malicious code, was downloaded, stored and
loaded into the replay system. When each target
system subsequently visited the site, it received
exactly the same content.
The network configurations were set to allow all
products unfettered access to the internet
throughout the test, regardless of the web replay
systems.
7.5 Observation and intervention
Throughout each test, the target system was
observed both manually and in real-time. This
enabled the tester to take comprehensive notes
about the system’s perceived behavior, as well as
to compare visual alerts with the products’ log
entries.
At certain stages the tester was required to act as
a regular user. To achieve consistency, the tester
followed a policy for handling certain situations,
including dealing with pop-ups displayed by
products or the operating system, system crashes,
invitations by malware to perform tasks and so on.
This user behavior policy included the following
directives:
1. Act naively. Allow the threat a good
chance to introduce itself to the target by
clicking OK to malicious prompts, for
example.
2. Don’t be too stubborn in retrying blocked
downloads. If a product warns against
visiting a site, don’t take further measures
to visit that site.
3. Where malware is downloaded as a Zip
file, or similar, extract it to the Desktop
then attempt to run it. If the archive is
protected by a password, and that
password is known to you (e.g. it was
included in the body of the original
malicious email), use it.
4. Always click the default option. This
applies to security product pop-ups,
operating system prompts (including
Windows firewall) and malware
invitations to act.
5. If there is no default option, wait. Give
the prompt 20 seconds to choose a
course of action automatically.
6. If no action is taken automatically, choose
the first option. Where options are listed
vertically, choose the top one. Where
options are listed horizontally, choose the
left-hand one.
Home Anti-Virus Protection, Jan - Mar 2015 Page 16 of 20
7.6 Remediation
When a target is exposed to malware, the threat
may have a number of opportunities to infect the
system. The security product also has a number of
chances to protect the target. The snapshots
explained in 7.3 Test stages on page 14 provided
information that was used to analyze a system’s
final state at the end of a test.
Before, during and after each test, a ‘snapshot’ of
the target system was taken to provide
information about what had changed during the
exposure to malware. For example, comparing a
snapshot taken before a malicious website was
visited to one taken after might highlight new
entries in the Registry and new files on the hard
disk.
Snapshots were also used to determine how
effective a product was at removing a threat that
had managed to establish itself on the target
system. This analysis gives an indication as to the
levels of protection that a product has provided.
These levels of protection have been recorded
using three main terms: defended, neutralized, and
compromised. A threat that was unable to gain a
foothold on the target was defended against; one
that was prevented from continuing its activities
was neutralized; while a successful threat was
considered to have compromised the target.
A defended incident occurs where no malicious
activity is observed with the naked eye or third-
party monitoring tools following the initial threat
introduction. The snapshot report files are used to
verify this happy state.
If a threat is observed to run actively on the
system, but not beyond the point where an on-
demand scan is run, it is considered to have been
neutralized.
Comparing the snapshot reports should show that
malicious files were created and Registry entries
were made after the introduction. However, as
long as the ‘scanned’ snapshot report shows that
either the files have been removed or the Registry
entries have been deleted, the threat has been
neutralized.
The target is compromised if malware is observed
to run after the on-demand scan. In some cases a
product might request a further scan to complete
the removal. We considered secondary scans to
be acceptable, but continual scan requests may be
ignored after no progress is determined.
An edited ‘hosts’ file or altered system file also
counted as a compromise.
7.7 Automatic monitoring
Logs were generated using third-party applications,
as well as by the security products themselves.
Manual observation of the target system
throughout its exposure to malware (and
legitimate applications) provided more information
about the security products’ behavior.
Monitoring was performed directly on the target
system and on the network.
Client-side logging A combination of Process Explorer, Process
Monitor, TcpView and Wireshark were used to
monitor the target systems. Regshot was used
between each testing stage to record a system
snapshot.
A number of Dennis Technology Labs-created
scripts were also used to provide additional
system information. Each product was able to
generate some level of logging itself.
Process Explorer and TcpView were run
throughout the tests, providing a visual cue to the
tester about possible malicious activity on the
system. In addition, Wireshark’s real-time output,
and the display from the web proxy (see Network
logging, below), indicated specific network activity
such as secondary downloads.
Process Monitor also provided valuable
information to help reconstruct malicious
incidents.
Network logging All target systems were connected to a live
internet connection, which incorporated a
transparent web proxy and a network monitoring
system. All traffic to and from the internet had to
pass through this system.
An HTTP replay system ensured that all target
systems received the same malware as each other.
It was configured to allow access to the internet
so that products could download updates and
communicate with any available ‘in the cloud’
servers.
Home Anti-Virus Protection, Jan - Mar 2015 Page 17 of 20
8. CONCLUSIONS
Where are the threats?
The threats used in this test were genuine, real-life
threats that were infecting victims globally at the
time that we tested the products.
The types of infected or malicious sites were
varied, which demonstrates that effective anti-virus
software is essential for those who want to use
the web using a Windows PC.
Most threats installed automatically when a user
visited the infected webpage. This infection was
often invisible to a casual observer.
Where does protection start?
There were a few compromises in this test, as well
as a relatively large number of neutralizations.
The strongest products blocked the site before it
was even able to deliver its payload. The weakest
tended to handle the threat after it had started to
interact with the target system.
Sorting the wheat from the chaff
Kaspersky Internet Security 2015 and Norton
Security scored highest in terms of malware
protection. They were as effective as each other.
McAfee Internet Security came third, while ratings
for products from Trend Micro and Avast! were
only slightly lower.
The Kaspersky and Symantec products gained the
highest protection ratings because they prevented
all of the threats from infecting the target.
McAfee’s product came third in the protection
ratings because it was compromised once and
neutralized one other threat.
ESET protected the target in 99 per cent of cases
but scored lower than the leaders because it
neutralized, rather than defended against, the
threats.
Most products were compromised twice or less.
Of these, only Avast! was free.
The products compromised most often were
Panda Free Antivirus and Microsoft Security
Essentials.
The top two products, in terms of overall
accuracy, were all paid-for products. Avast! Free
Antivirus, which is free, came third. The other free
products were much less accurate.
False positives?
Anti-malware products need to be able to
distinguish between malicious and non-malicious
programs. This is where some products failed to
excel and those from McAfee and Panda were the
most distracting and inaccurate.
Panda’s was arguably the worst, blocking four
legitimate applications automatically. McAfee’s
product scored lower because it blocked
applications with a higher prevalence.
In contrast, products from AVG, ESET, Kaspersky
Lab and Microsoft were 100 per cent accurate
when handling legitimate software.
Overall, considering each product’s ability to
handle both malware and legitimate applications,
the winners were Kaspersky Internet Security
2015, Norton Security, Avast! Free Antivirus,
Trend Micro Titanium Internet Security and ESET
Smart Security 8. They win AAA awards.
Anti-virus is important (but not a
panacea)
This test shows that with even a relatively small
sample set of 100 threats there is a significant
difference in performance between the anti-virus
programs. Most importantly, it illustrates this
difference using real threats that attacked real
computers at the time of testing.
The average protection level of the tested
products is 94 per cent (see 3. Protection Scores on
page 8). This figure is much lower than some
detection results typically quoted in anti-malware
marketing material.
The presence of anti-malware software can be
seen to decrease the chances of a malware
infection even when the only sites being visited are
proven to be actively malicious. That said, only
two products achieved a 100 per cent protection
rate, while most of those tested mishandled
legitimate software.
Home Anti-Virus Protection, Jan - Mar 2015 Page 18 of 20
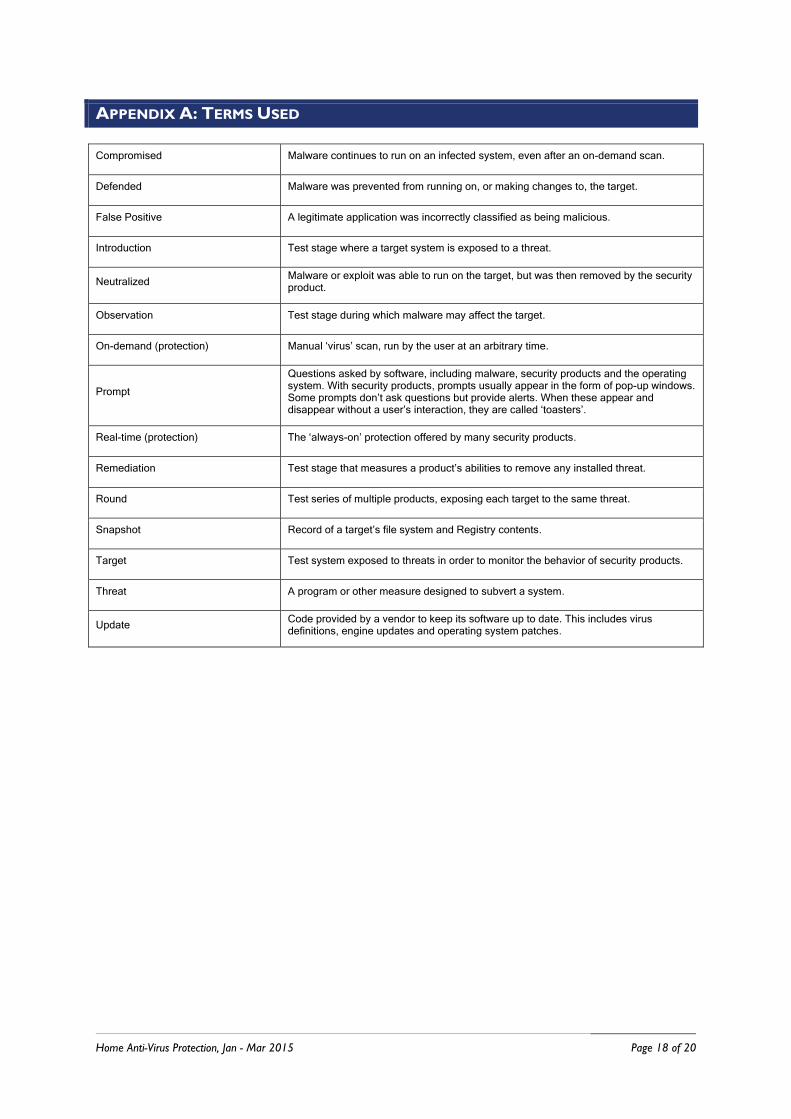
APPENDIX A: TERMS USED
Compromised Malware continues to run on an infected system, even after an on-demand scan.
Defended Malware was prevented from running on, or making changes to, the target.
False Positive A legitimate application was incorrectly classified as being malicious.
Introduction Test stage where a target system is exposed to a threat.
Neutralized Malware or exploit was able to run on the target, but was then removed by the security product.
Observation Test stage during which malware may affect the target.
On-demand (protection) Manual ‘virus’ scan, run by the user at an arbitrary time.
Prompt
Questions asked by software, including malware, security products and the operating system. With security products, prompts usually appear in the form of pop-up windows. Some prompts don’t ask questions but provide alerts. When these appear and disappear without a user’s interaction, they are called ‘toasters’.
Real-time (protection) The ‘always-on’ protection offered by many security products.
Remediation Test stage that measures a product’s abilities to remove any installed threat.
Round Test series of multiple products, exposing each target to the same threat.
Snapshot Record of a target’s file system and Registry contents.
Target Test system exposed to threats in order to monitor the behavior of security products.
Threat A program or other measure designed to subvert a system.
Update Code provided by a vendor to keep its software up to date. This includes virus definitions, engine updates and operating system patches.
Home Anti-Virus Protection, Jan - Mar 2015 Page 19 of 20
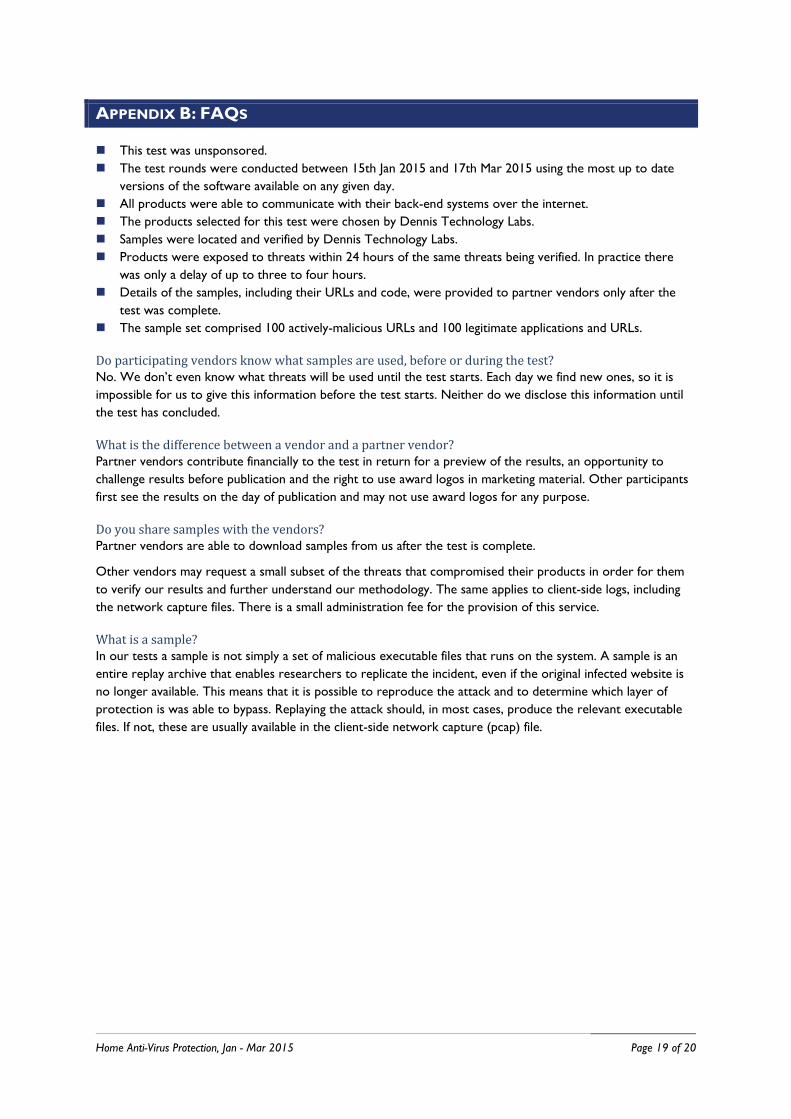
APPENDIX B: FAQS
This test was unsponsored.
The test rounds were conducted between 15th Jan 2015 and 17th Mar 2015 using the most up to date
versions of the software available on any given day.
All products were able to communicate with their back-end systems over the internet.
The products selected for this test were chosen by Dennis Technology Labs.
Samples were located and verified by Dennis Technology Labs.
Products were exposed to threats within 24 hours of the same threats being verified. In practice there
was only a delay of up to three to four hours.
Details of the samples, including their URLs and code, were provided to partner vendors only after the
test was complete.
The sample set comprised 100 actively-malicious URLs and 100 legitimate applications and URLs.
Do participating vendors know what samples are used, before or during the test? No. We don’t even know what threats will be used until the test starts. Each day we find new ones, so it is
impossible for us to give this information before the test starts. Neither do we disclose this information until
the test has concluded.
What is the difference between a vendor and a partner vendor? Partner vendors contribute financially to the test in return for a preview of the results, an opportunity to
challenge results before publication and the right to use award logos in marketing material. Other participants
first see the results on the day of publication and may not use award logos for any purpose.
Do you share samples with the vendors? Partner vendors are able to download samples from us after the test is complete.
Other vendors may request a small subset of the threats that compromised their products in order for them
to verify our results and further understand our methodology. The same applies to client-side logs, including
the network capture files. There is a small administration fee for the provision of this service.
What is a sample? In our tests a sample is not simply a set of malicious executable files that runs on the system. A sample is an
entire replay archive that enables researchers to replicate the incident, even if the original infected website is
no longer available. This means that it is possible to reproduce the attack and to determine which layer of
protection is was able to bypass. Replaying the attack should, in most cases, produce the relevant executable
files. If not, these are usually available in the client-side network capture (pcap) file.
WHILE EVERY EFFORT IS MADE TO ENSURE THE ACCURACY OF THE INFORMATION PUBLISHED IN
THIS DOCUMENT, NO GUARANTEE IS EXPRESSED OR IMPLIED AND DENNIS PUBLISHING LTD DOES
NOT ACCEPT LIABILITY FOR ANY LOSS OR DAMAGE THAT MAY ARISE FROM ANY ERRORS OR
OMISSIONS.
Home Anti-Virus Protection, Jan - Mar 2015 Page 20 of 20
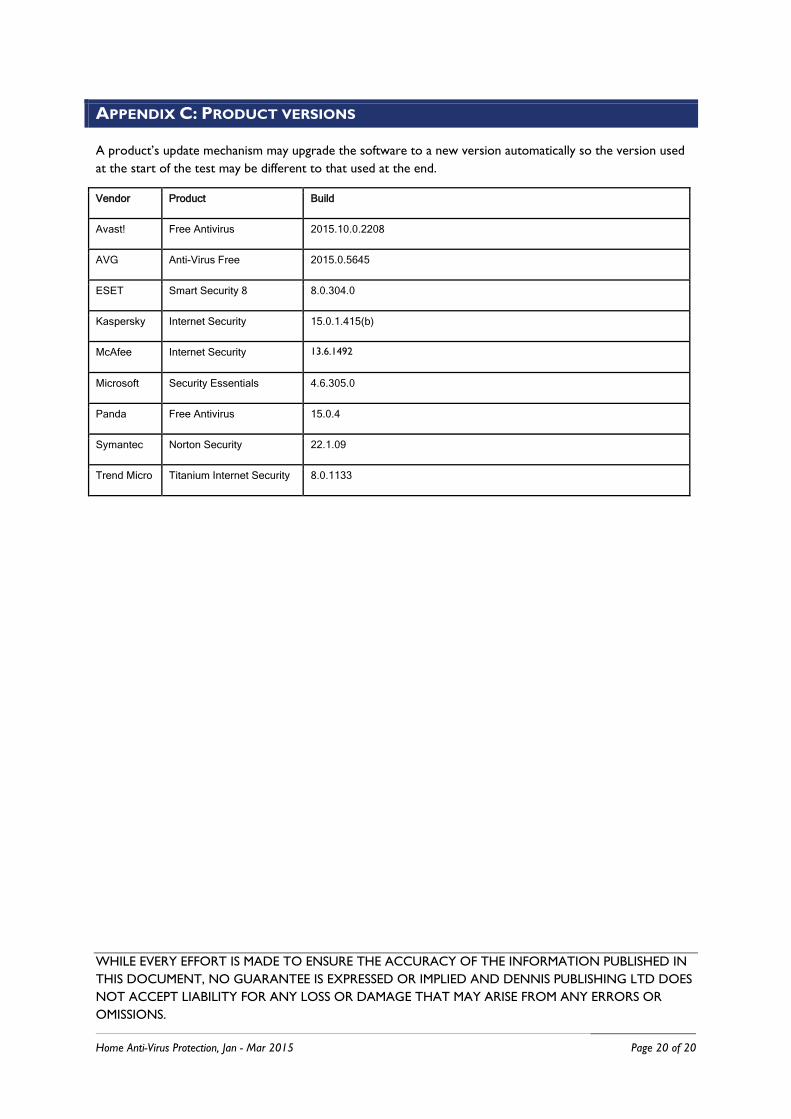
APPENDIX C: PRODUCT VERSIONS
A product’s update mechanism may upgrade the software to a new version automatically so the version used
at the start of the test may be different to that used at the end.
Vendor Product Build
Avast! Free Antivirus 2015.10.0.2208
AVG Anti-Virus Free 2015.0.5645
ESET Smart Security 8 8.0.304.0
Kaspersky Internet Security 15.0.1.415(b)
McAfee Internet Security 13.6.1492
Microsoft Security Essentials 4.6.305.0
Panda Free Antivirus 15.0.4
Symantec Norton Security 22.1.09
Trend Micro Titanium Internet Security 8.0.1133