Embed Size (px)
Citation preview

Cash and the Corporate Life Cycle A Framework for Understanding Cash and Optimal Cash Usage
September 24, 2010 Education and Training
CFROI
Discount Rate (Investor's Required
Rate of Return)
RESTRUCTURESTARTUP
Discount
GROWTH
A
GROWTH FADE
B C
MATURE
Value to Cost RatioHigh Premium Premium to Par Par
D E
CFROI
Discount Rate (Investor's Required
Rate of Return)
RESTRUCTURESTARTUP
Discount
GROWTH
A
GROWTH FADE
B C
MATURE
Value to Cost RatioHigh Premium Premium to Par Par
D E
Stage C,D,E? Grow
No
High Embedded Agency Costs?
Yes
Return Capital
Keep Agency Costs Low
Yes
No
Increase commitment and size in proportion to magnitude of agency costs
Source: HOLT AnalysisNote: Value to Cost Ratio = HOLT’s adjusted price to book ratio
Capital Deployment and Corporate Life Cycle From the Investor’s Perspective
In this paper, we examine the valuation implications of record surplus cash levels in order to understand optimal cash usage from the investor’s perspective. We find that: • During the startup and growth stages of the corporate lifecycle, significant
shareholder value is created when management reinvests capital into higher CFROI® projects;
• During the mature stage of the lifecycle, significant value is destroyed when management reinvests capital into lower CFROI projects;
• Risks of overinvestment (defined as agency costs) increase as surplus cash exceeds investment opportunities;
• Distributions of capital (in the form of dividends and share repurchases) can create shareholder value when the perceived risk of misusing cash is high.
Michael Oliveros, CFA (212) 325-2292
Ron Graziano, CPA (312) 345-6169
Sergei Pliutsinski (212) 325-3644
Gautam Samarth (212) 325-0688
We would like to thank Jeff Ralto from Northeastern University for his valuable contributions to this report.
HOLT
2
Table of Contents
Table of Contents 2
Cash…Too Much of a Good Thing? 3
Cash and the Corporate Life Cycle 4
The Problem with Cash: Agency Costs 6
Can Cash Distribution Drive Shareholder Value? 8
The Practical Implications for Investors 10
Measuring the Market Implied Agency Risk Premium 11
Conclusion 13
Appendix A: Capital Decision Tree Backtests 15
Mergers and Acquisitions 15
Deleveraging 16
Dividends 17
Repurchase Shares 19
APPENDIX B: Case Study - SBUX 21
APPENDIX C: Why Repurchases Don’t Increase Share Prices 23
APPENDIX D: The Theory: Agency costs, Signals and Behavioral Biases 24
Agency Theory – Why surplus cash can be too much of a good thing 24
Assymetric Information/Signaling Hypothesis 25
Behavioral Corporate Finance – Why stock options may not prevent agency
problems 26
APPENDIX E: Agency Cost Derivation 28
The Math: Bridging Agency Theory to Valuation 28
HOLT
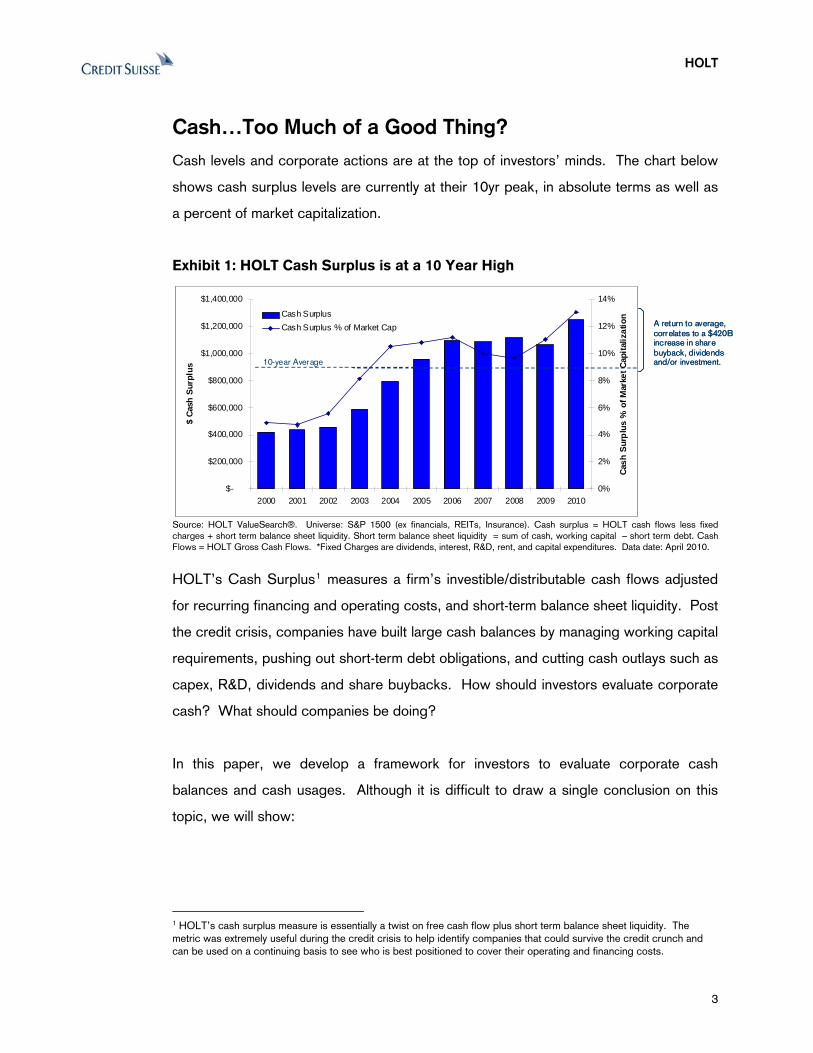
Cash…Too Much of a Good Thing? Cash levels and corporate actions are at the top of investors’ minds. The chart below
shows cash surplus levels are currently at their 10yr peak, in absolute terms as well as
a percent of market capitalization.
Exhibit 1: HOLT Cash Surplus is at a 10 Year High
$-
$200,000
$400,000
$600,000
$800,000
$1,000,000
$1,200,000
$1,400,000
2000 2001 2002 2003 2004 2005 2006 2007 2008 2009 2010
$ Ca
sh S
urpl
us
0%
2%
4%
6%
8%
10%
12%
14%
Cash
Sur
plus
% o
f Mar
ket C
apita
lizat
ionCash Surplus
Cash Surplus % of Market Cap
10-year Average
A return to average, correlates to a $420B increase in share buyback, dividends and/or investment.
Source: HOLT ValueSearch®. Universe: S&P 1500 (ex financials, REITs, Insurance). Cash surplus = HOLT cash flows less fixed charges + short term balance sheet liquidity. Short term balance sheet liquidity = sum of cash, working capital – short term debt. Cash Flows = HOLT Gross Cash Flows. *Fixed Charges are dividends, interest, R&D, rent, and capital expenditures. Data date: April 2010.
HOLT’s Cash Surplus1 measures a firm’s investible/distributable cash flows adjusted
for recurring financing and operating costs, and short-term balance sheet liquidity. Post
the credit crisis, companies have built large cash balances by managing working capital
requirements, pushing out short-term debt obligations, and cutting cash outlays such as
capex, R&D, dividends and share buybacks. How should investors evaluate corporate
cash? What should companies be doing?
In this paper, we develop a framework for investors to evaluate corporate cash
balances and cash usages. Although it is difficult to draw a single conclusion on this
topic, we will show:
1 HOLT’s cash surplus measure is essentially a twist on free cash flow plus short term balance sheet liquidity. The metric was extremely useful during the credit crisis to help identify companies that could survive the credit crunch and can be used on a continuing basis to see who is best positioned to cover their operating and financing costs.
3
HOLT
•
• The market value of corporate cash is highly dependent on the stage of a
company’s life cycle. Cash is valued more highly in growing firms; and
discounted more heavily in mature firms.
Reinvestment of cash into higher operating returns creates the most value for
shareholders. However, maturing companies have equal opportunities to create
value by returning cash to shareholders, particularly if their actions are aligned
with investor expectations.
Cash and the Corporate Life Cycle What’s the value of $1.00 sitting on a company’s balance sheet? According to
Pinkowitz and Williamson (2002), the market values $1.00 of corporate cash
somewhere between $1.19 and $1.25, which suggests, on average, the market values
the financial flexibility and growth potential afforded by cash. However, they also
observe significant variation across firms ranging from $0.26 to $2.38, attributing the
difference in valuation to the market’s assessment of each firm’s investment opportunity
set. Shareholders place a premium on cash for firms with high growth options; and a
discount on cash for firms with the potential to destroy shareholder value.
The market values cash based on its
assessment of each firm’s investment
opportunity set.
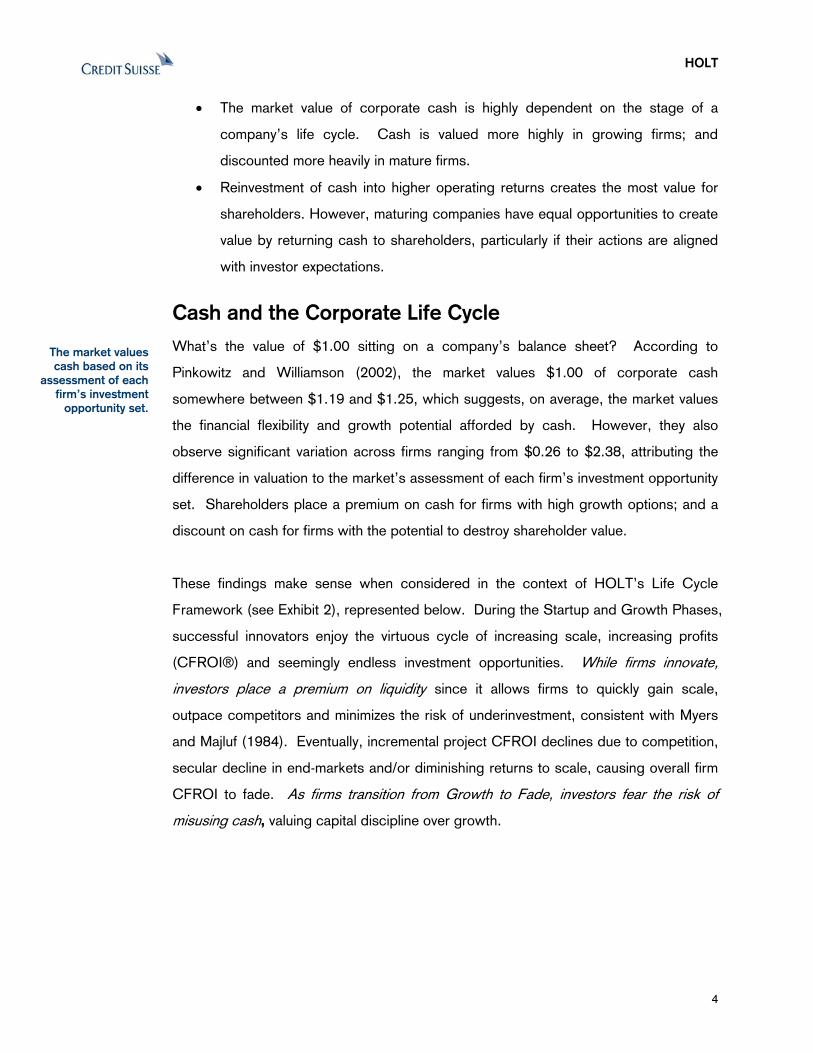
These findings make sense when considered in the context of HOLT’s Life Cycle
Framework (see Exhibit 2), represented below. During the Startup and Growth Phases,
successful innovators enjoy the virtuous cycle of increasing scale, increasing profits
(CFROI®) and seemingly endless investment opportunities. While firms innovate,
investors place a premium on liquidity since it allows firms to quickly gain scale,
outpace competitors and minimizes the risk of underinvestment, consistent with Myers
and Majluf (1984). Eventually, incremental project CFROI declines due to competition,
secular decline in end-markets and/or diminishing returns to scale, causing overall firm
CFROI to fade. As firms transition from Growth to Fade, investors fear the risk of
misusing cash, valuing capital discipline over growth.
4
HOLT
Exhibit 2: HOLT Corporate Life Cycle Framework
CFROI
Discount Rate (Investor's Required
Rate of Return)
RESTRUCTURESTARTUP
Discount
GROWTH
A
GROWTH FADE
B C
MATURE
Value to Cost RatioHigh Premium Premium to Par Par
D E
CFROI
Discount Rate (Investor's Required
Rate of Return)
RESTRUCTURESTARTUP
Discount
GROWTH
A
GROWTH FADE
B C
MATURE
Value to Cost RatioHigh Premium Premium to Par Par
D E
DiscountAverageDeclining PremiumHigh
PremiumHigh
PremiumValuation
Typically highIncreasingRelatively LowLowLowLeverage
NegativeLowSlowingHighHighAsset Growth
Below cost of capital
Around cost of capital
HighImprovingBelow cost of capital
CFROI
DiscountAverageDeclining PremiumHigh
PremiumHigh
PremiumValuation
Typically highIncreasingRelatively LowLowLowLeverage
NegativeLowSlowingHighHighAsset Growth
Below cost of capital
Around cost of capital
HighImprovingBelow cost of capital
CFROI
HOLT’s Corporate Life Cycle Framework
provides an empirical basis for considering
capital investment
Source: Credit Suisse HOLT
The discount or premium that investors place on cash reflects an expectation of
management’s success at investing cash; and by extension an underlying preference
for profitable reinvestment into high CFROI projects and aversion to overinvestment into
low CFROI projects, consistent with Pinkowitz and Williamson (2002).
Our analysis confirms this preference. We analyzed the share price returns of three
reinvestment categories: (1) Reinvestment leading to higher future CFROI; (2)
Divestment leading to higher future CFROI; and (3) Reinvestment leading to lower
future CFROI.
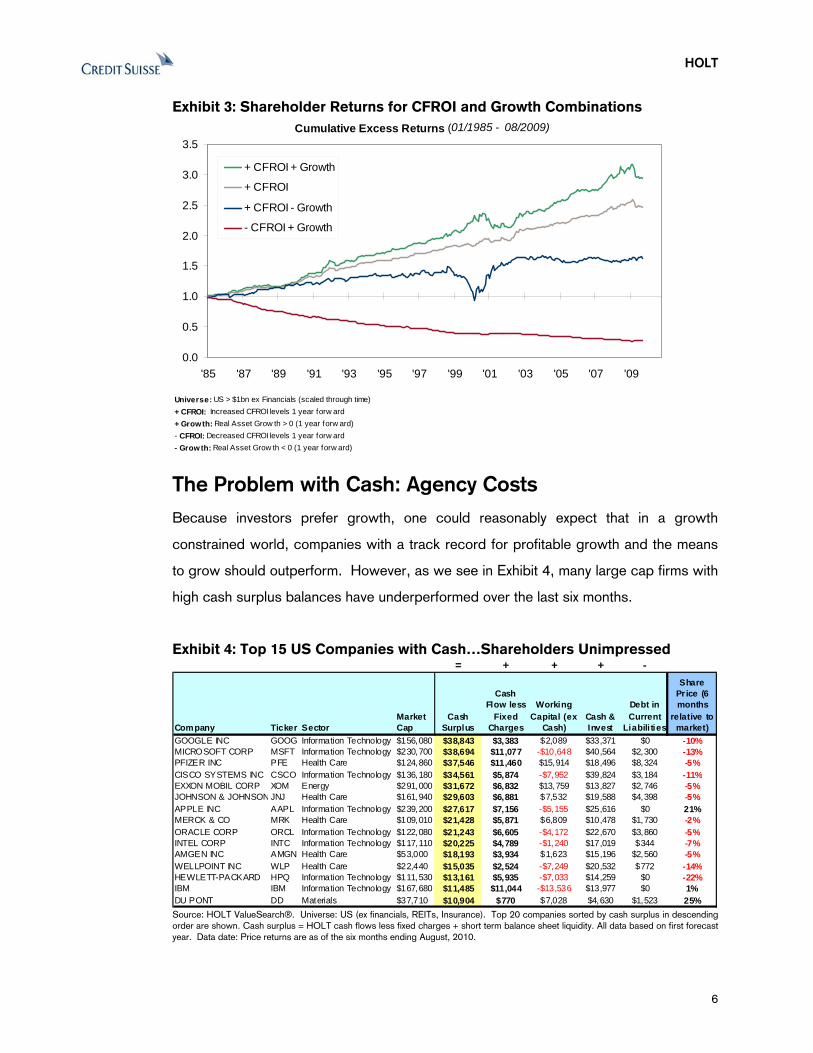
As you can see in Exhibit 3, shareholder returns are highest when firms invest in
projects that generate higher future CFROI; followed by divestment of lower CFROI
projects leading to higher overall future CFROI; and trailed significantly by reinvestment
into projects that lower future CFROI. The message is clear: the market rewards
reinvestment into higher CFROI projects and punishes investment into lower CFROI
projects.
The message is clear: the market rewards
reinvestment into higher CFROI projects
and punishes investment into lower
CFROI projects.
5
HOLT
Exhibit 3: Shareholder Returns for CFROI and Growth Combinations
Universe: US > $1bn ex Financials (scaled through time)+ CFROI: Increased CFROI levels 1 year forw ard+ Growth: Real Asset Grow th > 0 (1 year forw ard)- CFROI: Decreased CFROI levels 1 year forw ard- Grow th: Real Asset Grow th < 0 (1 year forw ard)
Cumulative Excess Returns (01/1985 - 08/2009)
0.0
0.5
1.0
1.5
2.0
2.5
3.0
3.5
'85 '87 '89 '91 '93 '95 '97 '99 '01 '03 '05 '07 '09
+ CFROI + Growth
+ CFROI
+ CFROI - Growth
- CFROI + Growth
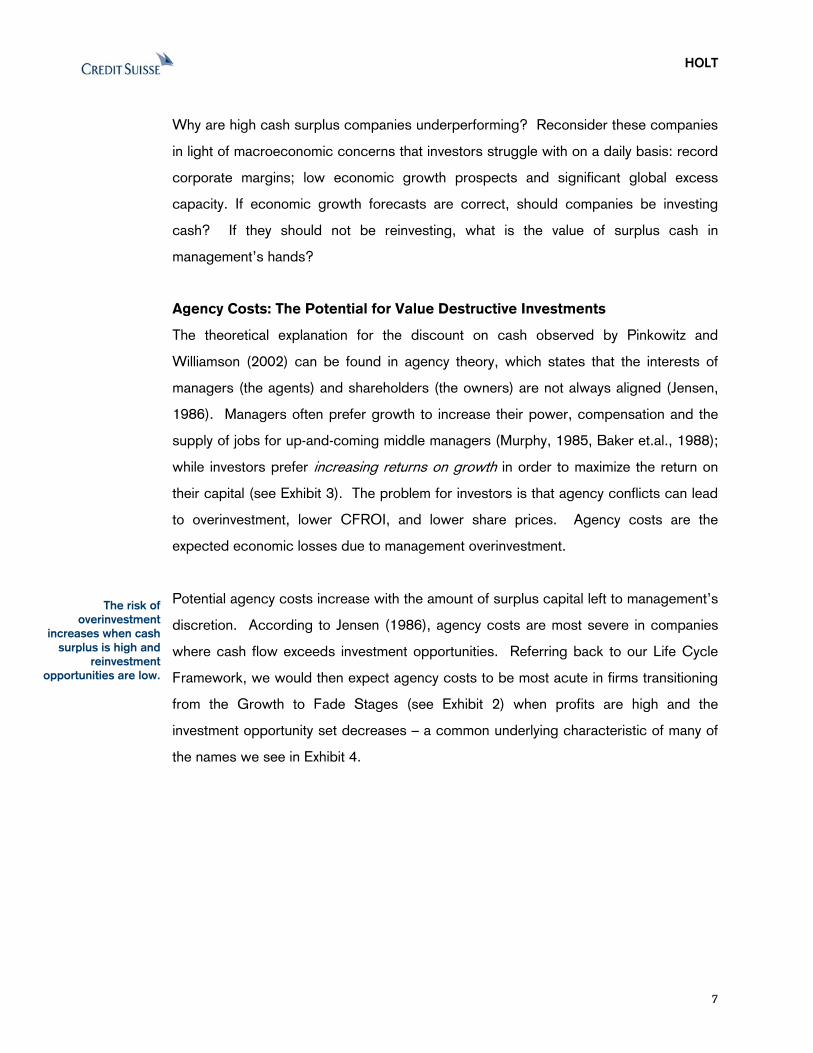
The Problem with Cash: Agency Costs Because investors prefer growth, one could reasonably expect that in a growth
constrained world, companies with a track record for profitable growth and the means
to grow should outperform. However, as we see in Exhibit 4, many large cap firms with
high cash surplus balances have underperformed over the last six months.
Exhibit 4: Top 15 US Companies with Cash…Shareholders Unimpressed
= + + + -
Company Ticker SectorMarket Cap
Cash Surplus
Cash Flow less
Fixed Charges
Working Capital (ex
Cash)Cash & Invest
Debt in Current
Liabili ties
Share Pr ice (6 months
relative to market)
GOOGLE INC GOOG Information Technology $156,080 $38,843 $3,383 $2,089 $33,371 $0 -10%$11,077 -$10,648 $2,300 -13%
$8,324 -5%$5,874 -$7,952 $3,184 -11
MICROSOFT CORP MSFT Information Technology $230,700 $38,694 $40,564PFIZER INC PFE Health Care $124,860 $37,546 $11,460 $15,914 $18,496CISCO SYSTEMS INC CSCO Information Technology $136,180 $34,561 $39,824 %EXXON MOBIL CORP XOM Energy $291,000 $31,672 $6,832 $13,759 $13,827JOHNSON & JOHNSO
$2,746 -5%N JNJ Health Care $161,940 $29,603 $6,881 $7,532 $19,588
APPLE INC AAPL Information Technology $239,200 $27,617 $25,616 $0 21%MERCK & CO MRK Health Care $109,010 $21,428 $5,871 $6,809 $10,478ORACLE CORP ORCL Information Technology $122,080 $21,243 $22,670
$4,398 -5%$7,156 -$5,155
$1,730 -2%$6,605 -$4,172 $3,860 -5%
INTEL CORP INTC Information Technology $117,110 $20,225 $17,019AMGEN INC AMGN Health Care $53,000 $18,193 $3,934 $1,623 $15,196WELLPOINT INC WLP Health Care $22,440 $15,035 $20,532
$4,789 -$1,240 $344 -7%$2,560 -5%
$2,524 -$7,249 $772 -14%HEWLETT-PACKARD HPQ Information Technology $111,530 $13,161 $14,259IBM IBM Information Technology $167,680 $11,485 $13,977 $0 1%DU PONT DD Materials $37,710 $10,904 $770 $7,028 $4,630 $1,523 25%
$5,935 -$7,033 $0 -22%$11,044 -$13,536
Source: HOLT ValueSearch®. Universe: US (ex financials, REITs, Insurance). Top 20 companies sorted by cash surplus in descending order are shown. Cash surplus = HOLT cash flows less fixed charges + short term balance sheet liquidity. All data based on first forecast year. Data date: Price returns are as of the six months ending August, 2010.
6
HOLT
Why are high cash surplus companies underperforming? Reconsider these companies
in light of macroeconomic concerns that investors struggle with on a daily basis: record
corporate margins; low economic growth prospects and significant global excess
capacity. If economic growth forecasts are correct, should companies be investing
cash? If they should not be reinvesting, what is the value of surplus cash in
management’s hands?
Agency Costs: The Potential for Value Destructive Investments
The theoretical explanation for the discount on cash observed by Pinkowitz and
Williamson (2002) can be found in agency theory, which states that the interests of
managers (the agents) and shareholders (the owners) are not always aligned (Jensen,
1986). Managers often prefer growth to increase their power, compensation and the
supply of jobs for up-and-coming middle managers (Murphy, 1985, Baker et.al., 1988);
while investors prefer increasing returns on growth in order to maximize the return on
their capital (see Exhibit 3). The problem for investors is that agency conflicts can lead
to overinvestment, lower CFROI, and lower share prices. Agency costs are the
expected economic losses due to management overinvestment.
Potential agency costs increase with the amount of surplus capital left to management’s
discretion. According to Jensen (1986), agency costs are most severe in companies
where cash flow exceeds investment opportunities. Referring back to our Life Cycle
Framework, we would then expect agency costs to be most acute in firms transitioning
from the Growth to Fade Stages (see Exhibit 2) when profits are high and the
investment opportunity set decreases – a common underlying characteristic of many of
the names we see in Exhibit 4.
The risk of overinvestment
increases when cash surplus is high and
reinvestment opportunities are low.
7
HOLT
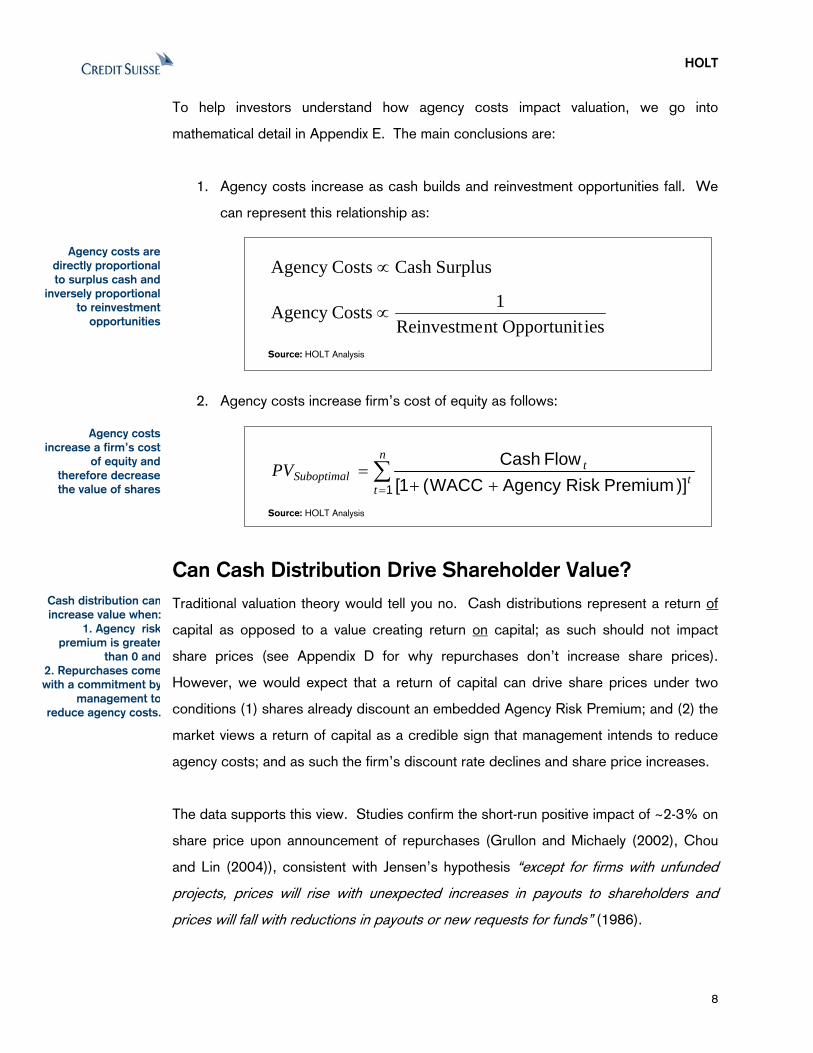
To help investors understand how agency costs impact valuation, we go into
mathematical detail in Appendix E. The main conclusions are:
1. Agency costs increase as cash builds and reinvestment opportunities fall. We
can represent this relationship as:
8
SurplusCash CostsAgency ∝
iesOpportunitnt Reinvestme1CostsAgency ∝
Source: HOLT Analysis
Agency costs are directly proportional to surplus cash and
inversely proportional to reinvestment
opportunities
2. Agency costs increase firm’s cost of equity as follows:
∑= ++
=n
tt
tSuboptimalPV
1 )]Premium RiskAgency WACC(1[Flow Cash
Source: HOLT Analysis
Agency costs increase a firm’s cost
of equity and therefore decrease the value of shares
Can Cash Distribution Drive Shareholder Value? Cash distribution canincrease value when:
1. Agency riskpremium is greater
than 0 and2. Repurchases comewith a commitment by
management toreduce agency costs.
Traditional valuation theory would tell you no. Cash distributions represent a return of
capital as opposed to a value creating return on capital; as such should not impact
share prices (see Appendix D for why repurchases don’t increase share prices).
However, we would expect that a return of capital can drive share prices under two
conditions (1) shares already discount an embedded Agency Risk Premium; and (2) the
market views a return of capital as a credible sign that management intends to reduce
agency costs; and as such the firm’s discount rate declines and share price increases.
The data supports this view. Studies confirm the short-run positive impact of ~2-3% on
share price upon announcement of repurchases (Grullon and Michaely (2002), Chou
and Lin (2004)), consistent with Jensen’s hypothesis “except for firms with unfunded
projects, prices will rise with unexpected increases in payouts to shareholders and
prices will fall with reductions in payouts or new requests for funds” (1986).
HOLT
The persistence of post-announcement outperformance, however, will depend on
management’s commitment to reducing agency costs. The findings of Grullon and
Michaely (2002) support this view; they find that together with reductions in capital
expenditures and R&D, firms that repurchase shares experience a significant reduction
in their cost of capital over a number of years following an announcement.
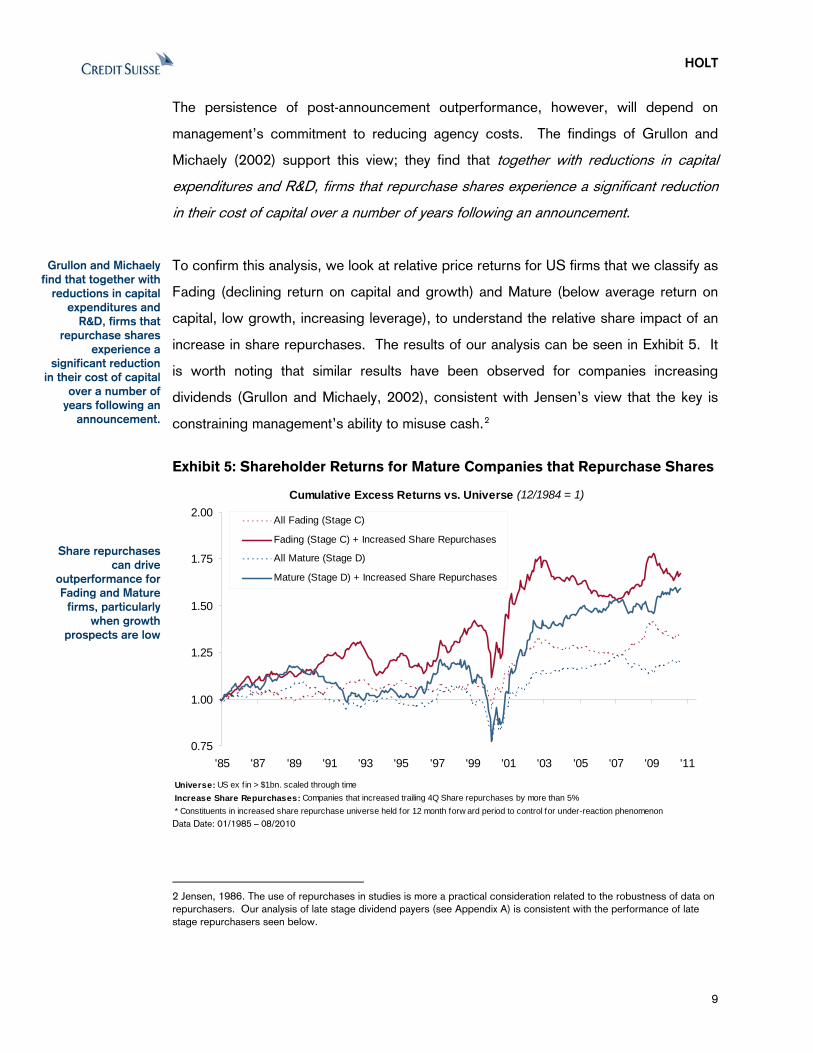
To confirm this analysis, we look at relative price returns for US firms that we classify as
Fading (declining return on capital and growth) and Mature (below average return on
capital, low growth, increasing leverage), to understand the relative share impact of an
increase in share repurchases. The results of our analysis can be seen in Exhibit 5. It
is worth noting that similar results have been observed for companies increasing
dividends (Grullon and Michaely, 2002), consistent with Jensen’s view that the key is
constraining management’s ability to misuse cash.2
Grullon and Michaely find that together with
reductions in capital expenditures and
R&D, firms that repurchase shares
experience a significant reduction
in their cost of capital over a number of
years following an announcement.
Exhibit 5: Shareholder Returns for Mature Companies that Repurchase Shares
Universe: US ex f in > $1bn. scaled through timeIncrease Share Repurchases: Companies that increased trailing 4Q Share repurchases by more than 5% * Constituents in increased share repurchase universe held for 12 month forw ard period to control for under-reaction phenomenon
Cumulative Excess Returns vs. Universe (12/1984 = 1)
0.75
1.00
1.25
1.50
1.75
2.00
'85 '87 '89 '91 '93 '95 '97 '99 '01 '03 '05 '07 '09 '11
All Fading (Stage C)
Fading (Stage C) + Increased Share Repurchases
All Mature (Stage D)
Mature (Stage D) + Increased Share Repurchases
Share repurchases can drive
outperformance for Fading and Mature
firms, particularly when growth
prospects are low
Data Date: 01/1985 – 08/2010
2 Jensen, 1986. The use of repurchases in studies is more a practical consideration related to the robustness of data on repurchasers. Our analysis of late stage dividend payers (see Appendix A) is consistent with the performance of late stage repurchasers seen below.
9
HOLT
The Practical Implications for Investors For investors, agency theory suggests that cash, free cash flow and free cash flow
yields should be considered in the context of the corporate life cycle. Depending on a
firm’s growth prospects, a high free cash flow yield can either signal a good investment
opportunity or high agency costs. Our findings suggest that the key considerations will
be: (1) a firm’s life cycle stage, (2) investor expectations, (3) management’s capital
plans and credibility.
For Fading and Mature Firms, the implications of agency theory are more subtle than a
simple discount to shares. Unlike company earnings that can be manipulated in the
short run, Discount Rates are more persistent because they are, in effect, measures of
market confidence (Chou, 1988). As such, the investor looking at companies with high
(and justified) market implied agency costs, should expect:
1. Changes in agency risk premiums to take time and
2. Assuming management has overtly committed to reducing agency costs, the
rate at which the agency risk premium declines (share rise) will be a function of
management’s credibility.
The implication for investors preceding the announcement of a capital distribution is that
alpha can be generated by encouraging/forcing management to credibly commit to
reducing agency costs. The implication for investors following the announcement of a
capital distribution is that alpha can still be generated by successfully analyzing the
disparity between the market implied agency risk premium and the strength of
management’s commitment to reducing agency costs.
Alpha can still be generated following
an announcement, if the market
underestimates managements
commitment to reduce agency costs.
For bondholders, the implications of agency theory are decidedly less positive.
Pinkowitz and Williamson (2002) identify stockholder/ bondholder conflicts as a
significant determinant of the discounts they observe on cash, particularly when
financial distress costs are high (as any benefits from holding cash accrue mainly to
bondholders). Jensen's control hypothesis specifically cites the effectiveness of debt in
minimizing agency costs as "debt creation, without retention of proceeds, enables
managers to effectively bond their promise to pay out future cash flows" (1986).
The implications of agency theory are
bad for bondholders.
10
HOLT
Our findings seen in Exhibit 10 are consistent with these views. Aside from highly
distressed situations, we find that increasing levels of leverage generally do not lead to
relative share underperformance, which suggests that to stockholders, the control
benefits of debt significantly outweigh the risks up to the point of distress.
A Quick Note on Incentive Compensation Schemes
It is reasonable to question the relevance of agency theory given the increased use of
share based incentive plans. After all, managers of large cash flow generating
companies today have significant personal stakes that should align their interests with
investors. Malmendier and Tate (2005) suggest that management overconfidence can
counteract the benefits of alignment and find that management’s ownership
concentration is a significant measure of overconfidence. The agency problem in some
ways is complicated because management is potentially blind to it, in Malmendier and
Tate’s words, “Differently from traditional explanations, such as empire building, the
CEO truly believes that he is creating value with his (over-)investment” (Ibid). A more
recent study by Griffen and Zhu (2009) noted that corporate managers with
outstanding stock options exploit share buybacks to increase the value of their stock
compensation, which increases agency costs to outside shareholders.
Management overconfidence can
counteract the intention of incentive compensation plans.
In certain circumstances,
ownership actually reinforces
overconfidence.
Measuring the Market Implied Agency Risk Premium Gauging investor expectations about returns and reinvestment rates is crucial when
considering uses of capital. HOLT’s Relative Wealth Chart provides insight into
management’s track record of historical investments, and more importantly for investors,
the market’s expectation of future investments.
11
HOLT
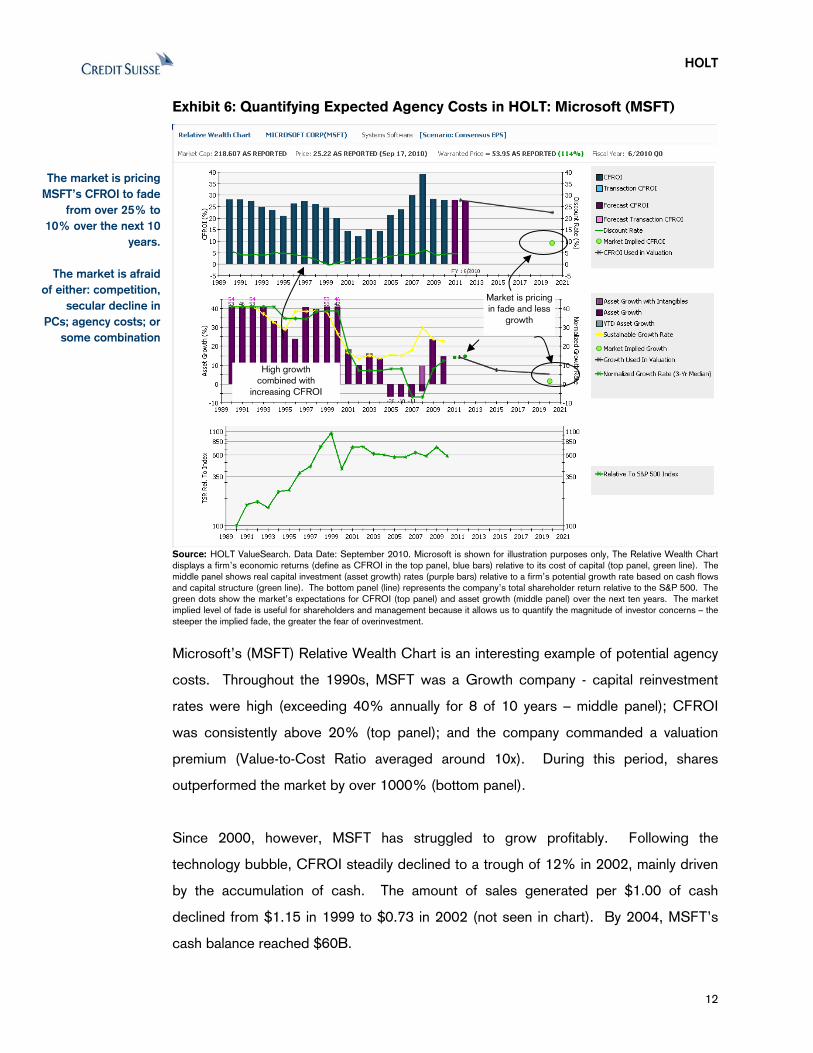
Exhibit 6: Quantifying Expected Agency Costs in HOLT: Microsoft (MSFT)
The market is pricing MSFT’s CFROI to fade
from over 25% to 10% over the next 10
years.
The market is afraid of either: competition,
secular decline in PCs; agency costs; or
some combination
Market is pricing in fade and less
growth
High growth combined with
increasing CFROI
Source: HOLT ValueSearch. Data Date: September 2010. Microsoft is shown for illustration purposes only, The Relative Wealth Chart displays a firm’s economic returns (define as CFROI in the top panel, blue bars) relative to its cost of capital (top panel, green line). The middle panel shows real capital investment (asset growth) rates (purple bars) relative to a firm’s potential growth rate based on cash flows and capital structure (green line). The bottom panel (line) represents the company’s total shareholder return relative to the S&P 500. The green dots show the market’s expectations for CFROI (top panel) and asset growth (middle panel) over the next ten years. The market implied level of fade is useful for shareholders and management because it allows us to quantify the magnitude of investor concerns – the steeper the implied fade, the greater the fear of overinvestment.
Microsoft’s (MSFT) Relative Wealth Chart is an interesting example of potential agency
costs. Throughout the 1990s, MSFT was a Growth company - capital reinvestment
rates were high (exceeding 40% annually for 8 of 10 years – middle panel); CFROI
was consistently above 20% (top panel); and the company commanded a valuation
premium (Value-to-Cost Ratio averaged around 10x). During this period, shares
outperformed the market by over 1000% (bottom panel).
Since 2000, however, MSFT has struggled to grow profitably. Following the
technology bubble, CFROI steadily declined to a trough of 12% in 2002, mainly driven
by the accumulation of cash. The amount of sales generated per $1.00 of cash
declined from $1.15 in 1999 to $0.73 in 2002 (not seen in chart). By 2004, MSFT’s
cash balance reached $60B.
12
HOLT
13
Starting in 2005, MSFT’s CFROI began to rise. However, the middle panel Relative
Wealth Chart shows a significant change in the driver of MSFT’s CFROI. Note the
negative asset growth rates from 2005 through 2007; over that time period, MSFT’s
cash balance declined 61%. Coupling this shrinking asset base with recovering sales,
cash turns recovered from $0.61 in 2004 to $2.18 in 2007.
With CFROI back at peak levels and cash surplus once again accumulating (currently
~$40B), agency costs are a valid concern. And as we can see by the market implied
CFROI (the green dots), the market expects MSFT’s CFROI to decline to 10%.
Following the company’s recent share repurchase and dividend increase
announcements, investors should be asking, “Does the repurchase and accompanying
actions by management present a credible commitment to reduce agency costs?”
Conclusion In this paper, we examine the implications of record surplus cash levels. We survey
financial literature to develop a framework for valuing the economic cost of cash, and
use HOLT’s life cycle framework to systematically test capital deployment strategies.
We find that during a firm’s growth stages, significant shareholder value is created
when management reinvests capital into higher CFROI projects; and that, when a firm
is maturing, significant value is destroyed when management reinvests capital into lower
CFROI projects (See Exhibit 3). We also find that distribution of capital (in the form of
dividends and share repurchases) can create shareholder value when the perceived
risk of misusing cash is high.
For investors agency, theory suggests that cash, free cash flow and free cash flow
yields should be considered in the context of the corporate life cycle. Depending on a
firm’s growth prospects, a high free cash flow yield can either signal a good investment
opportunity or high agency costs. Our findings suggest that the key considerations will
be: (1) a firm’s life cycle stage, (2) investor expectations, (3) management’s capital
plans and credibility.
HOLT
14
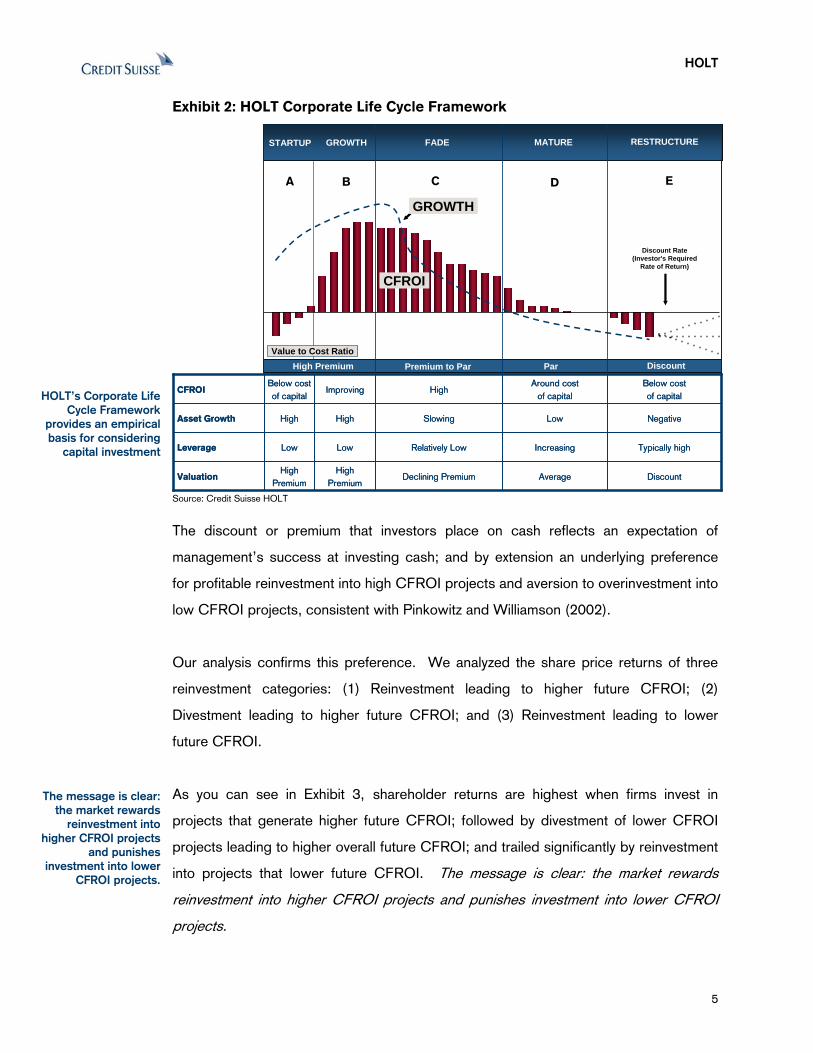
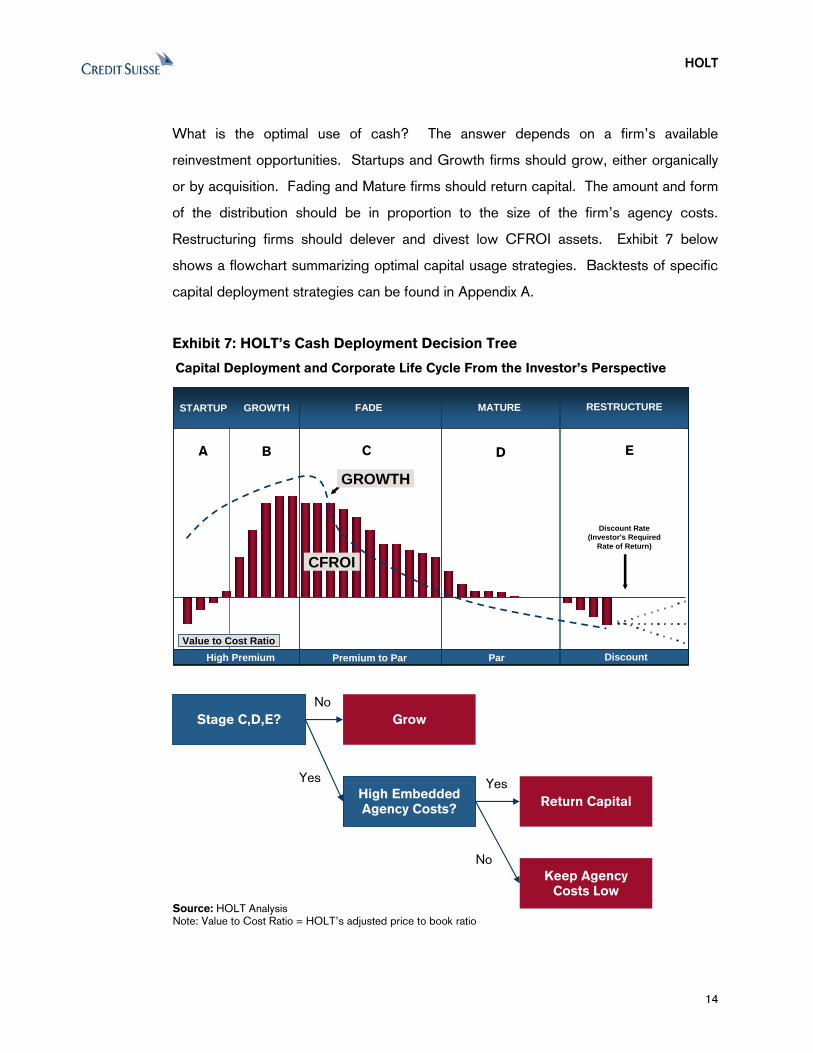
What is the optimal use of cash? The answer depends on a firm’s available
reinvestment opportunities. Startups and Growth firms should grow, either organically
or by acquisition. Fading and Mature firms should return capital. The amount and form
of the distribution should be in proportion to the size of the firm’s agency costs.
Restructuring firms should delever and divest low CFROI assets. Exhibit 7 below
shows a flowchart summarizing optimal capital usage strategies. Backtests of specific
capital deployment strategies can be found in Appendix A.
Exhibit 7: HOLT’s Cash Deployment Decision Tree
CFROI
Discount Rate (Investor's Required
Rate of Return)
RESTRUCTURESTARTUP
Discount
GROWTH
A
GROWTH FADE
B C
MATURE
Value to Cost RatioHigh Premium Premium to Par Par
D E
CFROI
Discount Rate (Investor's Required
Rate of Return)
RESTRUCTURESTARTUP
Discount
GROWTH
A
GROWTH FADE
B C
MATURE
Value to Cost RatioHigh Premium Premium to Par Par
D E
Stage C,D,E? Grow
No
High Embedded Agency Costs?
Yes
Return Capital
Keep Agency Costs Low
Yes
No
Source: HOLT AnalysisNote: Value to Cost Ratio = HOLT’s adjusted price to book ratio
Capital Deployment and Corporate Life Cycle From the Investor’s Perspective
HOLT
Appendix A: Capital Decision Tree Backtests
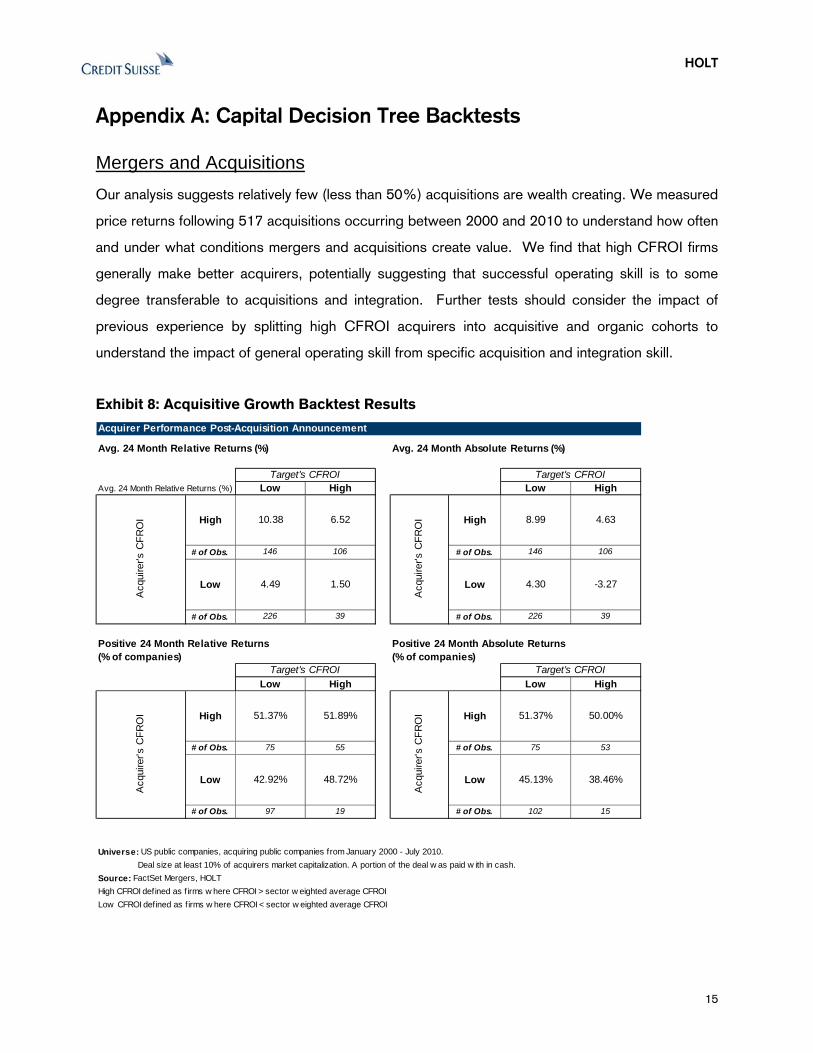
Mergers and Acquisitions Our analysis suggests relatively few (less than 50%) acquisitions are wealth creating. We measured
price returns following 517 acquisitions occurring between 2000 and 2010 to understand how often
and under what conditions mergers and acquisitions create value. We find that high CFROI firms
generally make better acquirers, potentially suggesting that successful operating skill is to some
degree transferable to acquisitions and integration. Further tests should consider the impact of
previous experience by splitting high CFROI acquirers into acquisitive and organic cohorts to
understand the impact of general operating skill from specific acquisition and integration skill.
Exhibit 8: Acquisitive Growth Backtest Results
Acquirer Performance Post-Acquisition Announcement
Avg. 24 Month Relative Returns (%) Avg. 24 Month Absolute Returns (%)
Avg. 24 Month Relative Returns (%) Low High Low High
High 10.38 6.52 High 8.99 4.63
# of Obs. 146 106 # of Obs. 146 106
Low 4.49 1.50 Low 4.30 -3.27
# of Obs. 226 39 # of Obs. 226 39
Positive 24 Month Relative Returns Positive 24 Month Absolute Returns (% of companies) (% of companies)
Low High Low High
High 51.37% 51.89% High 51.37% 50.00%
# of Obs. 75 55 # of Obs. 75 53
Low 42.92% 48.72% Low 45.13% 38.46%
# of Obs. 97 19 # of Obs. 102 15
Universe: US public companies, acquiring public companies from January 2000 - July 2010. Deal size at least 10% of acquirers market capitalization. A portion of the deal w as paid w ith in cash. Source: FactSet Mergers, HOLTHigh CFROI defined as f irms w here CFROI > sector w eighted average CFROILow CFROI defined as f irms w here CFROI < sector w eighted average CFROI
Target's CFROI
Acq
uire
r's C
FRO
I
Target's CFROI
Acq
uire
r's C
FRO
I
Target's CFROI
Acq
uire
r's C
FRO
I
Target's CFROI
Acq
uire
r's C
FRO
I
15
HOLT
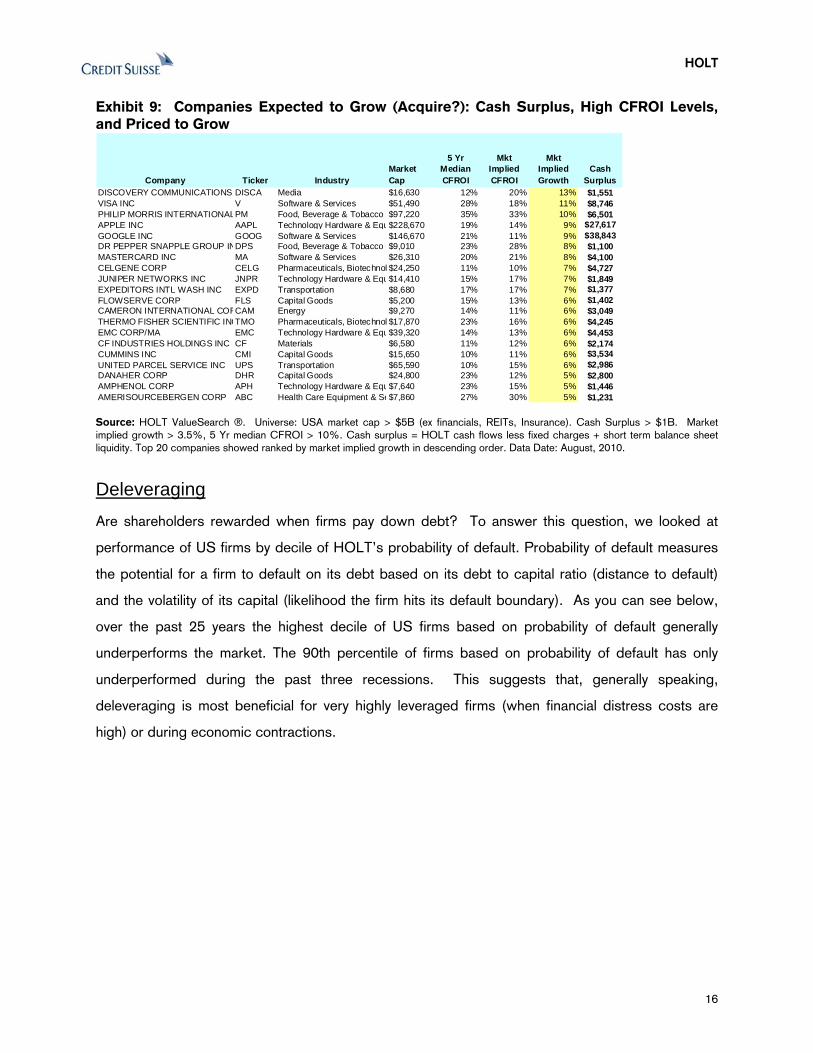
Exhibit 9: Companies Expected to Grow (Acquire?): Cash Surplus, High CFROI Levels,
and Priced to Grow
Company Ticker IndustryMarket Cap
5 Yr Median CFROI
Mkt Implied CFROI
Mkt Implied Growth
Cash Surplus
DISCOVERY COMMUNICATIONS DISCA Media $16,630 12% 20% 13% $1,551VISA INC V Software & Services $51,490 28% 18% 11% $8,746PHILIP MORRIS INTERNATIONALPM Food, Beverage & Tobacco $97,220 35% 33% 10% $6,501APPLE INC AAPL Technology Hardware & Equ$228,670 19% 14% 9% $27,617GOOGLE INC GOOG Software & Services $146,670 21% 11% 9% $38,843DR PEPPER SNAPPLE GROUP INDPS Food, Beverage & Tobacco $9,010 23% 28% 8% $1,100MASTERCARD INC MA Software & Services $26,310 20% 21% 8% $4,100CELGENE CORP CELG Pharmaceuticals, Biotechnol $24,250 11% 10% 7% $4,727JUNIPER NETWORKS INC JNPR Technology Hardware & Equ$14,410 15% 17% 7% $1,849EXPEDITORS INTL WASH INC EXPD Transportation $8,680 17% 17% 7% $1,377FLOWSERVE CORP FLS Capital Goods $5,200 15% 13% 6% $1,402CAMERON INTERNATIONAL CORCAM Energy $9,270 14% 11% 6% $3,049THERMO FISHER SCIENTIFIC INCTMO Pharmaceuticals, Biotechnol $17,870 23% 16% 6% $4,245EMC CORP/MA EMC Technology Hardware & Equ$39,320 14% 13% 6% $4,453CF INDUSTRIES HOLDINGS INC CF Materials $6,580 11% 12% 6% $2,174CUMMINS INC CMI Capital Goods $15,650 10% 11% 6% $3,534UNITED PARCEL SERVICE INC UPS Transportation $65,590 10% 15% 6% $2,986DANAHER CORP DHR Capital Goods $24,800 23% 12% 5% $2,800AMPHENOL CORP APH Technology Hardware & Equ$7,640 23% 15% 5% $1,446AMERISOURCEBERGEN CORP ABC Health Care Equipment & Se$7,860 27% 30% 5% $1,231
Source: HOLT ValueSearch ®. Universe: USA market cap > $5B (ex financials, REITs, Insurance). Cash Surplus > $1B. Market implied growth > 3.5%, 5 Yr median CFROI > 10%. Cash surplus = HOLT cash flows less fixed charges + short term balance sheet liquidity. Top 20 companies showed ranked by market implied growth in descending order. Data Date: August, 2010.
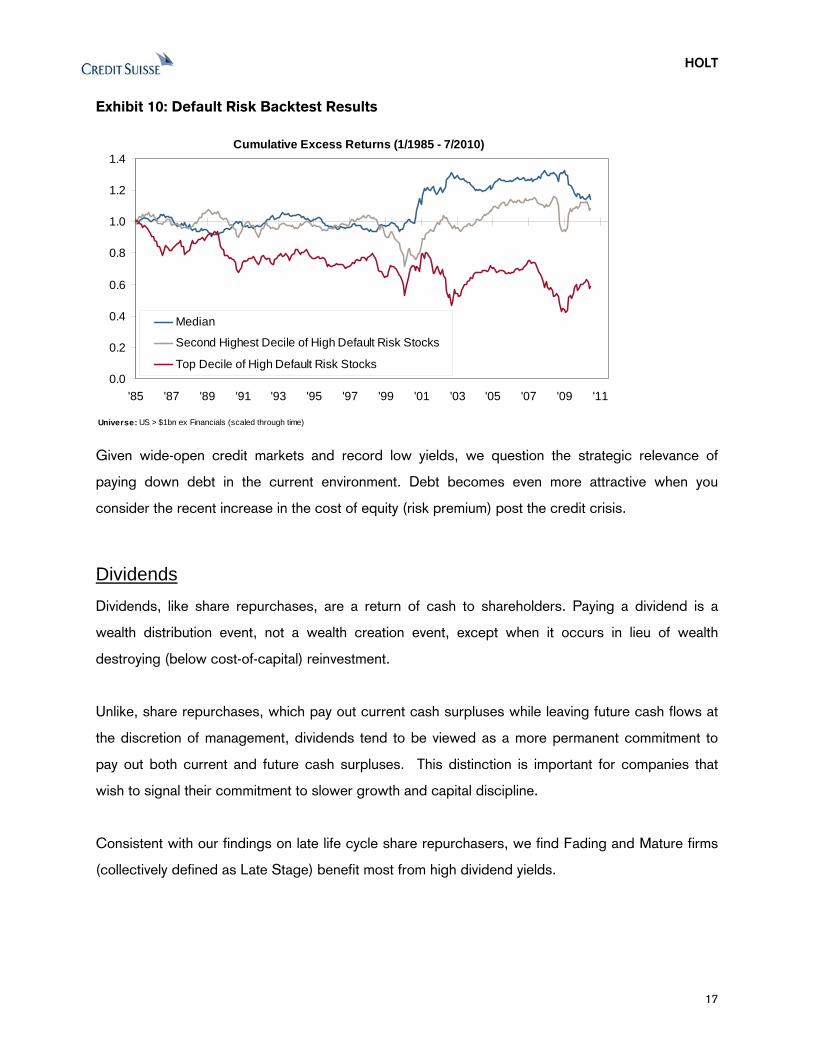
Deleveraging Are shareholders rewarded when firms pay down debt? To answer this question, we looked at
performance of US firms by decile of HOLT’s probability of default. Probability of default measures
the potential for a firm to default on its debt based on its debt to capital ratio (distance to default)
and the volatility of its capital (likelihood the firm hits its default boundary). As you can see below,
over the past 25 years the highest decile of US firms based on probability of default generally
underperforms the market. The 90th percentile of firms based on probability of default has only
underperformed during the past three recessions. This suggests that, generally speaking,
deleveraging is most beneficial for very highly leveraged firms (when financial distress costs are
high) or during economic contractions.
16
HOLT
Exhibit 10: Default Risk Backtest Results
Universe: US > $1bn ex Financials (scaled through time)
Cumulative Excess Returns (1/1985 - 7/2010)
0.0
0.2
0.4
0.6
0.8
1.0
1.2
1.4
'85 '87 '89 '91 '93 '95 '97 '99 '01 '03 '05 '07 '09 '11
Median
Second Highest Decile of High Default Risk Stocks
Top Decile of High Default Risk Stocks
Given wide-open credit markets and record low yields, we question the strategic relevance of
paying down debt in the current environment. Debt becomes even more attractive when you
consider the recent increase in the cost of equity (risk premium) post the credit crisis.
Dividends Dividends, like share repurchases, are a return of cash to shareholders. Paying a dividend is a
wealth distribution event, not a wealth creation event, except when it occurs in lieu of wealth
destroying (below cost-of-capital) reinvestment.
Unlike, share repurchases, which pay out current cash surpluses while leaving future cash flows at
the discretion of management, dividends tend to be viewed as a more permanent commitment to
pay out both current and future cash surpluses. This distinction is important for companies that
wish to signal their commitment to slower growth and capital discipline.
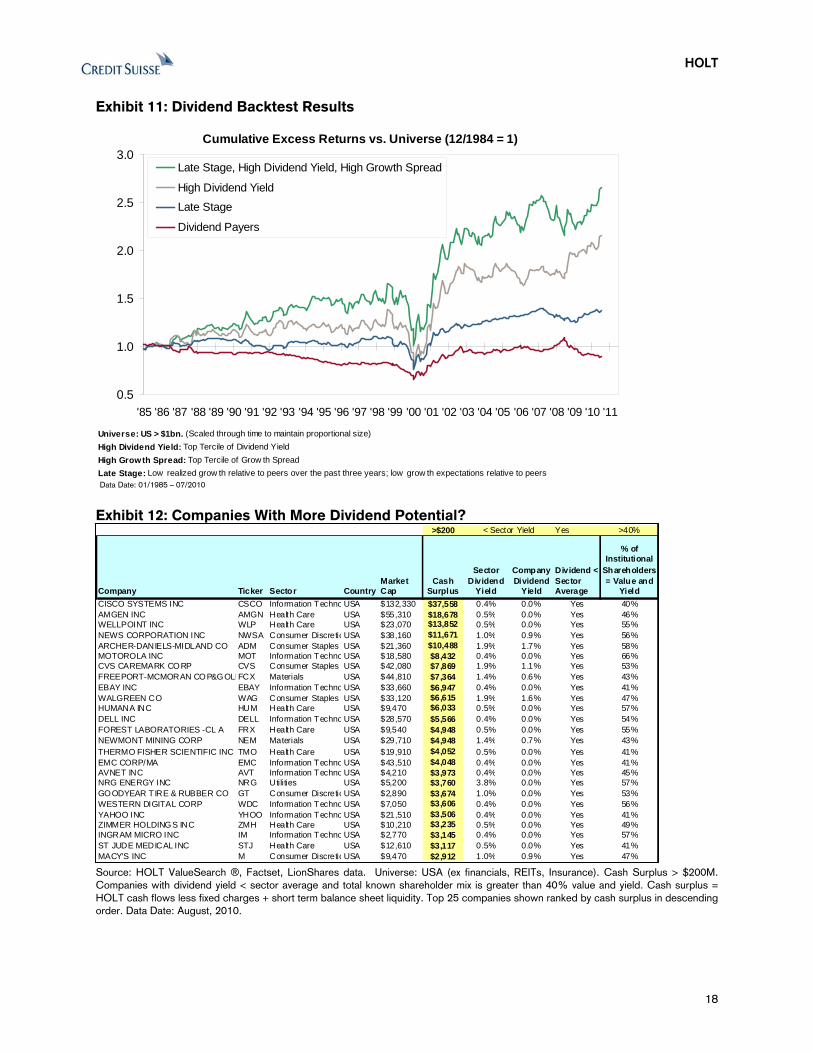
Consistent with our findings on late life cycle share repurchasers, we find Fading and Mature firms
(collectively defined as Late Stage) benefit most from high dividend yields.
17
HOLT
Exhibit 11: Dividend Backtest Results
Universe: US > $1bn. (Scaled through time to maintain proportional size)High Dividend Yield: Top Tercile of Dividend YieldHigh Growth Spread: Top Tercile of Grow th Spread
Cumulative Excess Returns vs. Universe (12/1984 = 1)
0.5
1.0
1.5
2.0
2.5
3.0
'85 '86 '87 '88 '89 '90 '91 '92 '93 '94 '95 '96 '97 '98 '99 '00 '01 '02 '03 '04 '05 '06 '07 '08 '09 '10 '11
Late Stage, High Dividend Yield, High Growth Spread
High Dividend YieldLate Stage
Dividend Payers
ate Stage: Low realized grow th relative to peers over the past three years; low grow th expectations relative to peers L Data Date: 01/1985 – 07/2010
Exhibit 12: Companies With More Dividend Potential?
>$200 Yes >40%
Company Ticker Sector CountryMarket Cap
Cash Surplus
Sector Dividend
Yield
CompanyDividend
Yield
Dividend < Sector Average
% of Institutional
Shareholders = Value and
YieldCISCO SYSTEMS INC CSCO Information Techno USA $132,330 $37,558 0.4% 0.0% Yes 40%AMGEN INC AMGN Health Care USA $55,310 $18,678 0.5% 0.0% Yes 46%WELLPOINT INC WLP Health Care USA $23,070 $13,852 0.5% 0.0% Yes 55%NEWS CORPORATION INC NWSA Consumer DiscretioUSA $38,160 $11,671 1.0% 0.9% Yes 56%ARCHER-DANIELS-MIDLAND CO ADM Consumer Staples USA $21,360 $10,488 1.9% 1.7% Yes 58%MOTOROLA INC MOT Information Techno USA $18,580 $8,432 0.4% 0.0% Yes 66%CVS CAREMARK CORP CVS Consumer Staples USA $42,080 $7,869 1.9% 1.1% Yes 53%FREEPORT-MCMORAN COP&GOLDFCX Materials USA $44,810 $7,364 1.4% 0.6% Yes 43%EBAY INC EBAY Information Techno USA $33,660 $6,947 0.4% 0.0% Yes 41%WALGREEN CO WAG Consumer Staples USA $33,120 $6,615 1.9% 1.6% Yes 47%HUMANA INC HUM Health Care USA $9,470 $6,033 0.5% 0.0% Yes 57%DELL INC DELL Information Techno USA $28,570 $5,566 0.4% 0.0% Yes 54%FOREST LABORATORIES -CL A FRX Health Care USA $9,540 $4,948 0.5% 0.0% Yes 55%NEWMONT MINING CORP NEM Materials USA $29,710 $4,948 1.4% 0.7% Yes 43%THERMO FISHER SCIENTIFIC INC TMO Health Care USA $19,910 $4,052 0.5% 0.0% Yes 41%EMC CORP/MA EMC Information Techno USA $43,510 $4,048 0.4% 0.0% Yes 41%AVNET INC AVT Information Techno USA $4,210 $3,973 0.4% 0.0% Yes 45%NRG ENERGY INC NRG Utilities USA $5,200 $3,760 3.8% 0.0% Yes 57%GOODYEAR TIRE & RUBBER CO GT Consumer DiscretioUSA $2,890 $3,674 1.0% 0.0% Yes 53%WESTERN DIGITAL CORP WDC Information Techno USA $7,050 $3,606 0.4% 0.0% Yes 56%YAHOO INC YHOO Information Techno USA $21,510 $3,506 0.4% 0.0% Yes 41%ZIMMER HOLDINGS INC ZMH Health Care USA $10,210 $3,235 0.5% 0.0% Yes 49%INGRAM MICRO INC IM Information Techno USA $2,770 $3,145 0.4% 0.0% Yes 57%ST JUDE MEDICAL INC STJ Health Care USA $12,610 $3,117 0.5% 0.0% Yes 41%MACY'S INC M Consumer DiscretioUSA $9,470 $2,912 1.0% 0.9% Yes 47%
< Sector Yield
Source: HOLT ValueSearch ®, Factset, LionShares data. Universe: USA (ex financials, REITs, Insurance). Cash Surplus > $200M. Companies with dividend yield < sector average and total known shareholder mix is greater than 40% value and yield. Cash surplus = HOLT cash flows less fixed charges + short term balance sheet liquidity. Top 25 companies shown ranked by cash surplus in descending order. Data Date: August, 2010.
18
HOLT
19
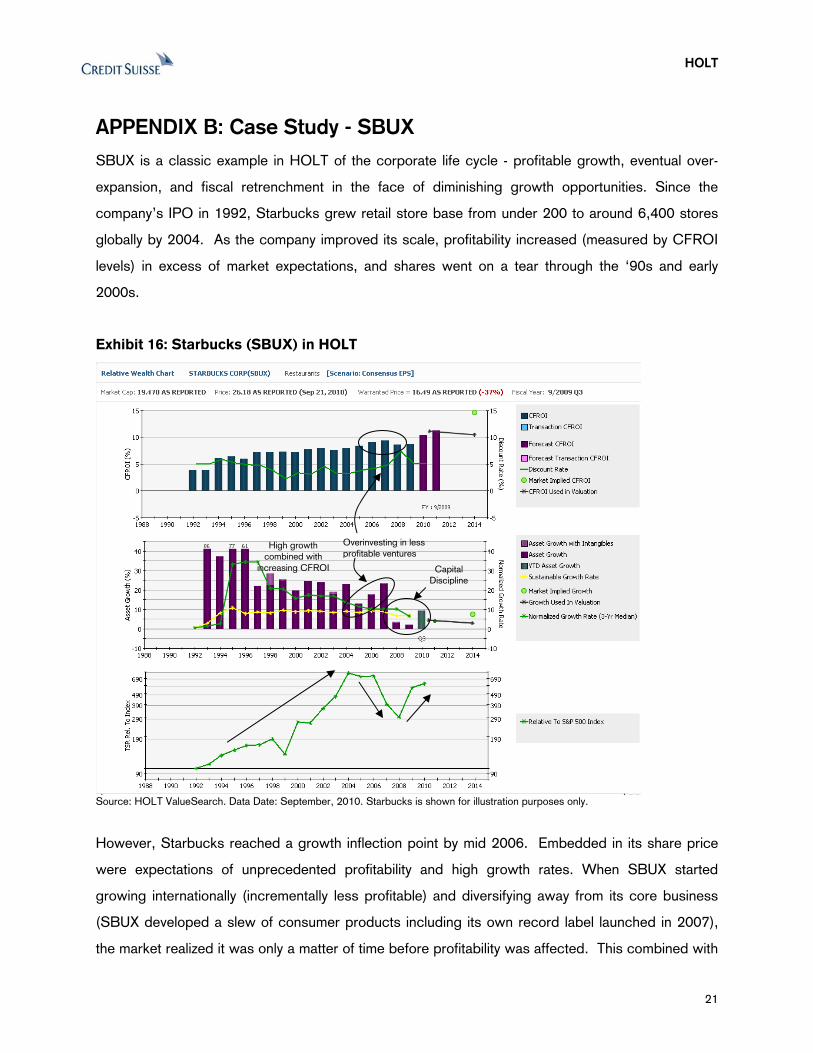
A conclusion of this paper is that share repurchases and dividends have just as much opportunity to
create value as growth, as long as a firm’s actions are properly aligned with shareholder
expectations. As shown in exhibit 12, an important data point related to investor expectations is
shareholder type (i.e. Value vs Growth).
Repurchase Shares Similar to many of the academic studies we reviewed, it is difficult to attribute long-term
outperformance specifically to share repurchases. Grullon and Michaely (2002), Chou and Lin
(2004)) confirm significant short-run excess stock returns upon announcement of a repurchase
(~2% for open-market repurchase programs). However, the long-run persistence of this
outperformance is disputed. An oft-cited study by Ikenberry, Lakonishok, Vermaelen (1995) shows
long-term persistent abnormal returns post-announcement on the order of 12% over the four years
following the initial announcement of open market share repurchases, which is consistent with the
reduction in risk premium proposed by Grullon and Michaely (2002).
Comment and Jarrell (1995) show that the form of repurchase can impact performance. Fixed price
self tenders result in an average excess return of ~11% compared with less than 8% for Dutch
auctions and ~2-3% for open-market repurchases, consistent with Jensen’s view that “the
magnitudes of value changes are positively related to the change in the tightness of the commitment
bonding the payment of future cash flows” (1986).
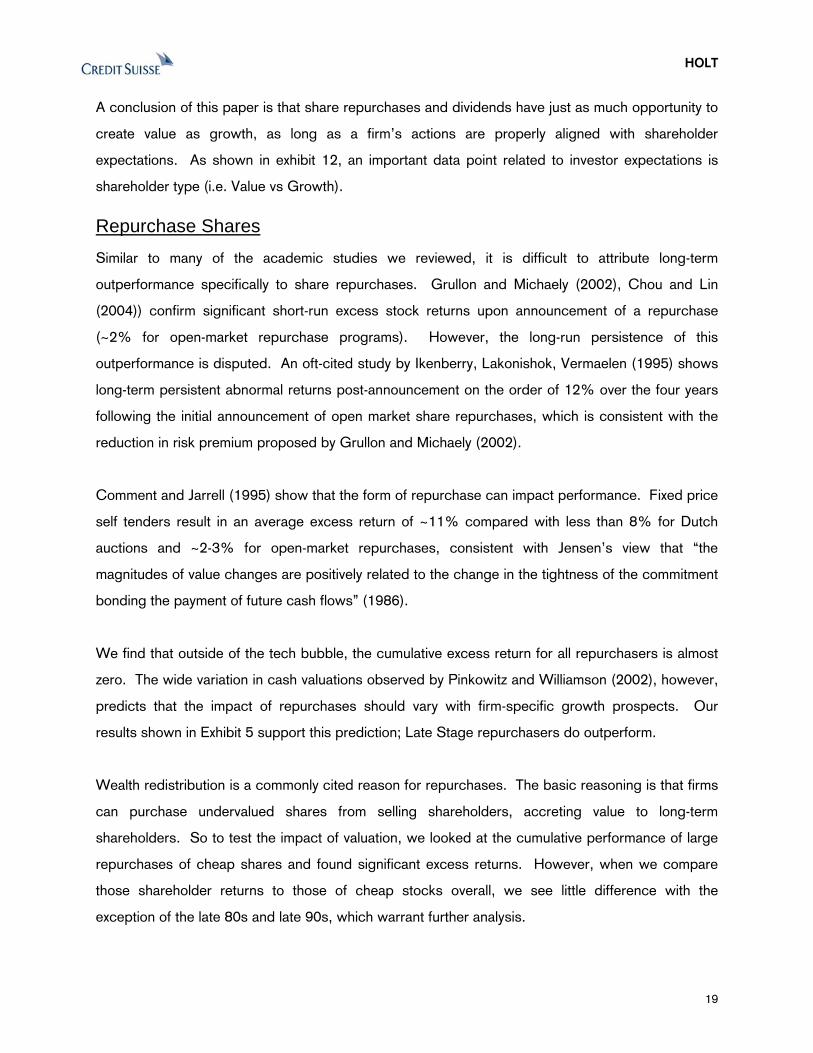
We find that outside of the tech bubble, the cumulative excess return for all repurchasers is almost
zero. The wide variation in cash valuations observed by Pinkowitz and Williamson (2002), however,
predicts that the impact of repurchases should vary with firm-specific growth prospects. Our
results shown in Exhibit 5 support this prediction; Late Stage repurchasers do outperform.
Wealth redistribution is a commonly cited reason for repurchases. The basic reasoning is that firms
can purchase undervalued shares from selling shareholders, accreting value to long-term
shareholders. So to test the impact of valuation, we looked at the cumulative performance of large
repurchases of cheap shares and found significant excess returns. However, when we compare
those shareholder returns to those of cheap stocks overall, we see little difference with the
exception of the late 80s and late 90s, which warrant further analysis.
HOLT
20
Exhibit 13: Share Repurchase Backtest Results
Universe: US > $1bn. scaled through timeRepurchasers: Companies that repurchased shares over the trailing 4 quartersHigh Repurchase Yield: Companies w ith a repurchase yield ( market value of share repurchases over the trailing 4 quarters divided by Market Cap.) greater than the median of all repurchasersCheap: Top quintile of HOLT Valuation
Cumulative Excess Returns (01/1985 - 07/2010)
0.5
1.0
1.5
2.0
2.5
3.0
3.5
'85 '87 '89 '91 '93 '95 '97 '99 '01 '03 '05 '07 '09 '11
Cheap Stocks
High Repurchase Yield + Cheap
Net Repurchasers
High Repurchase Yield
Exhibit 14: Companies Positioned to Buy Back Shares
>$200 >0% >0 >40%
Company Ticker SectorMarket Cap
Cash Surplus
HOLT Price % to
Best Up(down)
Side
HOLT's Economic
P/E (Sector
Average)
Company Econ omic
P/E
% of Institutional
Sharehol ders = Value and
YieldMICROSOFT CORP MSFT Information Techno$219,390 $45,624 116.76 20 12 46%PFIZER INC PFE Heal th Care $141,960 $39,961 38.97 17 13 53%CISCO SYSTEMS INC CSCO Information Techno$132,330 $37,558 34.35 20 15 40%EXXON MOBIL CORP XOM Energy $336,110 $37,145 30.16 20 19 43%JOHNSON & JOHNSON JNJ Heal th Care $175,160 $28,314 21.95 17 15 48%INTEL CORP INTC Information Techno$109,340 $24,128 70.50 20 11 46%AMGEN INC AMGN Heal th Care $55,310 $18,678 30.67 17 13 46%MERCK & CO MRK Heal th Care $113,980 $15,827 47.95 17 13 49%WELLPOI NT INC WLP Heal th Care $23,070 $13,852 34.39 17 11 55%NEWS CORPORATION INC NWSA Cons umer Discret io$38,160 $11,671 29.87 19 14 56%HEWLETT -PACKARD CO HPQ Information Techno$98,310 $11,076 34.62 20 11 47%ARCHER-DANIELS-MIDLAND CADM Cons umer Stap les $21,360 $10,488 44.56 19 15 58%INTL BUSINESS MACHINES C IBM Information Techno$175,410 $10,241 15.45 20 15 44%ABBOTT LABORATORIES ABT Heal th Care $80,940 $9,429 67.63 17 15 46%LILLY (ELI) & CO LLY Heal th Care $39,580 $9,171 139.96 17 9 55%CVS CAREMARK CORP CVS Cons umer Stap les $42,080 $7,869 45.24 19 13 53%BRISTOL-MYERS SQUIBB CO BMY Heal th Care $46,090 $7,598 53.08 17 13 49%FREEPORT-MCMORAN COP&FCX Materials $44,810 $7,364 48.32 24 15 43%MEDTRONIC INC MDT Heal th Care $37,480 $7,337 31.66 17 14 44%TEXAS INSTRUMENTS INC TXN Information Techno$33,570 $7,064 13.98 20 12 50%EBAY INC EBAY Information Techno$33,660 $6,947 42.73 20 17 41%WALGREEN CO WAG Cons umer Stap les $33,120 $6,615 17.67 19 17 47%HUMANA INC HUM Heal th Care $9,470 $6,033 37.00 17 13 57%COMPUTER SCI ENCES CORPCSC Information Techno$7,620 $5,659 38.19 20 13 60%GENERAL DYNAMICS CORP GD Industrials $24,280 $5,582 89.72 20 13 52%
< sector
Source: HOLT ValueSearch ®, Factset, Lion Shares data. Universe: USA (ex financials, REITs, Insurance). Cash Surplus > $200M. Companies with positive % to best, Economic P/E below sector average and total known shareholder mix is greater than 40% value, and yield index. Cash surplus = HOLT cash flows less fixed charges + short term balance sheet liquidity. Top 25 companies shown ranked by cash surplus in descending order. Data Date: August, 2010.
HOLT
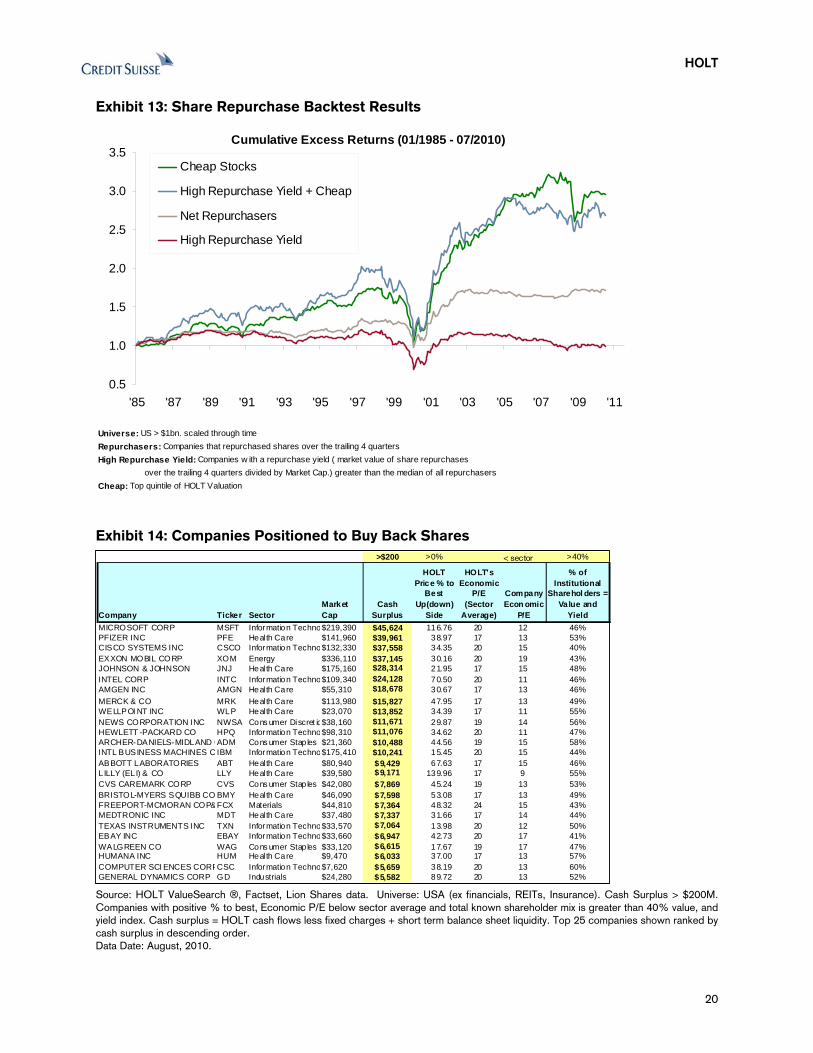
APPENDIX B: Case Study - SBUX SBUX is a classic example in HOLT of the corporate life cycle - profitable growth, eventual over-
expansion, and fiscal retrenchment in the face of diminishing growth opportunities. Since the
company’s IPO in 1992, Starbucks grew retail store base from under 200 to around 6,400 stores
globally by 2004. As the company improved its scale, profitability increased (measured by CFROI
levels) in excess of market expectations, and shares went on a tear through the ‘90s and early
2000s.
Exhibit 16: Starbucks (SBUX) in HOLT
Overinvesting in less profitable ventures
High growth combined with
increasing CFROI Capital Discipline
Source: HOLT ValueSearch. Data Date: September, 2010. Starbucks is shown for illustration purposes only.
However, Starbucks reached a growth inflection point by mid 2006. Embedded in its share price
were expectations of unprecedented profitability and high growth rates. When SBUX started
growing internationally (incrementally less profitable) and diversifying away from its core business
(SBUX developed a slew of consumer products including its own record label launched in 2007),
the market realized it was only a matter of time before profitability was affected. This combined with
21
HOLT
22
continued expansion of stores in an already saturated domestic retail market signaled a real increase
in agency costs and resulted in underperformance of SBUX shares over the next two years.
It was only after founder and Chairman Howard Schultz was reinstated as CEO and set about
refocusing on the company’s core competency, that Starbucks’ share price started rebounding.
Under Schultz, management has shown greater prudence in its capital deployment strategy by
slowing down growth and shutting down underperforming stores. Furthermore, an increased focus
on marketing and branding to capitalize on its core coffee retailing business while growing its more
profitable licensing business both domestically and internationally have effectively reduced agency
costs, causing its share price to outperform since the beginning of 2009.
The initiation of a dividend in 2010 may serve as an important signal from management that it is
committed to its strategy of capital discipline, and is willing to redistribute capital in the absence of
credible growth opportunities.
HOLT
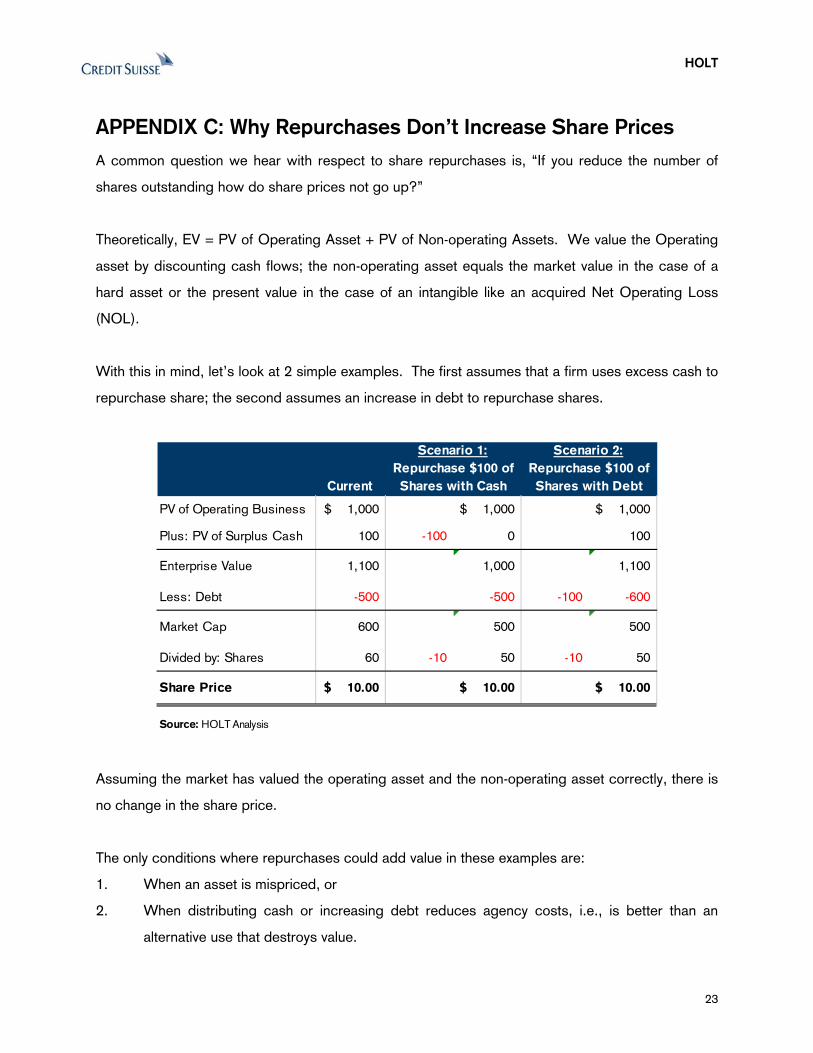
APPENDIX C: Why Repurchases Don’t Increase Share Prices A common question we hear with respect to share repurchases is, “If you reduce the number of
shares outstanding how do share prices not go up?”
Theoretically, EV = PV of Operating Asset + PV of Non-operating Assets. We value the Operating
asset by discounting cash flows; the non-operating asset equals the market value in the case of a
hard asset or the present value in the case of an intangible like an acquired Net Operating Loss
(NOL).
With this in mind, let’s look at 2 simple examples. The first assumes that a firm uses excess cash to
repurchase share; the second assumes an increase in debt to repurchase shares.
Scenario 1: Scenario 2:
Current
Repurchase $100 of
Shares with Cash
Repurchase $100 of
Shares with Debt
PV of Operating Business 1,000$ 1,000$ 1,000$
Plus: PV of Surplus Cash 100 -100
-500 -500 -100 -600
0 -10 -10
0 100
Enterprise Value 1,100 1,000 1,100
Less: Debt
Market Cap 600 500 500
Divided by: Shares 6 50 50
Share Price 10.00$ 10.00$ 10.00$
Source: HOLT Analysis
Assuming the market has valued the operating asset and the non-operating asset correctly, there is
no change in the share price.
The only conditions where repurchases could add value in these examples are:
1. When an asset is mispriced, or
2. When distributing cash or increasing debt reduces agency costs, i.e., is better than an
alternative use that destroys value.
23
HOLT
24
APPENDIX D: The Theory: Agency costs, Signals and Behavioral
Biases The subjects of cash, capital structure and cash usage have been well researched by academia
over the past 30 years on topics ranging from generalized theory on management motivations to
empirical studies on why managers repurchase shares. In this section, we present a brief survey of
the theories we find most relevant for investors to consider today.
Agency Theory – Why surplus cash can be too much of a good thing The Theory: The basic idea behind agency theory is that the interests of managers (the agents)
and shareholders (the owners) are not always aligned. For example, managers are often incented
to grow their companies to increase their power, increase compensation and increase the supply of
jobs for up-and-coming middle managers, despite the best interests of shareholders. This conflict,
or agency cost, can lead to overinvestment and declining profitability. According to Jensen (1986),
agency costs are most severe in companies where cash flow exceeds investment opportunities. To
constrain management and reduce agency costs, Jensen proposed the control hypothesis of debt,
which states that “debt creation, without retention of proceeds of the issues, enables managers to
effectively bond their promise to pay out future cash flows” (Ibid).
The Evidence: Jensen found that most leverage-increasing transactions resulted in significant
share appreciation (2-day performance of 2.2% up to 21.9% for leveraged repurchases); while
most leverage-reducing transactions resulted in share declines (-0.4% to -9.9% for common for
debt). More specifically, Jensen found that “the magnitudes of value changes [in shares] are
positively related to the change in the tightness of the commitment bonding the payment of future
cash flows,” or more simply, the stronger and more explicit management’s commitment to reducing
agency costs, the bigger and more persistent the impact on shares (Ibid).
Key Implications:
1. Agency costs are highest when:
i. Firms have lots of cash to burn,
ii. Reinvestment opportunities are low, or
iii. Management / investor alignment is low.
HOLT
25
2. Announcements of cash distributions will have the biggest impact when there is an
unexpected change in cash policy.
3. Aside from distressed situations, debt repayment is a bad thing when agency costs are high.
4. If we define agency costs as the difference between the potential reinvestment rate of
surplus cash and the actual reinvestment rate of profitable projects, then (in the absence of
competition and secular decline) the market’s implied fade rate will equal the “perceived”
agency cost.
Assymetric Information/Signaling Hypothesis The Theory: The information/signaling hypothesis is based on the idea that firms have asymmetric
information about their businesses and prospects that is unknown / unrecognized by the market.
According to the theory, management will use cash in different ways to convey to the market
information about future business prospects. Per signaling theory, surplus cash has strategic value
because it allows firms to invest in positive NPV projects that managers might otherwise forego;
share repurchases signal impending earnings improvement not yet reflected in shares; and dividend
programs signal slowing growth prospects.
The Evidence: Studies on share repurchases do not support asymmetric information/signaling
theory in the conventional sense. Numerous studies (Chou and Lin (2004), Grullon and Michaely
(2002)) confirm a short-run impact of about 2%-3% upon announcement of open-market share
repurchases. However, Grullon and Michaely (2002) found that the long-run abnormal stock
returns observed by Ikenberry, et.al (1995) following open-market share repurchase
announcements (12.1% average abnormal returns over the four years following a repurchase
announcement) do not come from impending improvement in earnings and profits, but rather from a
demonstrated commitment to reducing agency costs. They found that together with reductions in
capital expenditures and R&D, repurchasing firms experience a significant reduction in their cost of
capital over a number of years following an announcement; and attribute the underreaction
phenomenon observed by Ikenberry, et.al. (Ibid) to the slow process of reducing perceived agency
risks.
HOLT
26
Key Implications:
Assuming shares are fairly valued, cash distributions will have the most positive impact on shares
when:
1. The market believes agency costs are high,
2. Management’s commitment to reducing agency costs is understood and trusted by the
market,
3. Otherwise, cash distributions are simply a return of capital (see Appendix D for why
repurchases do not create value),
4. Communication and management / investor alignment are key. Huang and Thakor (2010)
note the potential use of repurchases to force alignment by buying out dissident
shareholders,
5. Cash distributions are not a valuation catalyst per se, but one step towards reducing
perceived agency costs.
Behavioral Corporate Finance – Why stock options may not prevent agency problems
The Theory: Behavioral corporate finance considers corporate actions in light of potential investor
and manager biases. As pointed out by Baker, Ruback and Wurgler (2004) the literature on
behavioral corporate finance breaks into two general approaches. The first approach considers the
effect of irrational investor behavior on corporate actions; the second approach considers corporate
actions in light of irrational managerial behavior.
Under the irrational investors approach, market mispricing can persist and managers must balance
three conflicting goals: (1) maximizing long-term fundamental value; (2) while “catering” to short-
term investor demands in order to keep their jobs; and (3) exploiting current stock mispricing for the
benefit of existing, long-run investors.
Under the irrational managers approach, markets are rational while managers suffer from “positive
illusions of optimism and overconfidence” about their firm’s assets and investment opportunities.
The irrational manager approach is consistent with agency theory as overconfident managers will
tend to overinvest surplus cash.
HOLT
27
The Evidence:
Ample studies support both of the approaches above. There are too many interesting findings to list,
however, Baker, et.al. (2004) provides a very good review of relevant papers. For the purposes of
this report, we list a few key findings below:
• Exploiting mispricing: CFOs cite undervaluation as a key motivation for share repurchases,
and overvaluation as a key motivation for share issuances.
• Catering: Several studies support the catering view that companies adjust dividend policy to
suit current market tastes, i.e., firms initiate dividends when shares of dividend payers trade
at a premium, and cut dividends when payers trade at a discount (Baker and Wurgler 2004).
• Overconfidence: In a survey conducted by John Graham of Duke University, two-thirds of
CFOs surveyed stated their stock is undervalued, while only three percent state that their
stock is overvalued.
• Overconfidence: Optimistic CEOs complete more mergers, especially diversifying mergers
(Malmendier and Tate, 2005).
Why do agency costs exist when managers are compensated with stock and options? Because of
overconfidence according to the findings of Malmendier and Tate (2005). Consistent with agency
theory, they find that managers with significant financial exposure to company-specific risk tend to
overinvest when internal funds are abundant, but refrain from investing when external funds are
required.
HOLT
APPENDIX E: Agency Cost Derivation
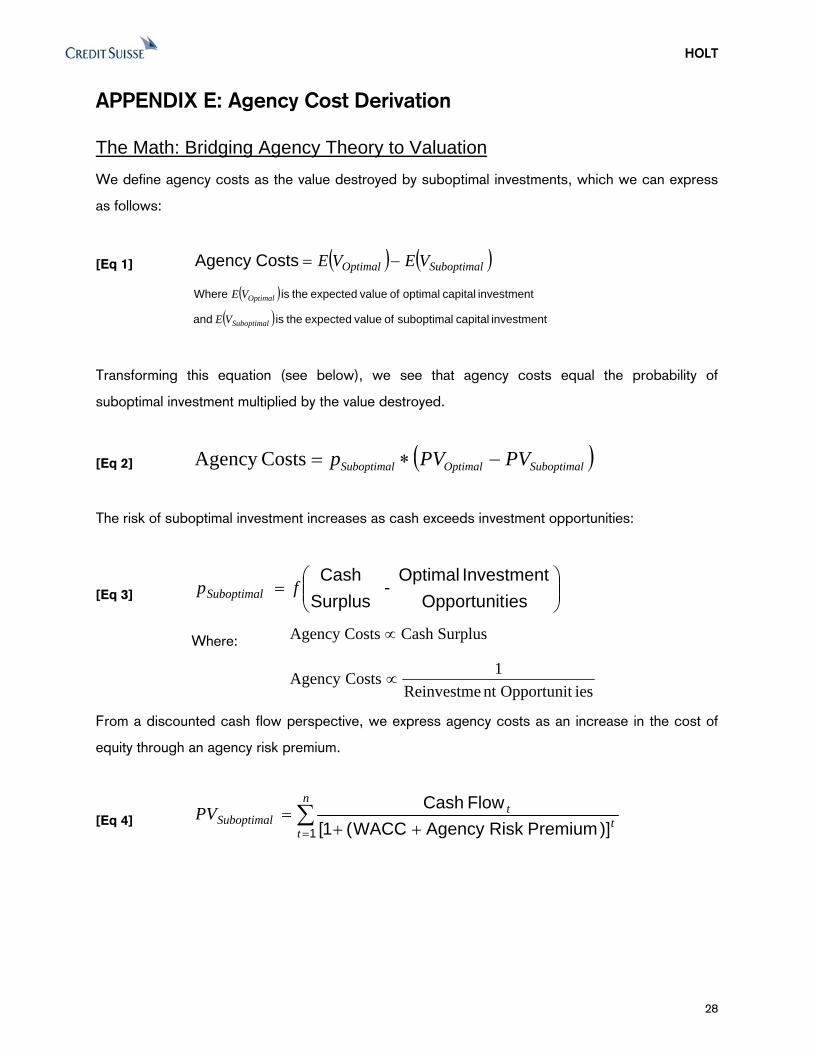
The Math: Bridging Agency Theory to Valuation We define agency costs as the value destroyed by suboptimal investments, which we can express
as follows:
[Eq 1] ( ) ( )SuboptimalOptimal VEVE CostsAgency −=
( )( ) investment capital suboptimal of value expected the is and
investment capital optimal of value expected the is Where
Suboptimal
Optimal
VE
VE
Transforming this equation (see below), we see that agency costs equal the probability of
suboptimal investment multiplied by the value destroyed.
[Eq 2] ( )SuboptimalOptimalSuboptimal PVPVp −∗=CostsAgency
The risk of suboptimal investment increases as cash exceeds investment opportunities:
[Eq 3] ⎟⎟⎠
⎞⎜⎜⎝
⎛=
iesOpportunitInvestment Optimal
- SurplusCash
fpSuboptimal
Where: SurplusCash CostsAgency ∝
iesOpportunitnt Reinvestme1CostsAgency ∝
From a discounted cash flow perspective, we express agency costs as an increase in the cost of
equity through an agency risk premium.
[Eq 4] ∑= ++
=n
tt
tSuboptimalPV
1 )]Premium RiskAgency WACC(1[Flow Cash
28

HOLT
Derivation of Equation 2
Let: VOptimal = E(VOnly optimal Investments) VSuboptimal = E( VOnly optimal Investments ) + E( VOnly Suboptimal Investments ) Where: 1) E ( VOnly optimal Investments ) = POptimal*PVOptimal 2) E ( VOnly Suboptimal Investments ) = POnly Suboptimal*PVOnly Suboptimal 3) E ( VOnly optimal Investments ) > E ( VOnly Suboptimal Investments ) 4) 1 = POptimal + POnly Suboptimal Such That: Vwarranted = POptimal*PVOptimal + POnly suboptimal*PVOnly Suboptimal When POptimal = 1, Vwarranted = PVOptimal When POnly Suboptimal = 1, Vwarranted = PVOnly Suboptimal Agency Cost = PVOptimal - Vwarranted
= PVOptima l- (POptimal*PVOptimal + POnly Suboptimal*PVOnly Suboptimal)
= PVOptimal - ((1-POnly Suboptimal)*PVOptimal + POnly Suboptimal*PVOnly Suboptimal)
= PVOptima l - PVOptimal + POnly Suboptimal* PVOptimal – POnly Suboptimal*PVOnly Suboptimal
= POnly Suboptimal*( PVOptimal - PVOnly Suboptimal)
29
HOLT
30
APPENDIX F: Bibliography
Baker, Malcolm, Richard Ruback and Jeffrey Wurgler. 2004. “Behavioral Corporate Finance: A Survey.” (October). Baker, George P., Michael Jensen and Kevin Murphy. 1988. “Compensation and Incentives: Practice vs. Theory.” The Journal of Finance, vol. 43, no.3 (July): 593-616. Comment, Robert and Gregg A. Jarrell. 1991. “The Relative Signaling Power of Dutch-Auction and Fixed-Price Self-Tender Offers and Open-Market Share Repurchases.” The Journal of Finance, vol. 46, no. 4 (September): 1243-1272. Chou Ray Yeutien. 1988. “Volatility Persistence and Stock Valuations: Some Empirical Evidence Using Garch.” Journal of Applied Econometrics, vol. 3, issue 4 (Oct.-Dec): 279-294. Chou, De-Wai, and J.R. Lin. 2004. “False Signals from Open-Market Stock Repurchase Announcements: Evidence from Earnings Management and Analyst’ Forecast Revisions.” (January). Griffen and Ning Zhu. 2009. “Accounting Rules? Stock Buybacks and Stock Options: Addiotnal Evidcne. (March) Grullon, Gustavo, and Roni Michaely. 2002. “The Information Content of Share Repurchase Programs.” (November). Huang, Sheng, and Anjan Thakor. 2010. “Investor Heterogeneity, Investor-Management Agreement and Open-Market Share Repurchases.” (February). Ikenberry, David, Josef Lakonishok and Theo Vermaelen. 1995. “Market Underreaction to Open Market Share Repurchases.” Journal of Financial Economics 39 (October, November): 181-208. Jensen, Michael. 1986. “Agency Costs of Free Cash Flow, Corporate Finance, and Takeovers.” American Economic Review, vol. 76, no. 2 (May): 323-329. Malmendier, Ulrike, and Geoffrey Tate. 2005. “Does Overconfidence Affect Corporate Investment? CEO Overconfidence Measures Reivisited.” European Financial Management, vol. 11, no. 5: 649-659. Myers, Stewart, and Nicholas Majluf. 1983. “Corporate Financing and Investment Decisions When Firms have Information That Investors Do Not Have.” (December). Pinkowitz, Lee, and Rohan Williamson. 2002. “What is a Dollar Worth? The Market Value of Cash Holdings.” (October).
HOLT
Disclosure and Notice
This material has been prepared by individual traders or sales personnel of Credit Suisse Securities (USA) LLC ("Credit Suisse") and not by the Credit Suisse research department. It is provided for informational purposes, is intended for your use only and does not constitute an invitation or offer to subscribe for or purchase any of the products or services mentioned. It is intended only to provide observations and views of individual traders or sales personnel, which may be different from, or inconsistent with, the observations and views of Credit Suisse research department analysts, other Credit Suisse traders or sales personnel, or the proprietary positions of Credit Suisse. Observations and views expressed herein may be changed by the trader or sales personnel at any time without prior notice. Past performance should not be taken as an indication or guarantee of future performance, and no representation or warranty, expressed or implied is made regarding future performance. The information set forth above has been obtained from or based upon sources believed to be reliable, but Credit Suisse does not represent or warrant its accuracy or completeness and is not responsible for losses or damages arising out of errors, omissions or changes in market factors. This material does not purport to contain all of the information that an interested party may desire and, in fact, may provides only a limited view of a particular security or market. Credit Suisse may participate or invest in transactions with issuers of securities that participate in the markets referred to herein, perform services for or solicit business from such issuers, and/or have a position or effect transactions in the securities or derivatives thereof. Also, Credit Suisse may have accumulated, be in the process of accumulating or accumulate long or short positions in the subject security or related securities. This material does not constitute objective research under FSA rules. To obtain a copy of the most recent Credit Suisse research on any company mentioned please contact your sales representative or go to http://www.credit-suisse.com/researchandanalytics. FOR IMPORTANT DISCLOSURES on companies covered in Credit Suisse Investment Banking Division research reports, please see www.credit-suisse.com/researchdisclosures. Backtested, hypothetical or simulated performance results have inherent limitations. Simulated results are achieved by the retroactive application of a backtested model itself designed with the benefit of hindsight. The backtesting of performance differs from the actual account performance because the investment strategy may be adjusted at any time, for any reason and can continue to be changed until desired or better performance results are achieved. Alternative modeling techniques or assumptions might produce significantly different results and prove to be more appropriate. Past hypothetical backtest results are neither an indicator nor a guarantee of future returns. Actual results will vary from the analysis. The HOLT methodology does not assign ratings to a security. It is an analytical tool that involves use of a set of proprietary quantitative algorithms and warranted value calculations, collectively called the HOLT valuation model, that are consistently applied to all the companies included in its database. Third-party data (including consensus earnings estimates) are systematically translated into a number of default variables and incorporated into the algorithms available in the HOLT valuation model. The source financial statement, pricing, and earnings data provided by outside data vendors are subject to quality control and may also be adjusted to more closely measure the underlying economics of firm performance. These adjustments provide consistency when analyzing a single company across time, or analyzing multiple companies across industries or national borders. The default scenario that is produced by the Credit Suisse HOLT valuation model establishes the baseline valuation for a security, and a user then may adjust the default variables to produce alternative scenarios, any of which could occur. The HOLT methodology does not assign a price target to a security. The default scenario that is produced by the HOLT valuation model establishes a warranted price for a security, and as the third-party data are updated, the warranted price may also change. The default variables may also be adjusted to produce alternative warranted prices, any of which could occur. Additional information about the HOLT methodology is available on request. CFROI, CFROE, HOLT, HOLTfolio, HOLTSelect, HS60, HS40, ValueSearch, AggreGator, Signal Flag and “Powered by HOLT” are trademarks or registered trademarks of Credit Suisse Group AG or its affiliates in the United States and other countries. HOLT is a corporate performance and valuation advisory service of Credit Suisse © 2010 Credit Suisse Group AG and its subsidiaries and affiliates. All rights reserved January 29, 2010
31