Embed Size (px)
Citation preview
MakeMyTrip Limited (NASDAQ: MMYT)Investor Presentation
June 2021
2
Safe Harbour
This presentation contains certain statements concerning MakeMyTrip’s (MMYT) future growth prospects and forward-looking statements, as defined in the
safe harbor provisions of the U.S. Private Securities Litigation Reform Act of 1995. These forward-looking statements are based on the MMYT’s current
expectations, assumptions, estimates and projections about MMYT and its industry. These forward-looking statements are subject to various risks and
uncertainties. Generally, these forward-looking statements can be identified by the use of forward-looking terminology such as "anticipate", "believe",
"estimate", "expect", "intend", "will", "project", "seek", "should" and similar expressions. Such statements include, among other things, quotations from
management as well as MMYT’s strategic and operational plans. Forward-looking statements involve inherent risks and uncertainties. A number of important
factors could cause actual results to differ materially from those contained in any forward-looking statement. Potential risks and uncertainties include, but are
not limited to, a slow-down of economic growth in India and the global economic downturn, general declines or disruptions in the travel industry, volatility in
the trading price of MMYT’s shares, MMYT’s reliance on its relationships with travel suppliers and strategic alliances, failure to further increase MMYT’s brand
recognition to obtain new business partners and consumers, failure to compete against new and existing competitors, failure to successfully manage current
growth and potential future growth, risks associated with any strategic investments or acquisitions, seasonality in the travel industry in India and
overseas, failure to successfully develop MMYT’s corporate travel business, damage to or failure of MMYT's infrastructure and technology, loss of services of
MMYT's key executives, and inflation in India and in other countries. In addition to the foregoing factors, a description of certain other risks and uncertainties
which may cause actual results to differ materially can be found in the “Risk Factors” section of MMYT's 20-F dated August 17, 2020 filed with the U.S.
Securities Exchange Commission (“SEC”), copies of which are available from the SEC, our website or our Investor Relations department. COVID-19, and the
volatile regional and global economic conditions stemming from it, and additional or unforeseen effects from the COVID-19 pandemic, could also continue to
give rise to or aggravate these risk factors, which in turn could continue to materially adversely affect our business, financial condition, liquidity, results of
operations (including revenues and profitability) and/or stock price. Further, COVID-19 may also affect our operating and financial results in a manner that is
not presently known to us or that we currently do not consider to present significant risks to our operations. All information provided in this presentation is
provided as of the date of issuance of this presentation, and MMYT does not undertake any obligation to update any forward-looking statement, except as
required under applicable law.
We cannot assure you that the assumptions made in preparing any of the forward-looking statements will prove accurate or that any projections will be
realized. We expect that there will be differences between projected and actual results. The forward-looking statements made in this presentation relate only
to events or information as of the date on which the statements are made in this presentation. Our actual results, performance, or achievement may differ
materially from those expressed in, or implied by, these forward-looking statements. Accordingly, we can give no assurances that any of the events
anticipated by these forward-looking statements will transpire or occur or, if any of the foregoing factors or other risks and uncertainties described elsewhere
in this presentation were to occur, what impact they would have on these forward-looking statements, including our results of operations or financial
condition. In view of these uncertainties, you are cautioned not to place undue reliance on these forward-looking statements. All forward-looking statements
attributable to us are expressly qualified in their entirety by the cautionary statements contained herein and in our future annual and quarterly reports as filed
with the SEC.
3
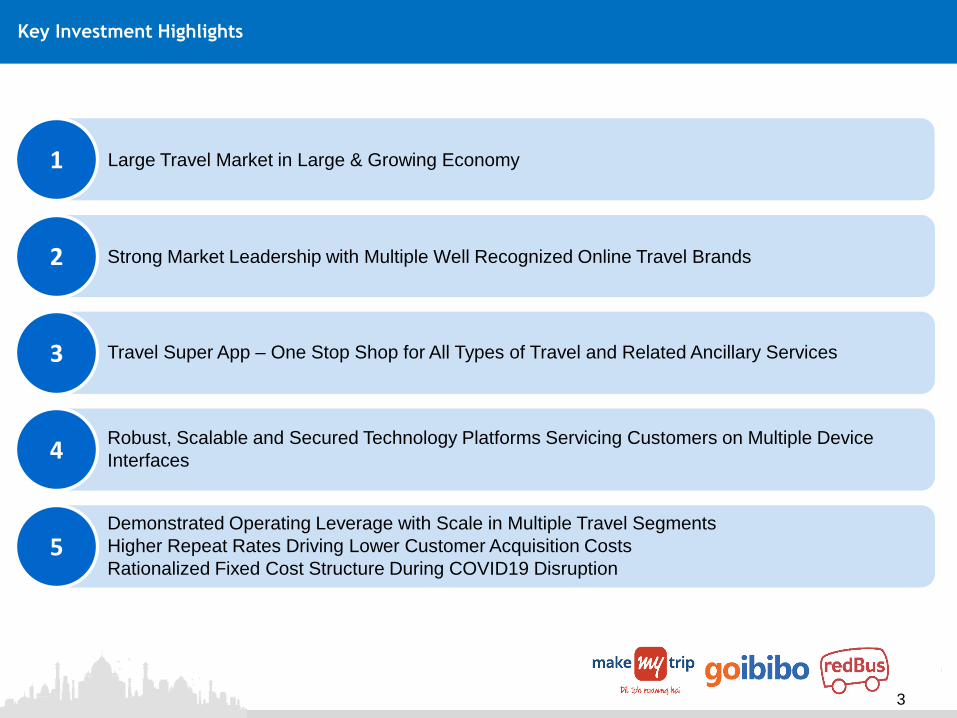
Key Investment Highlights
Large Travel Market in Large & Growing Economy
Strong Market Leadership with Multiple Well Recognized Online Travel Brands
Travel Super App – One Stop Shop for All Types of Travel and Related Ancillary Services
Robust, Scalable and Secured Technology Platforms Servicing Customers on Multiple Device
Interfaces
Demonstrated Operating Leverage with Scale in Multiple Travel Segments
Higher Repeat Rates Driving Lower Customer Acquisition Costs
Rationalized Fixed Cost Structure During COVID19 Disruption
1
2
3
5
4
4
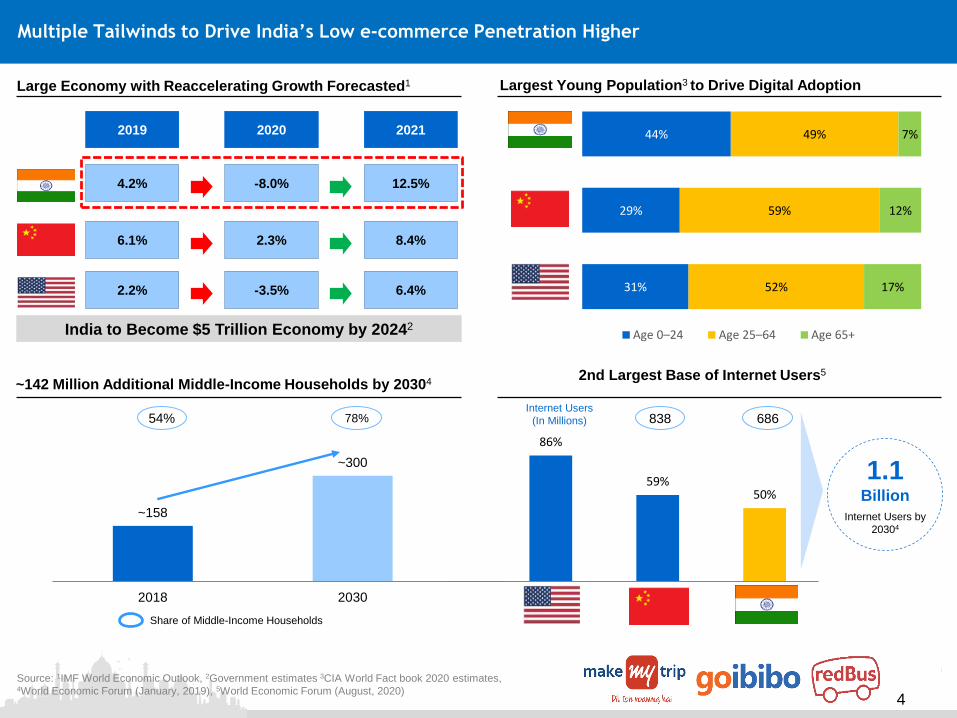
Large Economy with Reaccelerating Growth Forecasted1
44%
29%
31%
49%
59%
52%
7%
12%
17%
Age 0–24 Age 25–64 Age 65+
Largest Young Population3 to Drive Digital Adoption
~158
~300
2018 2030
86%
59%50%
US China India
Multiple Tailwinds to Drive India’s Low e-commerce Penetration Higher
India to Become $5 Trillion Economy by 20242
4.2% -8.0% 12.5%
6.1% 2.3% 8.4%
2.2% -3.5% 6.4%
2019 2020 2021
Share of Middle-Income Households
838 686
1.1 Billion
Internet Users by
20304
54% 78%
~142 Million Additional Middle-Income Households by 203042nd Largest Base of Internet Users5
Source: 1IMF World Economic Outlook, 2Government estimates 3CIA World Fact book 2020 estimates, 4World Economic Forum (January, 2019), 5World Economic Forum (August, 2020)
Internet Users
(In Millions)
5
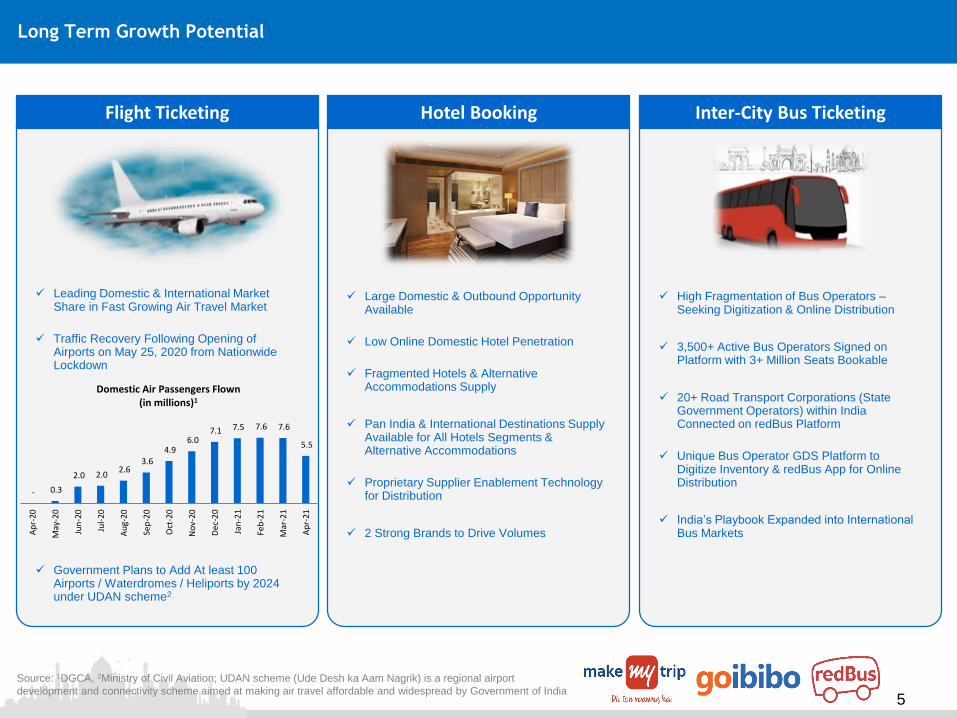
Long Term Growth Potential
Source: 1DGCA, 2Ministry of Civil Aviation; UDAN scheme (Ude Desh ka Aam Nagrik) is a regional airport
development and connectivity scheme aimed at making air travel affordable and widespread by Government of India
Inter-City Bus TicketingHotel BookingFlight Ticketing
Leading Domestic & International Market Share in Fast Growing Air Travel Market
Traffic Recovery Following Opening of Airports on May 25, 2020 from Nationwide Lockdown
Government Plans to Add At least 100 Airports / Waterdromes / Heliports by 2024under UDAN scheme2
Large Domestic & Outbound Opportunity Available
Low Online Domestic Hotel Penetration
Fragmented Hotels & Alternative Accommodations Supply
Pan India & International Destinations Supply Available for All Hotels Segments & Alternative Accommodations
Proprietary Supplier Enablement Technology for Distribution
2 Strong Brands to Drive Volumes
High Fragmentation of Bus Operators –Seeking Digitization & Online Distribution
3,500+ Active Bus Operators Signed on Platform with 3+ Million Seats Bookable
20+ Road Transport Corporations (State Government Operators) within India Connected on redBus Platform
Unique Bus Operator GDS Platform to Digitize Inventory & redBus App for Online Distribution
India’s Playbook Expanded into International Bus Markets
- 0.3
2.0 2.0 2.6
3.6 4.9
6.0 7.1 7.5 7.6 7.6
5.5
Ap
r-20
May
-20
Jun
-20
Jul-
20
Au
g-20
Sep
-20
Oct
-20
No
v-20
Dec
-20
Jan
-21
Feb
-21
Mar
-21
Ap
r-21
Domestic Air Passengers Flown (in millions)1
6
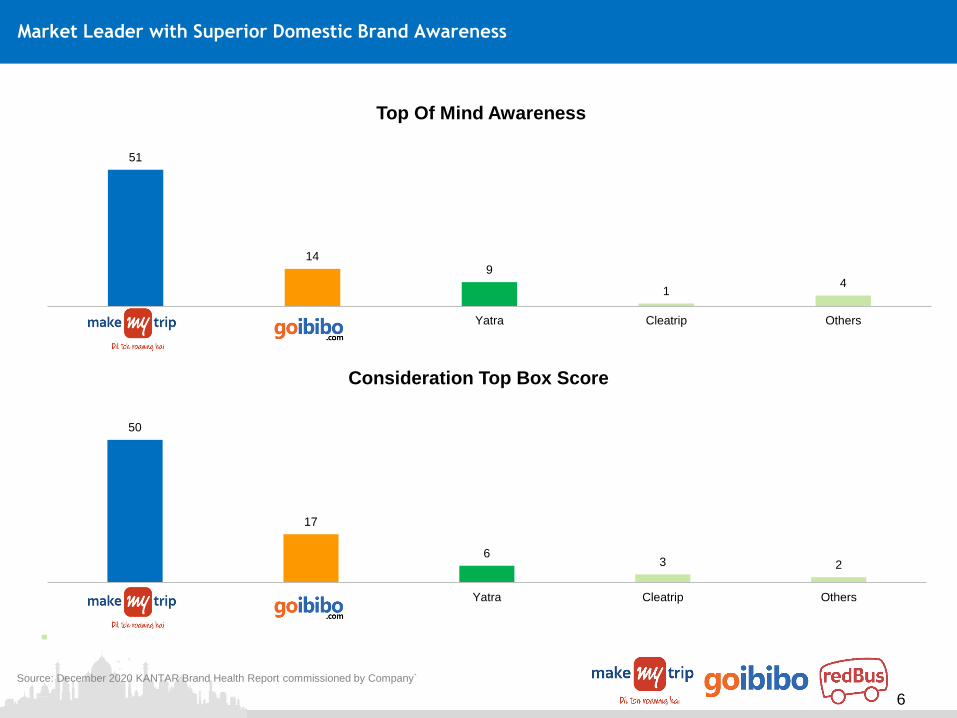
Market Leader with Superior Domestic Brand Awareness
51
149
14
MakeMyTrip gobibo Yatra Cleatrip Others
Top Of Mind Awareness
50
17
63 2
MakeMyTrip gobibo Yatra Cleatrip Others
Consideration Top Box Score
Source: December 2020 KANTAR Brand Health Report commissioned by Company`
7
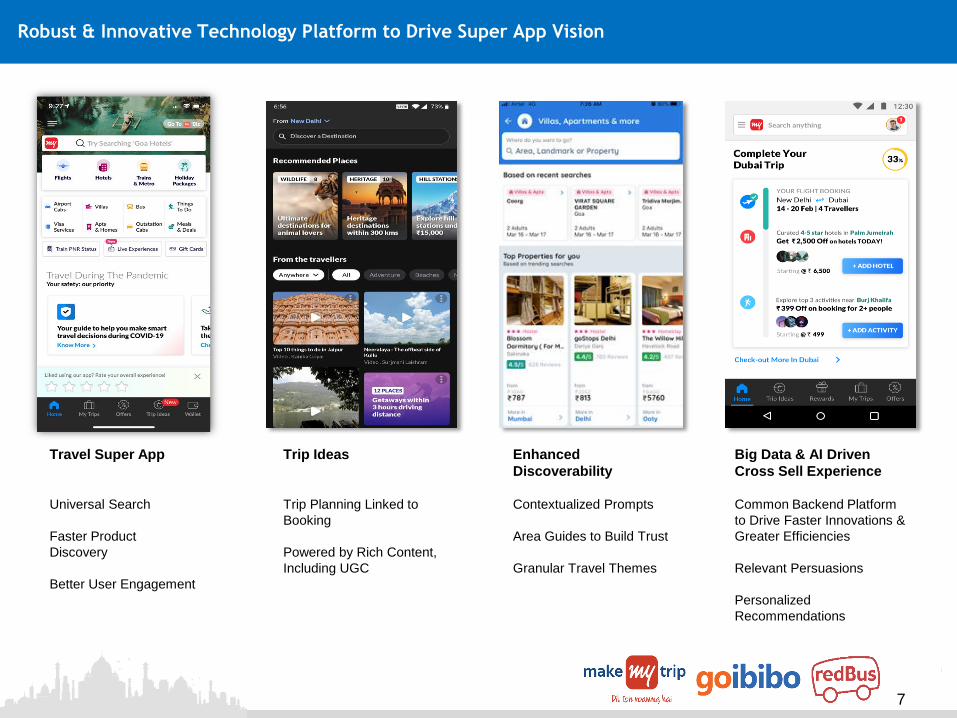
Robust & Innovative Technology Platform to Drive Super App Vision
Travel Super App
Universal Search
Faster Product
Discovery
Better User Engagement
Big Data & AI Driven
Cross Sell Experience
Common Backend Platform
to Drive Faster Innovations &
Greater Efficiencies
Relevant Persuasions
Personalized
Recommendations
Trip Ideas
Trip Planning Linked to
Booking
Powered by Rich Content,
Including UGC
Enhanced
Discoverability
Contextualized Prompts
Area Guides to Build Trust
Granular Travel Themes
8
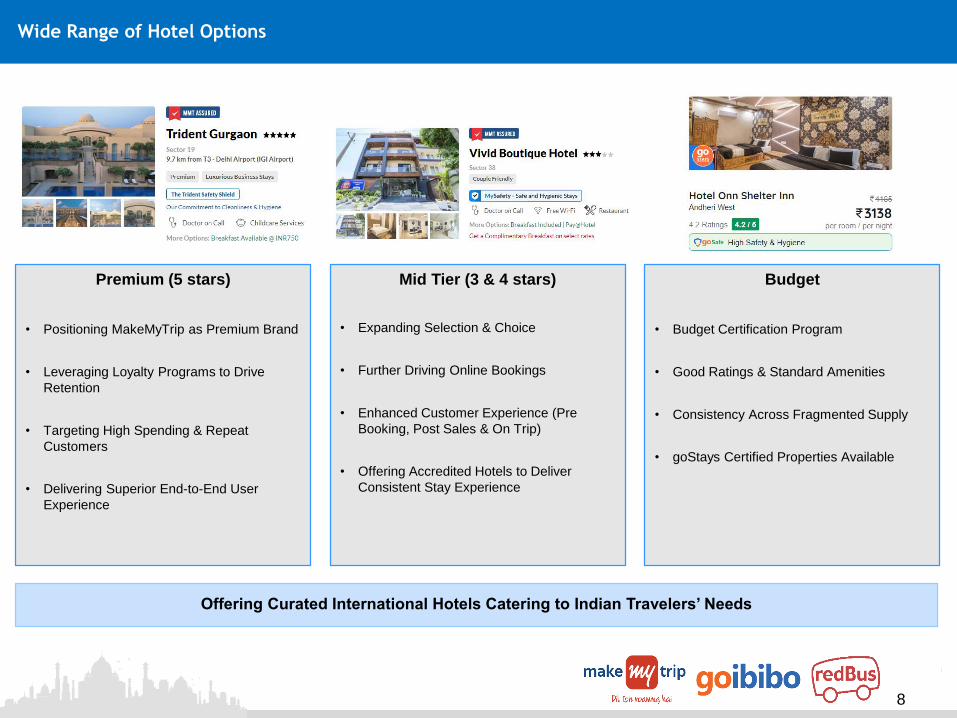
Wide Range of Hotel Options
Premium (5 stars)
• Positioning MakeMyTrip as Premium Brand
• Leveraging Loyalty Programs to Drive
Retention
• Targeting High Spending & Repeat
Customers
• Delivering Superior End-to-End User
Experience
Mid Tier (3 & 4 stars)
• Expanding Selection & Choice
• Further Driving Online Bookings
• Enhanced Customer Experience (Pre
Booking, Post Sales & On Trip)
• Offering Accredited Hotels to Deliver
Consistent Stay Experience
Budget
• Budget Certification Program
• Good Ratings & Standard Amenities
• Consistency Across Fragmented Supply
• goStays Certified Properties Available
Offering Curated International Hotels Catering to Indian Travelers’ Needs
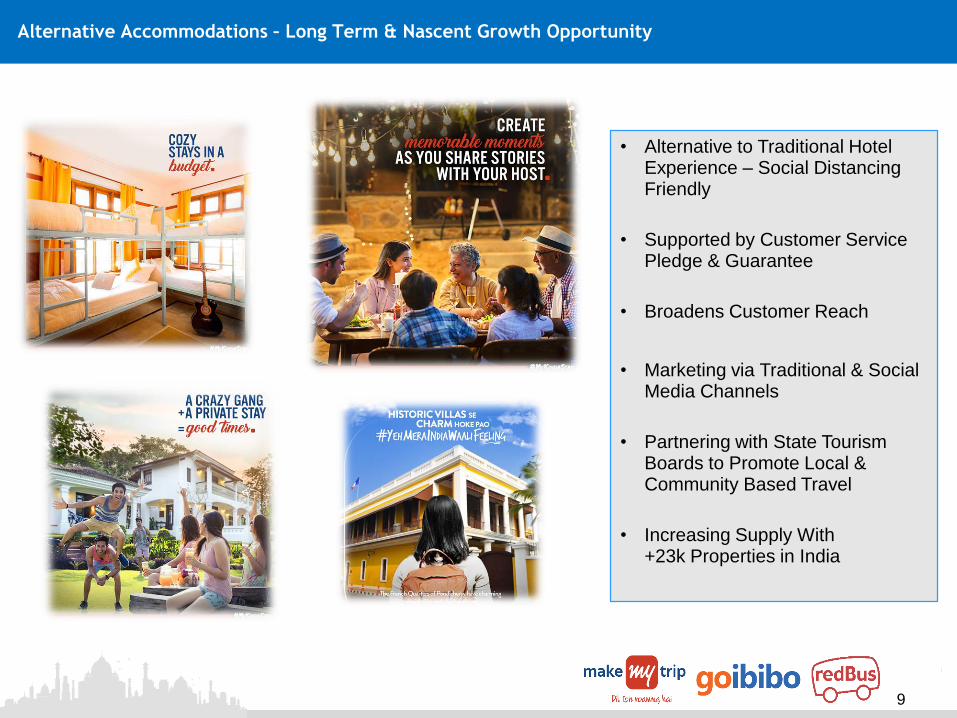
9
• Alternative to Traditional Hotel Experience – Social Distancing Friendly
• Supported by Customer Service Pledge & Guarantee
• Broadens Customer Reach
• Marketing via Traditional & Social Media Channels
• Partnering with State Tourism Boards to Promote Local & Community Based Travel
• Increasing Supply With+23k Properties in India
Alternative Accommodations – Long Term & Nascent Growth Opportunity
10
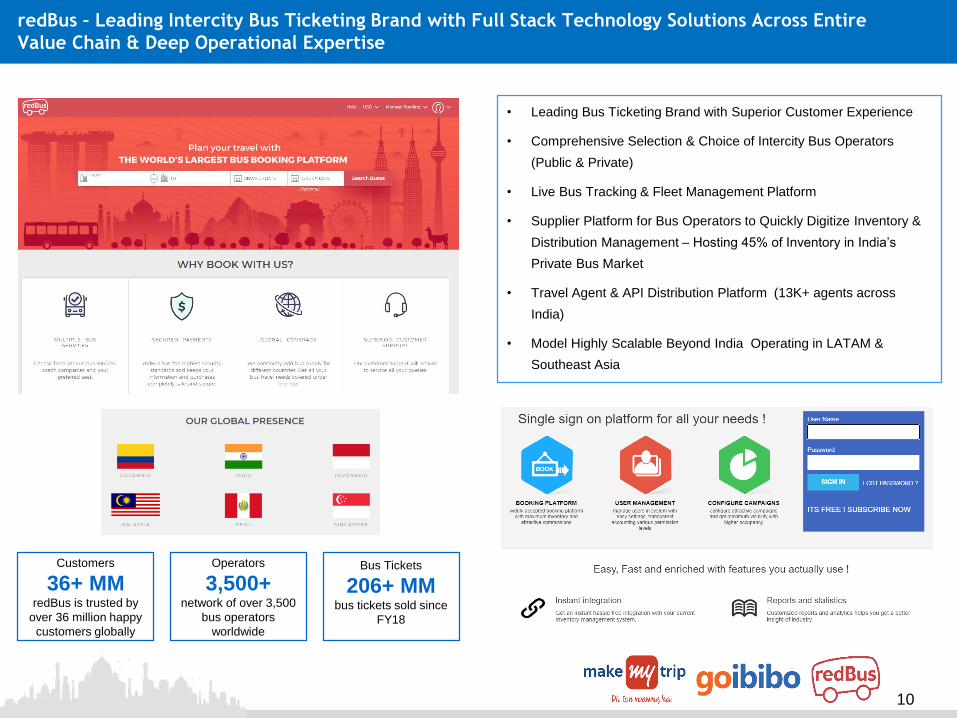
redBus – Leading Intercity Bus Ticketing Brand with Full Stack Technology Solutions Across Entire
Value Chain & Deep Operational Expertise
• Leading Bus Ticketing Brand with Superior Customer Experience
• Comprehensive Selection & Choice of Intercity Bus Operators
(Public & Private)
• Live Bus Tracking & Fleet Management Platform
• Supplier Platform for Bus Operators to Quickly Digitize Inventory &
Distribution Management – Hosting 45% of Inventory in India’s
Private Bus Market
• Travel Agent & API Distribution Platform (13K+ agents across
India)
• Model Highly Scalable Beyond India Operating in LATAM &
Southeast Asia
Customers
36+ MMredBus is trusted by
over 36 million happy
customers globally
Operators
3,500+network of over 3,500
bus operators
worldwide
Bus Tickets
206+ MMbus tickets sold since
FY18
11
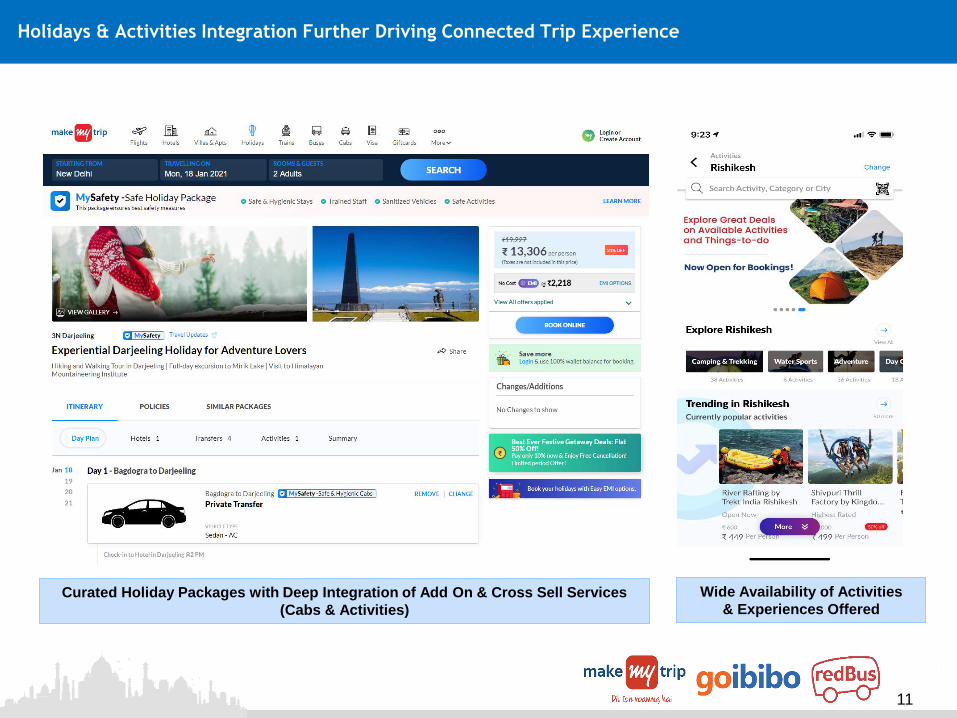
Holidays & Activities Integration Further Driving Connected Trip Experience
Curated Holiday Packages with Deep Integration of Add On & Cross Sell Services
(Cabs & Activities)
Wide Availability of Activities
& Experiences Offered
12
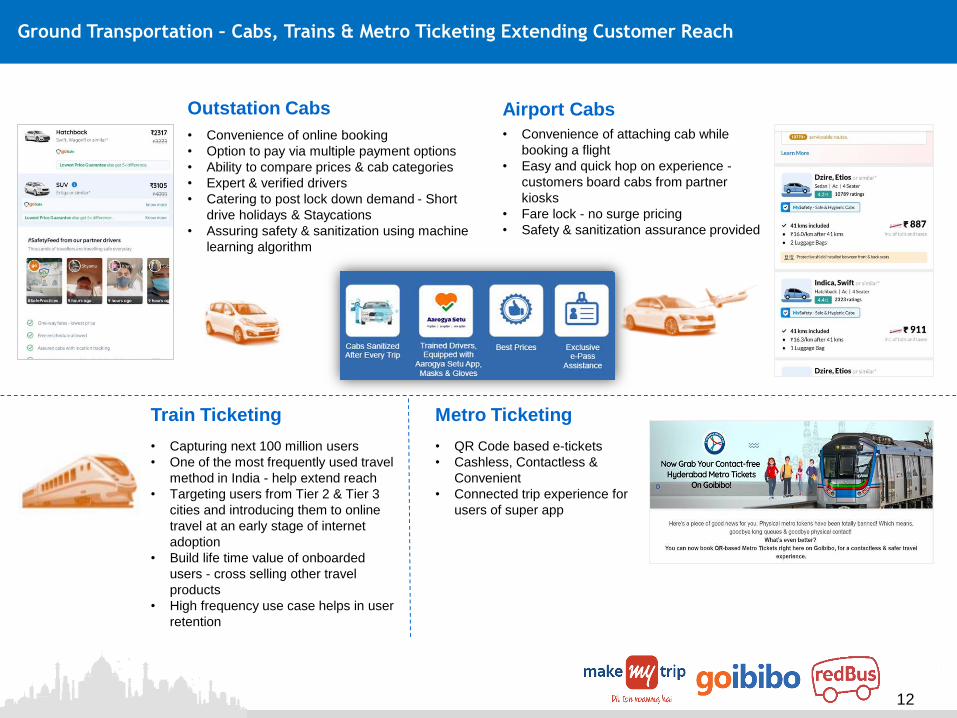
• Capturing next 100 million users
• One of the most frequently used travel
method in India - help extend reach
• Targeting users from Tier 2 & Tier 3
cities and introducing them to online
travel at an early stage of internet
adoption
• Build life time value of onboarded
users - cross selling other travel
products
• High frequency use case helps in user
retention
• Convenience of online booking
• Option to pay via multiple payment options
• Ability to compare prices & cab categories
• Expert & verified drivers
• Catering to post lock down demand - Short
drive holidays & Staycations
• Assuring safety & sanitization using machine
learning algorithm
Outstation Cabs Airport Cabs
• Convenience of attaching cab while
booking a flight
• Easy and quick hop on experience -
customers board cabs from partner
kiosks
• Fare lock - no surge pricing
• Safety & sanitization assurance provided
Metro Ticketing
• QR Code based e-tickets
• Cashless, Contactless &
Convenient
• Connected trip experience for
users of super app
Train Ticketing
Ground Transportation – Cabs, Trains & Metro Ticketing Extending Customer Reach
13
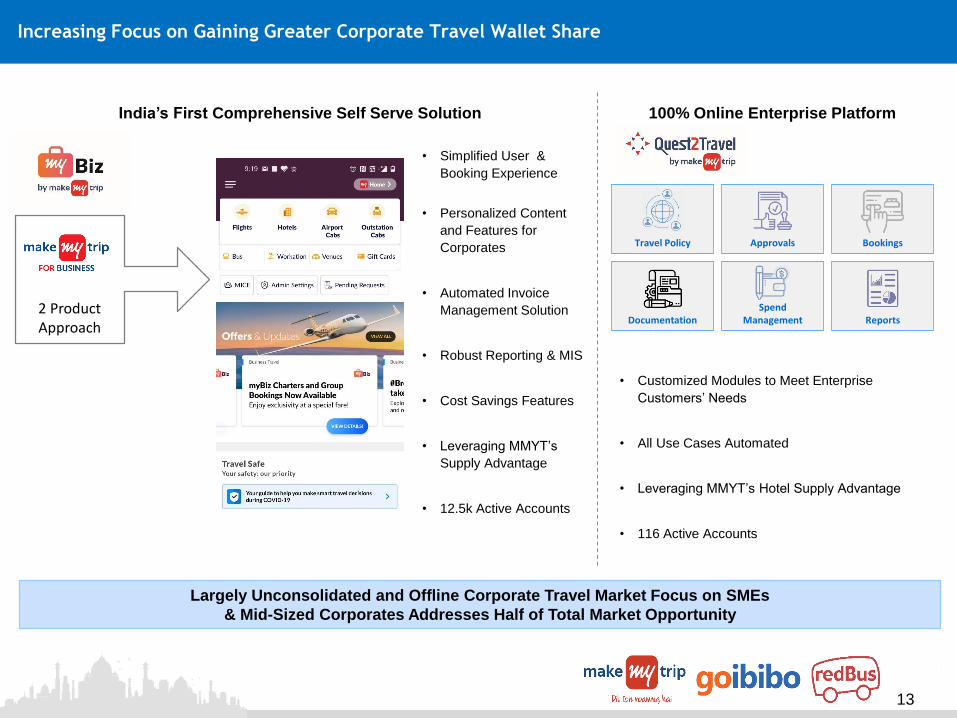
Increasing Focus on Gaining Greater Corporate Travel Wallet Share
• Customized Modules to Meet Enterprise
Customers’ Needs
• All Use Cases Automated
• Leveraging MMYT’s Hotel Supply Advantage
• 116 Active Accounts
• Simplified User &
Booking Experience
• Personalized Content
and Features for
Corporates
• Automated Invoice
Management Solution
• Robust Reporting & MIS
• Cost Savings Features
• Leveraging MMYT’s
Supply Advantage
• 12.5k Active Accounts
2 Product Approach
Largely Unconsolidated and Offline Corporate Travel Market Focus on SMEs
& Mid-Sized Corporates Addresses Half of Total Market Opportunity
100% Online Enterprise PlatformIndia’s First Comprehensive Self Serve Solution
Travel Policy BookingsApprovals
Documentation ReportsSpend
Management
14
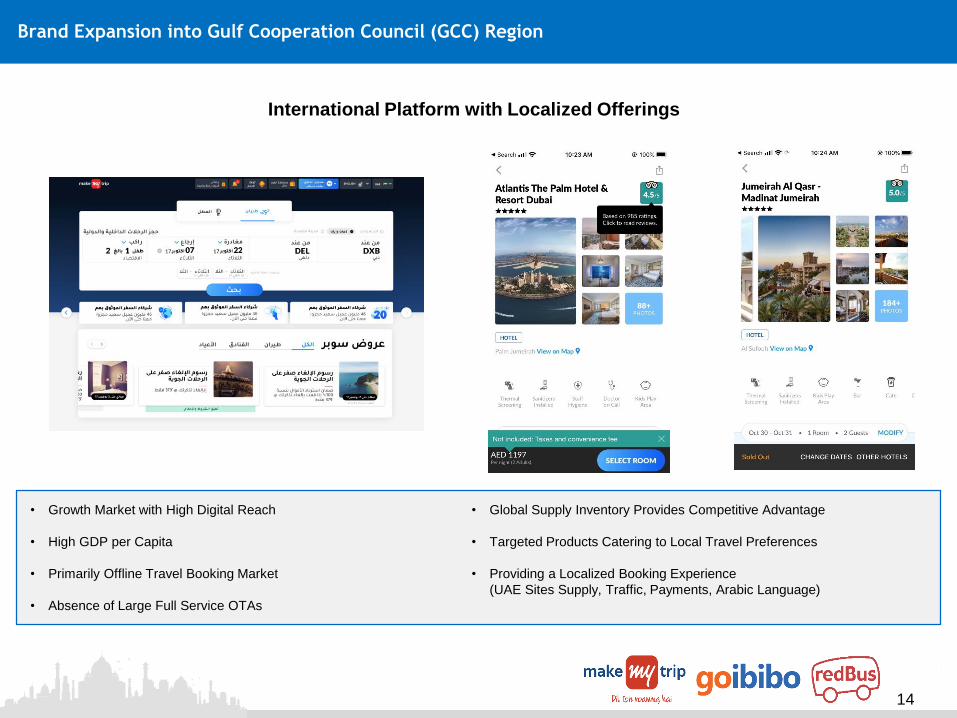
Brand Expansion into Gulf Cooperation Council (GCC) Region
• Growth Market with High Digital Reach
• High GDP per Capita
• Primarily Offline Travel Booking Market
• Absence of Large Full Service OTAs
• Global Supply Inventory Provides Competitive Advantage
• Targeted Products Catering to Local Travel Preferences
• Providing a Localized Booking Experience
(UAE Sites Supply, Traffic, Payments, Arabic Language)
International Platform with Localized Offerings
15
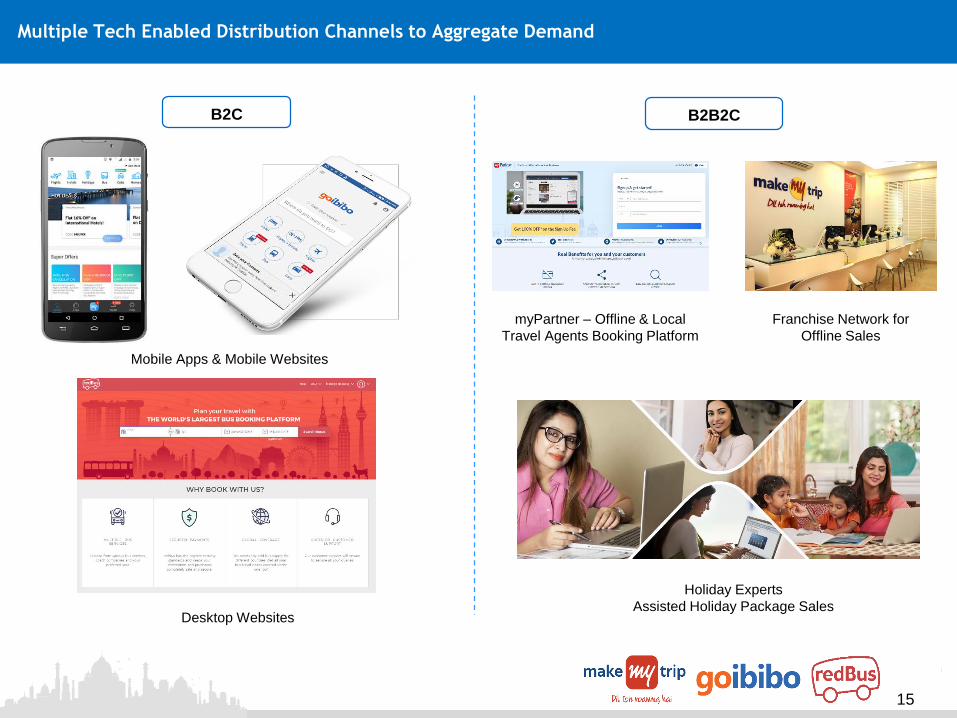
Multiple Tech Enabled Distribution Channels to Aggregate Demand
Mobile Apps & Mobile Websites
Desktop Websites
B2C B2B2C
myPartner – Offline & Local
Travel Agents Booking Platform
Franchise Network for
Offline Sales
Holiday Experts
Assisted Holiday Package Sales
16
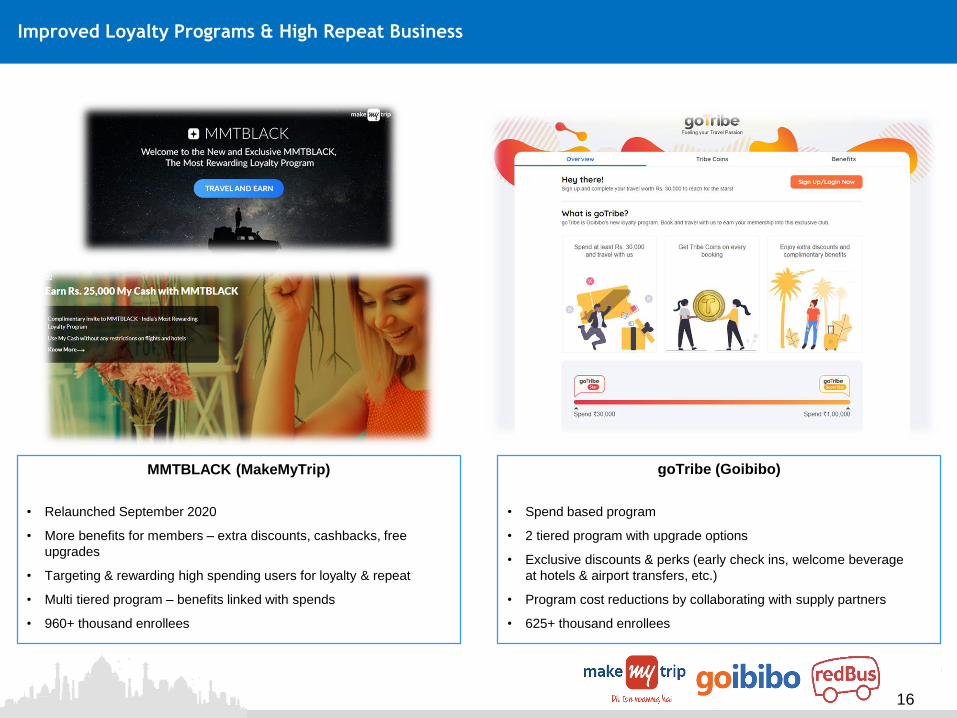
Improved Loyalty Programs & High Repeat Business
MMTBLACK (MakeMyTrip)
• Relaunched September 2020
• More benefits for members – extra discounts, cashbacks, free
upgrades
• Targeting & rewarding high spending users for loyalty & repeat
• Multi tiered program – benefits linked with spends
• 960+ thousand enrollees
goTribe (Goibibo)
• Spend based program
• 2 tiered program with upgrade options
• Exclusive discounts & perks (early check ins, welcome beverage
at hotels & airport transfers, etc.)
• Program cost reductions by collaborating with supply partners
• 625+ thousand enrollees
17
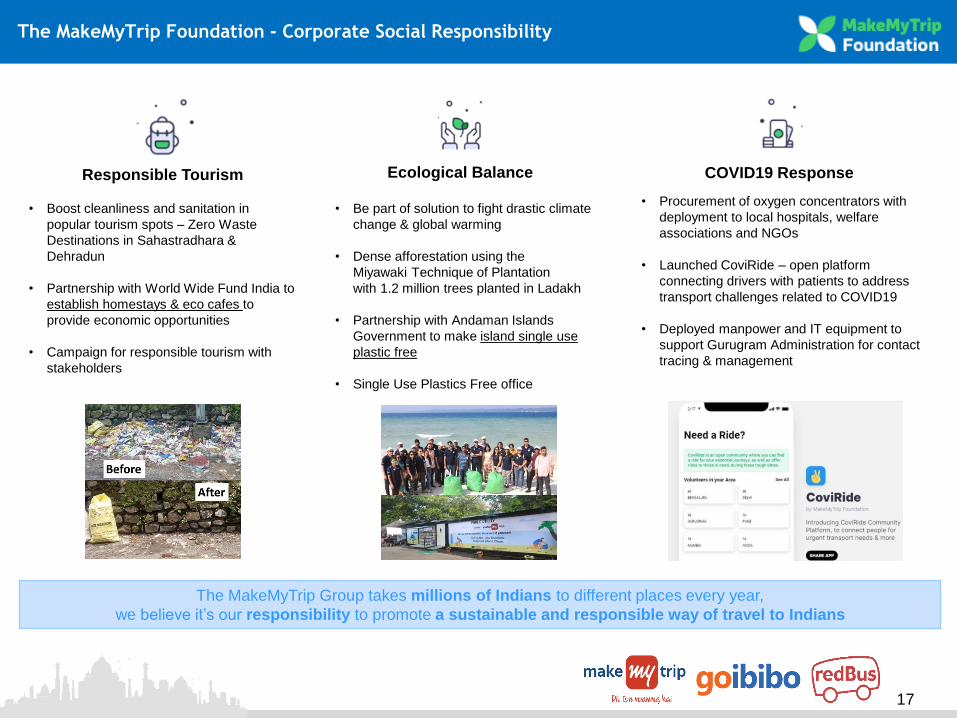
The MakeMyTrip Foundation - Corporate Social Responsibility
Ecological Balance
• Boost cleanliness and sanitation in
popular tourism spots – Zero Waste
Destinations in Sahastradhara &
Dehradun
• Partnership with World Wide Fund India to
establish homestays & eco cafes to
provide economic opportunities
• Campaign for responsible tourism with
stakeholders
• Be part of solution to fight drastic climate
change & global warming
• Dense afforestation using the
Miyawaki Technique of Plantation
with 1.2 million trees planted in Ladakh
• Partnership with Andaman Islands
Government to make island single use
plastic free
• Single Use Plastics Free office
Responsible Tourism COVID19 Response
• Procurement of oxygen concentrators with
deployment to local hospitals, welfare
associations and NGOs
• Launched CoviRide – open platform
connecting drivers with patients to address
transport challenges related to COVID19
• Deployed manpower and IT equipment to
support Gurugram Administration for contact
tracing & management
The MakeMyTrip Group takes millions of Indians to different places every year,
we believe it’s our responsibility to promote a sustainable and responsible way of travel to Indians
18
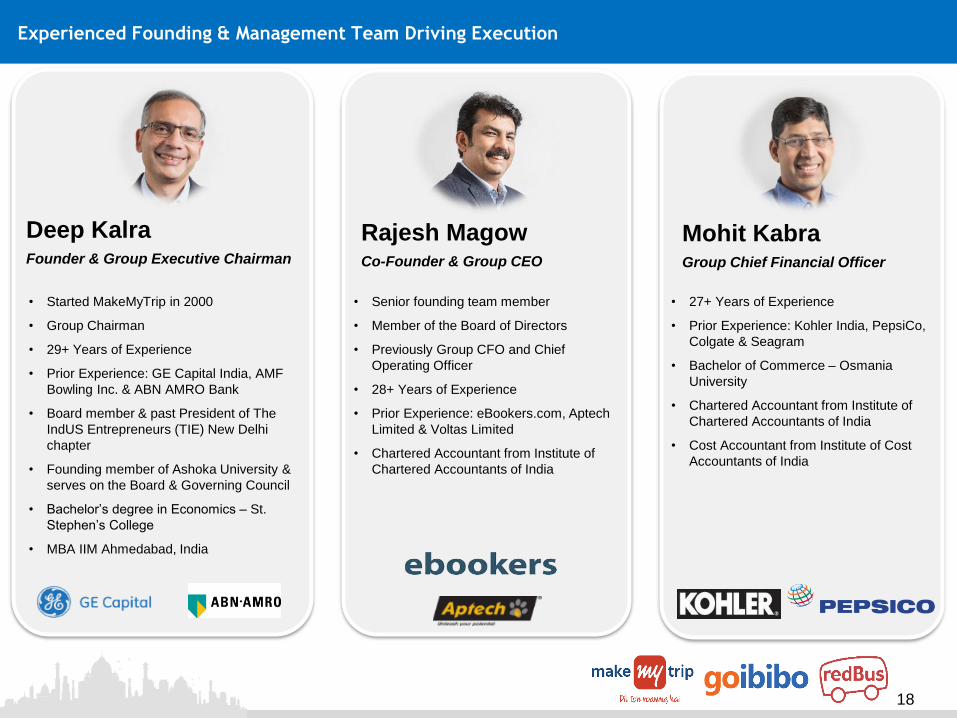
Experienced Founding & Management Team Driving Execution
Deep Kalra Founder & Group Executive Chairman
Rajesh MagowCo-Founder & Group CEO
Mohit KabraGroup Chief Financial Officer
• Started MakeMyTrip in 2000
• Group Chairman
• 29+ Years of Experience
• Prior Experience: GE Capital India, AMF
Bowling Inc. & ABN AMRO Bank
• Board member & past President of The
IndUS Entrepreneurs (TIE) New Delhi
chapter
• Founding member of Ashoka University &
serves on the Board & Governing Council
• Bachelor’s degree in Economics – St.
Stephen’s College
• MBA IIM Ahmedabad, India
• Senior founding team member
• Member of the Board of Directors
• Previously Group CFO and Chief
Operating Officer
• 28+ Years of Experience
• Prior Experience: eBookers.com, Aptech
Limited & Voltas Limited
• Chartered Accountant from Institute of
Chartered Accountants of India
• 27+ Years of Experience
• Prior Experience: Kohler India, PepsiCo,
Colgate & Seagram
• Bachelor of Commerce – Osmania
University
• Chartered Accountant from Institute of
Chartered Accountants of India
• Cost Accountant from Institute of Cost
Accountants of India

19
Financial Overview
20
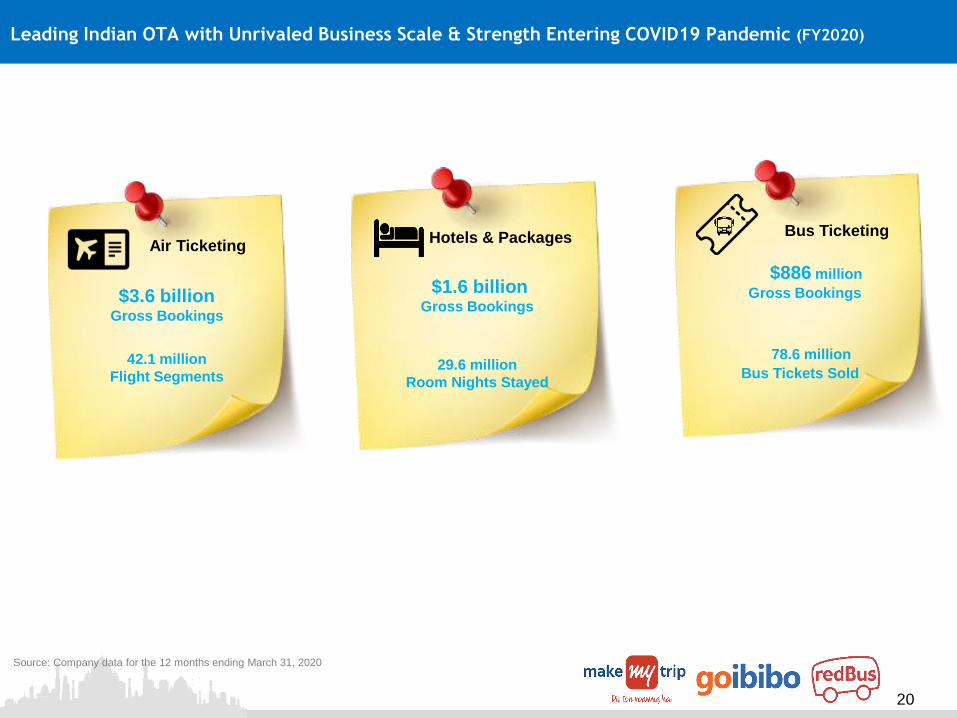
Air Ticketing
42.1 million
Flight Segments
78.6 million
Bus Tickets Sold
Hotels & Packages
29.6 million
Room Nights Stayed
Leading Indian OTA with Unrivaled Business Scale & Strength Entering COVID19 Pandemic (FY2020)
Bus Ticketing
$3.6 billionGross Bookings
$1.6 billionGross Bookings
$886 million
Gross Bookings
Source: Company data for the 12 months ending March 31, 2020
21
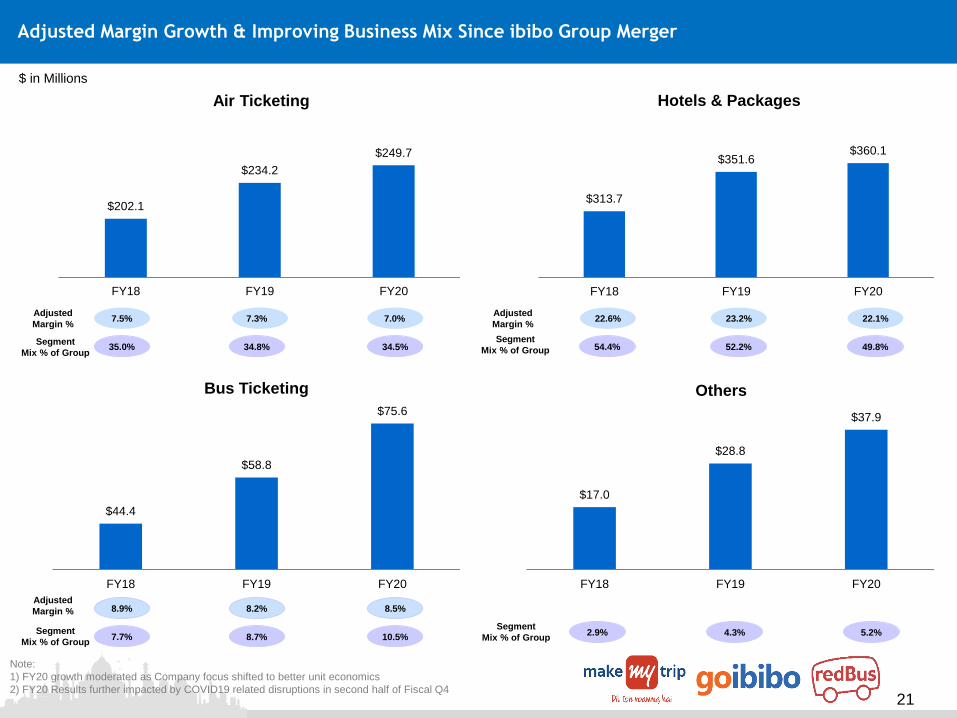
$17.0
$28.8
$37.9
FY18 FY19 FY20
Others
$313.7
$351.6 $360.1
FY18 FY19 FY20
Hotels & Packages
$44.4
$58.8
$75.6
FY18 FY19 FY20
Bus Ticketing
$202.1
$234.2
$249.7
FY18 FY19 FY20
Air Ticketing
38%
Adjusted Margin Growth & Improving Business Mix Since ibibo Group Merger
$ in Millions
Segment
Mix % of Group35.0% 34.8% 34.5%Segment
Mix % of Group
22.6% 23.2% 22.1%Adjusted
Margin %7.5% 7.3% 7.0%
Adjusted
Margin %
Segment
Mix % of Group
54.4% 52.2% 49.8%
8.9% 8.2% 8.5%
Segment
Mix % of Group
Adjusted
Margin %
7.7% 8.7% 10.5%2.9% 4.3% 5.2%
Note:
1) FY20 growth moderated as Company focus shifted to better unit economics
2) FY20 Results further impacted by COVID19 related disruptions in second half of Fiscal Q4
22
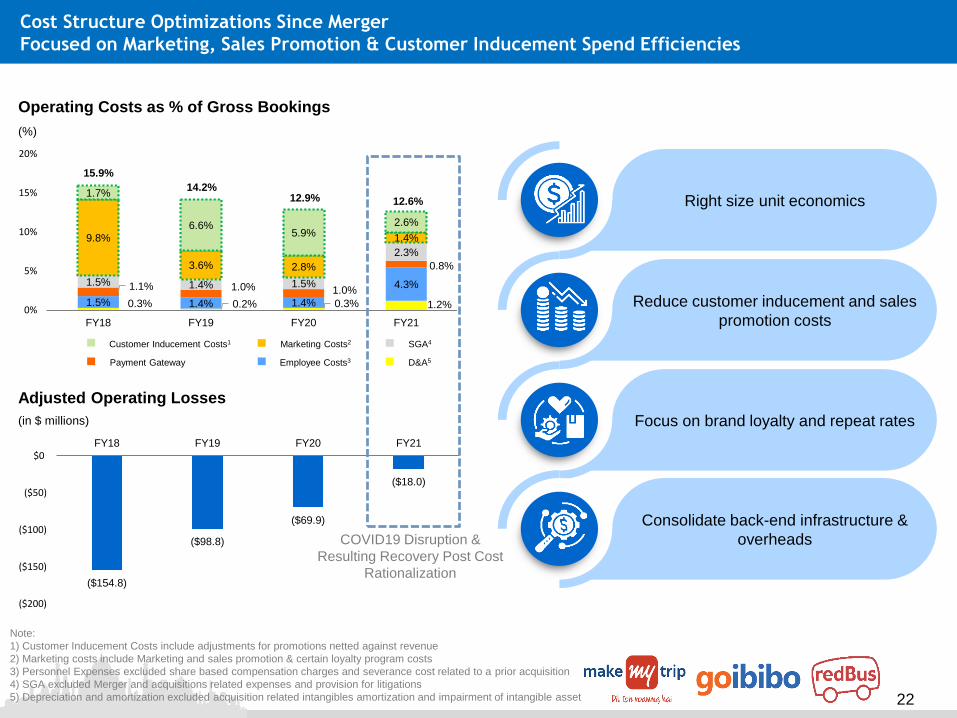
Cost Structure Optimizations Since Merger
Focused on Marketing, Sales Promotion & Customer Inducement Spend Efficiencies
Note:
1) Customer Inducement Costs include adjustments for promotions netted against revenue
2) Marketing costs include Marketing and sales promotion & certain loyalty program costs
3) Personnel Expenses excluded share based compensation charges and severance cost related to a prior acquisition
4) SGA excluded Merger and acquisitions related expenses and provision for litigations
5) Depreciation and amortization excluded acquisition related intangibles amortization and impairment of intangible asset
0.3% 0.2% 0.3% 1.2%1.5% 1.4% 1.4%
4.3%1.1% 1.0% 1.0%
0.8%
1.5% 1.4% 1.5%
2.3%
9.8%
3.6% 2.8%
1.4%
1.7%
6.6%5.9%
2.6%
0%
5%
10%
15%
20%
FY18 FY19 FY20 FY21
Operating Costs as % of Gross Bookings
(%)
12.9%14.2%
15.9%
Adjusted Operating Losses
(in $ millions)
($154.8)
($98.8)
($69.9)
($18.0)
($200)
($150)
($100)
($50)
$0FY18 FY19 FY20 FY21
Right size unit economics
Reduce customer inducement and sales
promotion costs
Focus on brand loyalty and repeat rates
Consolidate back-end infrastructure &
overheads
Marketing Costs2 SGA4
Payment Gateway Employee Costs3 D&A5
Customer Inducement Costs1
12.6%
COVID19 Disruption &
Resulting Recovery Post Cost
Rationalization
23
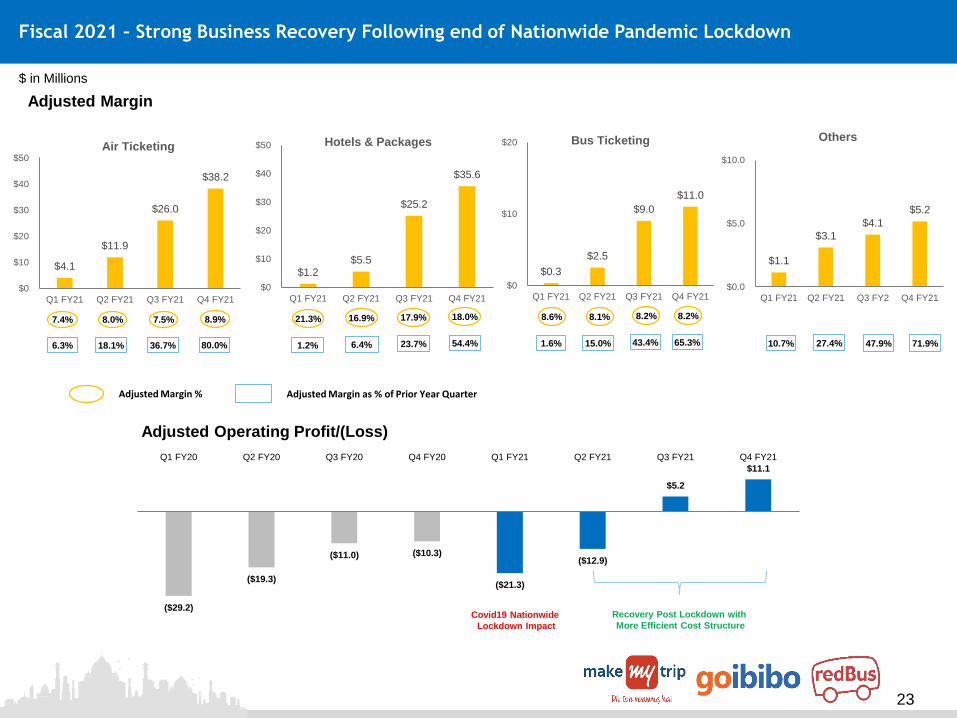
Fiscal 2021 – Strong Business Recovery Following end of Nationwide Pandemic Lockdown
Adjusted Margin %
($29.2)
($19.3)
($11.0) ($10.3)
($21.3)
($12.9)
$5.2
$11.1
Q1 FY20 Q2 FY20 Q3 FY20 Q4 FY20 Q1 FY21 Q2 FY21 Q3 FY21 Q4 FY21
Adjusted Operating Profit/(Loss)
Covid19 Nationwide
Lockdown Impact
7.4% 8.0% 21.3% 16.9% 8.6% 8.1%
6.3% 18.1% 1.2% 6.4% 1.6% 15.0% 10.7% 27.4%
7.5%
36.7% 23.7%
8.2%
43.4% 47.9%
17.9%
$ in Millions
Adjusted Margin as % of Prior Year Quarter
Adjusted Margin
$4.1
$11.9
$26.0
$38.2
$0
$10
$20
$30
$40
$50
Q1 FY21 Q2 FY21 Q3 FY21 Q4 FY21
Air Ticketing
$1.2 $5.5
$25.2
$35.6
$0
$10
$20
$30
$40
$50
Q1 FY21 Q2 FY21 Q3 FY21 Q4 FY21
Hotels & Packages
$0.3
$2.5
$9.0
$11.0
$0
$10
$20
Q1 FY21 Q2 FY21 Q3 FY21 Q4 FY21
Bus Ticketing
$1.1
$3.1
$4.1
$5.2
$0.0
$5.0
$10.0
Q1 FY21 Q2 FY21 Q3 FY2 Q4 FY21
Others
8.9%
80.0% 54.4%
18.0% 8.2%
65.3% 71.9%
Recovery Post Lockdown with
More Efficient Cost Structure
24
Operating Cost Optimizations Implemented in Late March
due to COVID19 Disruption
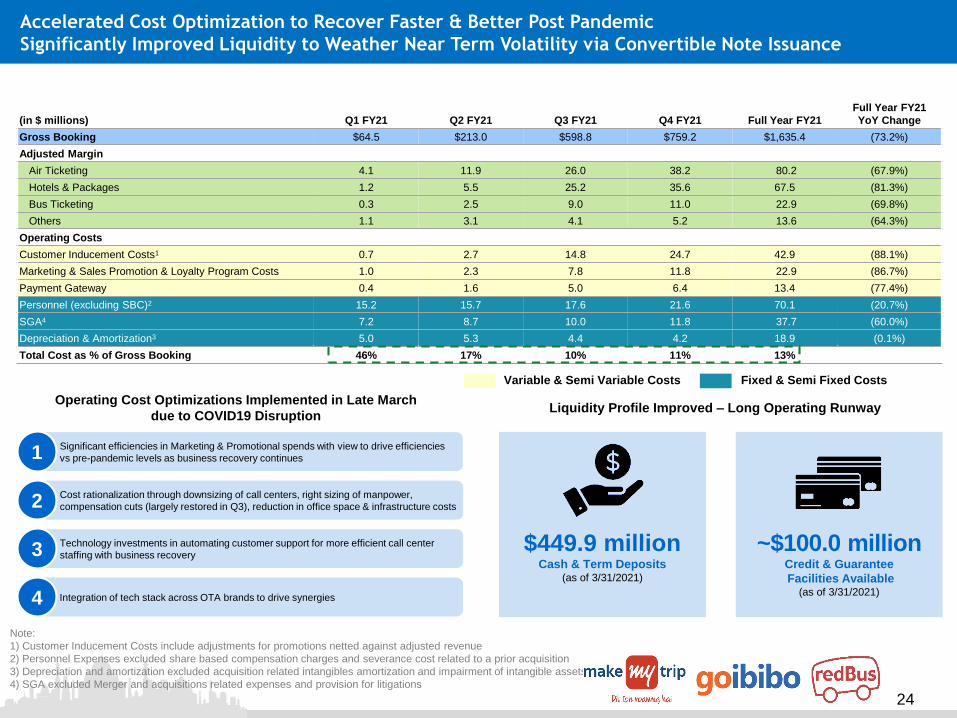
Accelerated Cost Optimization to Recover Faster & Better Post Pandemic
Significantly Improved Liquidity to Weather Near Term Volatility via Convertible Note Issuance
Liquidity Profile Improved – Long Operating Runway
$449.9 millionCash & Term Deposits
(as of 3/31/2021)
~$100.0 millionCredit & Guarantee
Facilities Available(as of 3/31/2021)
Note:
1) Customer Inducement Costs include adjustments for promotions netted against adjusted revenue
2) Personnel Expenses excluded share based compensation charges and severance cost related to a prior acquisition
3) Depreciation and amortization excluded acquisition related intangibles amortization and impairment of intangible assets
4) SGA excluded Merger and acquisitions related expenses and provision for litigations
• Significant efficiencies in Marketing & Promotional spends with view to drive efficiencies
vs pre-pandemic levels as business recovery continues
• Cost rationalization through downsizing of call centers, right sizing of manpower,
compensation cuts (largely restored in Q3), reduction in office space & infrastructure costs
• Technology investments in automating customer support for more efficient call center
staffing with business recovery
• Integration of tech stack across OTA brands to drive synergies
1
2
3
4
(in $ millions) Q1 FY21 Q2 FY21 Q3 FY21 Q4 FY21 Full Year FY21
Full Year FY21
YoY Change
Gross Booking $64.5 $213.0 $598.8 $759.2 $1,635.4 (73.2%)
Adjusted Margin
Air Ticketing 4.1 11.9 26.0 38.2 80.2 (67.9%)
Hotels & Packages 1.2 5.5 25.2 35.6 67.5 (81.3%)
Bus Ticketing 0.3 2.5 9.0 11.0 22.9 (69.8%)
Others 1.1 3.1 4.1 5.2 13.6 (64.3%)
Operating Costs
Customer Inducement Costs1 0.7 2.7 14.8 24.7 42.9 (88.1%)
Marketing & Sales Promotion & Loyalty Program Costs 1.0 2.3 7.8 11.8 22.9 (86.7%)
Payment Gateway 0.4 1.6 5.0 6.4 13.4 (77.4%)
Personnel (excluding SBC)2 15.2 15.7 17.6 21.6 70.1 (20.7%)
SGA4 7.2 8.7 10.0 11.8 37.7 (60.0%)
Depreciation & Amortization3 5.0 5.3 4.4 4.2 18.9 (0.1%)
Total Cost as % of Gross Booking 46% 17% 10% 11% 13%
Variable & Semi Variable Costs Fixed & Semi Fixed Costs
25
Appendix
26
Non-IFRS Metrics & Note on Unaudited Financials
The following non-IFRS metrics will be used in this presentation:
Gross Bookings represents total amount paid by our customers for travel services and products booked through us, including taxes, fees,
and other charges, and are net of cancellations, discounts and refunds, but does not include other revenues that are generated from 3rd party
advertisement on our website, commissions and fees earned from the sale of rail tickets and fees earned by facilitating travel insurance
policies to customers.
Adjusted Margin is our segment profitability measure and represents IFRS revenue after adding back customer inducement costs in the
nature of customer incentives, customer acquisition costs and loyalty program costs, which are reported as a reduction of revenue, and
deducting the cost of acquisition of services primarily relating to sales to customers where the company acts as the principal. This metric was
previously titled “Adjusted Revenue” in our past public filings in fiscal years 2019 and 2020. For more information, see “About Key
Performance Indicators and Non-IFRS Measures” elsewhere in our SEC Form 20F, filed on August 17, 2020.
Adjusted Margin % is defined as Adjusted Margin as a percentage of Gross Bookings, and represents commissions, fees, incentive
payments and other amounts earned in our business. We follow adjusted margin trends closely across our various lines of business to gain
insight into the profitability of our various businesses.
Flight Segment is defined as a flight between two cities, whether or not such flight is part of a larger or longer itinerary.
Room Nights, also referred to as a “hotel-room nights,” is the total number of hotel rooms occupied by a customer or group,
multiplied by the number of nights that such customer or group occupies those rooms.
Constant Currency refers to our financial results assuming constant foreign exchange rates for the current fiscal period based on the
reporting for the historical average rate used in the prior year’s comparable fiscal period.
Fiscal Year End – March 31st
27
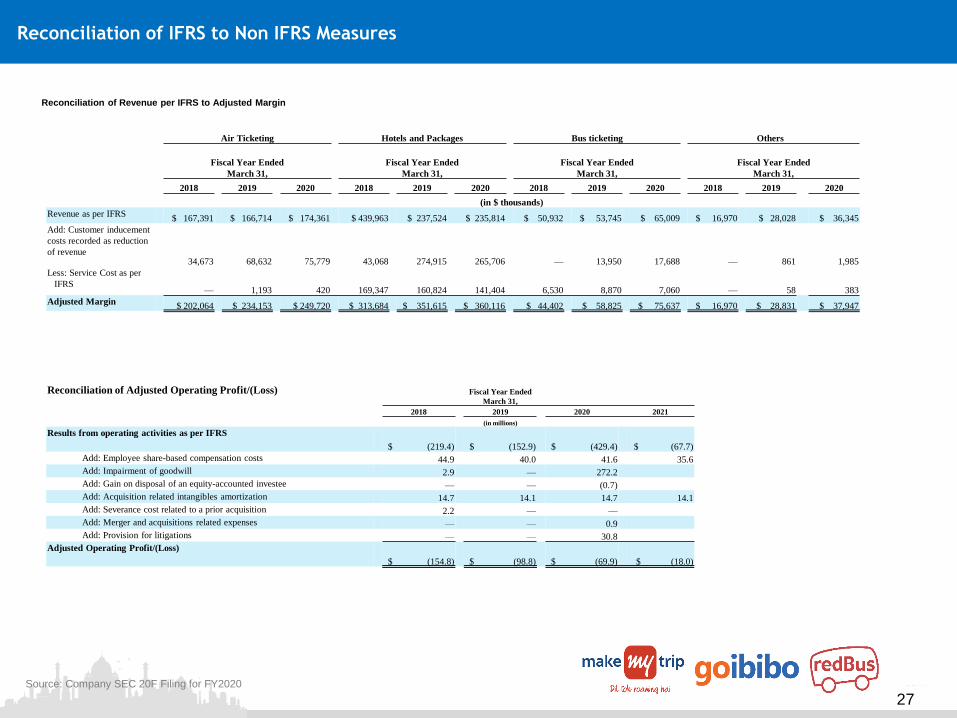
Reconciliation of IFRS to Non IFRS Measures
Reconciliation of Adjusted Operating Profit/(Loss) Fiscal Year Ended
March 31,
2018 2019 2020 2021
(in millions)
Results from operating activities as per IFRS
$ (219.4) $ (152.9) $ (429.4) $ (67.7)
Add: Employee share-based compensation costs 44.9 40.0 41.6 35.6
Add: Impairment of goodwill 2.9 — 272.2
Add: Gain on disposal of an equity-accounted investee — — (0.7)
Add: Acquisition related intangibles amortization 14.7 14.1 14.7 14.1
Add: Severance cost related to a prior acquisition 2.2 — —
Add: Merger and acquisitions related expenses — — 0.9
Add: Provision for litigations — — 30.8
Adjusted Operating Profit/(Loss)
$ (154.8) $ (98.8) $ (69.9) $ (18.0)
Reconciliation of Revenue per IFRS to Adjusted Margin
Air Ticketing Hotels and Packages Bus ticketing Others
Fiscal Year Ended
March 31,
Fiscal Year Ended
March 31,
Fiscal Year Ended
March 31,
Fiscal Year Ended
March 31,
2018 2019 2020 2018 2019 2020 2018 2019 2020 2018 2019 2020
(in $ thousands)
Revenue as per IFRS$ 167,391 $ 166,714 $ 174,361 $ 439,963 $ 237,524 $ 235,814 $ 50,932 $ 53,745 $ 65,009 $ 16,970 $ 28,028 $ 36,345
Add: Customer inducement
costs recorded as reduction
of revenue34,673 68,632 75,779 43,068 274,915 265,706 — 13,950 17,688 — 861 1,985
Less: Service Cost as per
IFRS— 1,193 420 169,347 160,824 141,404 6,530 8,870 7,060 — 58 383
Adjusted Margin$ 202,064 $ 234,153 $ 249,720 $ 313,684 $ 351,615 $ 360,116 $ 44,402 $ 58,825 $ 75,637 $ 16,970 $ 28,831 $ 37,947
Source: Company SEC 20F Filing for FY2020
28
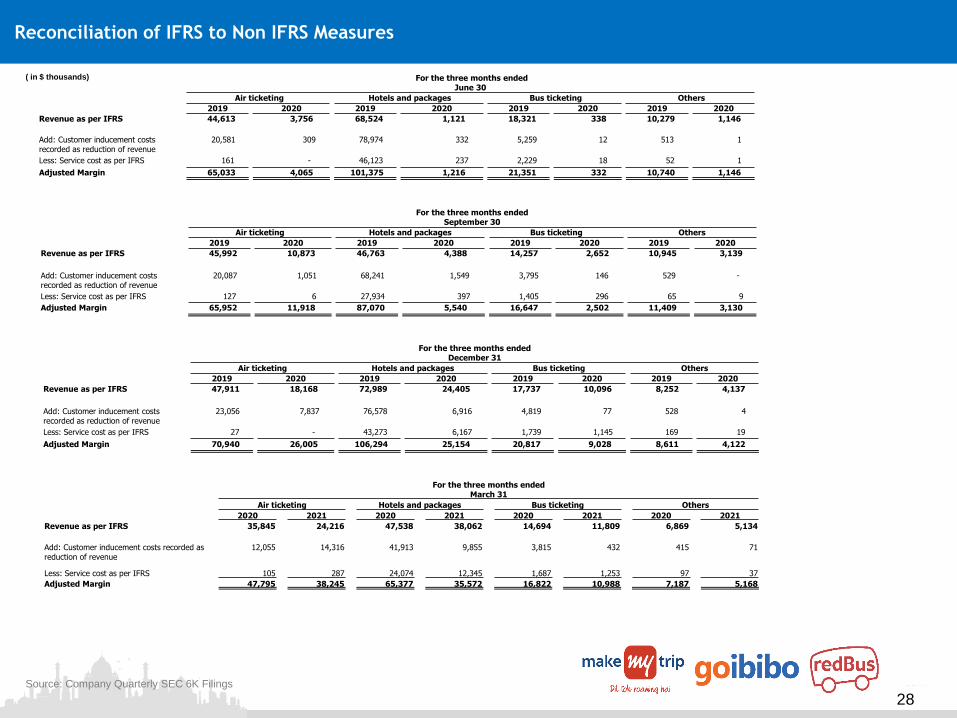
Reconciliation of IFRS to Non IFRS Measures
For the three months ended June 30
Air ticketing Hotels and packages Bus ticketing Others
2019 2020 2019 2020 2019 2020 2019 2020
Revenue as per IFRS 44,613 3,756 68,524 1,121 18,321 338 10,279 1,146
Add: Customer inducement costs recorded as reduction of revenue
20,581 309 78,974 332 5,259 12 513 1
Less: Service cost as per IFRS 161 - 46,123 237 2,229 18 52 1
Adjusted Margin 65,033 4,065 101,375 1,216 21,351 332 10,740 1,146
For the three months ended September 30
Air ticketing Hotels and packages Bus ticketing Others
2019 2020 2019 2020 2019 2020 2019 2020
Revenue as per IFRS 45,992 10,873 46,763 4,388 14,257 2,652 10,945 3,139
Add: Customer inducement costs recorded as reduction of revenue
20,087 1,051 68,241 1,549 3,795 146 529 -
Less: Service cost as per IFRS 127 6 27,934 397 1,405 296 65 9
Adjusted Margin 65,952 11,918 87,070 5,540 16,647 2,502 11,409 3,130
For the three months ended December 31
Air ticketing Hotels and packages Bus ticketing Others
2019 2020 2019 2020 2019 2020 2019 2020
Revenue as per IFRS 47,911 18,168 72,989 24,405 17,737 10,096 8,252 4,137
Add: Customer inducement costs recorded as reduction of revenue
23,056 7,837 76,578 6,916 4,819 77 528 4
Less: Service cost as per IFRS 27 - 43,273 6,167 1,739 1,145 169 19
Adjusted Margin 70,940 26,005 106,294 25,154 20,817 9,028 8,611 4,122
Source: Company Quarterly SEC 6K Filings
( in $ thousands)
For the three months ended March 31
Air ticketing Hotels and packages Bus ticketing Others
2020 2021 2020 2021 2020 2021 2020 2021
Revenue as per IFRS 35,845 24,216 47,538 38,062 14,694 11,809 6,869 5,134
Add: Customer inducement costs recorded as reduction of revenue
12,055 14,316 41,913 9,855 3,815 432 415 71
Less: Service cost as per IFRS 105 287 24,074 12,345 1,687 1,253 97 37
Adjusted Margin 47,795 38,245 65,377 35,572 16,822 10,988 7,187 5,168
29
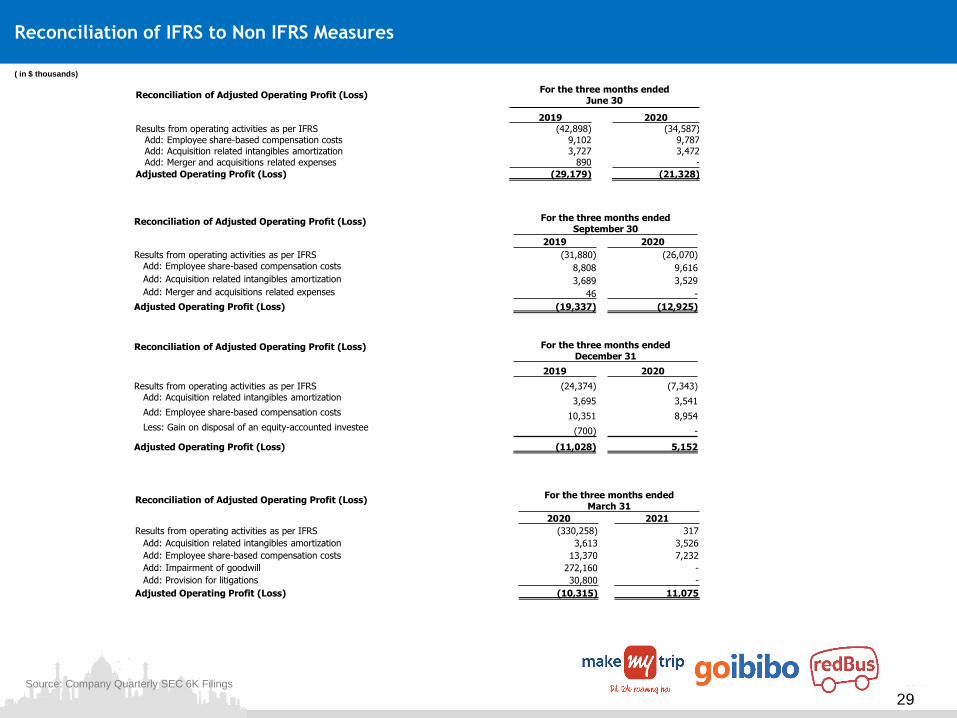
Reconciliation of IFRS to Non IFRS Measures
Reconciliation of Adjusted Operating Profit (Loss) For the three months ended December 31
2019 2020
Results from operating activities as per IFRS (24,374) (7,343)Add: Acquisition related intangibles amortization 3,695 3,541 Add: Employee share-based compensation costs 10,351 8,954 Less: Gain on disposal of an equity-accounted investee (700) -
Adjusted Operating Profit (Loss) (11,028) 5,152
Reconciliation of Adjusted Operating Profit (Loss) For the three months ended September 30
2019 2020
Results from operating activities as per IFRS (31,880) (26,070)Add: Employee share-based compensation costs 8,808 9,616 Add: Acquisition related intangibles amortization 3,689 3,529 Add: Merger and acquisitions related expenses 46 -
Adjusted Operating Profit (Loss) (19,337) (12,925)
Reconciliation of Adjusted Operating Profit (Loss)For the three months ended
June 30
2019 2020Results from operating activities as per IFRS (42,898) (34,587)
Add: Employee share-based compensation costs 9,102 9,787 Add: Acquisition related intangibles amortization 3,727 3,472 Add: Merger and acquisitions related expenses 890 -
Adjusted Operating Profit (Loss) (29,179) (21,328)
( in $ thousands)
Source: Company Quarterly SEC 6K Filings
Reconciliation of Adjusted Operating Profit (Loss)For the three months ended
March 31
2020 2021
Results from operating activities as per IFRS (330,258) 317
Add: Acquisition related intangibles amortization 3,613 3,526
Add: Employee share-based compensation costs 13,370 7,232
Add: Impairment of goodwill 272,160 -
Add: Provision for litigations 30,800 -
Adjusted Operating Profit (Loss) (10,315) 11,075


![Product Packaging Design Strategy Against the Background of … · Packaging Design of Zhuang Clothing — taking "Alpine Ecological Rice" as an Example [J]. Appreciation. 2017(14)](https://img.pdfslide.us/doc/110x75/61289d1f085828199562e881/product-packaging-design-strategy-against-the-background-of-packaging-design-of.jpg)