Embed Size (px)
Citation preview
Holes in Glulam Beams – Possible Methods of Reinforcement
VÄXJÖ June 2009 Thesis no: TD 056/2009
UTHMAN, Rawa Nawzad OTHMAN, Rawaz Najat
Department of Technology and Design, TD
School of Technology and Design, TD
I
Organisation/ Organization Författare/Author(s) VÄXJÖ UNIVERSITET UTHMAN, Rawa Nawzad Institutionen för teknik och design OTHMAN, Rawaz Najat Växjö University School of Technology and Design Dokumenttyp/Type of document Handledare/tutor Examinator/examiner MasterThesis Prof. Erik Serrano Prof. Erik Serrano Titel och undertitel/Title and subtitle
/ Holes in Glulam Beams – Possible Methods of Reinforcement Sammanfattning (på svenska) Denna rapport behandlar limträbalkar med hål. Olika hålgeometrier, cirkulära och kvadratiska hål, och olika metoder att förstärka balkarna vid hålet undersöktes. Totalt 24 enskilda provningar genomfördes med två olika förstärkningsmetoder (glasfiber och plywood) samt med balkar utan förstärkning. Vid provning av de oförstärkta balkarna användes ett system för beröringsfri deformationsmätning för att få en bild av deformationsmönstret. Ett kommersiellt finita elementprogram användes också för att analysera balkarnas respons och för att jämföra med provningsresultaten. Provningarna visade att förstärkningen med plywood var effektivare än förstärkningen med glasfiber. Vidare uppvisade de olika hålgeometrierna olika brottbeteenden, där de kvadratiska hålen gav mindre spröda brott, dock vid en i genomsnitt lägre brottlast än de cirkulära hålen. Nyckelord Abstract (in English) This thesis deals with glued laminated beams with holes. Different hole geometries, circular and quadratic, and reinforcement methods were investigated. A total of 24 tests were performed using two types of reinforcements (glass fiber and plywood) and testing unreinforced beam. During testing of the beams without reinforcement a contact free deformation measurement system was used to capture the deformation pattern. A commercial finite element software package was used to perform numerical calculations of the response of the beams. The FE-analyses were also compared with the experimental results. The test results showed that the reinforcement with plywood was more efficient than the reinforcement with glass fiber. In addition, the two hole geometries showed different failure behaviors. The beams with quadratic holes showed a less brittle behavior, although at a lower load level than the beams with circular holes. Key Words Glulam beams, holes, contact free deformation analysis Utgivningsår/Year of issue Språk/Language Antal sidor/Number of pages 2009 English 53 Internet/WWW http://www.vxu.se/td
II
Acknowledgements This Master Thesis was written during 2009 at the School of Technology & Design at Växjö University. First and foremost, we would like to thank our supervisor Prof. Erik Serrano for giving us directions and responsibility, and for trusting our choices during the work. We are also thankful to Mr. Bertil Enquist for helping us during the experimental work.
Finally, we would like to express our thanks to our families for supporting us.
Växjö, May 2009
Rawa Uthman
Rawaz Othman
III
Abstract This thesis deals with glued laminated beams with holes. Different hole geometries, circular and quadratic, and reinforcement methods were investigated. A total of 24 tests were performed using two types of reinforcements (glass fiber and plywood) and testing unreinforced beam. During testing of the beams without reinforcement a contact free deformation measurement system was used to capture the deformation pattern. A commercial finite element software package was used to perform numerical calculations of the response of the beams. The FE-analyses were also compared with the experimental results. The test results showed that the reinforcement with plywood was more efficient than the reinforcement with glass fiber. In addition, the two hole geometries showed different failure behaviors. The beams with quadratic holes showed a less brittle behavior, although at a lower load level than the beams with circular holes.
Table of Contents 1. Introduction ....................................................................................................................................... 1
1.1 Background ................................................................................................................................. 1
1.2 Aim and scope ............................................................................................................................. 1
1.3 Disposition ................................................................................................................................... 2
2. Literature Review ............................................................................................................................. 3
2.1 General Remark .......................................................................................................................... 3
2.2 Bengtsson and Dahl, 1971 ........................................................................................................... 3
2.3 Kolb and Frech, 1977 .................................................................................................................. 3
2.4 Penttala, 1980 .............................................................................................................................. 3
2.5 Hallström, 1995 ........................................................................................................................... 4
3. Experimental test methods and results ........................................................................................... 5
3.1 General ......................................................................................................................................... 5
3.2 Test Setup .................................................................................................................................... 6
3.2.1 Test setup A ..................................................................................................................... 6
3.2.2 Test Setup B ..................................................................................................................... 7
3.2.3 Test setup C ..................................................................................................................... 7
3.3 Test Results and Analysis ........................................................................................................... 8
3.3.1 Rectangular Holes ........................................................................................................... 8
3.3.2 Circular Holes ............................................................................................................... 12
3.4 Result comparisons and Conclusion ........................................................................................ 16
3.4.1 comparing Rectangular holes with Circular Holes .................................................... 16
3.4.2 The effect of reinforcement .......................................................................................... 17
4. Theoretical Calculation .................................................................................................................. 19
4.1 Finite Element equation ............................................................................................................ 19
5. Numerical analysis .......................................................................................................................... 25
5.1 ABAQUS program ................................................................................................................... 25
5.2 Model Description ..................................................................................................................... 25
5.3 Evaluation of results ................................................................................................................. 26
6. Results Comparison ........................................................................................................................ 30
7. Concluding Remarks ...................................................................................................................... 34
8. References ........................................................................................................................................ 35

9. Appendix .......................................................................................................................................... 36
1
1. Introduction 1.1 Background
Wood is a very useful and well-suited material in construction. It has many advantages
in construction because of its high strength in relation to its weight. It has furthermore
good resistance against environmental corrosion. A major drawback is the low strength
in tension perpendicular to the grain. Glulam is a product manufactured by gluing a
number of laminations on top of each other. It has many advantages in a number of
applications, because of its fire resistance, its insulating properties, and because of the
fact that it can be manufactured in almost any size or shape. As with solid timber,
glulam has poor strength perpendicular to the grain and thus, under high stress, cracks
can develop, typically parallel to the grain. Therefore; sometimes an efficient
reinforcement method to give increased strength by preventing cracks can be vital.
Holes in timber beams can be necessary in many cases, for example for accommodating
ventilation pipes.
This thesis describes the effect of holes in a glulam beam. The glulam being used here
was made from green-glued side boards. This means that the boards were glued to form
the cross section before drying them. The holes are a starting point for fracture along
the grain of the wood. The fracture often occurs suddenly and the failure of the beam is
a brittle failure. The crack is initiated by shear stress or tension stress perpendicular to
the grain or a combination. There are at the moment no calculation methods for holes in
beams included in the European Timber design code EC5. There are, however, some
older empirical methods available, methods that have been used before. If not applying
these empirical methods, it would be necessary to use fracture mechanics methods to
solve these problems. One way to increase both the strength and stiffness as well as to
reduce the brittleness of these structures may be to reinforce the beam around the hole.
1.2 Aim and scope
The aim of the thesis is to investigate the effect of different reinforcement methods on
the stiffness, strength and brittleness of timber beams with holes. Two types of holes are
2
investigated, circular and quadratic holes. A total of twelve glulam beams have been
used, six of them with reinforced holes and six of them without reinforcement. Each
beam had two holes, one at each end of the beam. Thus three beams had circular holes
and another three had quadratic holes, all without reinforcement. Three beams had
circular holes and three beams had quadratic holes, all without reinforcement. The
purpose of using reinforcement was to give a better ability to resist fracture when
loading the beams.
1.3 Disposition
This thesis consists of six chapters including this introduction and overview, containing
a summarized description of the glulam beams, the aim and scope. Chapter 2 contains a
short literature review. Methods (theoretical, software and experimental) are presented
in the chapters 3, 4 and 5. Results comparisons are given in chapter 6. Chapter 7,
finally, includes some concluding remarks.
3
2. Literature Review 2.1 General Remark
Several previous studies on glulam beam with holes can be found in the literature.
Different configurations, like the geometry of the beam, location and type of holes,
applied loads and type of reinforcement have been studied. Some of these investigations
are briefly summarized below.
2.2 Bengtsson and Dahl, 1971
Bengtsson and Dahl tested glulam beams with different hole shapes and sizes, with and
without reinforcement in the thesis Inverkan av hål nära upplag på hållfastheten hos
limträbalkar (Influence of holes near support on the strength of glulam beams) from
1971[1].They used 10 mm thick plywood for reinforcement, which was glue-nailed to
both sides of the beams. The glulam beam samples were made from spruce of strength
class L40. The results are presented in terms of failure loads and in addition it is stated
that cracks appeared at load levels of 70-90 % of the ”failure loads” in most of the tests.
2.3 Kolb and Frech, 1977 Kolb and Frech tested glulam beams with holes with and without reinforcement in
“Untersuchungen an durchbrochenen Bindern aus Brettschichtholz” (Analyses of
glulam beams with holes) from 1977[2]. They tested 12 beams with 6 different
configurations with respect to various shapes of holes, hole placements and
reinforcements. The result indicated that for the holes near the point load, the crack
growth was from the hole to the beam end, but for the beams with a hole placed in the
zone with pure moment, the capacity was limited by bending failure at mid span.
2.4 Penttala, 1980
In the report Reiällinen liimapuupalkki (Glulam beams with holes) from 1980[3]. Two
different beam geometries with respect to cross section, length and shapes of holes were
tested. A total of 10 beams were tested in three point bending test. The general
conclusions drawn were that two types of loads were defined for evaluation, load at
4
initial cracking and load at failure. The results indicated that the load at initial cracking
was typically 70% of the load at failure.
2.5 Hallström, 1995
Two reports by Hallström (“Glass fiber reinforced laminated timber beams with holes”
and “Glass fibre reinforcement around holes in laminated timber beams”) from 1995[4]
describe tests on glulam beams with and without reinforcement. Also different shapes
of holes (circular and rectangular) were investigated. All tests were performed in three
point bending. From the result, it was concluded that at the crack initiation load,
resulting in crack opening, was observable in the load-deflection curve. The results
indicated that difference between the crack initiation load and the failure load is small.
5
3. Experimental test methods and results 3.1 General
A total of 12 beams have been used. The beams were manufactured for a research
project running at Växjö University in co-cooperation with Södra Timber AB. Each
beam consists of 13 laminations glued together in the wet (green) state, that is before
drying them. The beam dimensions are (5200X300X45) mm. In each beam two holes
were made, each hole center placed 853.5mm from each end. The purpose of making
two holes in one beam is to obtain a maximum number of tests, while using a minimum
number of beams. The 24 holes were divided into two types: 12 circular with 100mm
diameter and 12 quadratic 100X100mm in dimensions and with a corner radius of 10
mm. Each hole type was subdivided into three groups 6 holes without reinforcement, 3
holes reinforced by glass fiber mats with random orientation (165g/m2) glued with
epoxy (NM275A and hardener NM275B) and 3 holes reinforced by birch plywood
(12mm thickness made from nine sheets) glued by resorcinol (phenol) adhesive
1711+2622.
An Alvetron testing machine was used for testing the beams in 4-point bending at the
1/3 point of the span. 2 point loads were symmetrically applied, with the hole being
centered between one of the point loads and the support as illustrated in figure 3.1. Two
types of measurements were used. A contact free deformation measurement system to
obtain deformation and strain fields (ARAMIS) and traditional potentiometers and load
cell to measure deformations and load. The three potentiometers used were attached to
three channels:
i. Ch1: measuring the deformation (crack opening) in the corner close to the support.
ii. Ch2: measuring the deformation (crack opening) in the corner close to the load.
iii. Ch3: measuring the deformation of beam between the two point loads.
Figure 3.1 Locations of holes and potentiometers.
6
3.2 Test Setup
Three slightly different test setups have been used in this investigation. The reason for
this is that the first two setups used did not work as expected, leading to the fact that it
was not possible to test both ends of the beams. When performing the tests, one major
aim has been to create a shear force in the area close to the support, without introducing
too much bending moment. This means that the hole should be placed close to the
support. At the same time the hole cannot be placed too close to the support since then,
the stress and strain fields would be disturbed by the reaction force from the support
3.2.1 Test setup A
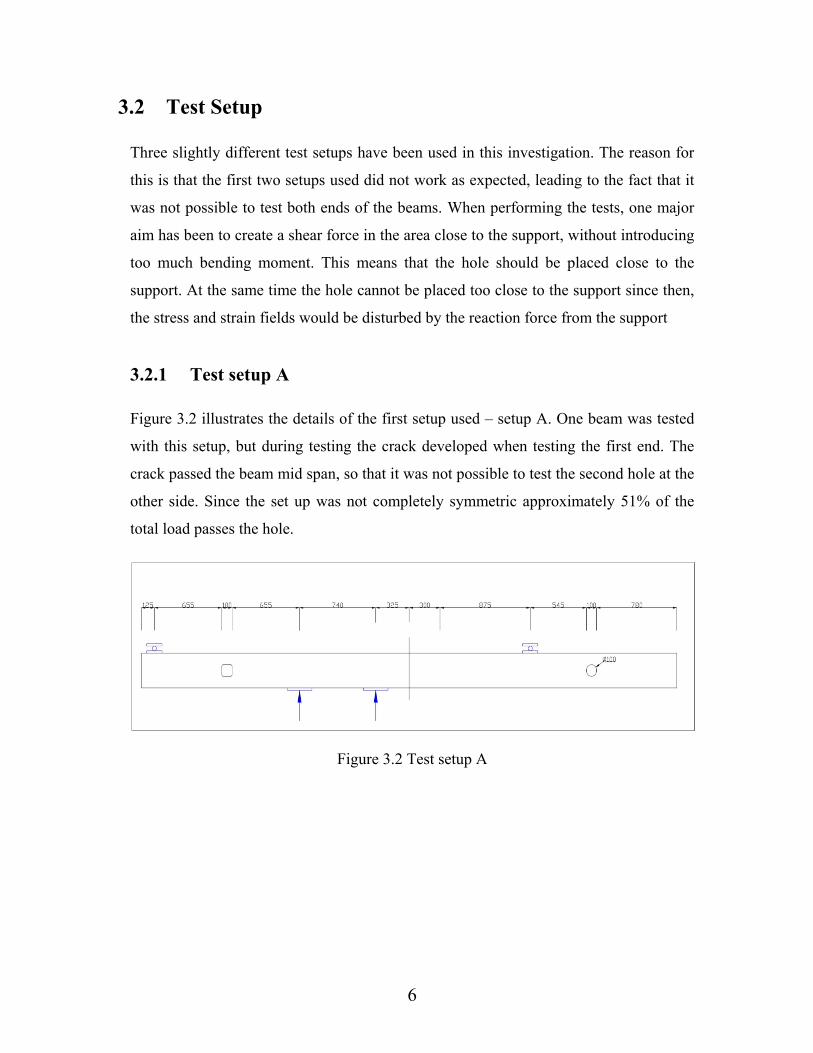
Figure 3.2 illustrates the details of the first setup used – setup A. One beam was tested
with this setup, but during testing the crack developed when testing the first end. The
crack passed the beam mid span, so that it was not possible to test the second hole at the
other side. Since the set up was not completely symmetric approximately 51% of the
total load passes the hole.
Figure 3.2 Test setup A
7
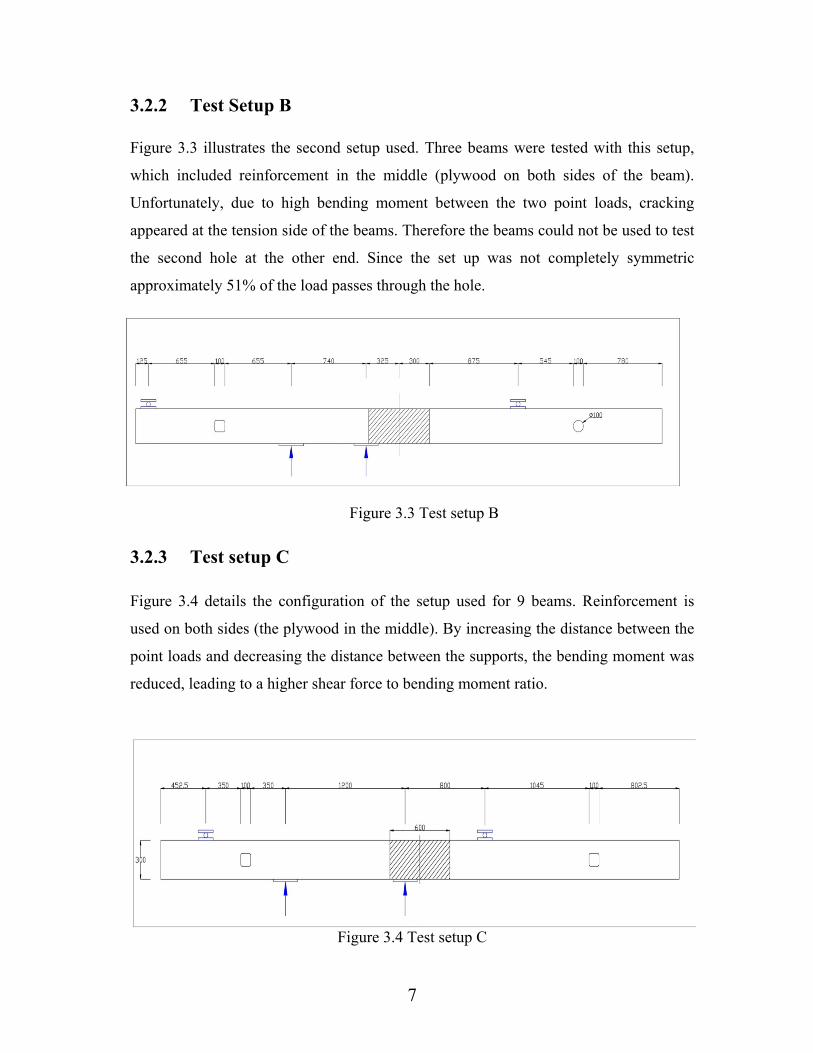
3.2.2 Test Setup B
Figure 3.3 illustrates the second setup used. Three beams were tested with this setup,
which included reinforcement in the middle (plywood on both sides of the beam).
Unfortunately, due to high bending moment between the two point loads, cracking
appeared at the tension side of the beams. Therefore the beams could not be used to test
the second hole at the other end. Since the set up was not completely symmetric
approximately 51% of the load passes through the hole.
Figure 3.3 Test setup B
3.2.3 Test setup C
Figure 3.4 details the configuration of the setup used for 9 beams. Reinforcement is
used on both sides (the plywood in the middle). By increasing the distance between the
point loads and decreasing the distance between the supports, the bending moment was
reduced, leading to a higher shear force to bending moment ratio.
Figure 3.4 Test setup C
8
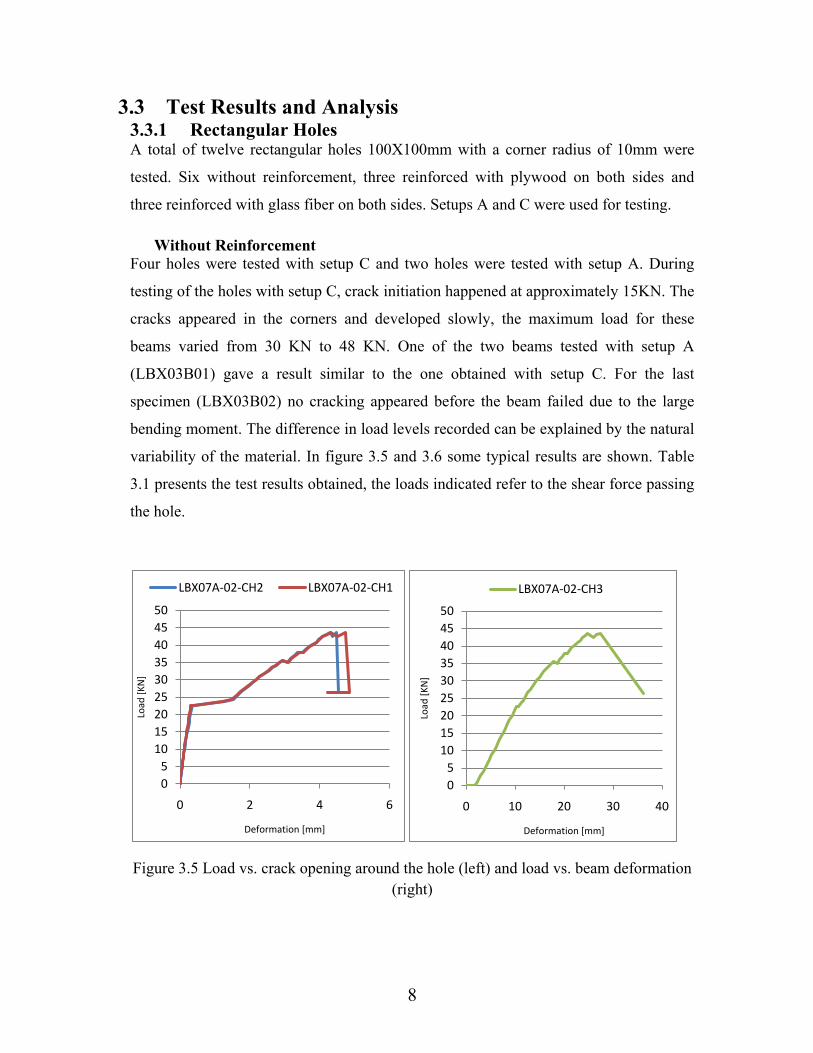
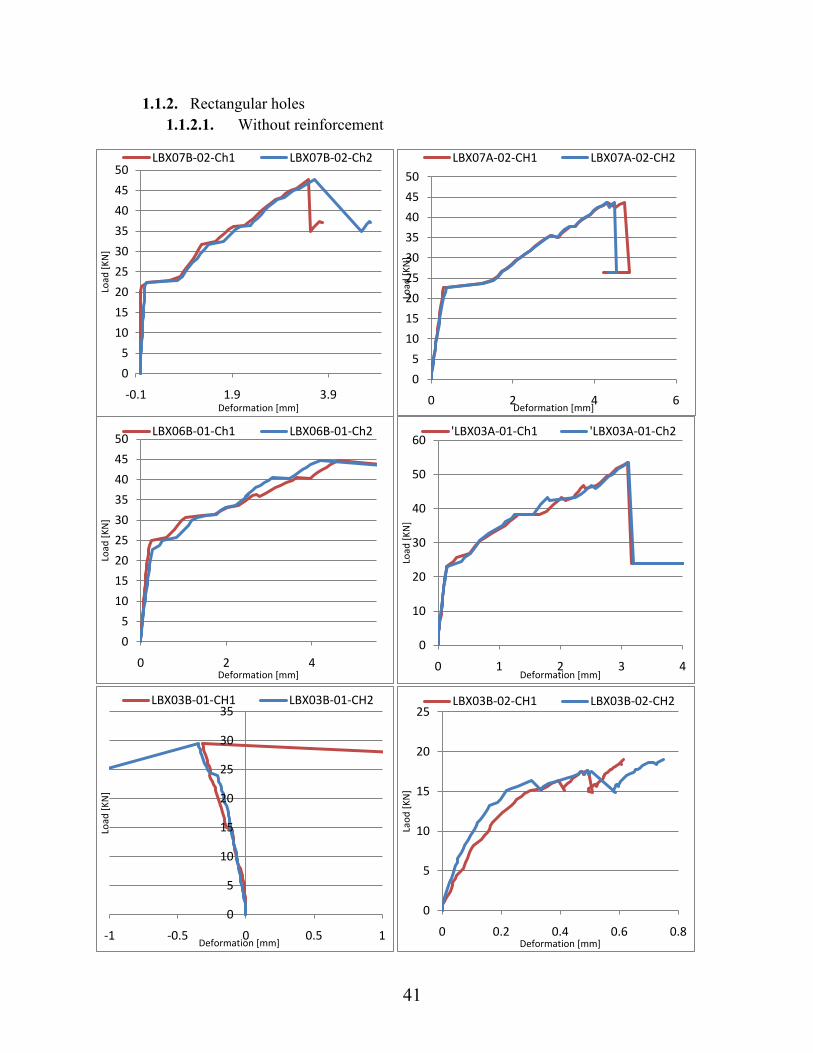
3.3 Test Results and Analysis 3.3.1 Rectangular Holes A total of twelve rectangular holes 100X100mm with a corner radius of 10mm were
tested. Six without reinforcement, three reinforced with plywood on both sides and
three reinforced with glass fiber on both sides. Setups A and C were used for testing.
Without Reinforcement Four holes were tested with setup C and two holes were tested with setup A. During
testing of the holes with setup C, crack initiation happened at approximately 15KN. The
cracks appeared in the corners and developed slowly, the maximum load for these
beams varied from 30 KN to 48 KN. One of the two beams tested with setup A
(LBX03B01) gave a result similar to the one obtained with setup C. For the last
specimen (LBX03B02) no cracking appeared before the beam failed due to the large
bending moment. The difference in load levels recorded can be explained by the natural
variability of the material. In figure 3.5 and 3.6 some typical results are shown. Table
3.1 presents the test results obtained, the loads indicated refer to the shear force passing
the hole.
Figure 3.5 Load vs. crack opening around the hole (left) and load vs. beam deformation (right)
05
101520253035404550
0 2 4 6
Load
[KN
]
Deformation [mm]
LBX07A-02-CH2 LBX07A-02-CH1
05
101520253035404550
0 10 20 30 40
Load
[KN
]
Deformation [mm]
LBX07A-02-CH3
9
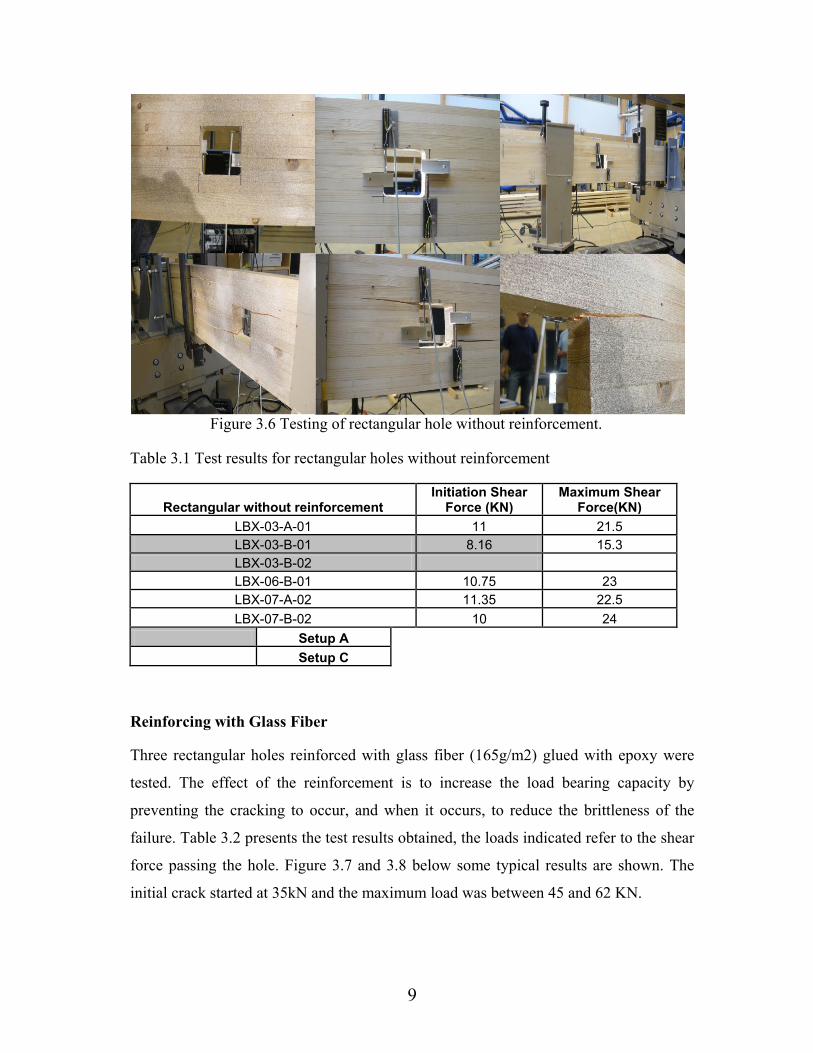
Figure 3.6 Testing of rectangular hole without reinforcement.
Table 3.1 Test results for rectangular holes without reinforcement
Rectangular without reinforcement Initiation Shear
Force (KN) Maximum Shear
Force(KN) LBX-03-A-01 11 21.5 LBX-03-B-01 8.16 15.3 LBX-03-B-02 LBX-06-B-01 10.75 23 LBX-07-A-02 11.35 22.5 LBX-07-B-02 10 24
Setup A Setup C
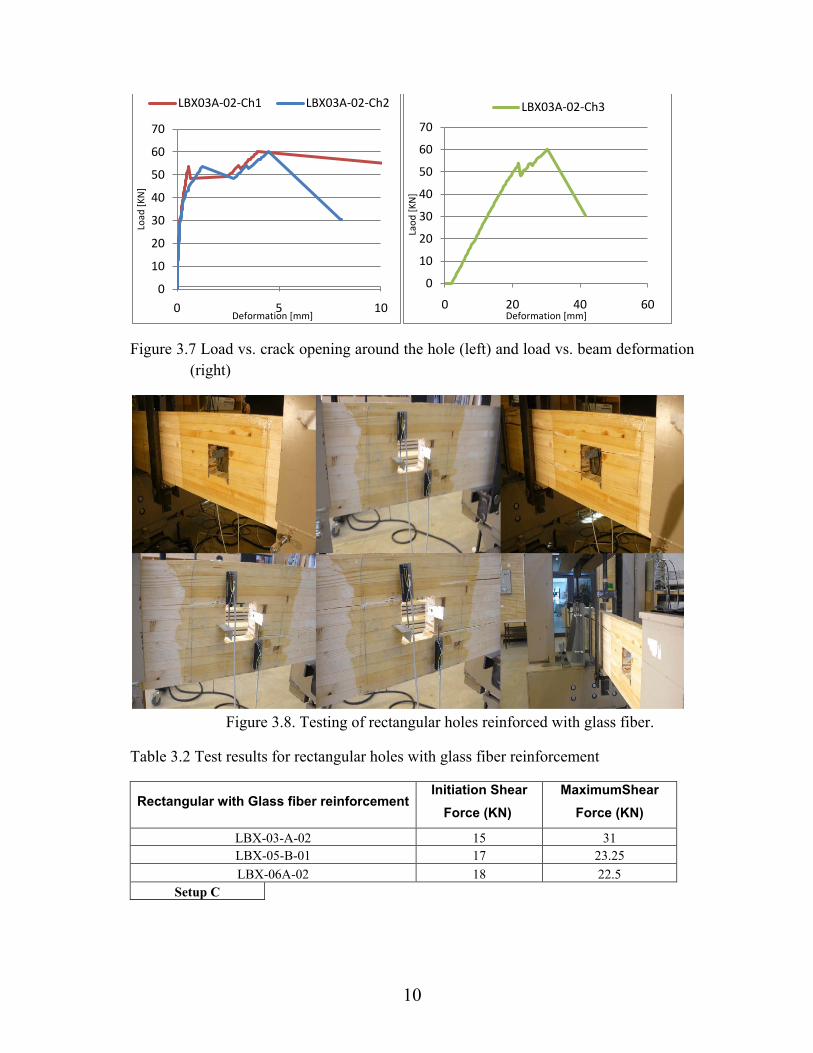
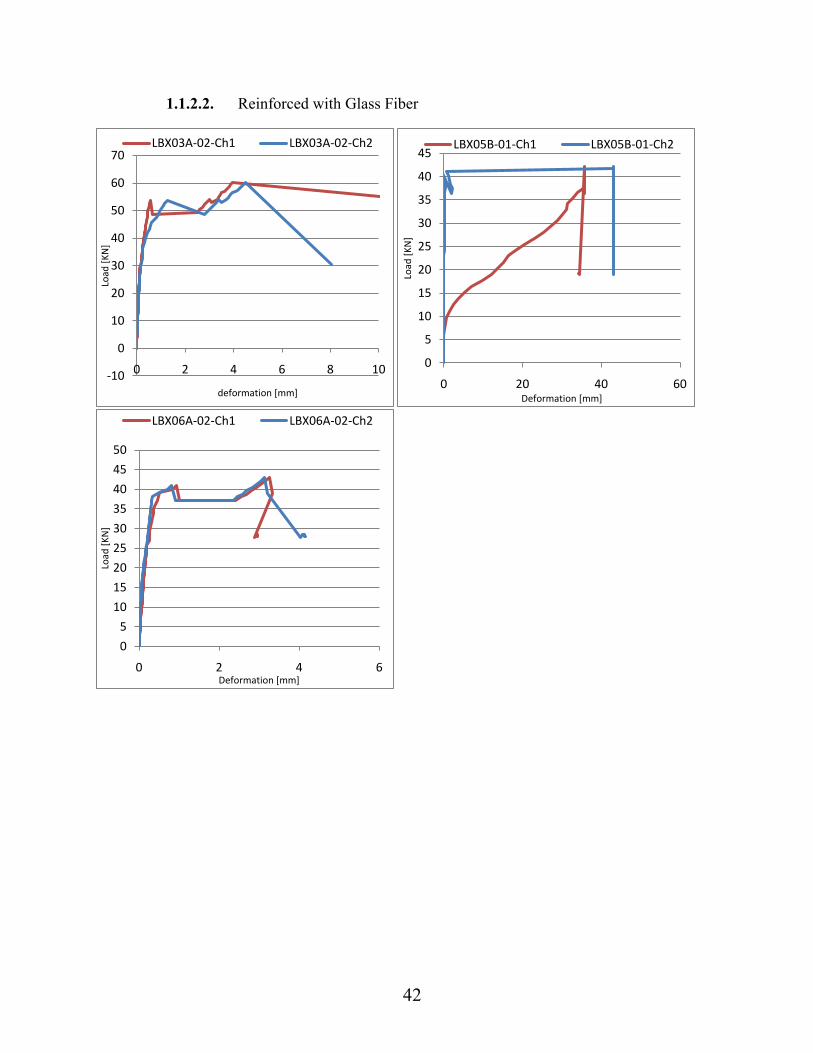
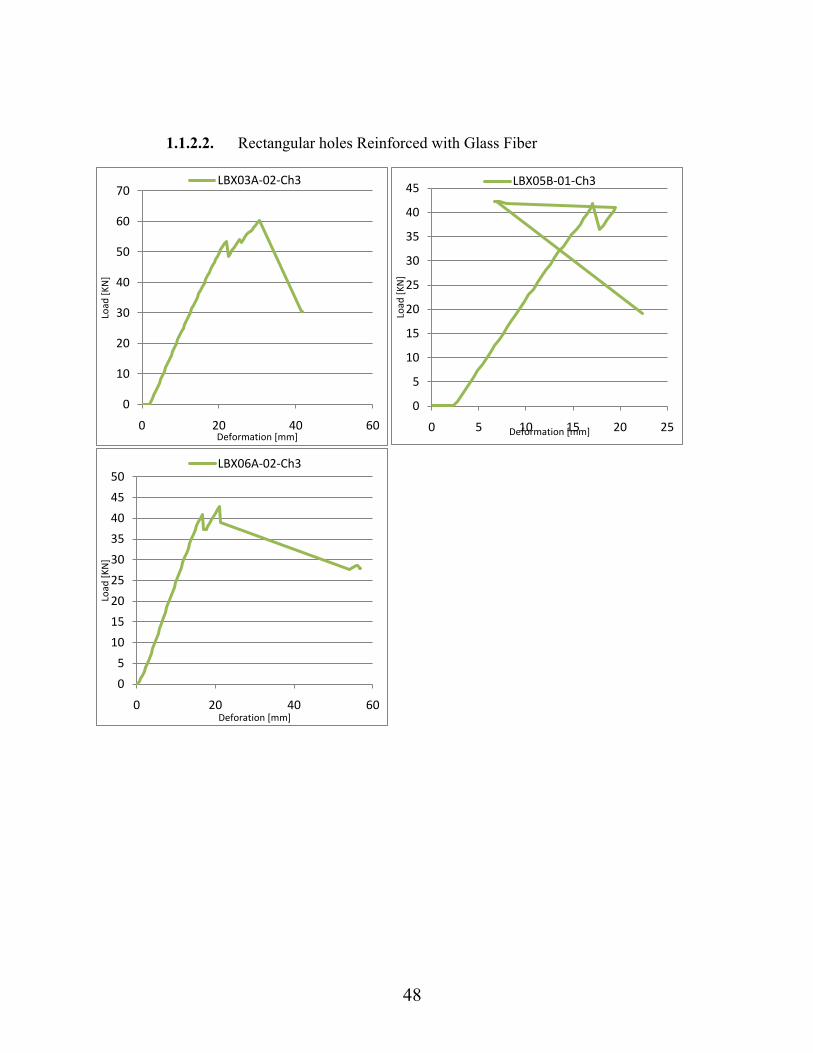
Reinforcing with Glass Fiber Three rectangular holes reinforced with glass fiber (165g/m2) glued with epoxy were
tested. The effect of the reinforcement is to increase the load bearing capacity by
preventing the cracking to occur, and when it occurs, to reduce the brittleness of the
failure. Table 3.2 presents the test results obtained, the loads indicated refer to the shear
force passing the hole. Figure 3.7 and 3.8 below some typical results are shown. The
initial crack started at 35kN and the maximum load was between 45 and 62 KN.
10
Figure 3.7 Load vs. crack opening around the hole (left) and load vs. beam deformation (right)
Figure 3.8. Testing of rectangular holes reinforced with glass fiber.
Table 3.2 Test results for rectangular holes with glass fiber reinforcement
Rectangular with Glass fiber reinforcement Initiation Shear
Force (KN) MaximumShear
Force (KN)
LBX-03-A-02 15 31 LBX-05-B-01 17 23.25 LBX-06A-02 18 22.5
Setup C
0
10
20
30
40
50
60
70
0 5 10
Load
[KN
]
Deformation [mm]
LBX03A-02-Ch1 LBX03A-02-Ch2
0
10
20
30
40
50
60
70
0 20 40 60
Laod
[KN
]
Deformation [mm]
LBX03A-02-Ch3
11
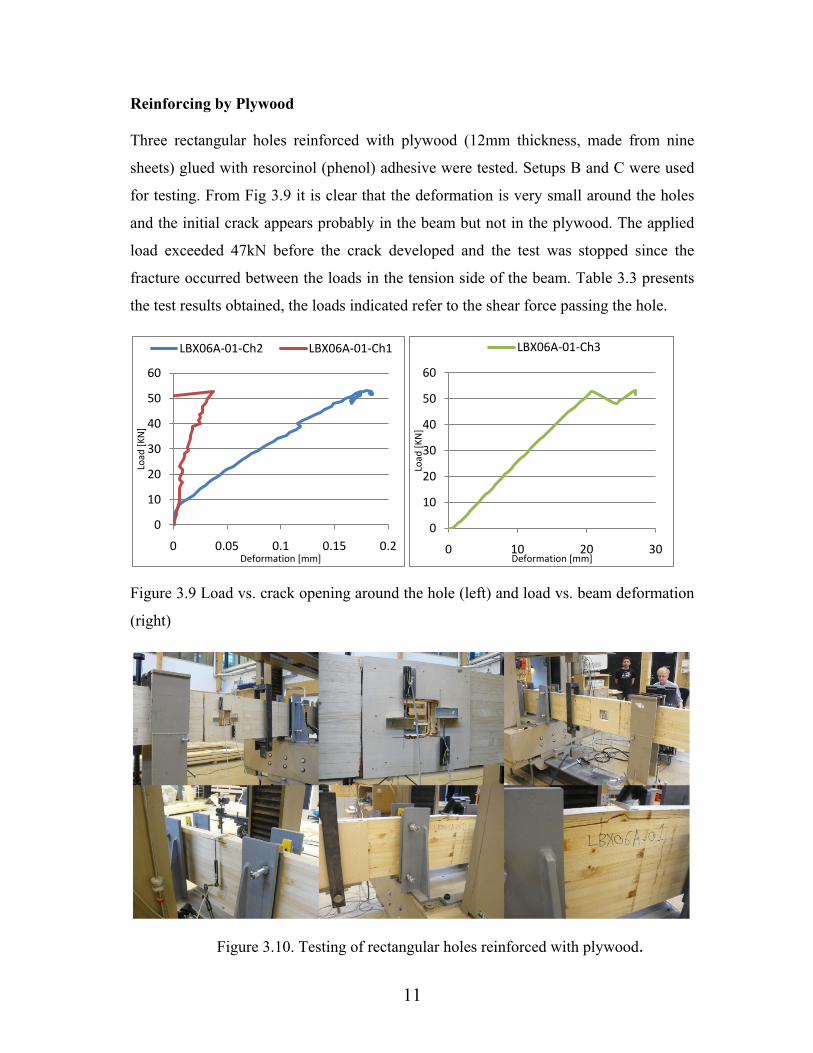
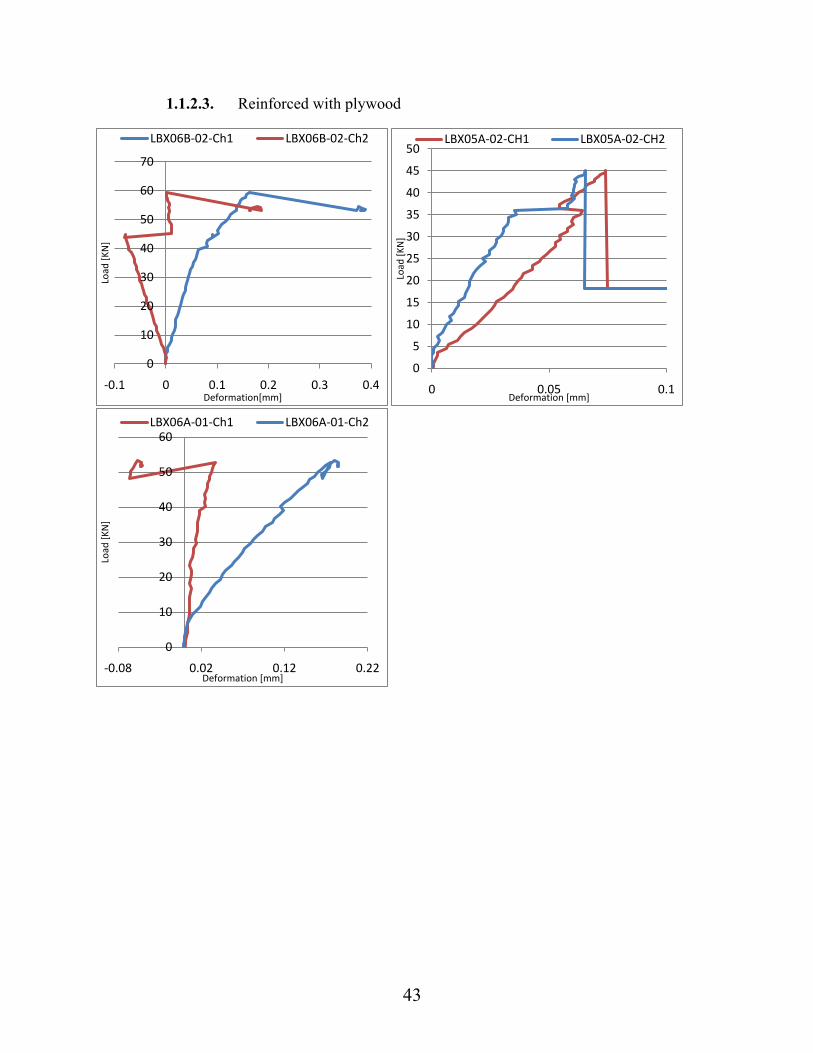
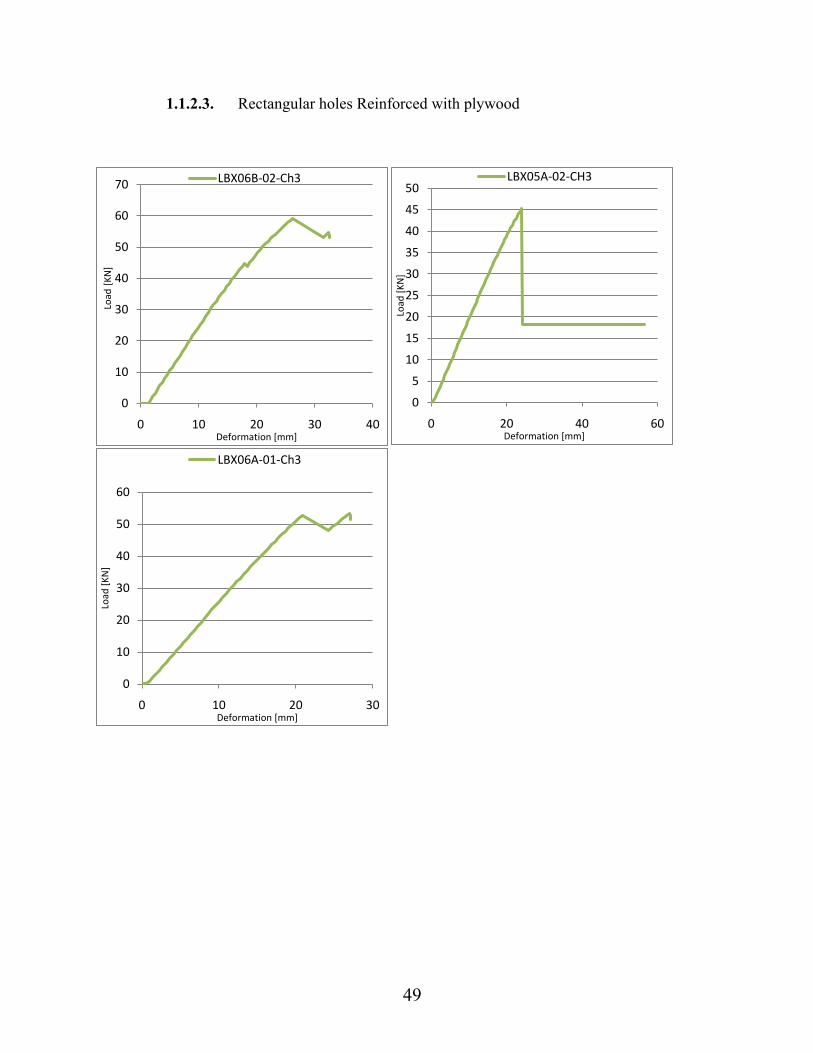
Reinforcing by Plywood
Three rectangular holes reinforced with plywood (12mm thickness, made from nine
sheets) glued with resorcinol (phenol) adhesive were tested. Setups B and C were used
for testing. From Fig 3.9 it is clear that the deformation is very small around the holes
and the initial crack appears probably in the beam but not in the plywood. The applied
load exceeded 47kN before the crack developed and the test was stopped since the
fracture occurred between the loads in the tension side of the beam. Table 3.3 presents
the test results obtained, the loads indicated refer to the shear force passing the hole.
Figure 3.9 Load vs. crack opening around the hole (left) and load vs. beam deformation
(right)
Figure 3.10. Testing of rectangular holes reinforced with plywood.
0
10
20
30
40
50
60
0 0.05 0.1 0.15 0.2
Load
[KN
]
Deformation [mm]
LBX06A-01-Ch2 LBX06A-01-Ch1
0
10
20
30
40
50
60
0 10 20 30
Load
[KN
]
Deformation [mm]
LBX06A-01-Ch3
12
Table 3.3. Test results for rectangular holes with plywood reinforcement
Rectangular with Plywood reinforcement Initiation shear Force (KN)
Maximum Shear Force (KN)
LBX-05-A-02 17.85 23.97 LBX-06A-1 18.5 27
LBX-06-B-02 18.5 30
Setup B
Setup C
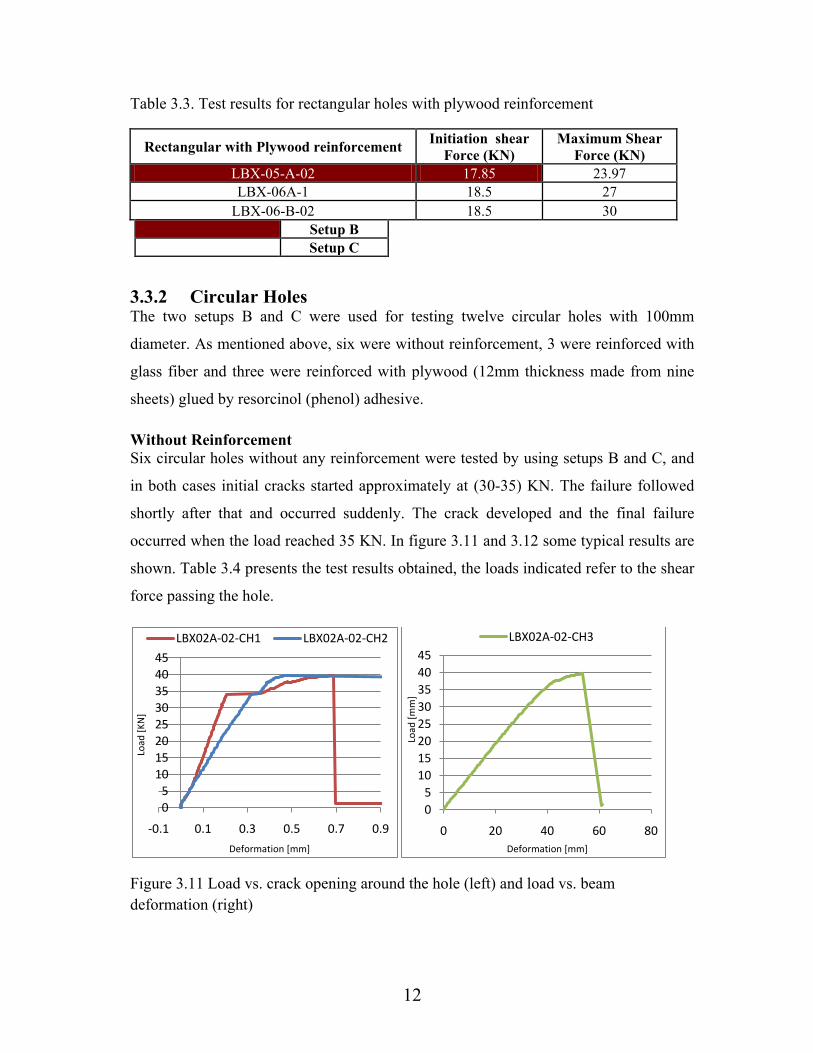
3.3.2 Circular Holes The two setups B and C were used for testing twelve circular holes with 100mm
diameter. As mentioned above, six were without reinforcement, 3 were reinforced with
glass fiber and three were reinforced with plywood (12mm thickness made from nine
sheets) glued by resorcinol (phenol) adhesive.
Without Reinforcement Six circular holes without any reinforcement were tested by using setups B and C, and
in both cases initial cracks started approximately at (30-35) KN. The failure followed
shortly after that and occurred suddenly. The crack developed and the final failure
occurred when the load reached 35 KN. In figure 3.11 and 3.12 some typical results are
shown. Table 3.4 presents the test results obtained, the loads indicated refer to the shear
force passing the hole.
Figure 3.11 Load vs. crack opening around the hole (left) and load vs. beam deformation (right)
05
1015202530354045
-0.1 0.1 0.3 0.5 0.7 0.9
Load
[KN
]
Deformation [mm]
LBX02A-02-CH1 LBX02A-02-CH2
05
1015202530354045
0 20 40 60 80
Load
[mm
]
Deformation [mm]
LBX02A-02-CH3
13
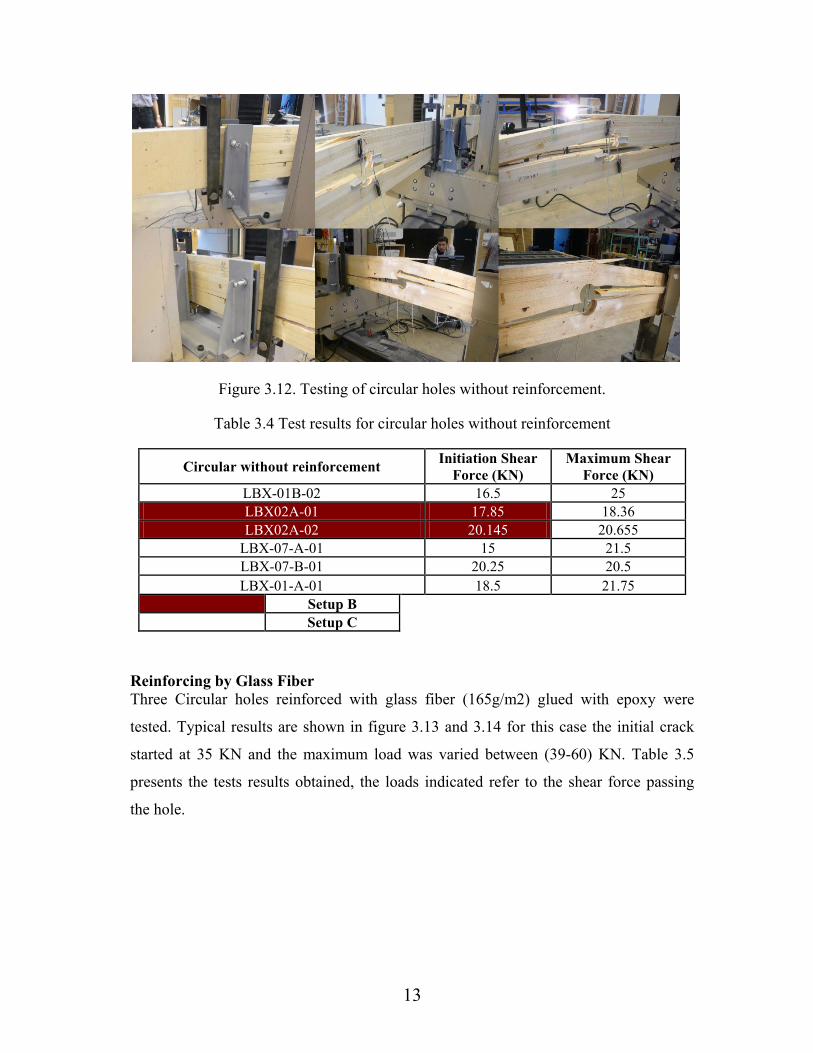
Figure 3.12. Testing of circular holes without reinforcement.
Table 3.4 Test results for circular holes without reinforcement
Circular without reinforcement Initiation Shear Force (KN)
Maximum Shear Force (KN)
LBX-01B-02 16.5 25 LBX02A-01 17.85 18.36 LBX02A-02 20.145 20.655
LBX-07-A-01 15 21.5 LBX-07-B-01 20.25 20.5 LBX-01-A-01 18.5 21.75
Setup B
Setup C
Reinforcing by Glass Fiber Three Circular holes reinforced with glass fiber (165g/m2) glued with epoxy were
tested. Typical results are shown in figure 3.13 and 3.14 for this case the initial crack
started at 35 KN and the maximum load was varied between (39-60) KN. Table 3.5
presents the tests results obtained, the loads indicated refer to the shear force passing
the hole.
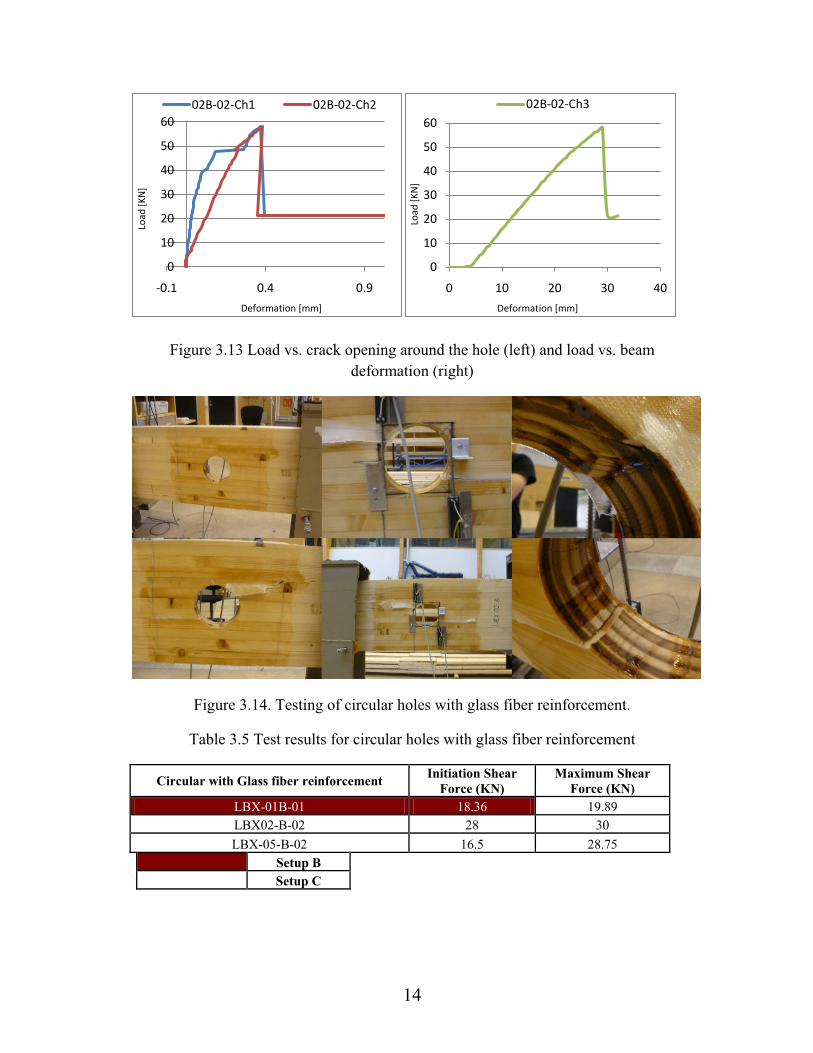
14
Figure 3.13 Load vs. crack opening around the hole (left) and load vs. beam deformation (right)
Figure 3.14. Testing of circular holes with glass fiber reinforcement.
Table 3.5 Test results for circular holes with glass fiber reinforcement
Circular with Glass fiber reinforcement Initiation Shear Force (KN)
Maximum Shear Force (KN)
LBX-01B-01 18.36 19.89 LBX02-B-02 28 30 LBX-05-B-02 16.5 28.75
Setup B
Setup C
0
10
20
30
40
50
60
-0.1 0.4 0.9
Load
[KN
]
Deformation [mm]
02B-02-Ch1 02B-02-Ch2
0
10
20
30
40
50
60
0 10 20 30 40
Load
[KN
]
Deformation [mm]
02B-02-Ch3
15
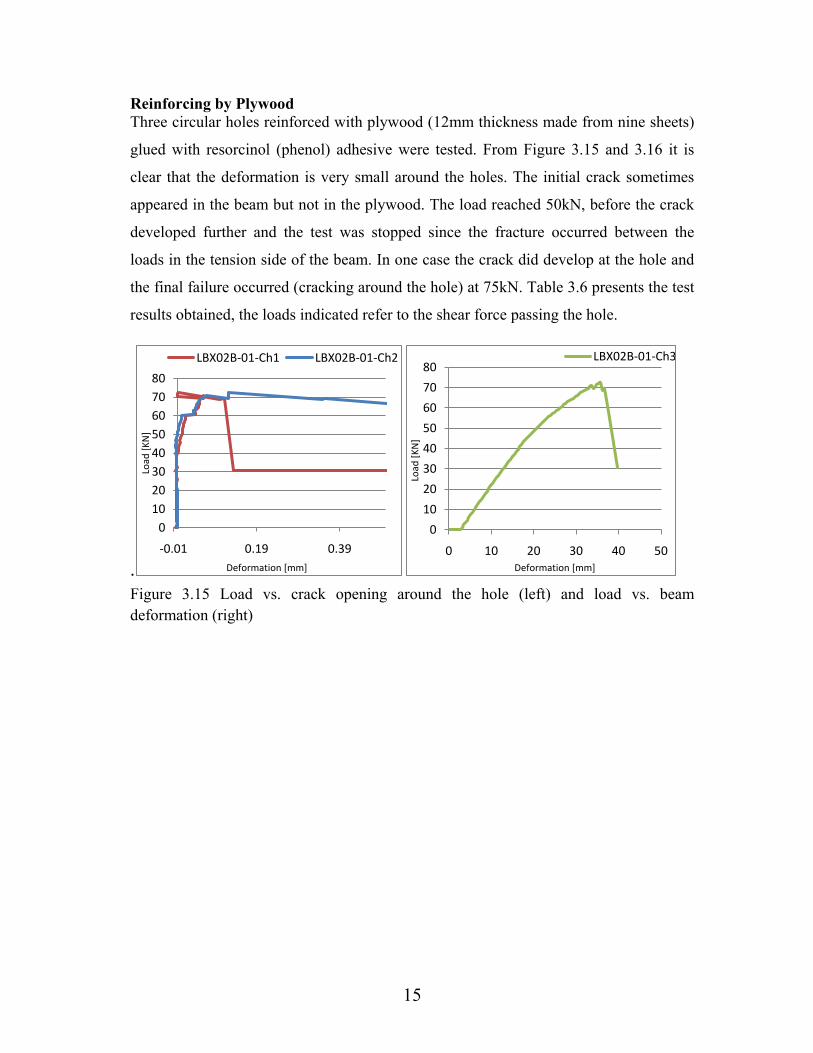
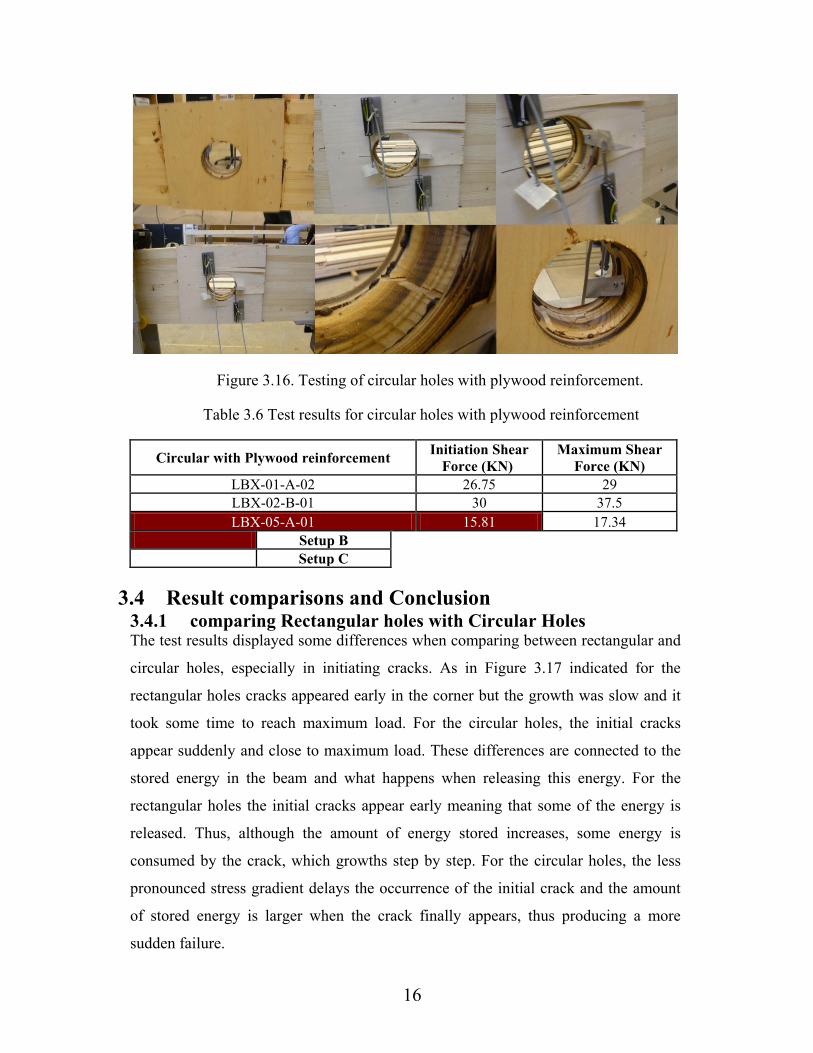
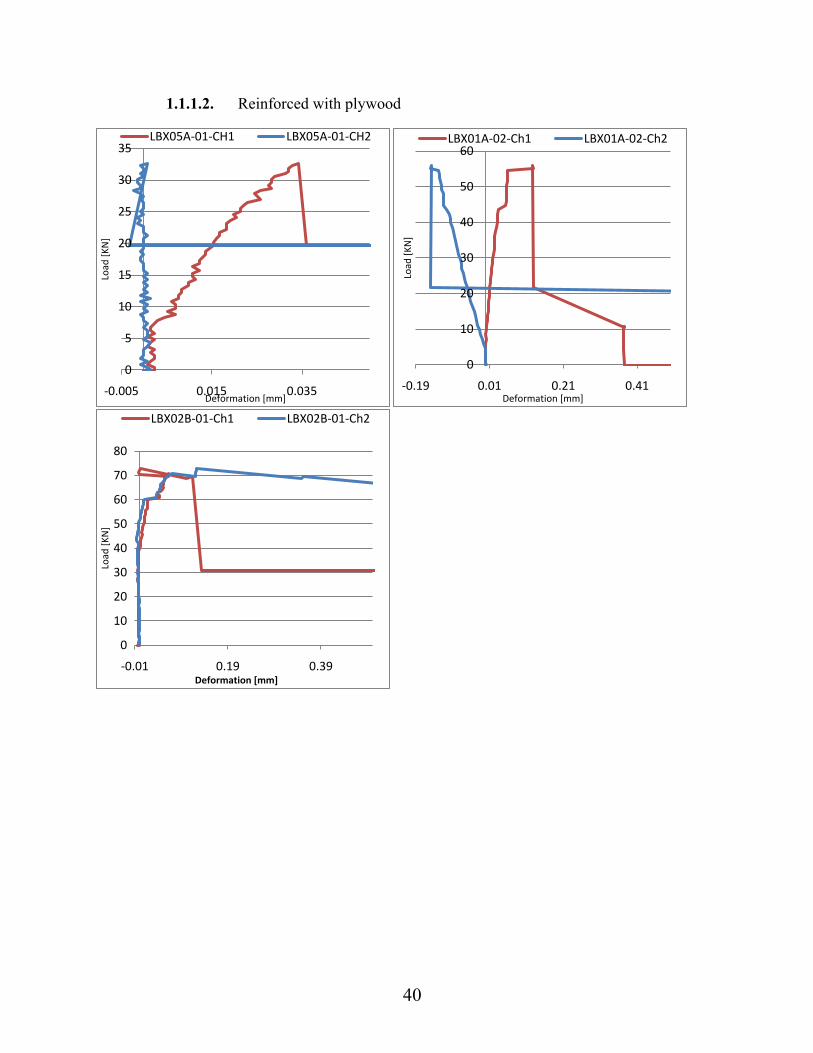
Reinforcing by Plywood Three circular holes reinforced with plywood (12mm thickness made from nine sheets)
glued with resorcinol (phenol) adhesive were tested. From Figure 3.15 and 3.16 it is
clear that the deformation is very small around the holes. The initial crack sometimes
appeared in the beam but not in the plywood. The load reached 50kN, before the crack
developed further and the test was stopped since the fracture occurred between the
loads in the tension side of the beam. In one case the crack did develop at the hole and
the final failure occurred (cracking around the hole) at 75kN. Table 3.6 presents the test
results obtained, the loads indicated refer to the shear force passing the hole.
.Figure 3.15 Load vs. crack opening around the hole (left) and load vs. beam deformation (right)
01020304050607080
-0.01 0.19 0.39
Load
[KN
]
Deformation [mm]
LBX02B-01-Ch1 LBX02B-01-Ch2
0
10
20
30
40
50
60
70
80
0 10 20 30 40 50
Load
[KN
]
Deformation [mm]
LBX02B-01-Ch3
16
Figure 3.16. Testing of circular holes with plywood reinforcement.
Table 3.6 Test results for circular holes with plywood reinforcement
Circular with Plywood reinforcement Initiation Shear Force (KN)
Maximum Shear Force (KN)
LBX-01-A-02 26.75 29 LBX-02-B-01 30 37.5 LBX-05-A-01 15.81 17.34
Setup B Setup C
3.4 Result comparisons and Conclusion
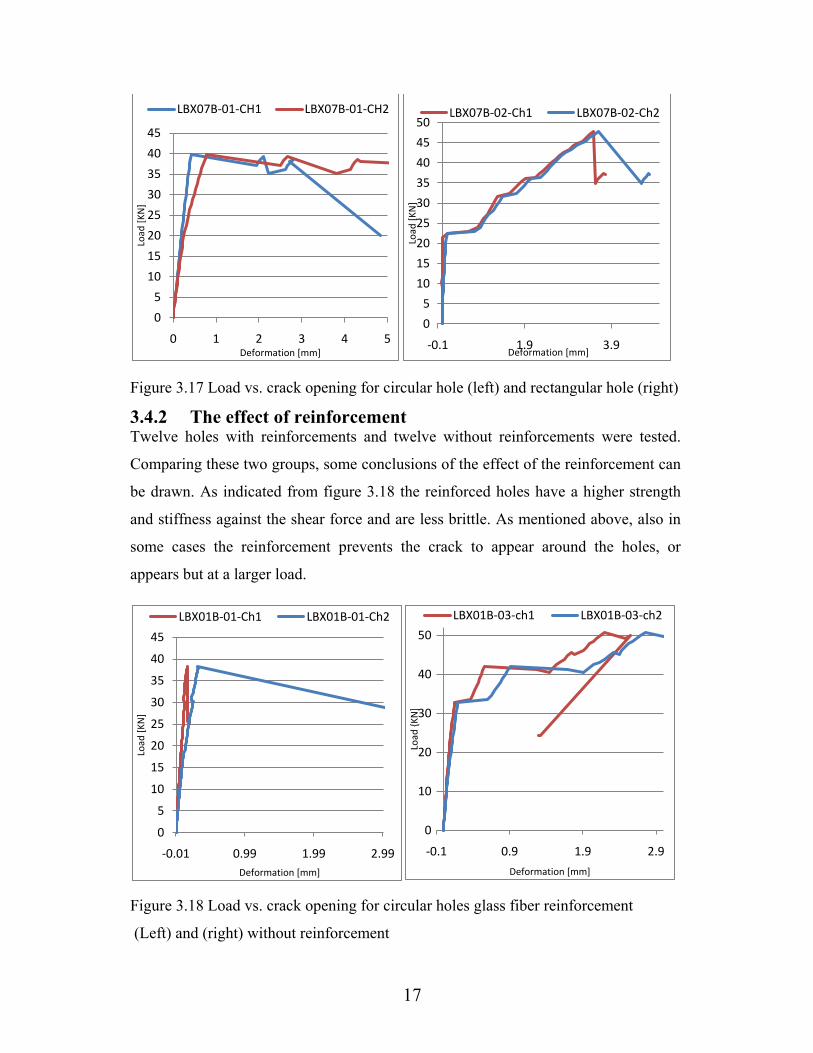
3.4.1 comparing Rectangular holes with Circular Holes The test results displayed some differences when comparing between rectangular and
circular holes, especially in initiating cracks. As in Figure 3.17 indicated for the
rectangular holes cracks appeared early in the corner but the growth was slow and it
took some time to reach maximum load. For the circular holes, the initial cracks
appear suddenly and close to maximum load. These differences are connected to the
stored energy in the beam and what happens when releasing this energy. For the
rectangular holes the initial cracks appear early meaning that some of the energy is
released. Thus, although the amount of energy stored increases, some energy is
consumed by the crack, which growths step by step. For the circular holes, the less
pronounced stress gradient delays the occurrence of the initial crack and the amount
of stored energy is larger when the crack finally appears, thus producing a more
sudden failure.
17
Figure 3.17 Load vs. crack opening for circular hole (left) and rectangular hole (right)
3.4.2 The effect of reinforcement Twelve holes with reinforcements and twelve without reinforcements were tested.
Comparing these two groups, some conclusions of the effect of the reinforcement can
be drawn. As indicated from figure 3.18 the reinforced holes have a higher strength
and stiffness against the shear force and are less brittle. As mentioned above, also in
some cases the reinforcement prevents the crack to appear around the holes, or
appears but at a larger load.
Figure 3.18 Load vs. crack opening for circular holes glass fiber reinforcement
(Left) and (right) without reinforcement
0
5
10
15
20
25
30
35
40
45
0 1 2 3 4 5
Load
[KN
]
Deformation [mm]
LBX07B-01-CH1 LBX07B-01-CH2
0
5
10
15
20
25
30
35
40
45
50
-0.1 1.9 3.9
Load
[KN
]
Deformation [mm]
LBX07B-02-Ch1 LBX07B-02-Ch2
0
5
10
15
20
25
30
35
40
45
-0.01 0.99 1.99 2.99
Load
[KN
]
Deformation [mm]
LBX01B-01-Ch1 LBX01B-01-Ch2
0
10
20
30
40
50
-0.1 0.9 1.9 2.9
Load
{KN
]
Deformation [mm]
LBX01B-03-ch1 LBX01B-03-ch2
18
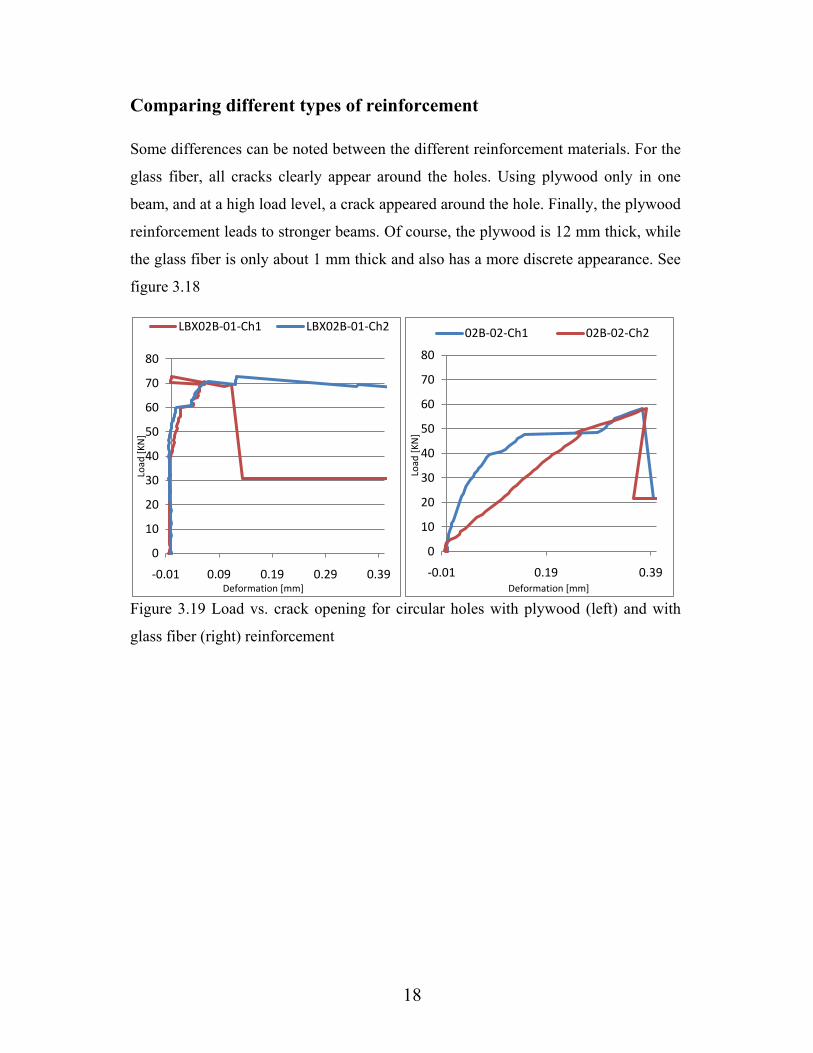
Comparing different types of reinforcement
Some differences can be noted between the different reinforcement materials. For the
glass fiber, all cracks clearly appear around the holes. Using plywood only in one
beam, and at a high load level, a crack appeared around the hole. Finally, the plywood
reinforcement leads to stronger beams. Of course, the plywood is 12 mm thick, while
the glass fiber is only about 1 mm thick and also has a more discrete appearance. See
figure 3.18
Figure 3.19 Load vs. crack opening for circular holes with plywood (left) and with
glass fiber (right) reinforcement
0
10
20
30
40
50
60
70
80
-0.01 0.09 0.19 0.29 0.39
Load
[KN
]
Deformation [mm]
LBX02B-01-Ch1 LBX02B-01-Ch2
0
10
20
30
40
50
60
70
80
-0.01 0.19 0.39
Load
[KN
]
Deformation [mm]
02B-02-Ch1 02B-02-Ch2
19
4. Theoretical Calculation 4.1 Finite Element equation
The below derivation of finite element equations for two-dimension problems follows
closely the one given in Ottosen & Petersson[5]
4.1.1 Equilibrium Equations
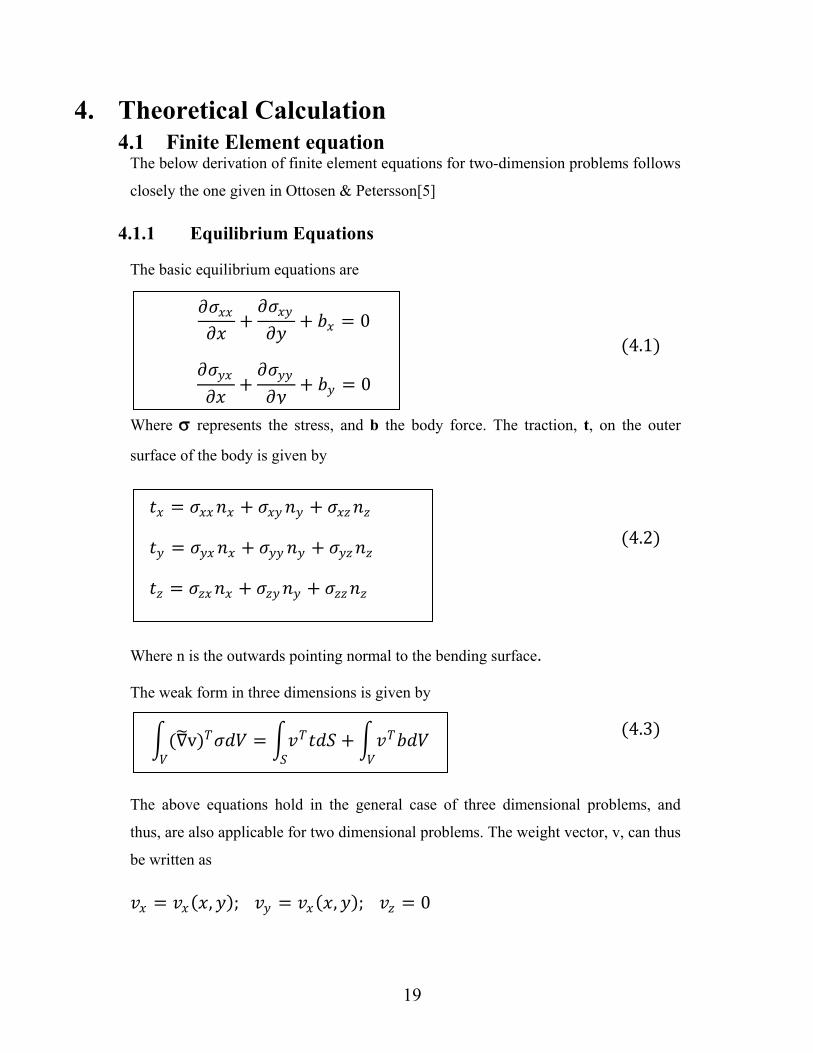
The basic equilibrium equations are
(4.1)
Where σ represents the stress, and b the body force. The traction, t, on the outer
surface of the body is given by
(4.2)
Where n is the outwards pointing normal to the bending surface.
The weak form in three dimensions is given by
(4.3)
The above equations hold in the general case of three dimensional problems, and
thus, are also applicable for two dimensional problems. The weight vector, v, can thus
be written as
𝑣𝑣𝑥𝑥 = 𝑣𝑣𝑥𝑥(𝑥𝑥,𝑦𝑦); 𝑣𝑣𝑦𝑦 = 𝑣𝑣𝑥𝑥(𝑥𝑥,𝑦𝑦); 𝑣𝑣𝑧𝑧 = 0
𝜕𝜕𝜎𝜎𝑥𝑥𝑥𝑥𝜕𝜕𝑥𝑥
+𝜕𝜕𝜎𝜎𝑥𝑥𝑦𝑦𝜕𝜕𝑦𝑦
+ 𝑏𝑏𝑥𝑥 = 0
𝜕𝜕𝜎𝜎𝑦𝑦𝑥𝑥𝜕𝜕𝑥𝑥
+𝜕𝜕𝜎𝜎𝑦𝑦𝑦𝑦𝜕𝜕𝑦𝑦
+ 𝑏𝑏𝑦𝑦 = 0
�(∇�v)𝑇𝑇𝜎𝜎𝜎𝜎𝜎𝜎𝜎𝜎
= �𝑣𝑣𝑇𝑇𝑡𝑡𝜎𝜎𝑡𝑡𝑡𝑡
+ �𝑣𝑣𝑇𝑇𝑏𝑏𝜎𝜎𝜎𝜎𝜎𝜎
𝑡𝑡𝑥𝑥 = 𝜎𝜎𝑥𝑥𝑥𝑥𝑛𝑛𝑥𝑥 + 𝜎𝜎𝑥𝑥𝑦𝑦 𝑛𝑛𝑦𝑦 + 𝜎𝜎𝑥𝑥𝑧𝑧𝑛𝑛𝑧𝑧
𝑡𝑡𝑦𝑦 = 𝜎𝜎𝑦𝑦𝑥𝑥 𝑛𝑛𝑥𝑥 + 𝜎𝜎𝑦𝑦𝑦𝑦 𝑛𝑛𝑦𝑦 + 𝜎𝜎𝑦𝑦𝑧𝑧𝑛𝑛𝑧𝑧
𝑡𝑡𝑧𝑧 = 𝜎𝜎𝑧𝑧𝑥𝑥𝑛𝑛𝑥𝑥 + 𝜎𝜎𝑧𝑧𝑦𝑦𝑛𝑛𝑦𝑦 + 𝜎𝜎𝑧𝑧𝑧𝑧𝑛𝑛𝑧𝑧
20
And we obtain
(∇�𝑣𝑣)𝑇𝑇𝜎𝜎 =𝜕𝜕𝑣𝑣𝑥𝑥𝜕𝜕𝑥𝑥
𝜎𝜎𝑥𝑥𝑥𝑥 +𝜕𝜕𝑣𝑣𝑦𝑦𝜕𝜕𝑦𝑦
𝜎𝜎𝑦𝑦𝑦𝑦 + �𝜕𝜕𝑣𝑣𝑥𝑥𝜕𝜕𝑥𝑥
+𝜕𝜕𝑣𝑣𝑦𝑦𝜕𝜕𝑦𝑦
�𝜎𝜎𝑥𝑥𝑦𝑦 (4.4)
By defining the following matrices
∇�=
⎣⎢⎢⎢⎡𝜕𝜕𝜕𝜕𝑥𝑥
0
0 𝜕𝜕𝜕𝜕𝑦𝑦
𝜕𝜕𝜕𝜕𝑦𝑦
𝜕𝜕𝜕𝜕𝑥𝑥 ⎦⎥⎥⎥⎤
; 𝑣𝑣 = �𝑣𝑣𝑥𝑥𝑣𝑣𝑦𝑦�; 𝜎𝜎 = �
𝜎𝜎𝑥𝑥𝑥𝑥𝜎𝜎𝑦𝑦𝑦𝑦𝜎𝜎𝑥𝑥𝑦𝑦
� (4.5)
We can, from the definition of ∇� note that it also can be used for plane strain. We
define furthermore:
𝑡𝑡 = �𝑡𝑡𝑥𝑥𝑡𝑡𝑦𝑦�; 𝐛𝐛 = �
𝑏𝑏𝑥𝑥𝑏𝑏𝑦𝑦�; (4.6)
With the definitions of matrices in 4.5 and 4.6 the weak form in equation 3.3 becomes
Here we can note that equation 4.7 look as equation 4.3 but with different definitions
for 𝐯𝐯,𝛁𝛁�,𝝈𝝈, 𝐭𝐭 𝑎𝑎𝑛𝑛𝜎𝜎 𝒃𝒃 as defined in 4.5 and 4.6
y z
Y
ℒ
x
Figure (4.1)
�(∇�v)𝑇𝑇𝜎𝜎𝜎𝜎𝑣𝑣𝜎𝜎
= �v𝑇𝑇𝐭𝐭 𝜎𝜎𝑡𝑡𝑡𝑡
+ �v𝑇𝑇𝑏𝑏𝜎𝜎𝑣𝑣𝜎𝜎
(4.7)
t A
b) Illustration of upper surface S+, lower surface S- and thickness t
(a) Region A and boundary ℒ for two dimensions
S+
S-
21
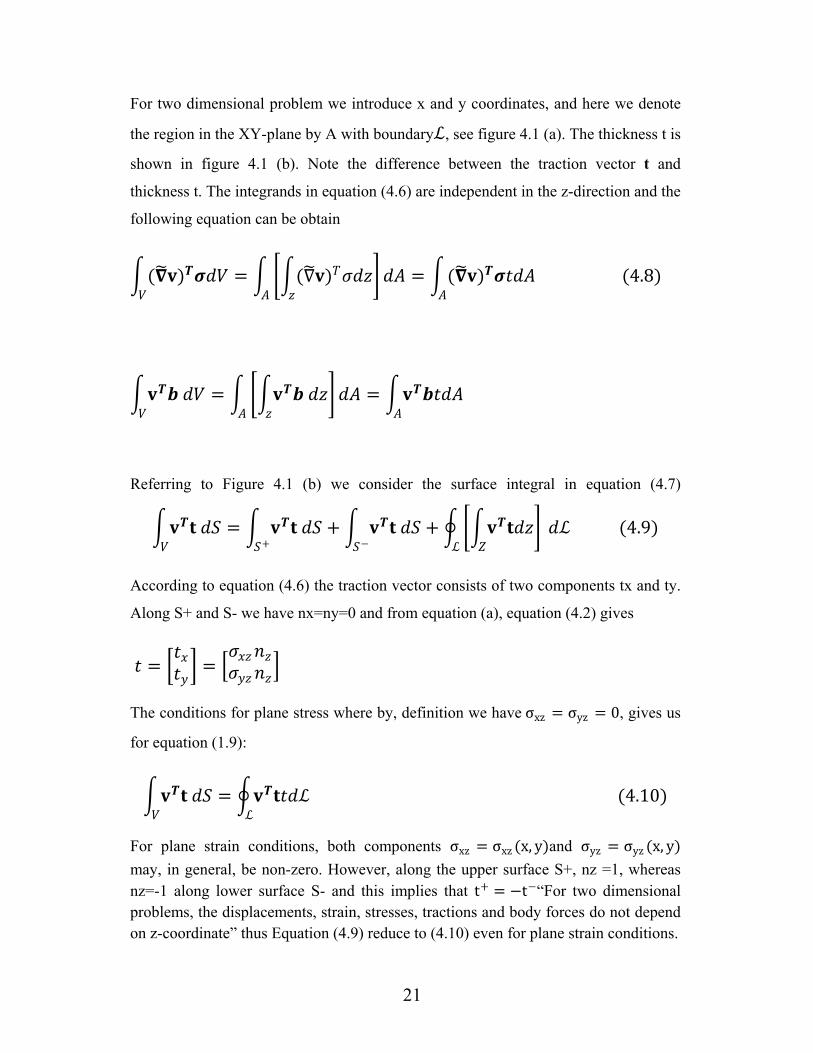
For two dimensional problem we introduce x and y coordinates, and here we denote
the region in the XY-plane by A with boundaryℒ, see figure 4.1 (a). The thickness t is
shown in figure 4.1 (b). Note the difference between the traction vector t and
thickness t. The integrands in equation (4.6) are independent in the z-direction and the
following equation can be obtain
�(𝛁𝛁�𝐯𝐯)𝑻𝑻𝝈𝝈𝜎𝜎𝜎𝜎𝜎𝜎
= � ��(∇�𝐯𝐯)𝑇𝑇𝜎𝜎𝜎𝜎𝑧𝑧𝑧𝑧
� 𝜎𝜎𝑑𝑑𝑑𝑑
= �(𝛁𝛁�𝐯𝐯)𝑻𝑻𝝈𝝈𝑡𝑡𝜎𝜎𝑑𝑑 (4.8)𝑑𝑑
�𝐯𝐯𝑻𝑻𝒃𝒃 𝜎𝜎𝜎𝜎𝜎𝜎
= � ��𝐯𝐯𝑻𝑻𝒃𝒃 𝜎𝜎𝑧𝑧𝑧𝑧
� 𝜎𝜎𝑑𝑑𝑑𝑑
= �𝐯𝐯𝑻𝑻𝒃𝒃𝑡𝑡𝜎𝜎𝑑𝑑𝑑𝑑
Referring to Figure 4.1 (b) we consider the surface integral in equation (4.7)
�𝐯𝐯𝑻𝑻𝐭𝐭 𝜎𝜎𝑡𝑡𝜎𝜎
= � 𝐯𝐯𝑻𝑻𝐭𝐭 𝜎𝜎𝑡𝑡𝑡𝑡+
+ � 𝐯𝐯𝑻𝑻𝐭𝐭 𝜎𝜎𝑡𝑡𝑡𝑡−
+ � ��𝐯𝐯𝑻𝑻𝐭𝐭𝜎𝜎𝑧𝑧𝑍𝑍
� 𝜎𝜎ℒℒ
(4.9)
According to equation (4.6) the traction vector consists of two components tx and ty.
Along S+ and S- we have nx=ny=0 and from equation (a), equation (4.2) gives
𝑡𝑡 = �𝑡𝑡𝑥𝑥𝑡𝑡𝑦𝑦� = �
𝜎𝜎𝑥𝑥𝑧𝑧𝑛𝑛𝑧𝑧𝜎𝜎𝑦𝑦𝑧𝑧𝑛𝑛𝑧𝑧�
The conditions for plane stress where by, definition we have σxz = σyz = 0, gives us
for equation (1.9):
�𝐯𝐯𝑻𝑻𝐭𝐭 𝜎𝜎𝑡𝑡𝜎𝜎
= �𝐯𝐯𝑻𝑻𝐭𝐭𝑡𝑡𝜎𝜎ℒ (4.10)ℒ
For plane strain conditions, both components σxz = σxz (x, y)and σyz = σyz (x, y) may, in general, be non-zero. However, along the upper surface S+, nz =1, whereas nz=-1 along lower surface S- and this implies that t+ = −t−“For two dimensional problems, the displacements, strain, stresses, tractions and body forces do not depend on z-coordinate” thus Equation (4.9) reduce to (4.10) even for plane strain conditions.
22
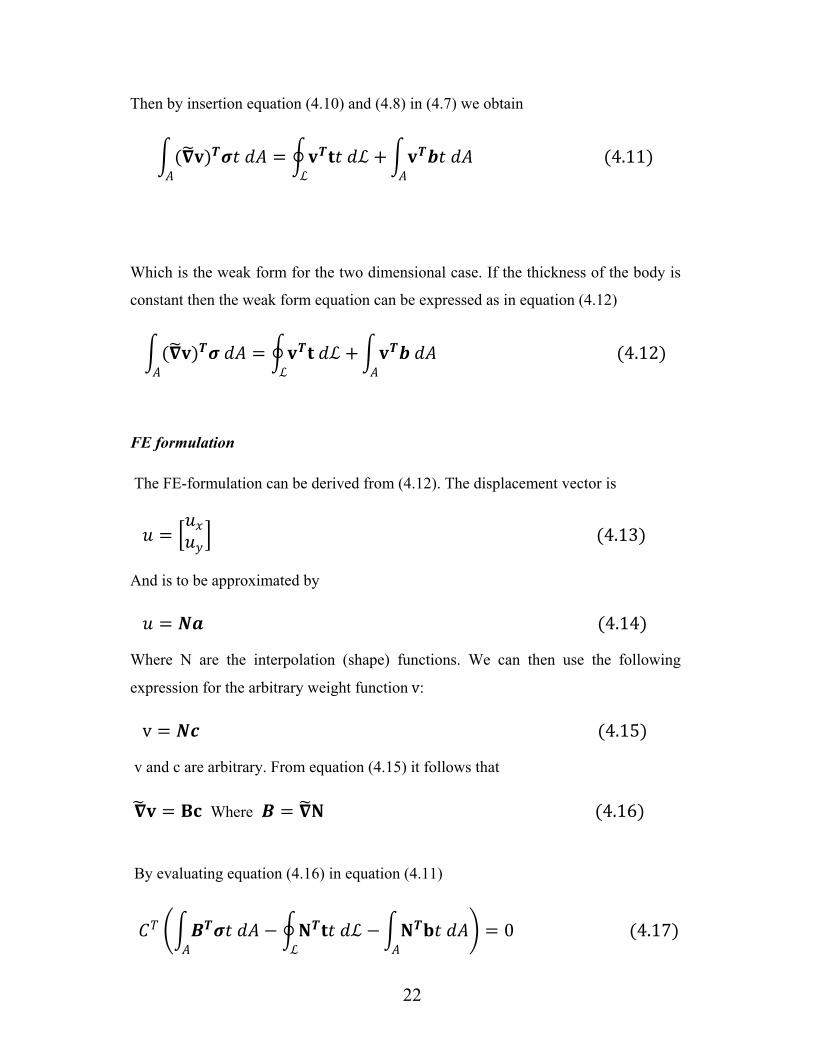
Then by insertion equation (4.10) and (4.8) in (4.7) we obtain
�(𝛁𝛁�𝐯𝐯)𝑻𝑻𝝈𝝈𝑡𝑡 𝜎𝜎𝑑𝑑𝑑𝑑
= �𝐯𝐯𝑻𝑻𝐭𝐭𝑡𝑡 𝜎𝜎ℒ +ℒ
�𝐯𝐯𝑻𝑻𝒃𝒃𝑡𝑡 𝜎𝜎𝑑𝑑𝑑𝑑
(4.11)
Which is the weak form for the two dimensional case. If the thickness of the body is
constant then the weak form equation can be expressed as in equation (4.12)
�(𝛁𝛁�𝐯𝐯)𝑻𝑻𝝈𝝈 𝜎𝜎𝑑𝑑𝑑𝑑
= �𝐯𝐯𝑻𝑻𝐭𝐭 𝜎𝜎ℒ +ℒ
�𝐯𝐯𝑻𝑻𝒃𝒃 𝜎𝜎𝑑𝑑𝑑𝑑
(4.12)
FE formulation
The FE-formulation can be derived from (4.12). The displacement vector is
𝑢𝑢 = �𝑢𝑢𝑥𝑥𝑢𝑢𝑦𝑦� (4.13)
And is to be approximated by
𝑢𝑢 = 𝑵𝑵𝑵𝑵 (4.14)
Where N are the interpolation (shape) functions. We can then use the following
expression for the arbitrary weight function v:
v = 𝑵𝑵𝑵𝑵 (4.15)
v and c are arbitrary. From equation (4.15) it follows that
𝛁𝛁�𝐯𝐯 = 𝐁𝐁𝐁𝐁 Where 𝑩𝑩 = 𝛁𝛁�𝐍𝐍 (4.16)
By evaluating equation (4.16) in equation (4.11)
𝐶𝐶𝑇𝑇 ��𝑩𝑩𝑻𝑻𝝈𝝈𝑡𝑡 𝜎𝜎𝑑𝑑𝑑𝑑
− �𝐍𝐍𝑻𝑻𝐭𝐭𝑡𝑡 𝜎𝜎ℒ −ℒ
�𝐍𝐍𝑻𝑻𝐛𝐛𝑡𝑡 𝜎𝜎𝑑𝑑𝑑𝑑
� = 0 (4.17)
23
As the c- matrix is arbitrary, we can conclude that
(4.18)
Plane strain can be formulated as
(4.19)
Where
𝜎𝜎 = �𝜎𝜎𝑥𝑥𝑥𝑥𝜎𝜎𝑦𝑦𝑦𝑦𝜎𝜎𝑥𝑥𝑦𝑦
�; 𝜀𝜀 = �𝜀𝜀𝑥𝑥𝑥𝑥𝜀𝜀𝑦𝑦𝑦𝑦𝜀𝜀𝑥𝑥𝑦𝑦
� (4.20)
By using the kinematic relation for strain ε we can derive from displacement
𝜺𝜺 = 𝛁𝛁�𝐮𝐮
From equation 4.14 and 4.16 we obtain
𝜺𝜺 = 𝑩𝑩𝑵𝑵 (4.21)
By inserting the value of 𝛆𝛆 into equation (4.19) the result is
𝝈𝝈 = 𝐃𝐃𝐁𝐁𝐃𝐃 (4.22)
By inserting equation (4.22) into equation (4.17) we obtain
The unit vector n, which is normal to the boundary of the body, bounded by ℒ and is
located in the xy-plane. The traction vector t along ℒ is given by equation (4.6).
Thus, the traction boundary conditions, equation (4.2), can be written as
�𝑩𝑩𝑻𝑻𝝈𝝈𝑡𝑡 𝜎𝜎𝑑𝑑𝑑𝑑
= �𝐍𝐍𝑻𝑻𝐭𝐭𝑡𝑡 𝜎𝜎ℒ +ℒ
�𝐍𝐍𝑻𝑻𝐛𝐛𝑡𝑡 𝜎𝜎𝑑𝑑 𝑑𝑑
𝝈𝝈 = 𝐃𝐃𝜀𝜀
��𝑩𝑩𝑻𝑻𝐃𝐃𝐁𝐁𝑡𝑡 𝜎𝜎𝑑𝑑𝑑𝑑
� 𝑎𝑎 = �𝐍𝐍𝑻𝑻𝐭𝐭𝑡𝑡 𝜎𝜎ℒ +ℒ
�𝐍𝐍𝑻𝑻𝐛𝐛𝑡𝑡 𝜎𝜎𝑑𝑑 (4.23) 𝑑𝑑
24
t = 𝑡𝑡𝑛𝑛 (4.24)
Where
𝑡𝑡 = �𝜎𝜎𝑥𝑥𝑥𝑥 𝜎𝜎𝑥𝑥𝑦𝑦𝜎𝜎𝑦𝑦𝑥𝑥 𝜎𝜎𝑦𝑦𝑦𝑦 � 𝑛𝑛 = �
𝑛𝑛𝑥𝑥𝑛𝑛𝑦𝑦� (4.25)
Thus all boundary conditions can be expressed as
(4.26)
Where h and g are known vectors.
(4.27)
𝐭𝐭 = 𝐒𝐒𝐒𝐒 = 𝐡𝐡 On ℒh
𝐮𝐮 = 𝐠𝐠 On ℒg
��𝑩𝑩𝑻𝑻𝐃𝐃𝐁𝐁𝑡𝑡 𝜎𝜎𝑑𝑑𝑑𝑑
�𝑵𝑵 = � 𝐍𝐍𝑻𝑻𝐡𝐡𝑡𝑡 𝜎𝜎ℒ +ℒh
� 𝐍𝐍𝑻𝑻𝐭𝐭𝑡𝑡 𝜎𝜎ℒℒg
+ �𝐍𝐍𝑻𝑻𝐛𝐛𝑡𝑡 𝜎𝜎𝑑𝑑𝑑𝑑
𝐾𝐾 = �𝑩𝑩𝑻𝑻𝐃𝐃𝐁𝐁𝑡𝑡 𝜎𝜎𝑑𝑑𝑑𝑑
fb = � 𝐍𝐍𝑻𝑻𝐡𝐡𝑡𝑡 𝜎𝜎ℒ +ℒh
� 𝐍𝐍𝑻𝑻𝐭𝐭𝑡𝑡 𝜎𝜎ℒℒg
fl = ∫ 𝐍𝐍𝑻𝑻𝐛𝐛𝑡𝑡 𝜎𝜎𝑑𝑑𝑑𝑑
25
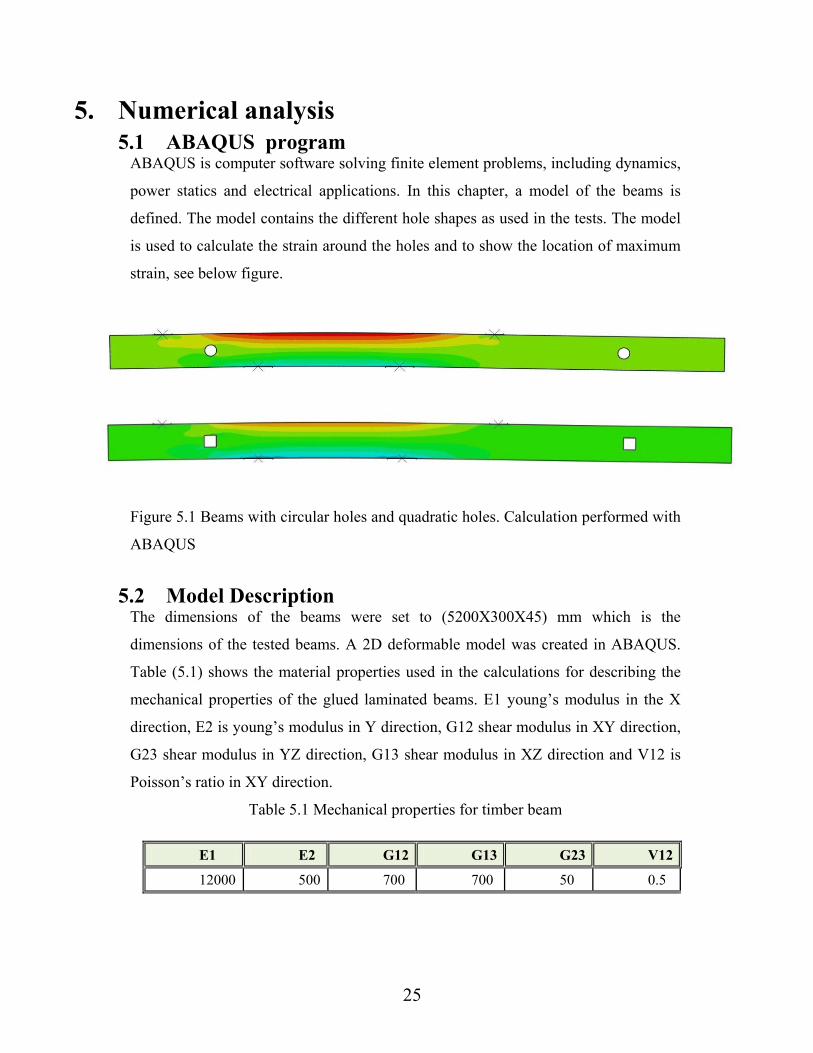
5. Numerical analysis 5.1 ABAQUS program
ABAQUS is computer software solving finite element problems, including dynamics,
power statics and electrical applications. In this chapter, a model of the beams is
defined. The model contains the different hole shapes as used in the tests. The model
is used to calculate the strain around the holes and to show the location of maximum
strain, see below figure.
Figure 5.1 Beams with circular holes and quadratic holes. Calculation performed with
ABAQUS
5.2 Model Description The dimensions of the beams were set to (5200X300X45) mm which is the
dimensions of the tested beams. A 2D deformable model was created in ABAQUS.
Table (5.1) shows the material properties used in the calculations for describing the
mechanical properties of the glued laminated beams. E1 young’s modulus in the X
direction, E2 is young’s modulus in Y direction, G12 shear modulus in XY direction,
G23 shear modulus in YZ direction, G13 shear modulus in XZ direction and V12 is
Poisson’s ratio in XY direction.
Table 5.1 Mechanical properties for timber beam
E1 E2 G12 G13 G23 V12
12000 500 700 700 50 0.5
26
Two rigid bodies, 150mm in length, were used to model the supports. The rigid body
reference points were used to apply boundary conditions. The beams are simply
supported, and thus, at the reference points, one side has zero displacement in X and
Y directions and the other has zero displacement in the Y direction. Both supports
were free to rotate. Two other rigid bodies, 240mm in length, were used to model the
plates used in the tests for applying the loads. The interaction between the rigid plates
and the beam was modeled with friction, and the coefficient of friction was set to 0.3.
After defining the local orientation of the material, the interaction between the rigid
bodies and the beam and meshing, the model is ready for solving
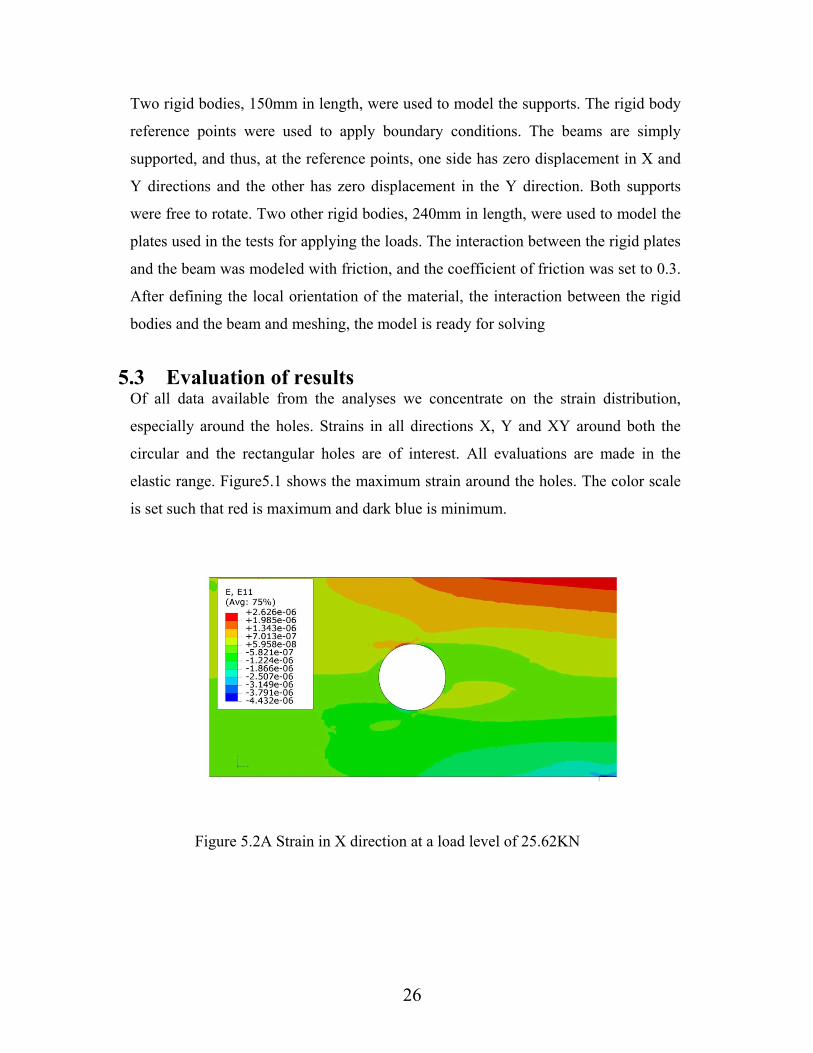
5.3 Evaluation of results
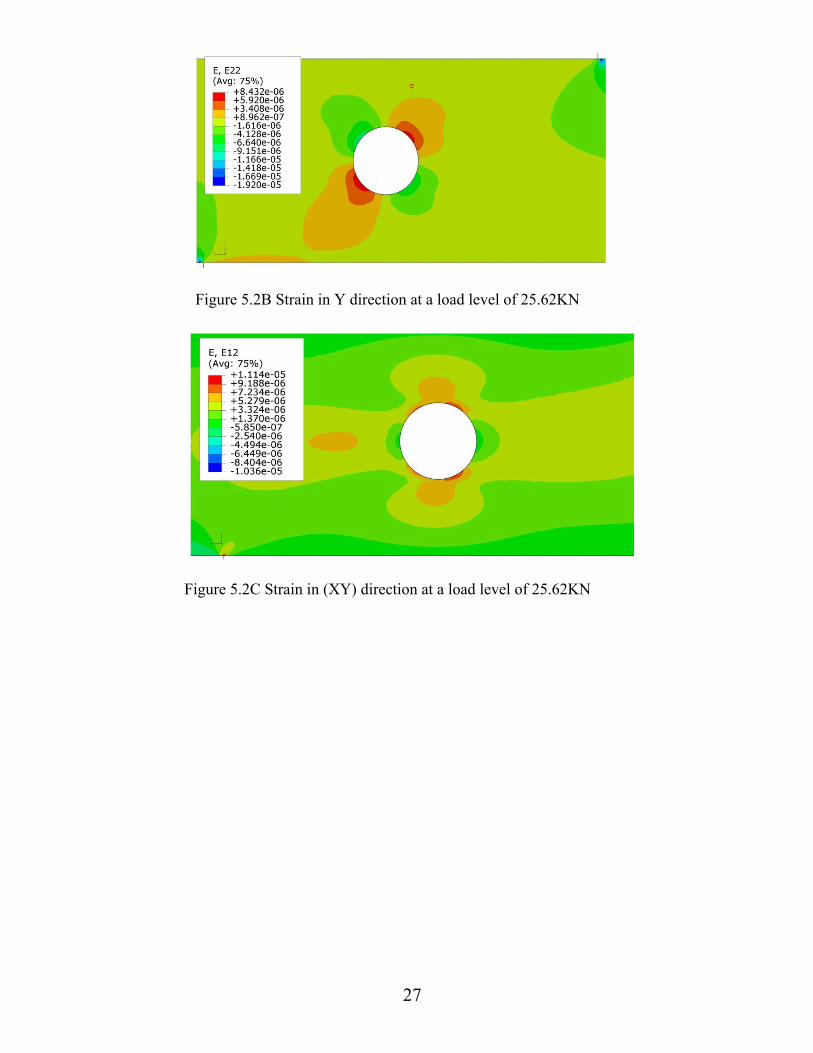
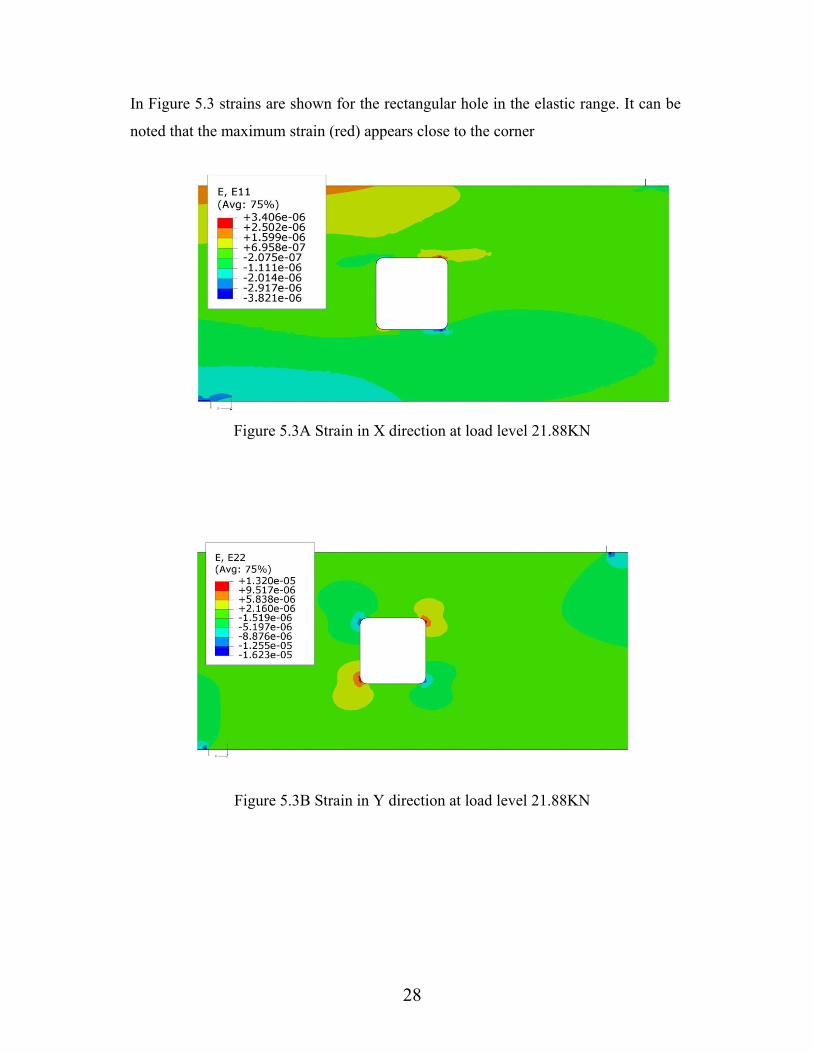
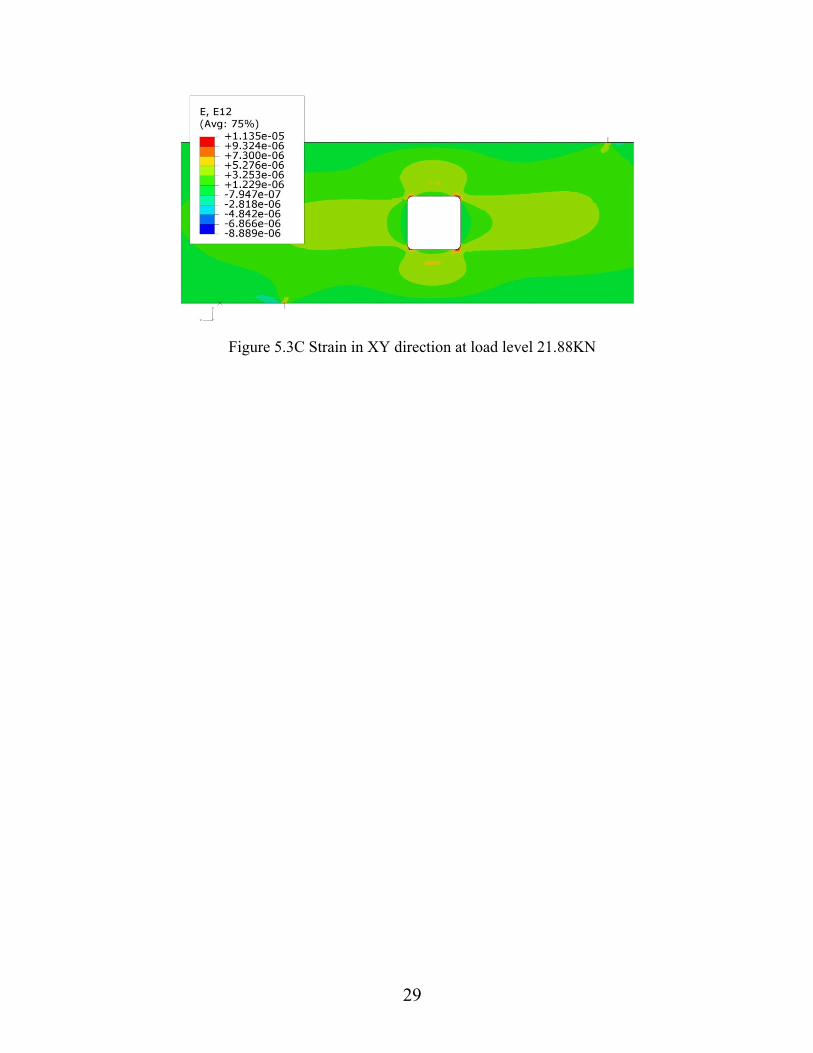
Of all data available from the analyses we concentrate on the strain distribution,
especially around the holes. Strains in all directions X, Y and XY around both the
circular and the rectangular holes are of interest. All evaluations are made in the
elastic range. Figure5.1 shows the maximum strain around the holes. The color scale
is set such that red is maximum and dark blue is minimum.
Figure 5.2A Strain in X direction at a load level of 25.62KN
27
Figure 5.2B Strain in Y direction at a load level of 25.62KN
Figure 5.2C Strain in (XY) direction at a load level of 25.62KN
28
In Figure 5.3 strains are shown for the rectangular hole in the elastic range. It can be
noted that the maximum strain (red) appears close to the corner
Figure 5.3A Strain in X direction at load level 21.88KN
Figure 5.3B Strain in Y direction at load level 21.88KN
29
Figure 5.3C Strain in XY direction at load level 21.88KN
30
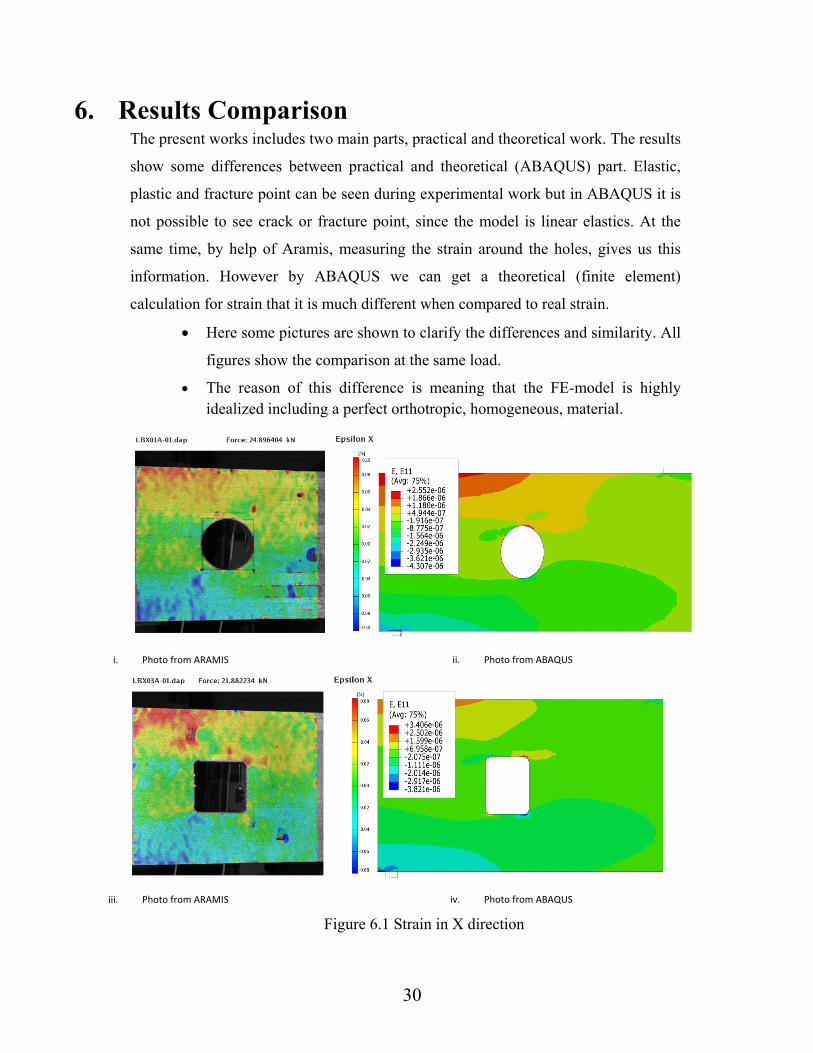
6. Results Comparison The present works includes two main parts, practical and theoretical work. The results
show some differences between practical and theoretical (ABAQUS) part. Elastic,
plastic and fracture point can be seen during experimental work but in ABAQUS it is
not possible to see crack or fracture point, since the model is linear elastics. At the
same time, by help of Aramis, measuring the strain around the holes, gives us this
information. However by ABAQUS we can get a theoretical (finite element)
calculation for strain that it is much different when compared to real strain.
• Here some pictures are shown to clarify the differences and similarity. All
figures show the comparison at the same load.
• The reason of this difference is meaning that the FE-model is highly idealized including a perfect orthotropic, homogeneous, material.
i. Photo from ARAMIS ii. Photo from ABAQUS
iii. Photo from ARAMIS iv. Photo from ABAQUS
Figure 6.1 Strain in X direction
31
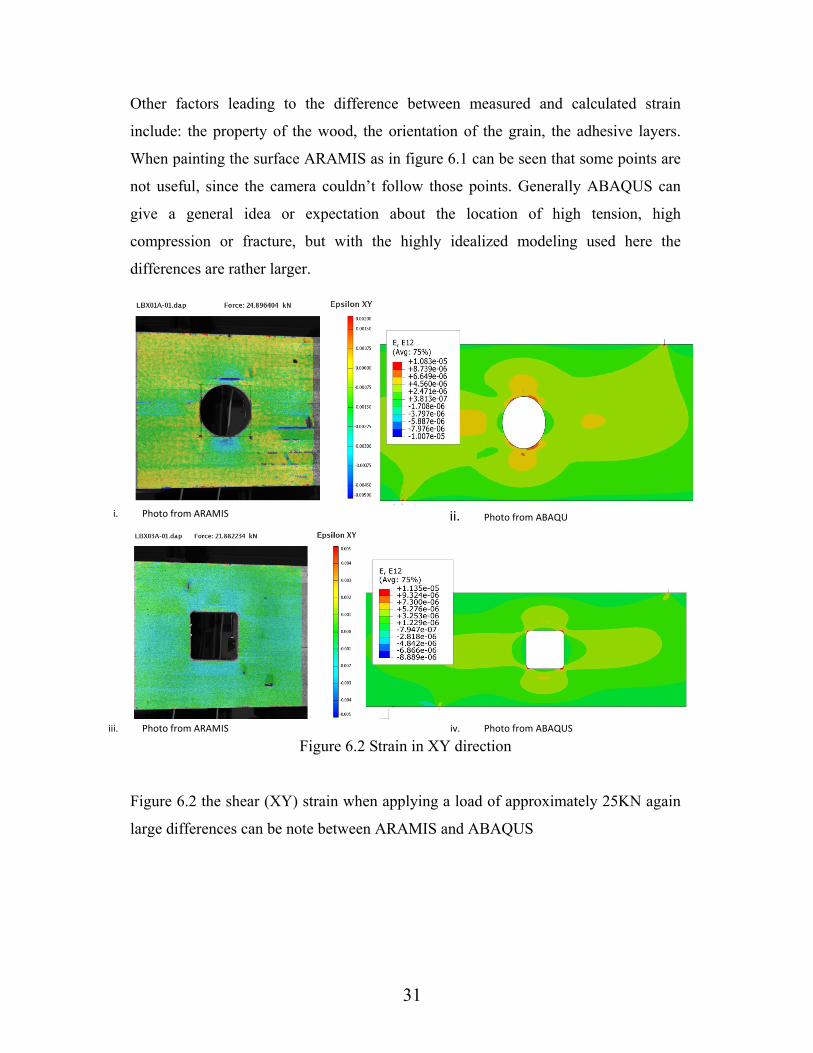
Other factors leading to the difference between measured and calculated strain
include: the property of the wood, the orientation of the grain, the adhesive layers.
When painting the surface ARAMIS as in figure 6.1 can be seen that some points are
not useful, since the camera couldn’t follow those points. Generally ABAQUS can
give a general idea or expectation about the location of high tension, high
compression or fracture, but with the highly idealized modeling used here the
differences are rather larger.
i. Photo from ARAMIS ii. Photo from ABAQU
iii. Photo from ARAMIS iv. Photo from ABAQUS
Figure 6.2 Strain in XY direction
Figure 6.2 the shear (XY) strain when applying a load of approximately 25KN again
large differences can be note between ARAMIS and ABAQUS
32
i. Photo from ARAMIS ii. Photo from ABAQUS
i. Photo from ARAMIS ii. Photo from ABAQUS
Figure 6.3 Strain in Y direction
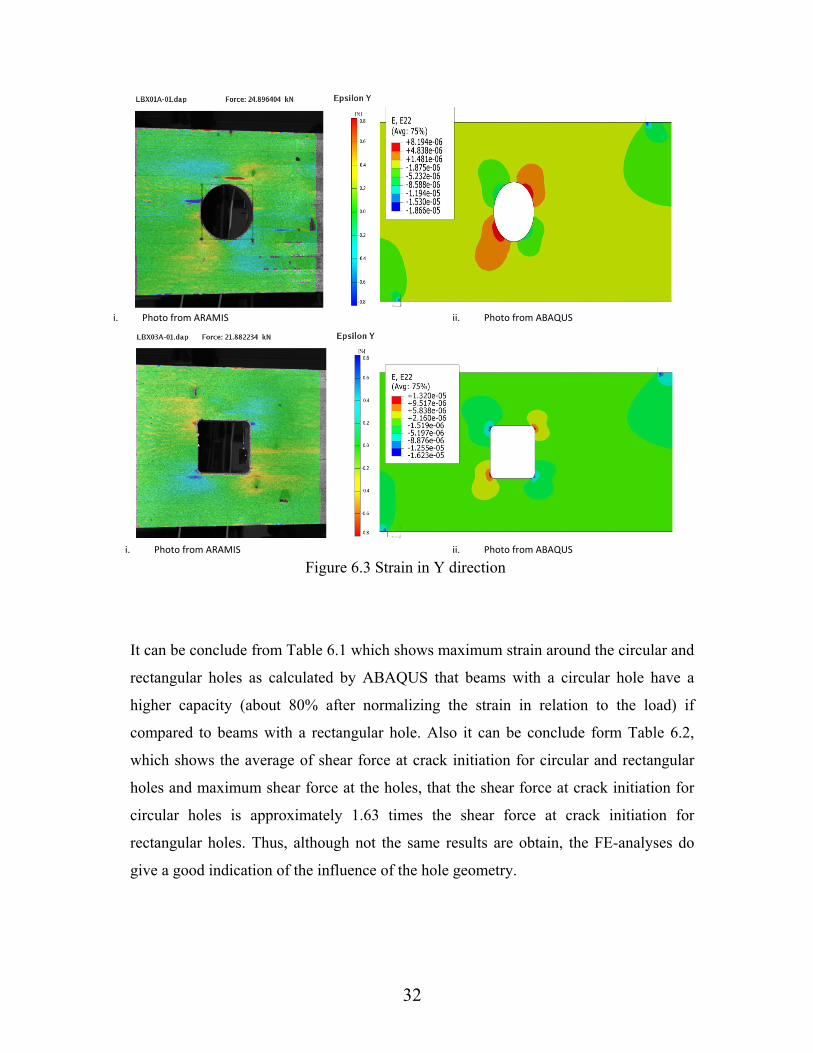
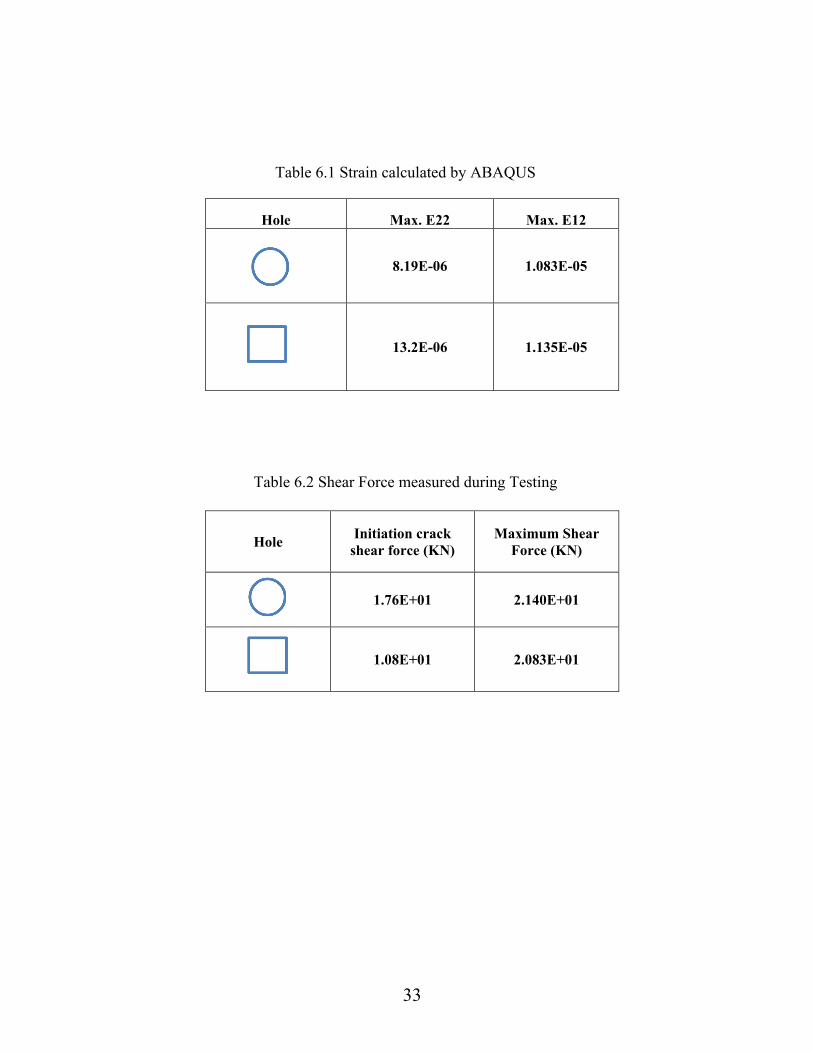
It can be conclude from Table 6.1 which shows maximum strain around the circular and
rectangular holes as calculated by ABAQUS that beams with a circular hole have a
higher capacity (about 80% after normalizing the strain in relation to the load) if
compared to beams with a rectangular hole. Also it can be conclude form Table 6.2,
which shows the average of shear force at crack initiation for circular and rectangular
holes and maximum shear force at the holes, that the shear force at crack initiation for
circular holes is approximately 1.63 times the shear force at crack initiation for
rectangular holes. Thus, although not the same results are obtain, the FE-analyses do
give a good indication of the influence of the hole geometry.
33
Table 6.1 Strain calculated by ABAQUS
Table 6.2 Shear Force measured during Testing
Hole Initiation crack
shear force (KN) Maximum Shear
Force (KN)
1.76E+01 2.140E+01
1.08E+01 2.083E+01
Hole Max. E22 Max. E12
8.19E-06 1.083E-05
13.2E-06 1.135E-05
34
7. Concluding Remarks The present thesis has shown the differences between hole geometry and type of
reinforcement, and also the effect of using reinforcement on the beams. These
parameters have an effect on the crack initiation around the holes. From our work we
can say that cracking depends upon:
I. Hole geometry
II. Using reinforcement or not.
III. Type of reinforcement
IV. Test setup
V. Beam properties.
For rectangular holes the initial crack appeared at approximately 50% of maximum
load due to the sharp corner .These make cracking start early and prevents the energy
being stored. However for circular holes, the time between initial crack and final
failure is short. The reason is that the circular hole prevents early cracking. This
results in more energy being stored around the holes and causes a sudden crack.
The different types of reinforcement used to increase the strength and stiffness and
the brittleness of the glued laminated beams worked well. Using glass fiber (1 mm
thickness) the crack appeared around the holes at lower loads when comparing with
plywood reinforcement. However, the glass fiber is more acceptable from an
aesthetical point of view. Finally the ABAQUS software results show different results
when comparing to the experimental results because of.
I. Material in homogeneities
II. Variability in mechanical properties.
III. Simplified modeling (linear elastic)
35
8. References [1] Bengtsson S., Dahl G.
Inverkan av hål nära upplag påa hållfastheten hos limträbalkar. (In Swedish) (Influence of holes near support on the strength of glulam beams.) Master’s Thesis, Byggnadsteknik II, LTH, Lund University, 1971
[2] Kolb H., Frech P.
Untersuchungen an durchbrochenen Bindern aus Brettschichtholz. (In German) (Analyses of glulam beams with holes.) Holz als Roh- und Werkstoff 35, p. 125-134, 1977.
[3] Penttala V.
Reiällinen liimapuupalkki. (In Finnish) (Glulam beams with holes.) Publication 33, Division of Structural Engineering, Helsinki Univeristy of Technology, Otaniemi, 1980.
[4] Hallström S.
Glass fibre reinforcement around holes in laminated timber beams. Report 95-14, Department of Lightweight Structures, Royal Institute of Technology (KTH), Stockholm, 1995
[5] Niels Ottosen & Hans Petersson, Introduction to the FINITE ELEMENT METHOD, University of Lund, Sweden, p. 299-304,1992.

36
9. Appendix
37
1. Charts
38
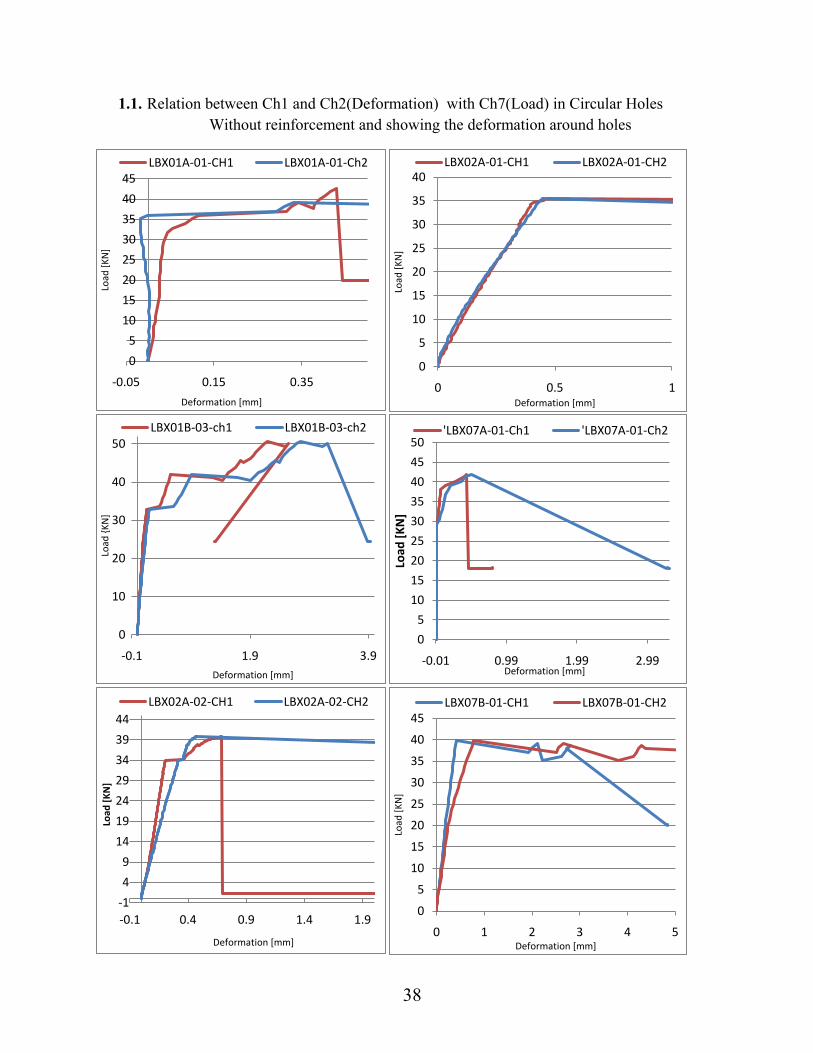
1.1. Relation between Ch1 and Ch2(Deformation) with Ch7(Load) in Circular Holes Without reinforcement and showing the deformation around holes
0
5
10
15
20
25
30
35
40
45
-0.05 0.15 0.35
Load
[KN
]
Deformation [mm]
LBX01A-01-CH1 LBX01A-01-Ch2
0
5
10
15
20
25
30
35
40
0 0.5 1Lo
ad [K
N]
Deformation [mm]
LBX02A-01-CH1 LBX02A-01-CH2
0
10
20
30
40
50
-0.1 1.9 3.9
Load
{KN
]
Deformation [mm]
LBX01B-03-ch1 LBX01B-03-ch2
0
5
10
15
20
25
30
35
40
45
50
-0.01 0.99 1.99 2.99
Load
[KN
]
Deformation [mm]
'LBX07A-01-Ch1 'LBX07A-01-Ch2
-1
4
9
14
19
24
29
34
39
44
-0.1 0.4 0.9 1.4 1.9
Load
[KN
]
Deformation [mm]
LBX02A-02-CH1 LBX02A-02-CH2
0
5
10
15
20
25
30
35
40
45
0 1 2 3 4 5
Load
[KN
]
Deformation [mm]
LBX07B-01-CH1 LBX07B-01-CH2
39
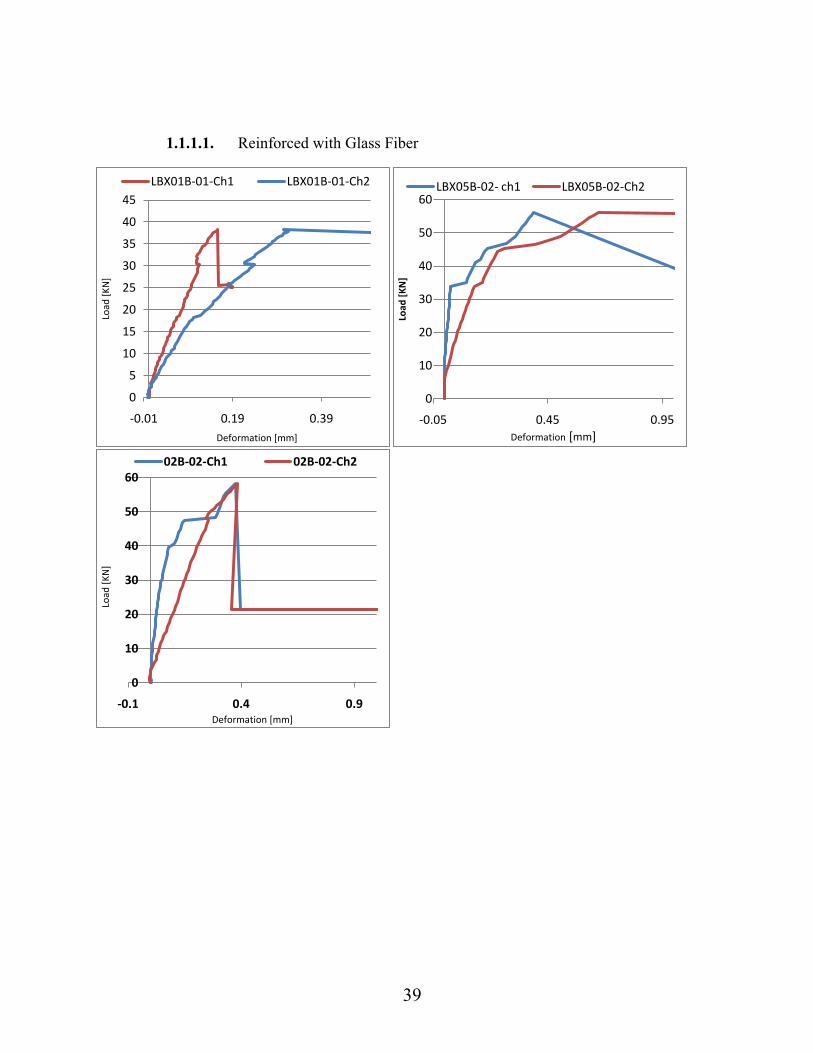
1.1.1.1. Reinforced with Glass Fiber
0
5
10
15
20
25
30
35
40
45
-0.01 0.19 0.39
Load
[KN
]
Deformation [mm]
LBX01B-01-Ch1 LBX01B-01-Ch2
0
10
20
30
40
50
60
-0.05 0.45 0.95Lo
ad [K
N]
Deformation [mm]
LBX05B-02- ch1 LBX05B-02-Ch2
0
10
20
30
40
50
60
-0.1 0.4 0.9
Load
[KN
]
Deformation [mm]
02B-02-Ch1 02B-02-Ch2
40
1.1.1.2. Reinforced with plywood
0
5
10
15
20
25
30
35
-0.005 0.015 0.035
Load
[KN
]
Deformation [mm]
LBX05A-01-CH1 LBX05A-01-CH2
0
10
20
30
40
50
60
-0.19 0.01 0.21 0.41
Load
[KN
]Deformation [mm]
LBX01A-02-Ch1 LBX01A-02-Ch2
0
10
20
30
40
50
60
70
80
-0.01 0.19 0.39
Load
[KN
]
Deformation [mm]
LBX02B-01-Ch1 LBX02B-01-Ch2
41
1.1.2. Rectangular holes 1.1.2.1. Without reinforcement
0
5
10
15
20
25
30
35
40
45
50
-0.1 1.9 3.9
Load
[KN
]
Deformation [mm]
LBX07B-02-Ch1 LBX07B-02-Ch2
0
5
10
15
20
25
30
35
40
45
50
0 2 4 6Lo
ad [K
N]
Deformation [mm]
LBX07A-02-CH1 LBX07A-02-CH2
0
5
10
15
20
25
30
35
40
45
50
0 2 4
Load
[KN
]
Deformation [mm]
LBX06B-01-Ch1 LBX06B-01-Ch2
0
10
20
30
40
50
60
0 1 2 3 4
Load
[KN
]
Deformation [mm]
'LBX03A-01-Ch1 'LBX03A-01-Ch2
0
5
10
15
20
25
30
35
-1 -0.5 0 0.5 1
Load
[KN
]
Deformation [mm]
LBX03B-01-CH1 LBX03B-01-CH2
0
5
10
15
20
25
0 0.2 0.4 0.6 0.8
Laod
[KN
]
Deformation [mm]
LBX03B-02-CH1 LBX03B-02-CH2
42
1.1.2.2. Reinforced with Glass Fiber
-10
0
10
20
30
40
50
60
70
0 2 4 6 8 10
Load
[KN
]
deformation [mm]
LBX03A-02-Ch1 LBX03A-02-Ch2
0
5
10
15
20
25
30
35
40
45
0 20 40 60
Load
[KN
]Deformation [mm]
LBX05B-01-Ch1 LBX05B-01-Ch2
0
5
10
15
20
25
30
35
40
45
50
0 2 4 6
Load
[KN
]
Deformation [mm]
LBX06A-02-Ch1 LBX06A-02-Ch2
43
1.1.2.3. Reinforced with plywood
0
10
20
30
40
50
60
70
-0.1 0 0.1 0.2 0.3 0.4
Load
[KN
]
Deformation[mm]
LBX06B-02-Ch1 LBX06B-02-Ch2
0
5
10
15
20
25
30
35
40
45
50
0 0.05 0.1Lo
ad [K
N]
Deformation [mm]
LBX05A-02-CH1 LBX05A-02-CH2
0
10
20
30
40
50
60
-0.08 0.02 0.12 0.22
Load
[KN
]
Deformation [mm]
LBX06A-01-Ch1 LBX06A-01-Ch2
44
1.1.1. Relation between Ch3 and Ch7 Load Circular holes 1.1.1.1. Circular holes Without reinforcement
0
5
10
15
20
25
30
35
40
45
0 5 10 15 20 25
Load
[KN
]
Deformation[mm]
LBX01A-01-CH3
0
5
10
15
20
25
30
35
40
0 10 20 30 40Lo
ad [K
N]
Deformation [mm]
LBX02A-01-CH3
0
10
20
30
40
50
60
0 10 20 30 40
Load
[KN
]
Deformation [mm]
LBX01B-03-ch3
0
5
10
15
20
25
30
35
40
45
-5 0 5 10 15 20
Load
[KN
]
Deformation [mm]
'LBX07A-01-Ch3
0
5
10
15
20
25
30
35
40
45
0 20 40 60 80
Load
[mm
]
Deformation [mm]
LBX02A-02-CH3
0
5
10
15
20
25
30
35
40
45
0 10 20
Load
[KN
]
Deformation [mm]
LBX07B-01-CH3
45
1.1.1.2. Circular holes Reinforced with Glass Fiber
0
10
20
30
40
50
60
70
0 10 20 30 40
Load
[KN
]
Deformation [mm]
02B-02-Ch3
0
5
10
15
20
25
30
35
40
45
0 10 20 30
Load
[KN
]Deformation [mm]
LBX01B-01-Ch3
0
10
20
30
40
50
60
0 10 20 30
Load
[KN
]
Deformation [mm]
LBX05B-02-Ch3
46
1.1.1.3. Circular holes Reinforced with plywood
0
10
20
30
40
50
60
70
80
0 20 40
Load
[KN
]
Deformation [mm]
LBX02B-01-Ch3
0
10
20
30
40
50
60
0 10 20 30 40 50Lo
ad [K
N]
Deformation [mm]
LBX01A-02-Ch3
0
5
10
15
20
25
30
35
0 10 20 30
Load
[KN
]
Deformation [mm]
LBX05A-01-CH3
47
1.1.2. Rectangular holes
1.1.2.1. Rectangular holes Without reinforcement
0
5
10
15
20
25
30
35
40
45
50
0 10 20 30 40
Load
[KN
]
Deformation [mm]
LBX07B-02-Ch3
0
5
10
15
20
25
30
35
40
45
50
0 10 20 30 40Lo
ad [K
N]
Deformation [mm]
LBX07A-02-CH3
0
5
10
15
20
25
30
35
40
45
50
0 10 20 30
Load
[KN
]
Deformation [mm]
LBX06B-01-Ch3
0
10
20
30
40
50
60
0 10 20 30 40
Load
[KN
]
Deformation [mm]
'LBX03A-01-Ch3
0
5
10
15
20
25
30
35
0 5 10 15 20
Load
[KN
]
Deformation [mm]
LBX03B-01-CH3
0
5
10
15
20
25
0 10 20 30
Load
[KN
]
Deformation [mm]
LBX03B-02-CH3
48
1.1.2.2. Rectangular holes Reinforced with Glass Fiber
0
10
20
30
40
50
60
70
0 20 40 60
Load
[KN
]
Deformation [mm]
LBX03A-02-Ch3
0
5
10
15
20
25
30
35
40
45
0 5 10 15 20 25
Load
[KN
]
Deformation [mm]
LBX05B-01-Ch3
0
5
10
15
20
25
30
35
40
45
50
0 20 40 60
Load
[KN
]
Deforation [mm]
LBX06A-02-Ch3
49
1.1.2.3. Rectangular holes Reinforced with plywood
0
10
20
30
40
50
60
70
0 10 20 30 40
Load
[KN
]
Deformation [mm]
LBX06B-02-Ch3
0
5
10
15
20
25
30
35
40
45
50
0 20 40 60
Load
[KN
]
Deformation [mm]
LBX05A-02-CH3
0
10
20
30
40
50
60
0 10 20 30
Load
[KN
]
Deformation [mm]
LBX06A-01-Ch3
50
2. Table of Results
51
Results For Rectangular
Beam number Crack Initiation (KN)
Maximum Load (KN) Setup Status
LBX-03-A-01 22 43 C
LBX-03-B-01 16 30 A
LBX-03-B-02 A
LBX-06-B-01 21.5 46 C
LBX-07-A-02 22.7 45 C
LBX-07-B-02 20 48 C
LBX-03-A-02 30 62 C
LBX-05-B-01 34 46.5 C
LBX-06A-2 36 45 C
LBX-05-A-02 35 47 B
LBX-06A-1 37 54 C
LBX-06-B-02 37 60 C
52
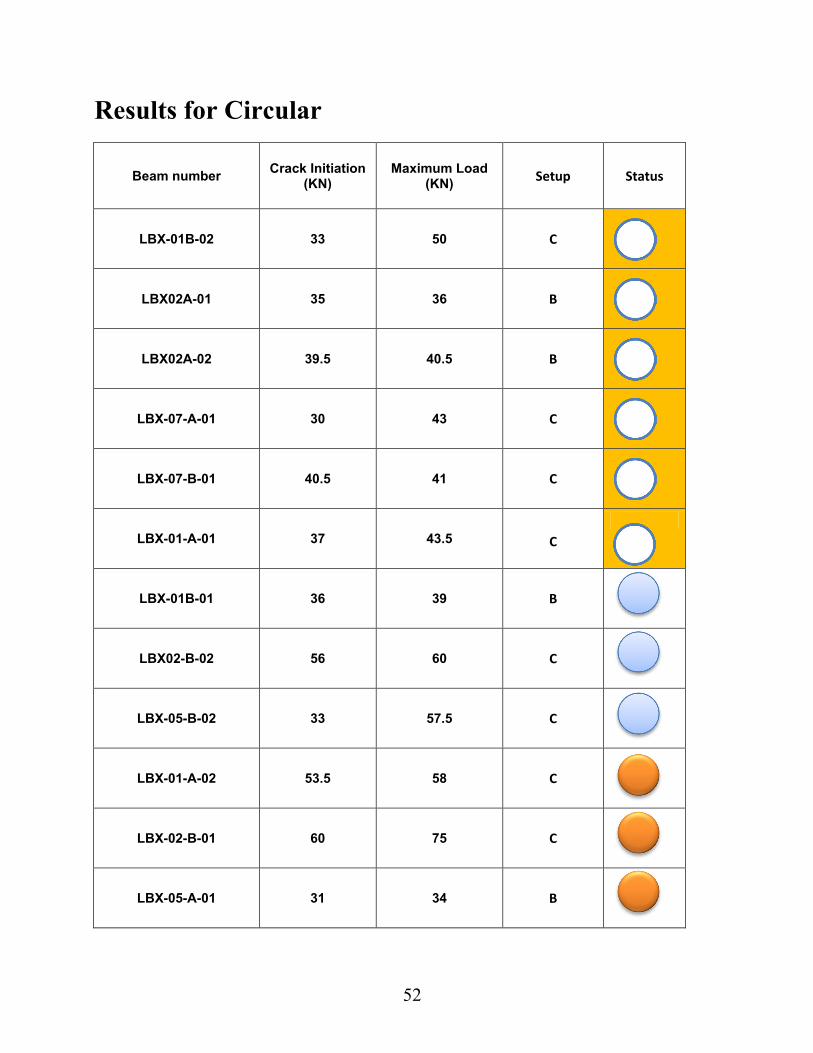
Results for Circular
Beam number Crack Initiation (KN)
Maximum Load (KN) Setup Status
LBX-01B-02 33 50 C
LBX02A-01 35 36 B
LBX02A-02 39.5 40.5 B
LBX-07-A-01 30 43 C
LBX-07-B-01 40.5 41 C
LBX-01-A-01 37 43.5 C
LBX-01B-01 36 39 B
LBX02-B-02 56 60 C
LBX-05-B-02 33 57.5 C
LBX-01-A-02 53.5 58 C
LBX-02-B-01 60 75 C
LBX-05-A-01 31 34 B
53
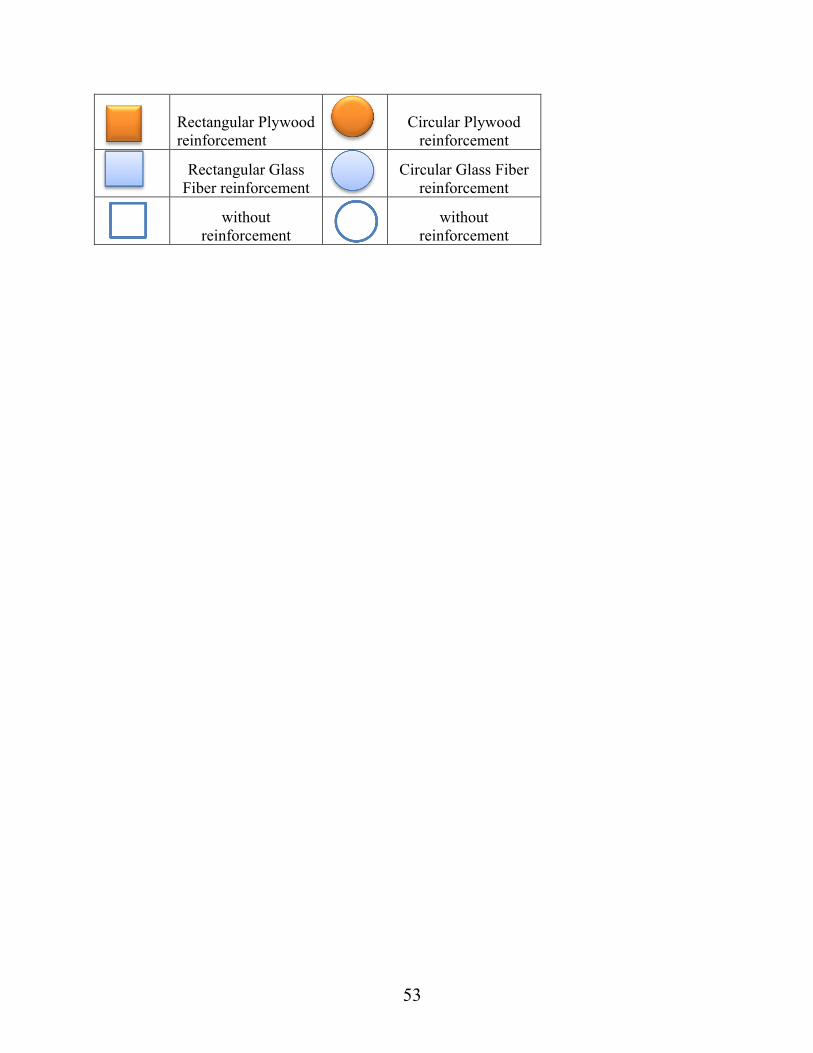
Rectangular Plywood reinforcement
Circular Plywood reinforcement
Rectangular Glass Fiber reinforcement
Circular Glass Fiber
reinforcement without
reinforcement
without reinforcement

School of Technology and Design
SE- 351 95 Växjö
Sweden
tel +46 470-70 80 00, fax +46 470-76 85 40
www. vxu.se