Embed Size (px)
Citation preview
HM Strategies ///
January 2013Hammer Maritime Strategies 1
Shipping Forum, 23 January 2013 Shipping Forum, 23 January 2013
Shipping Market UpdateShipping Market Update
& Ecoship Considerations & Ecoship Considerations Shipping Adviser Shipping Adviser
Jarle Hammer Jarle Hammer
22.0122.01
Shipping Forum, 23 January 2013 Shipping Forum, 23 January 2013
Shipping Market UpdateShipping Market Update
& Ecoship Considerations & Ecoship Considerations Shipping Adviser Shipping Adviser
Jarle Hammer Jarle Hammer
22.0122.01
HM Strategies ///
January 2013Hammer Maritime Strategies 2
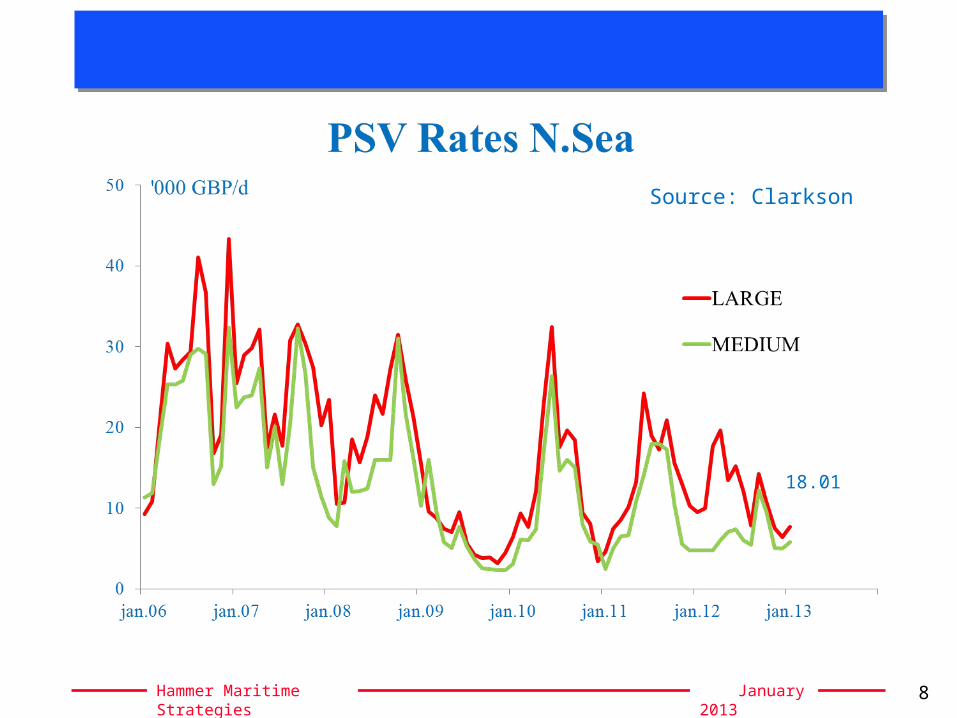
18.01
HM Strategies ///
January 2013Hammer Maritime Strategies 3
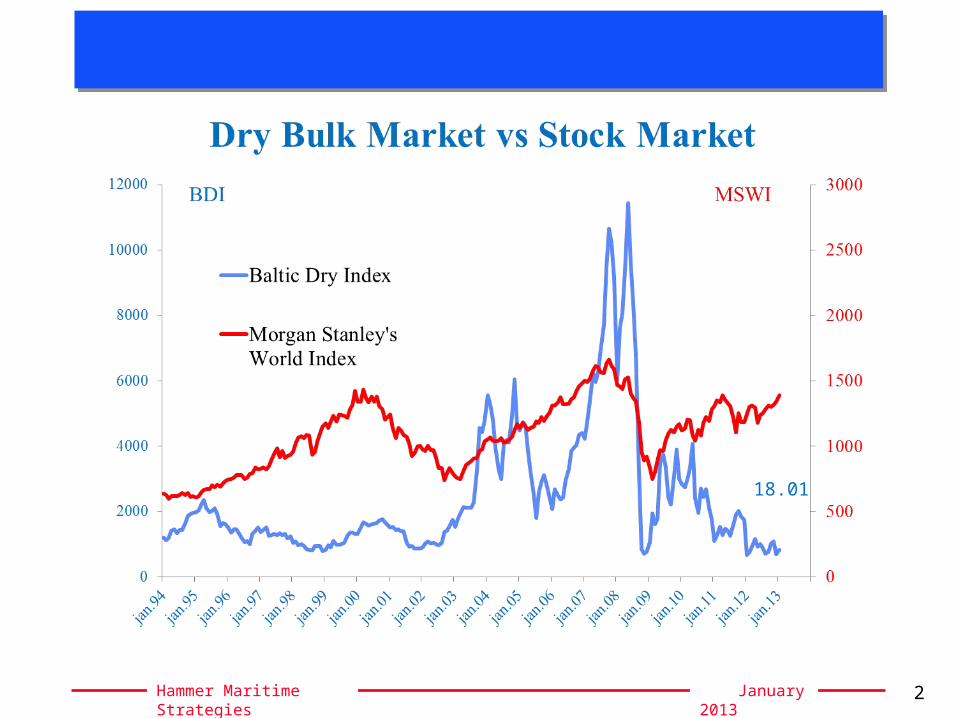
Countercyclical Investments
18.01
18.01
HM Strategies ///
January 2013Hammer Maritime Strategies 4
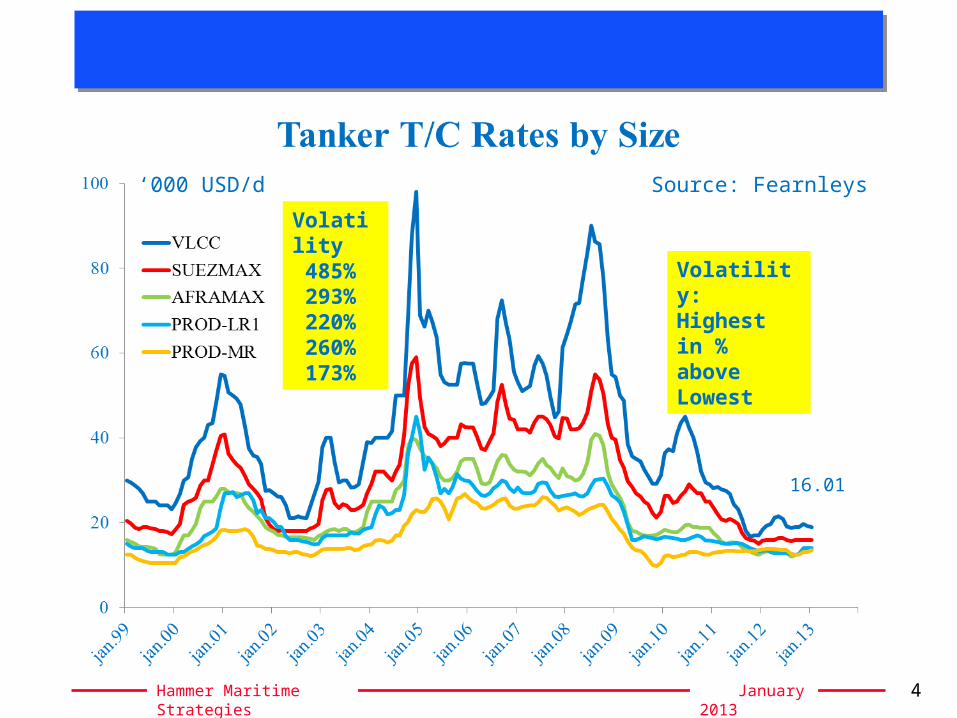
‘000 USD/d
Volatility:Highest in % above Lowest
Volatility 485% 293% 220% 260% 173%
Source: Fearnleys
16.01
HM Strategies ///
January 2013Hammer Maritime Strategies 5
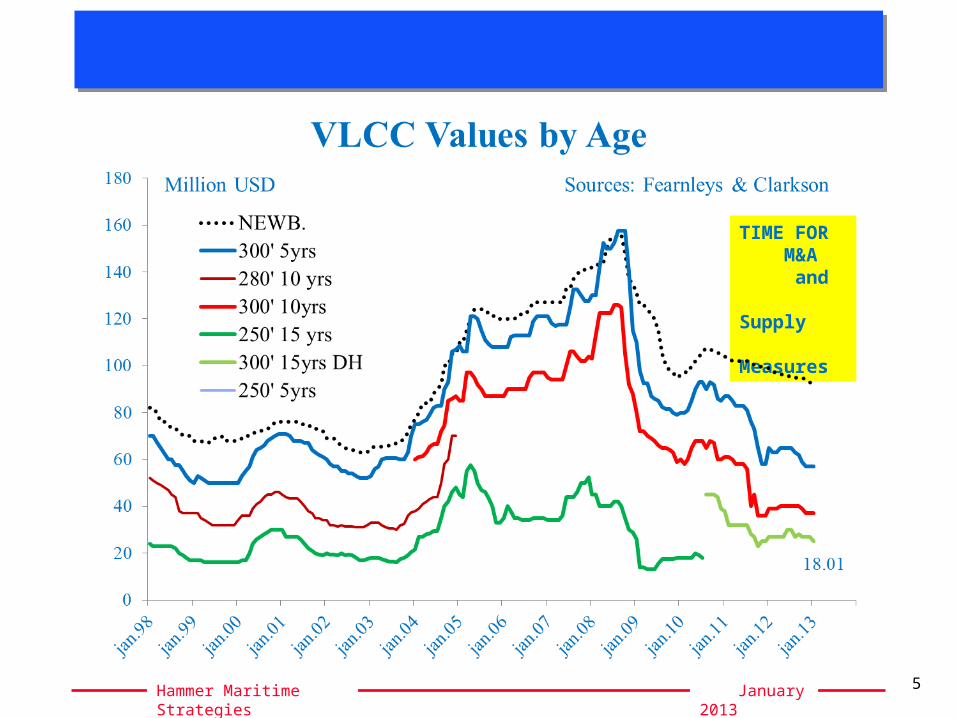
TIME FOR M&A and Supply Measures
HM Strategies ///
January 2013Hammer Maritime Strategies 6
Source: Clarkson
Substantial Slow-SteamingFleet ReserveCapacity
0
5
10
15
20
25
30
35
40
45ja
n.95
jan.
96
jan.
97
jan.
98
jan.
99
jan.
00
jan.
01
jan.
02
jan.
03
jan.
04
jan.
05
jan.
06
jan.
07
jan.
08
jan.
09
jan.
10
jan.
11
jan.
12
jan.
13
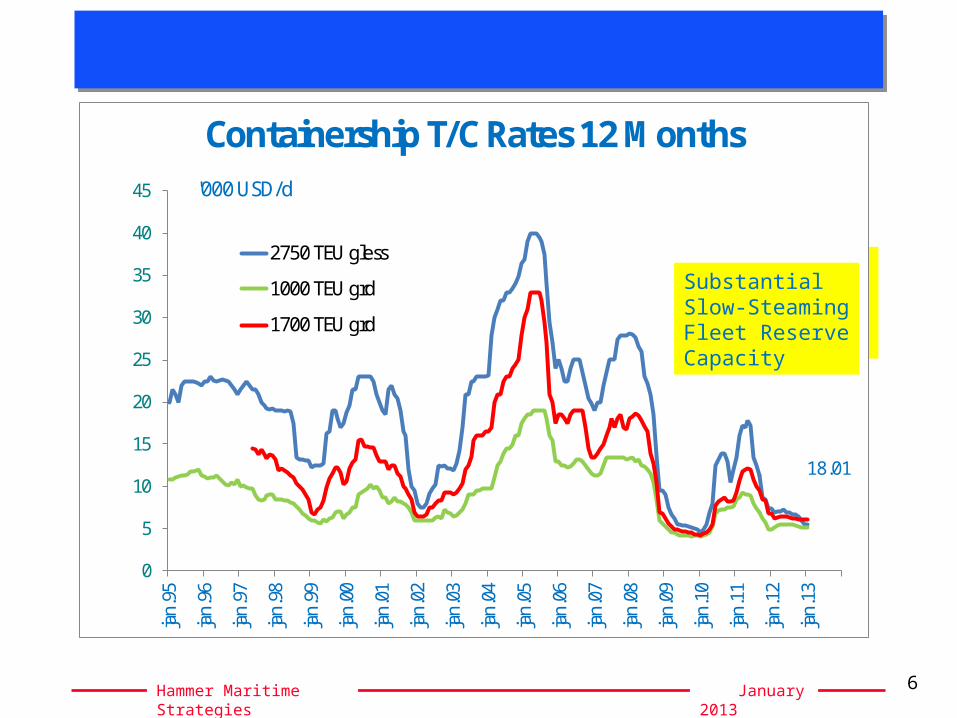
Containership T/C Rates 12 Months
2750 TEU gless
1000 TEU grd
1700 TEU grd
'000 USD/d
18.01
Substantial Slow-SteamingFleet ReserveCapacity
HM Strategies ///
January 2013Hammer Maritime Strategies 7
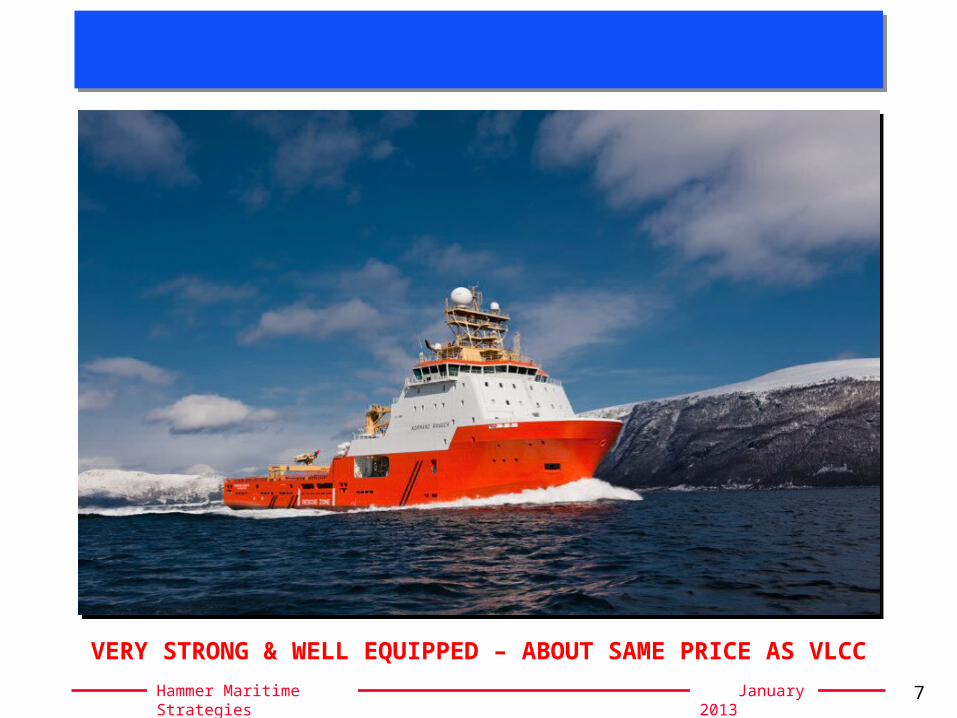
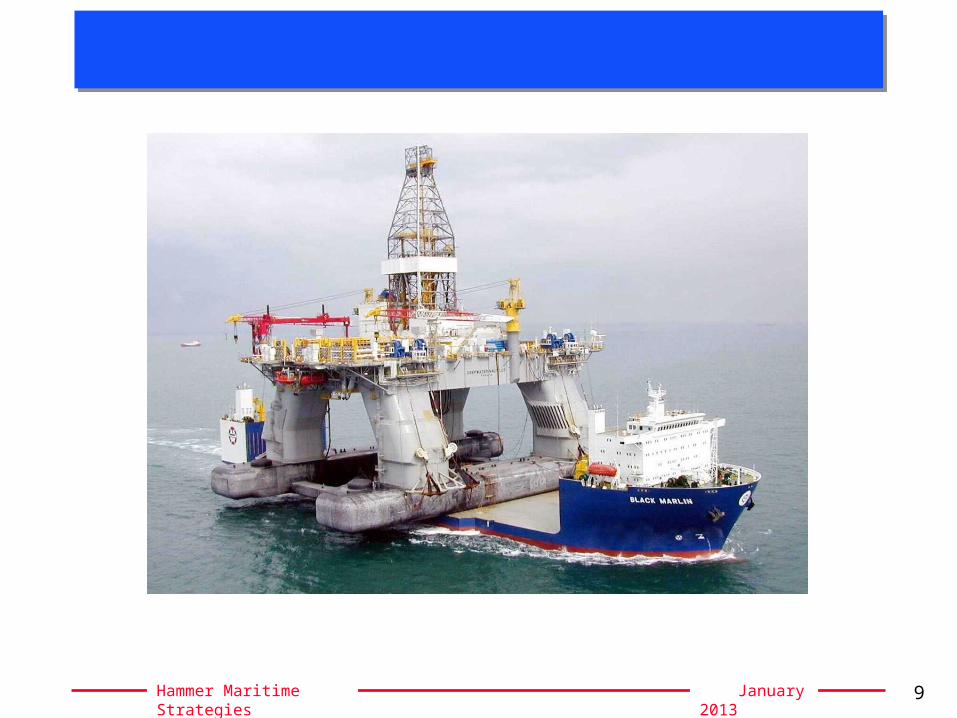
VERY STRONG & WELL EQUIPPED – ABOUT SAME PRICE AS VLCC
HM Strategies ///
January 2013Hammer Maritime Strategies 8
Source: Clarkson
18.01
HM Strategies ///
January 2013Hammer Maritime Strategies 9
HM Strategies ///
January 2013Hammer Maritime Strategies 10
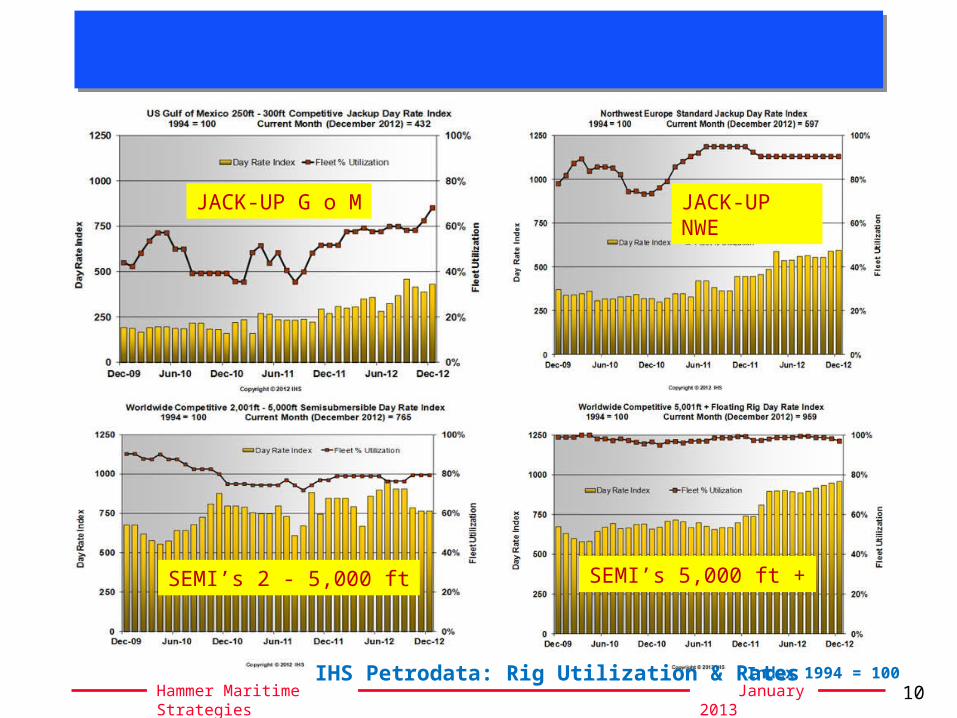
JACK-UP G o M JACK-UP NWE
SEMI’s 5,000 ft +SEMI’s 2 - 5,000 ft
IHS Petrodata: Rig Utilization & Rates Index 1994 = 100
HM Strategies ///
January 2013Hammer Maritime Strategies 11
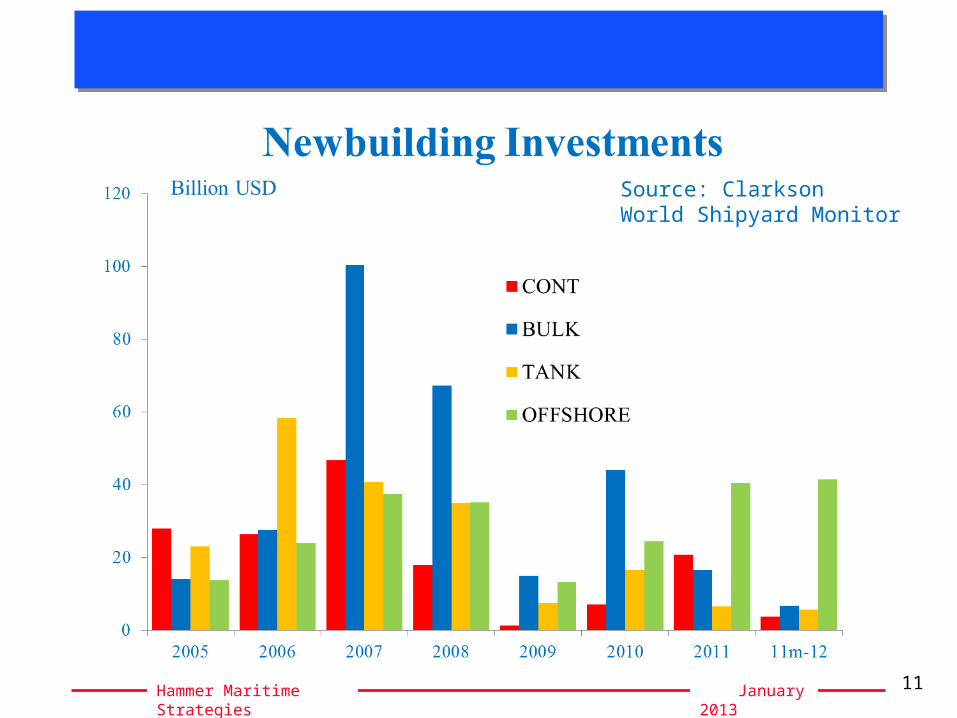
Source: ClarksonWorld Shipyard Monitor
HM Strategies ///
January 2013Hammer Maritime Strategies 12
HM Strategies ///
January 2013Hammer Maritime Strategies 13
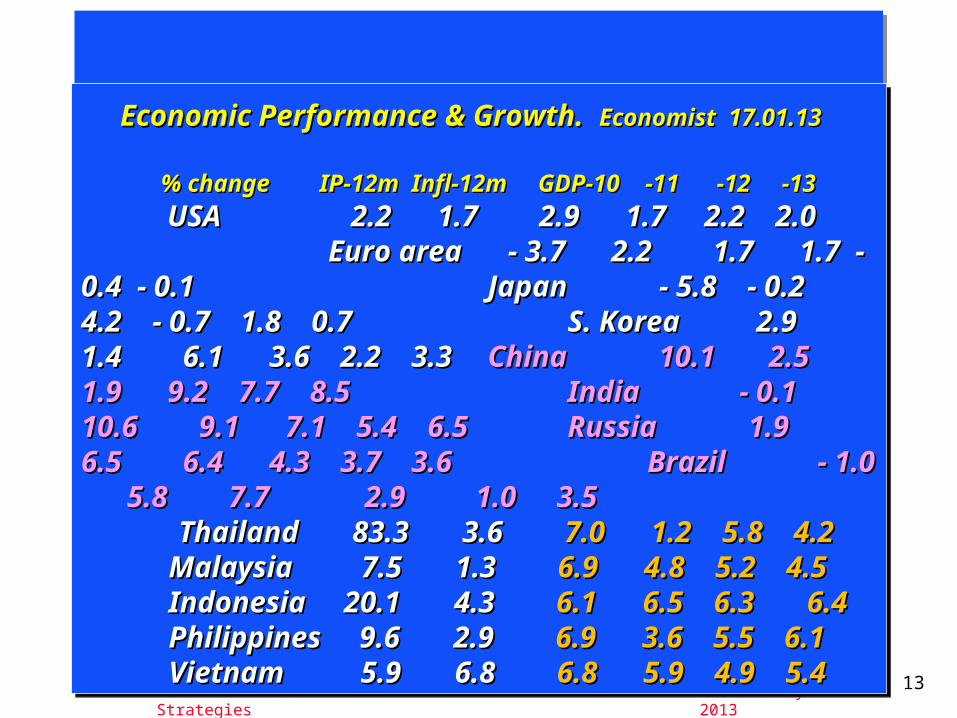
Economic Performance & Growth. Economic Performance & Growth. Economist Economist
17.01.13 17.01.13 % change IP-12m Infl-12m GDP-% change IP-12m Infl-12m GDP-
1010 -11 -12 -13 -11 -12 -13 USA 2.2 USA 2.2 1.7 2.9 1.7 2.2 2.0 1.7 2.9 1.7 2.2 2.0
Euro area - 3.7 2.2 1.7 1.7 - Euro area - 3.7 2.2 1.7 1.7 - 0.4 - 0.1 0.4 - 0.1 Japan - Japan - 5.8 - 0.2 4.2 - 0.7 1.8 0.7 5.8 - 0.2 4.2 - 0.7 1.8 0.7 S. Korea 2.9 1.4 6.1 3.6 S. Korea 2.9 1.4 6.1 3.6 2.2 3.32.2 3.3 China 10.1 2.5 1.9 China 10.1 2.5 1.9 9.2 7.7 8.5 9.2 7.7 8.5 India - 0.1 India - 0.1 10.6 9.1 7.1 5.4 6.5 10.6 9.1 7.1 5.4 6.5 Russia Russia 1.9 6.5 6.4 4.3 3.7 3.6 1.9 6.5 6.4 4.3 3.7 3.6 Brazil - 1.0 5.8 7.7 Brazil - 1.0 5.8 7.7 2.92.9 1.01.0 3.53.5 Thailand 83.3 3.6 Thailand 83.3 3.6 7.0 1.2 7.0 1.2 5.85.8 4.24.2 Malaysia 7.5 Malaysia 7.5 1.3 1.3 6.9 4.8 5.2 4.56.9 4.8 5.2 4.5 Indonesia Indonesia 20.1 4.3 20.1 4.3 6.1 6.5 6.3 6.1 6.5 6.3 6.4 6.4 Philippines 9.6 2.9 Philippines 9.6 2.9 6.9 3.6 5.5 6.9 3.6 5.5 6.1 6.1 Vietnam 5.9 6.8 Vietnam 5.9 6.8 6.8 6.8 5.9 4.9 5.45.9 4.9 5.4
HM Strategies ///
January 2013Hammer Maritime Strategies 14
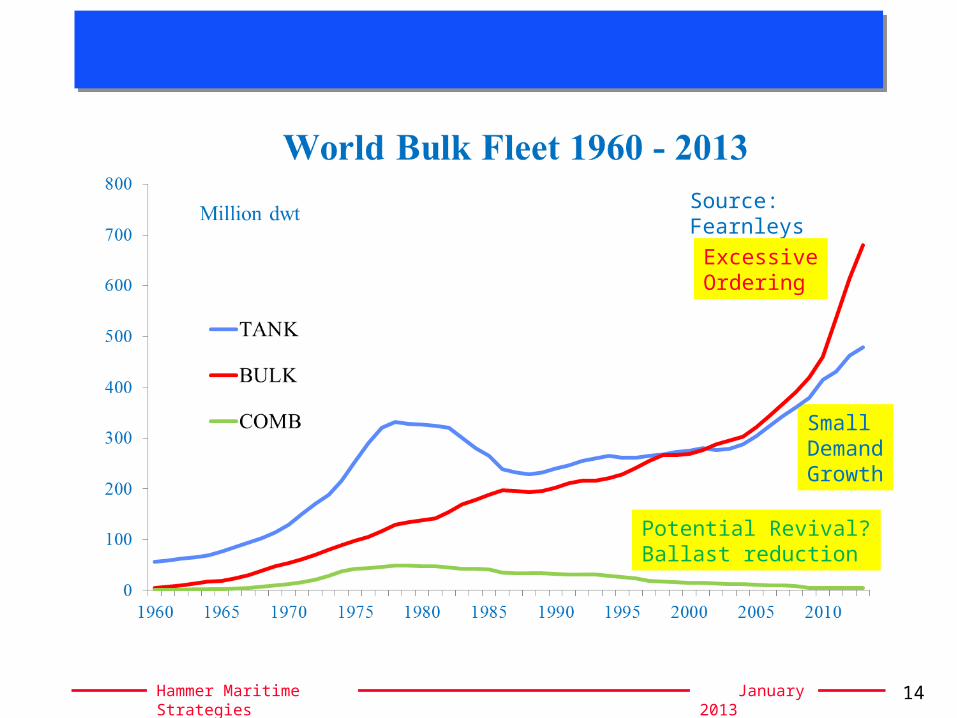
Source: Fearnleys
Potential Revival?Ballast reduction
ExcessiveOrdering
Small DemandGrowth
HM Strategies ///
January 2013Hammer Maritime Strategies 15
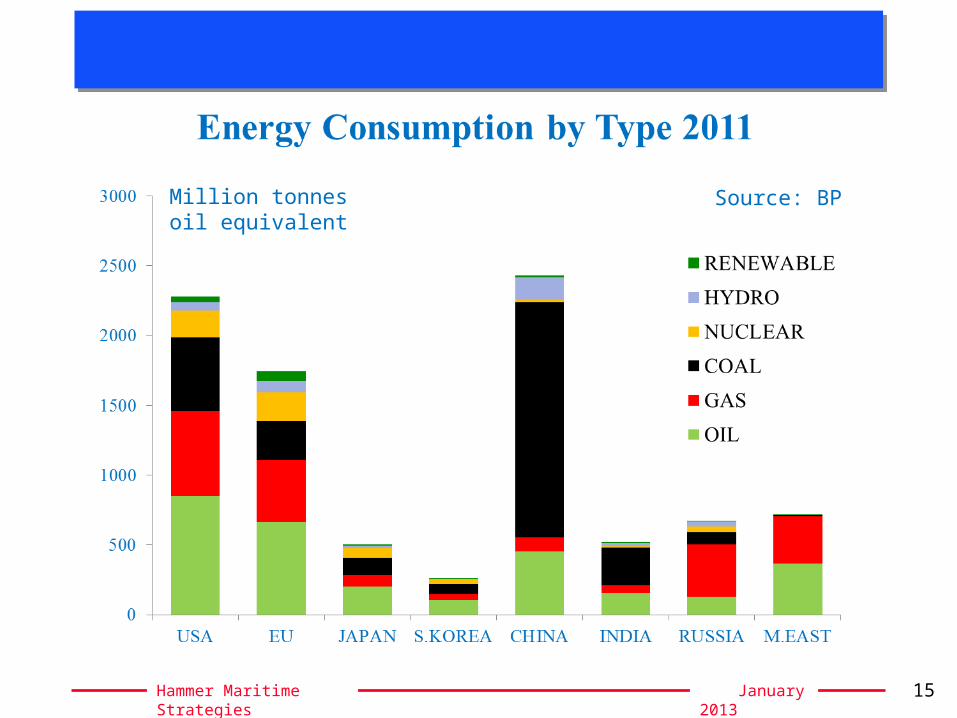
Million tonnes oil equivalent
Source: BP
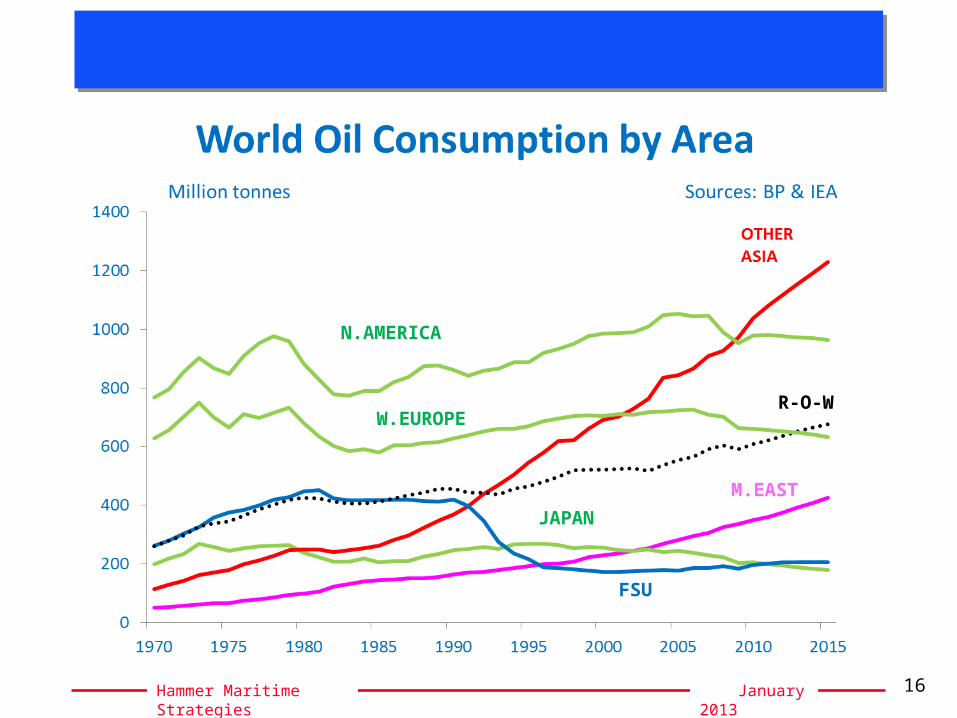
HM Strategies ///
January 2013Hammer Maritime Strategies 16
N.AMERICA
W.EUROPE
JAPAN
FSU
M.EAST
R-O-W
HM Strategies ///
January 2013Hammer Maritime Strategies 17
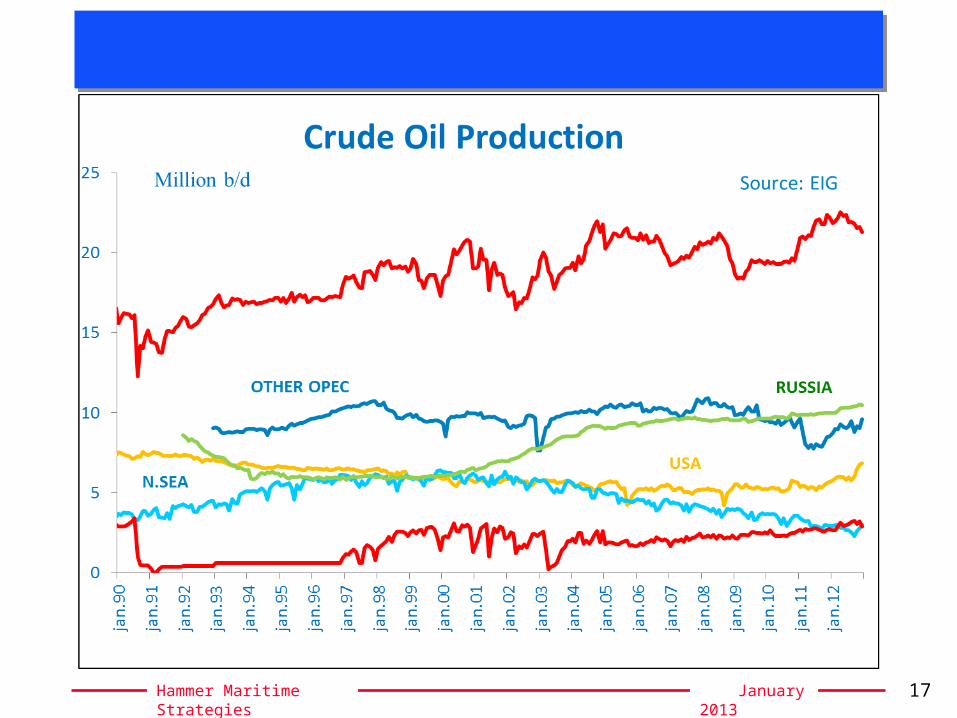
M.EAST OPEC
N.AMERICA
N.SEA
FSU
DEPLETION
PEAK OIL IRRELEVANTSupply is a function ofPrice & Technology
HM Strategies ///
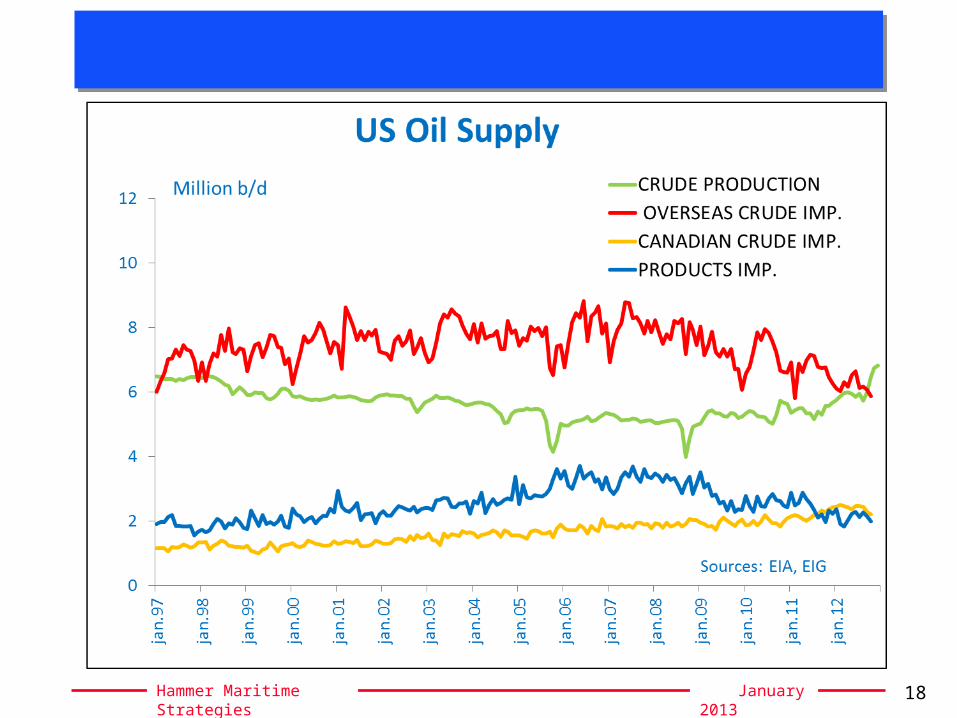
January 2013Hammer Maritime Strategies 18
HM Strategies ///
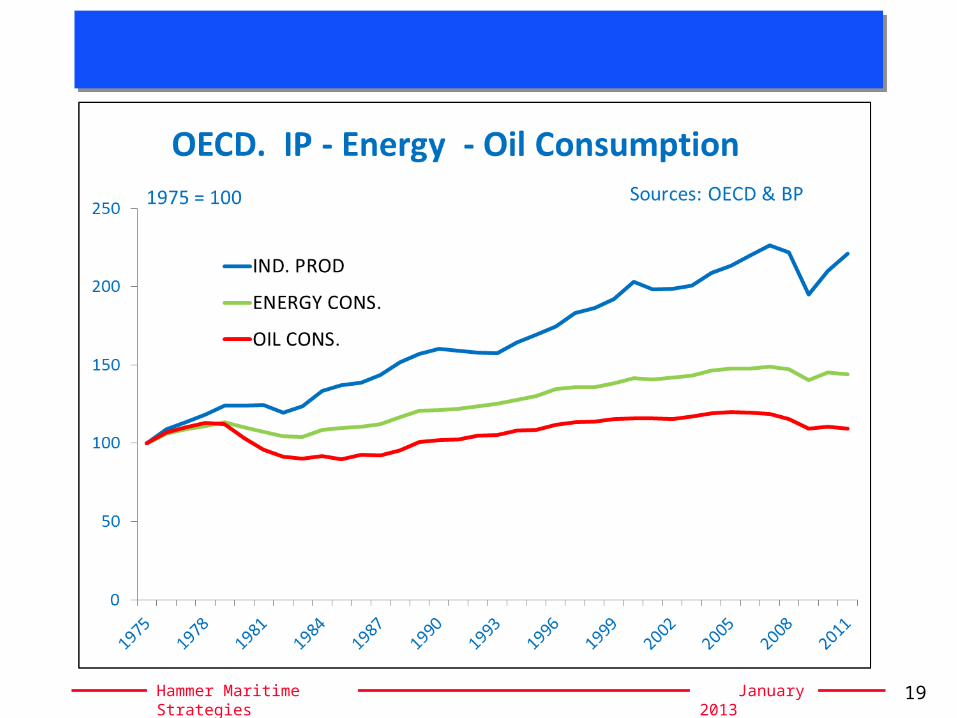
January 2013Hammer Maritime Strategies 19
HM Strategies ///
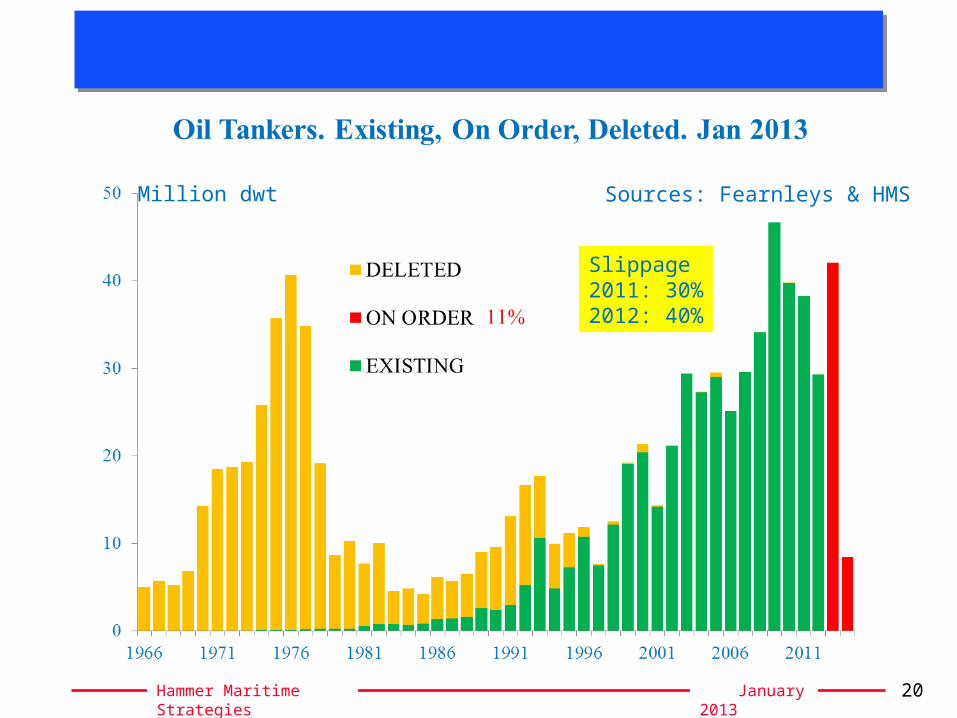
January 2013Hammer Maritime Strategies 20
Million dwt Sources: Fearnleys & HMS
Slippage 2011: 30%2012: 40%
HM Strategies ///
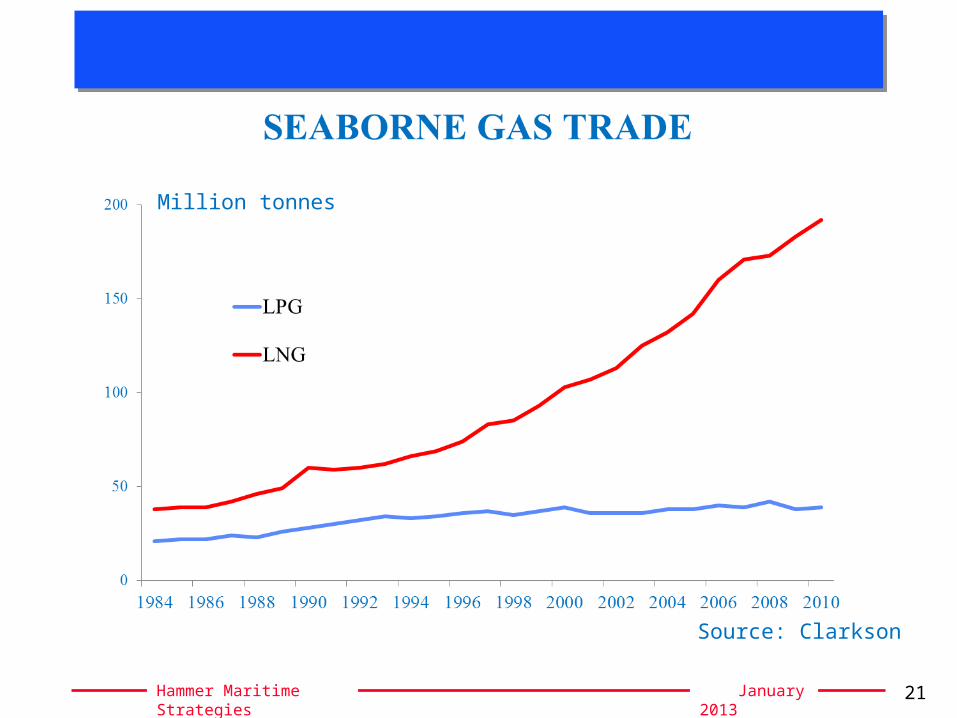
January 2013Hammer Maritime Strategies 21
Million tonnes
Source: Clarkson
HM Strategies ///
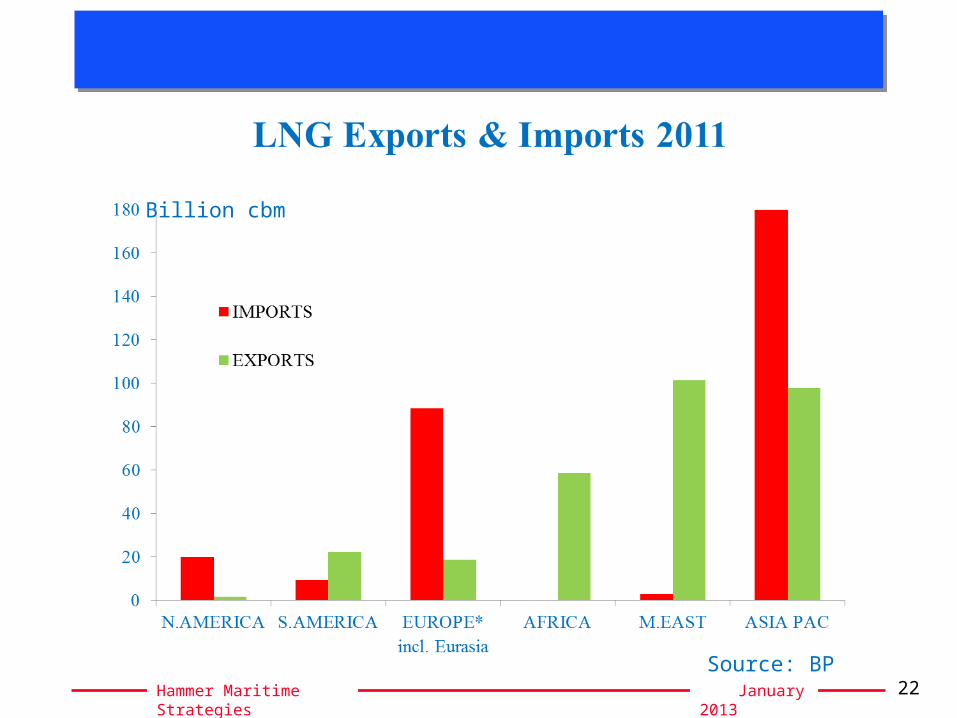
January 2013Hammer Maritime Strategies 22
Billion cbm
Source: BP
HM Strategies ///
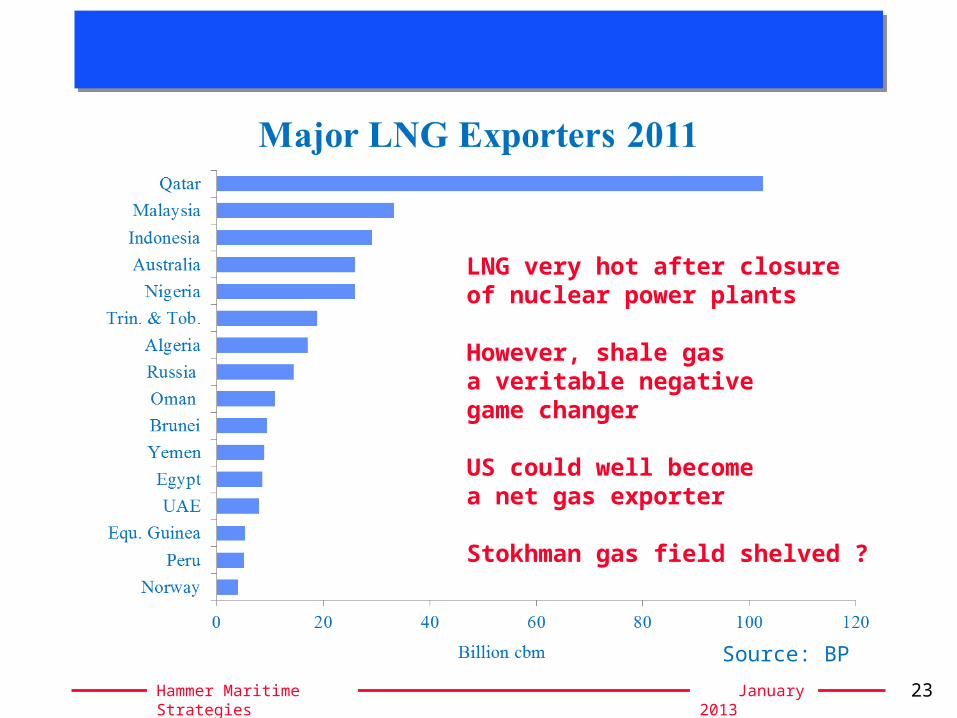
January 2013Hammer Maritime Strategies 23
Source: BP
LNG very hot after closureof nuclear power plants
However, shale gas a veritable negativegame changer
US could well becomea net gas exporter
Stokhman gas field shelved ?
HM Strategies ///
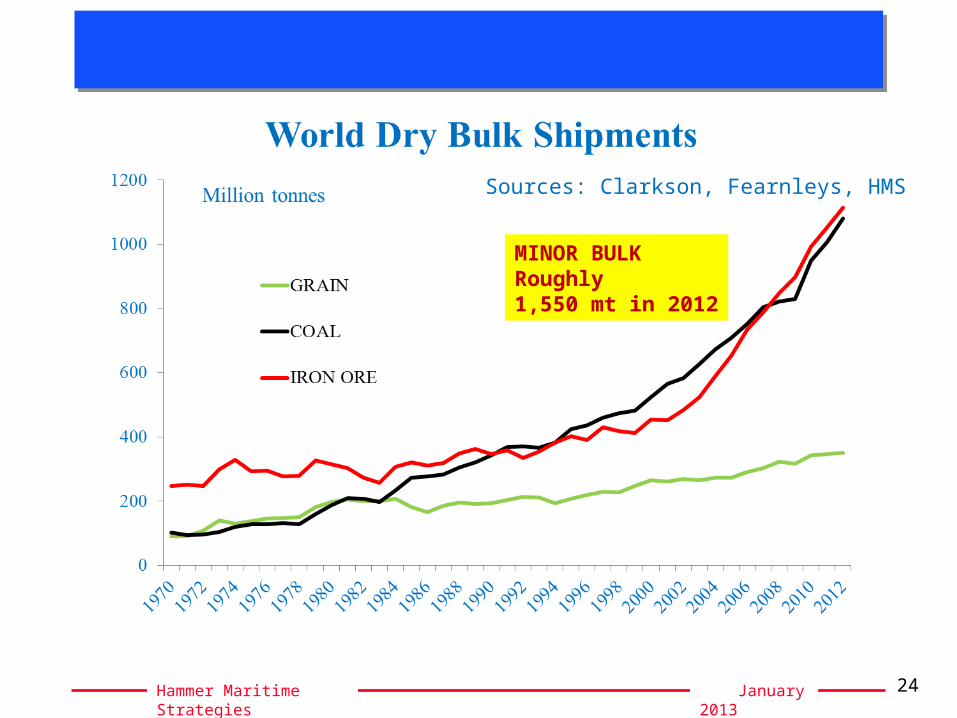
January 2013Hammer Maritime Strategies 24
MINOR BULKRoughly1,550 mt in 2012
Sources: Clarkson, Fearnleys, HMS
HM Strategies ///
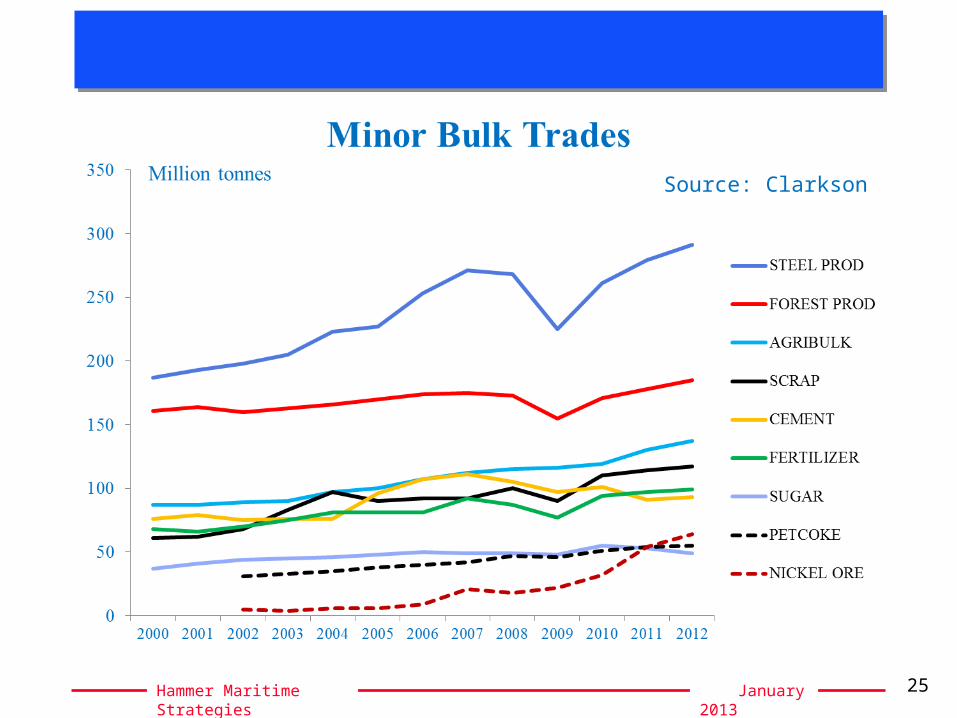
January 2013Hammer Maritime Strategies 25
Source: Clarkson
HM Strategies ///
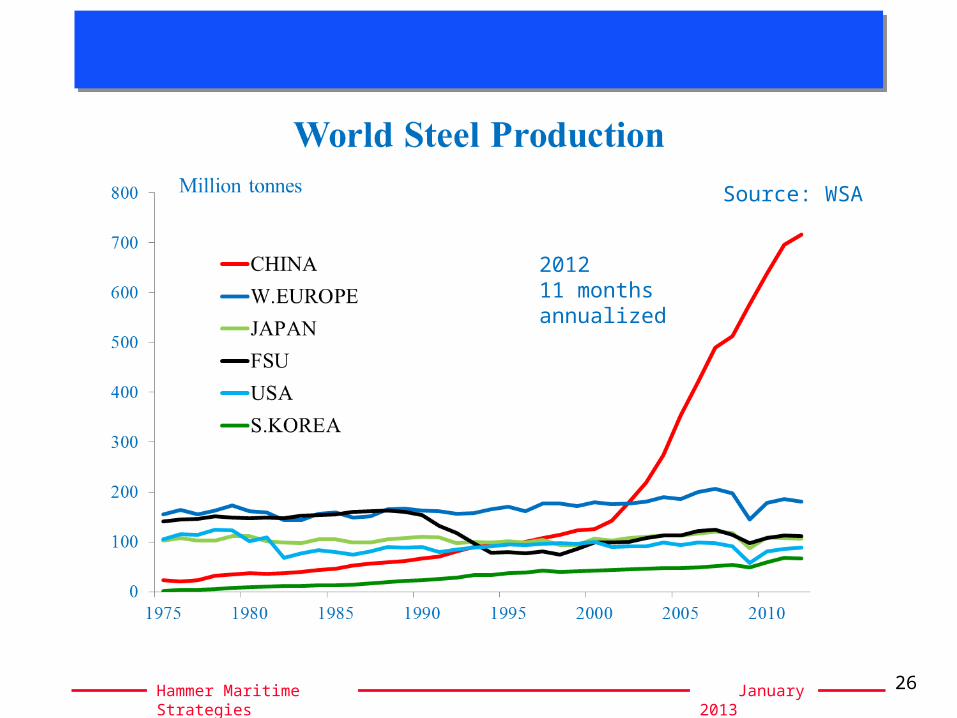
January 2013Hammer Maritime Strategies 26
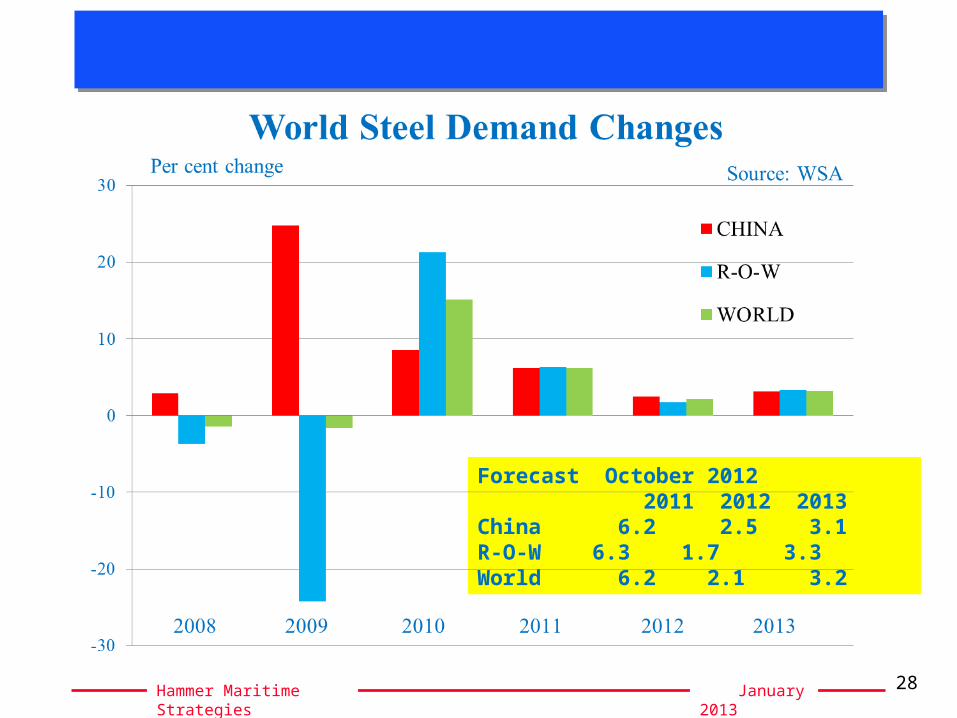
Source: WSA
201211 monthsannualized
HM Strategies ///
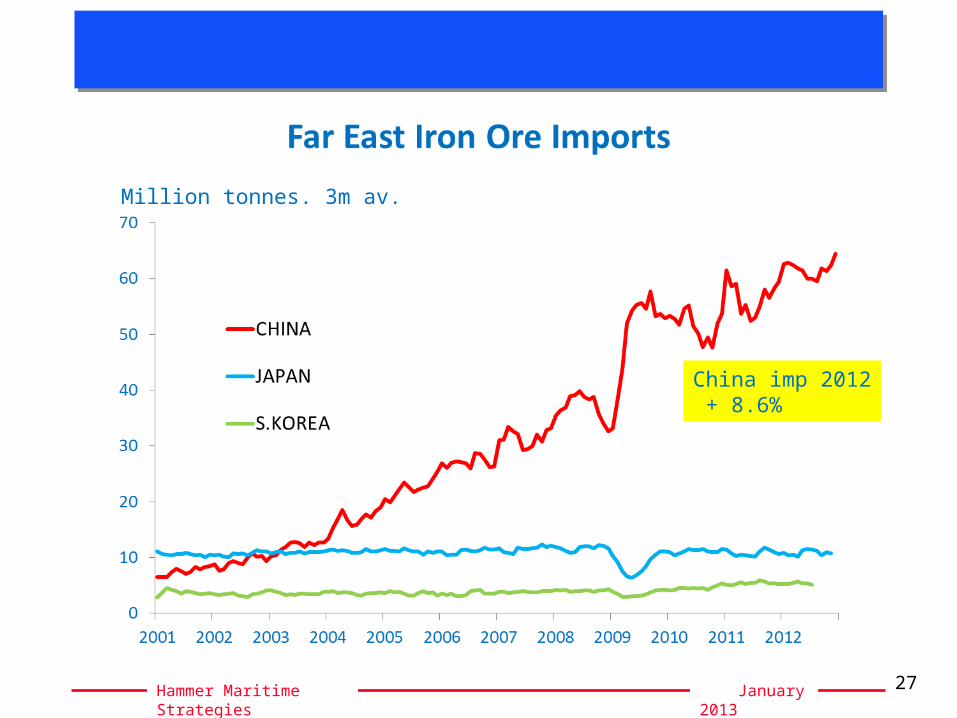
January 2013Hammer Maritime Strategies 27
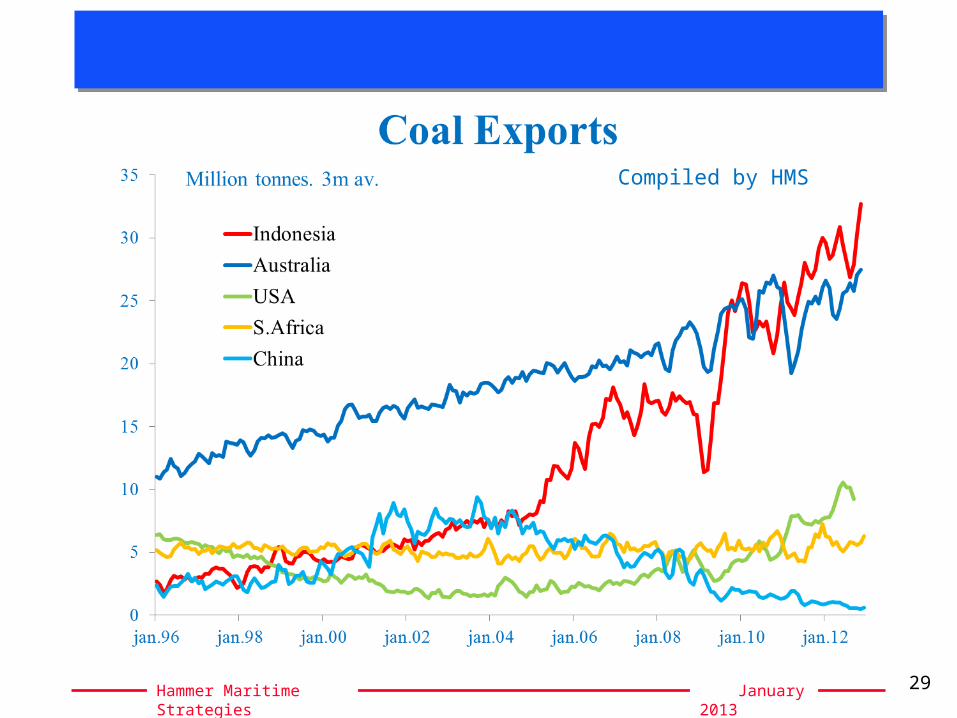
Million tonnes. 3m av.
China imp 2012 + 8.6%
HM Strategies ///
January 2013Hammer Maritime Strategies 28
Forecast October 2012 2011 2012 2013China 6.2 2.5 3.1 R-O-W 6.3 1.7 3.3World 6.2 2.1 3.2
HM Strategies ///
January 2013Hammer Maritime Strategies 29
Compiled by HMS
HM Strategies ///
January 2013Hammer Maritime Strategies 30
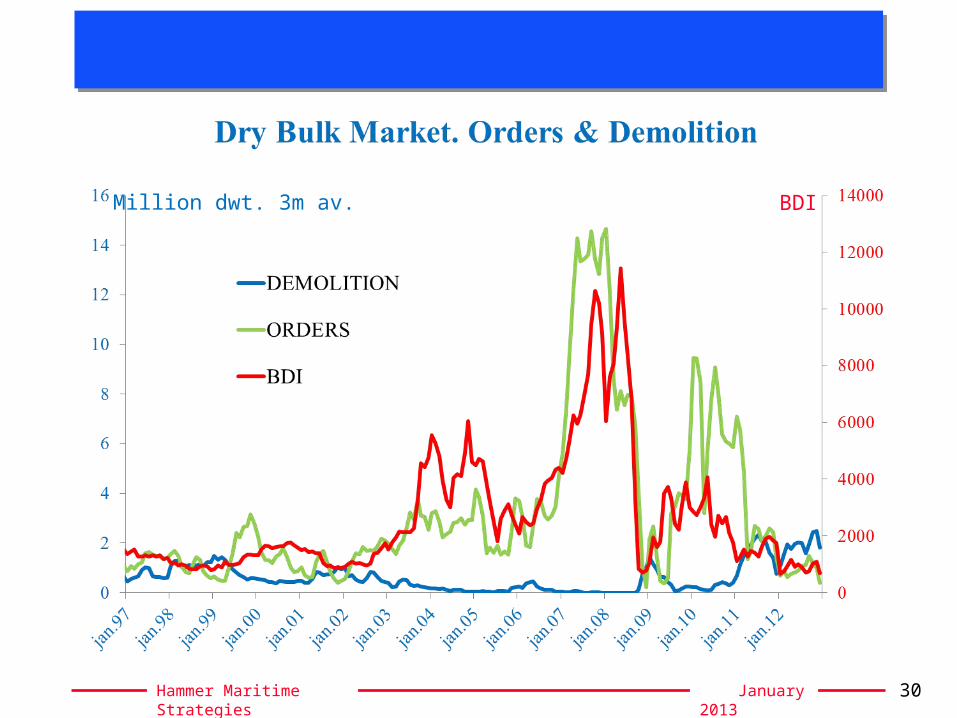
BDIMillion dwt. 3m av.
HM Strategies ///
January 2013Hammer Maritime Strategies 31
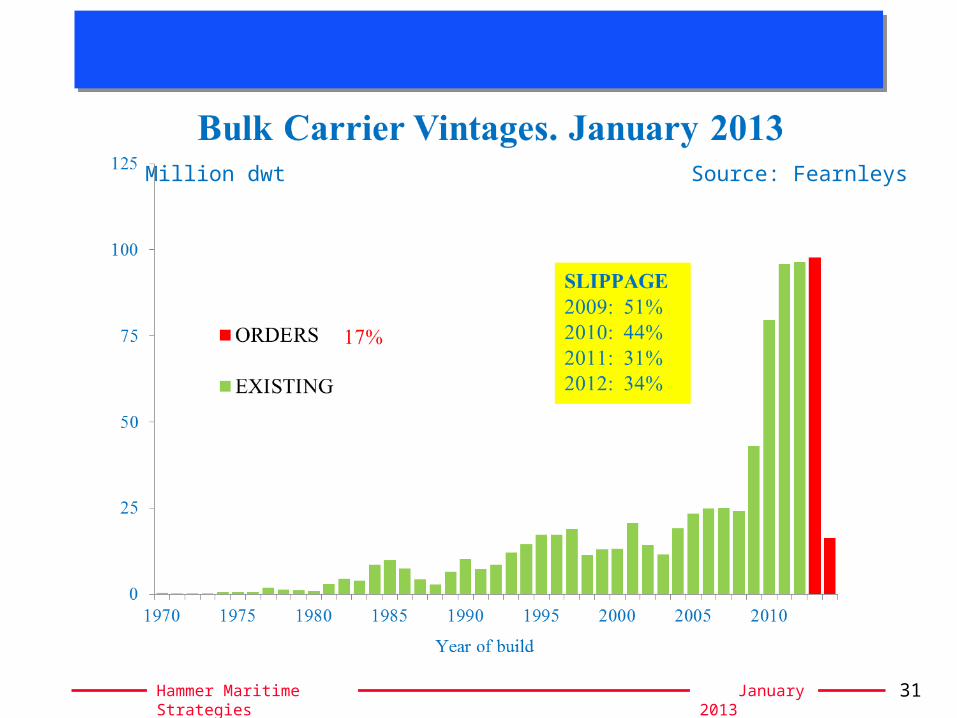
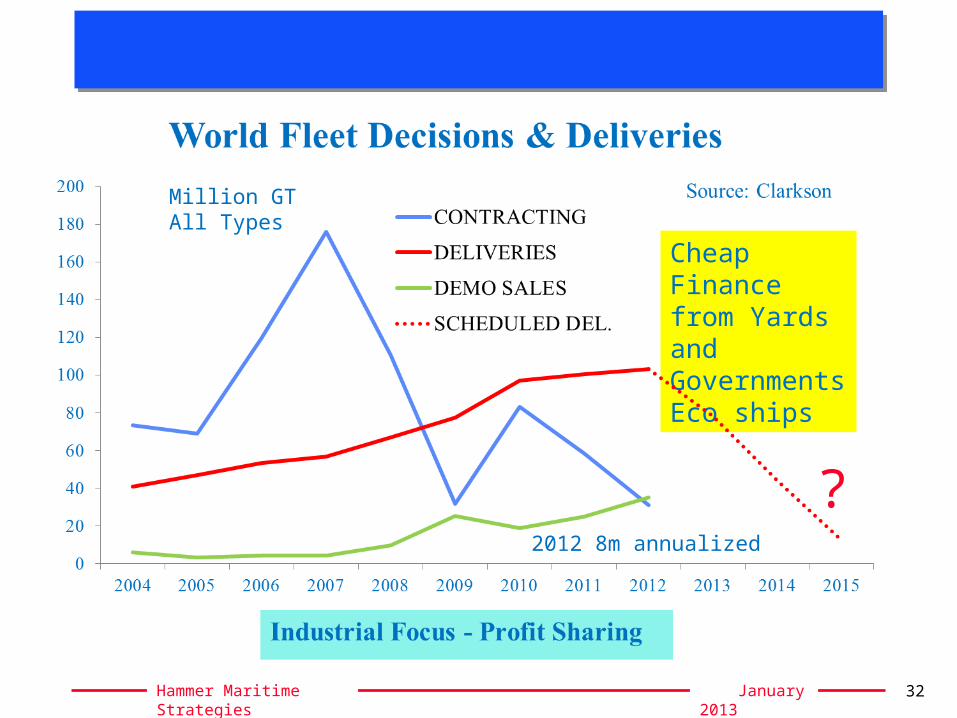
Million dwt Source: Fearnleys
HM Strategies ///
January 2013Hammer Maritime Strategies 32
Cheap Financefrom Yards andGovernmentsEco ships
?2012 8m annualized
Million GTAll Types
HM Strategies ///
January 2013Hammer Maritime Strategies 33
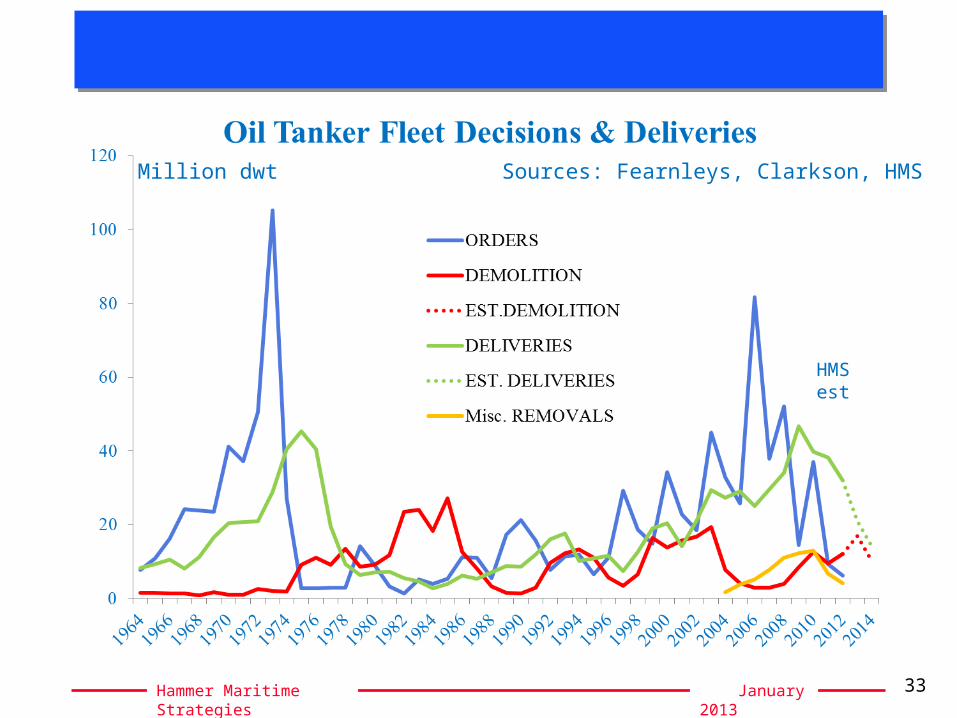
HMS est
Million dwt Sources: Fearnleys, Clarkson, HMS
HM Strategies ///
January 2013Hammer Maritime Strategies 34
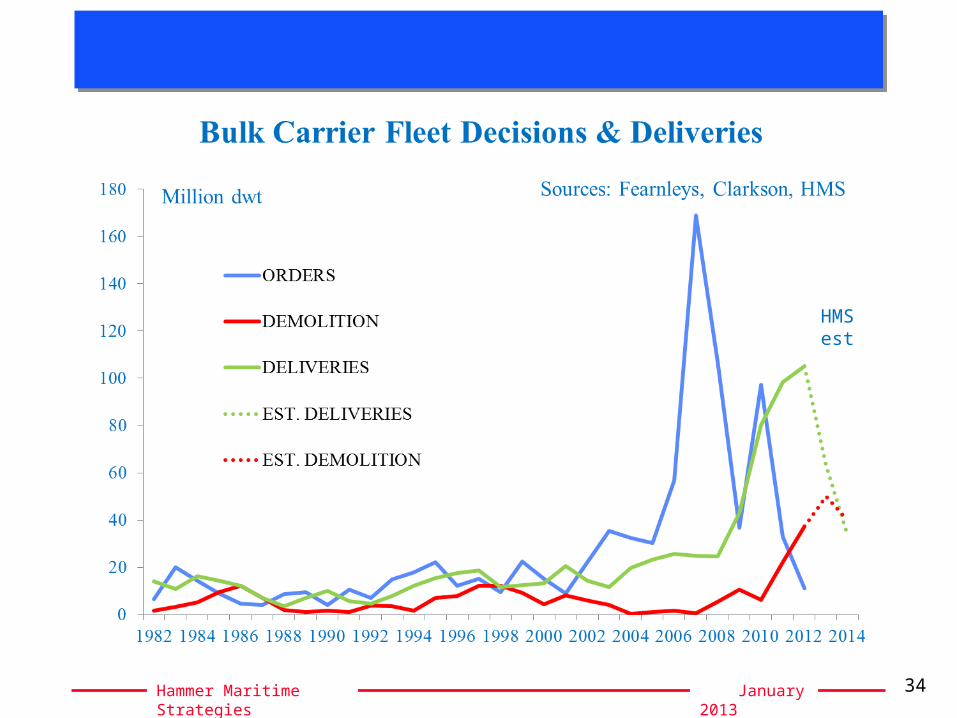
HMS est
HM Strategies ///
January 2013Hammer Maritime Strategies 35
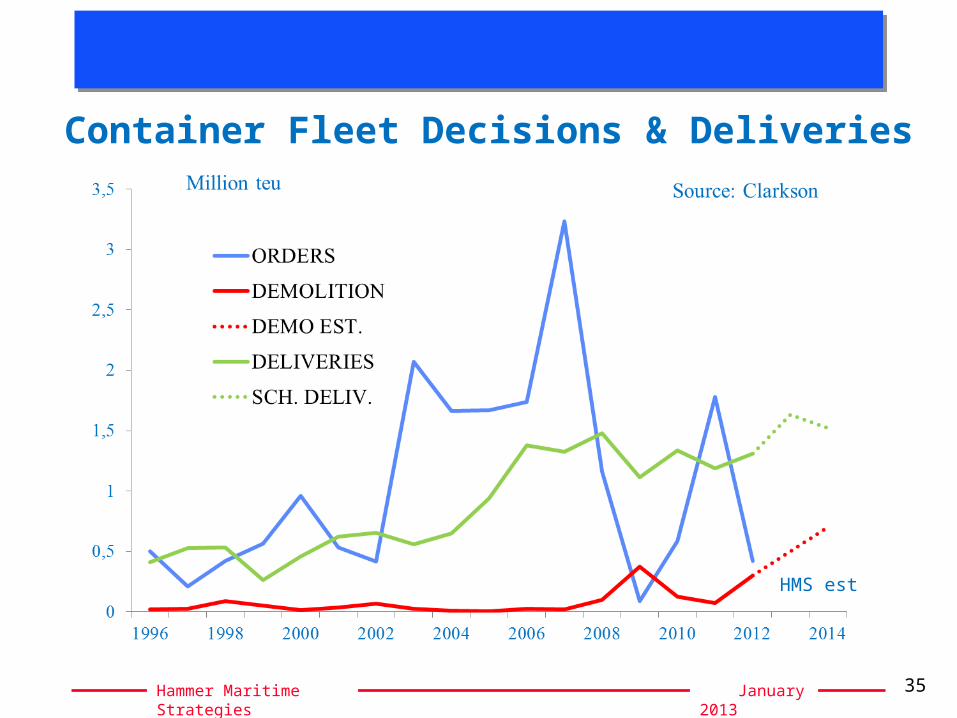
Container Fleet Decisions & Deliveries
HMS est
HM Strategies ///
January 2013Hammer Maritime Strategies 36
HM Strategies ///
January 2013Hammer Maritime Strategies 37
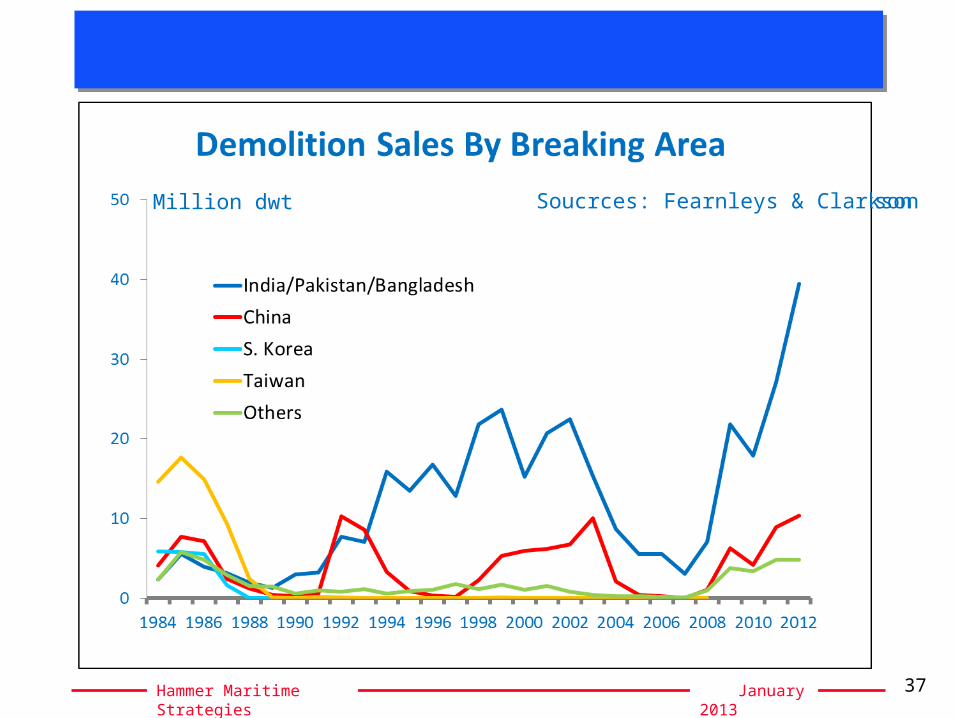
Sources: Fearnleys & ClarksonMillion dwt Soucrces: Fearnleys & Clarkson
HM Strategies ///
January 2013Hammer Maritime Strategies 38
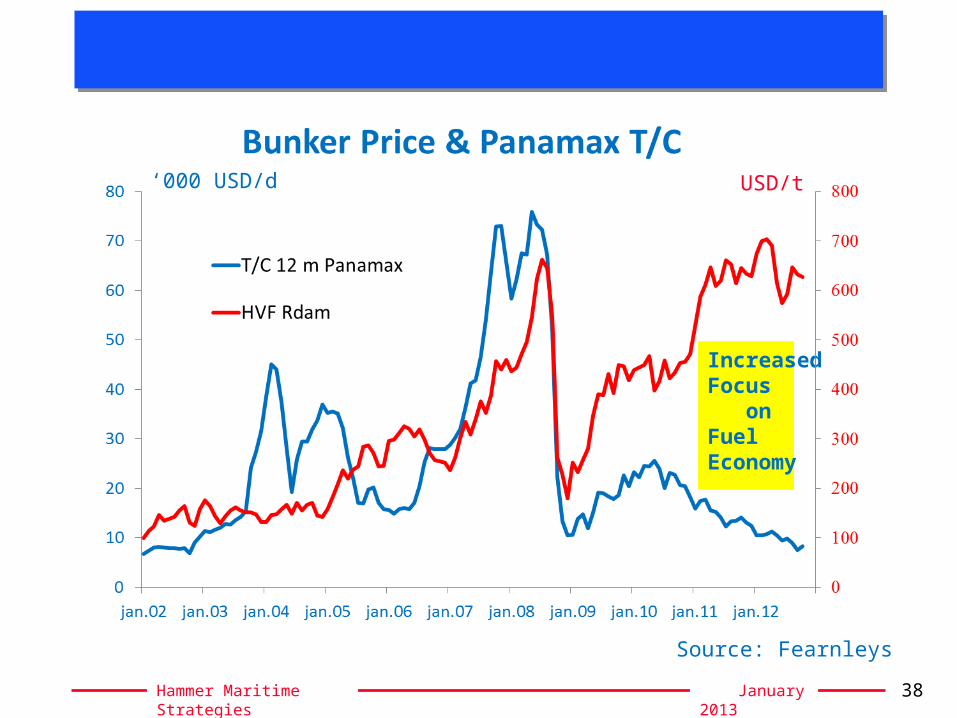
‘000 USD/d USD/t
Source: Fearnleys
IncreasedFocus onFuelEconomy
HM Strategies ///
January 2013Hammer Maritime Strategies 39
HM Strategies ///
January 2013Hammer Maritime Strategies 40
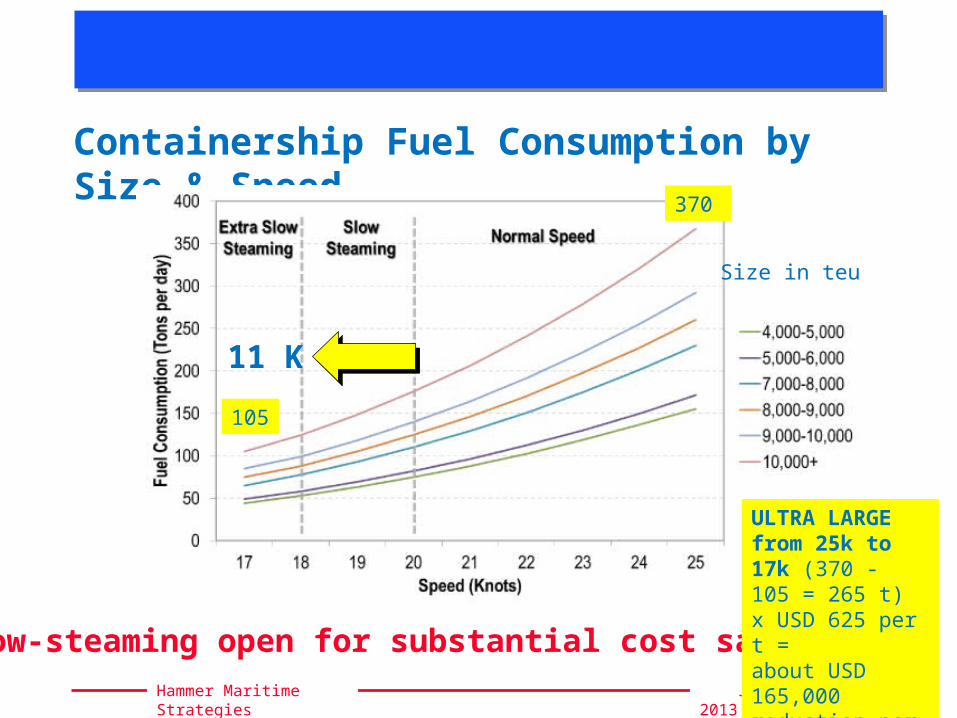
Containership Fuel Consumption by Size & Speed
Size in teu
11 K
Slow-steaming open for substantial cost savings
370
105
ULTRA LARGEfrom 25k to 17k (370 - 105 = 265 t)x USD 625 per t =about USD 165,000reduction per day
HM Strategies ///
January 2013Hammer Maritime Strategies 41
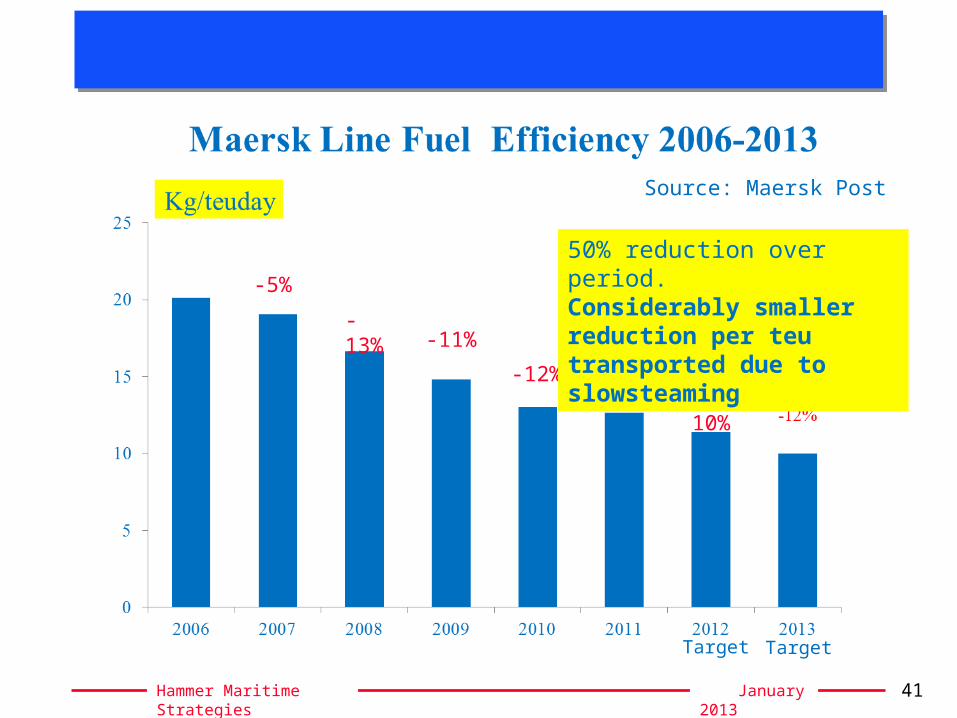
Target Target
Source: Maersk Post
-5%
-13%-11%
-12% -3%-10%
50% reduction over period.Considerably smaller reduction per teu transported due to slowsteaming
HM Strategies ///
January 2013Hammer Maritime Strategies 42
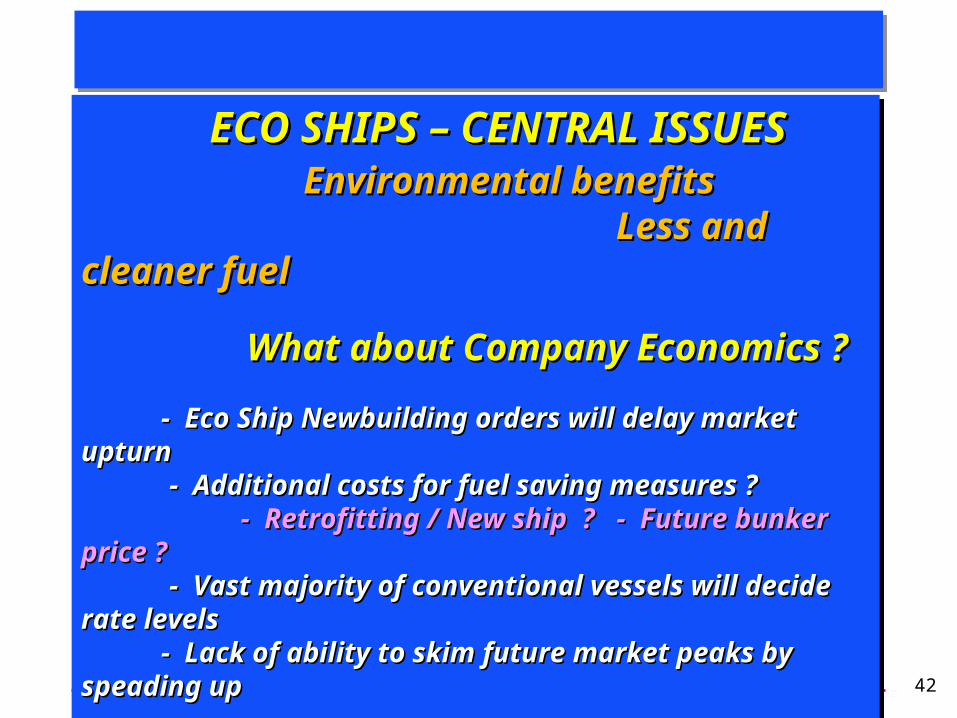
ECO SHIPS – CENTRAL ISSUESECO SHIPS – CENTRAL ISSUES Environmental benefits Environmental benefits Less and cleaner fuel Less and cleaner fuel
What about Company Economics ?What about Company Economics ?
- Eco Ship Newbuilding orders will delay market upturn- Eco Ship Newbuilding orders will delay market upturn - Additional costs for fuel saving measures ?- Additional costs for fuel saving measures ? - Retrofitting / New ship ? - Future bunker price ?- Retrofitting / New ship ? - Future bunker price ? - Vast majority of conventional vessels will decide rate levels- Vast majority of conventional vessels will decide rate levels
- Lack of ability to skim future market peaks by speading up - Lack of ability to skim future market peaks by speading up
- Higher total fleet income per capital invested when - Higher total fleet income per capital invested when using larger number of medium age vessels in fairly using larger number of medium age vessels in fairly healthy markets healthy markets
HM Strategies ///
January 2013Hammer Maritime Strategies 43
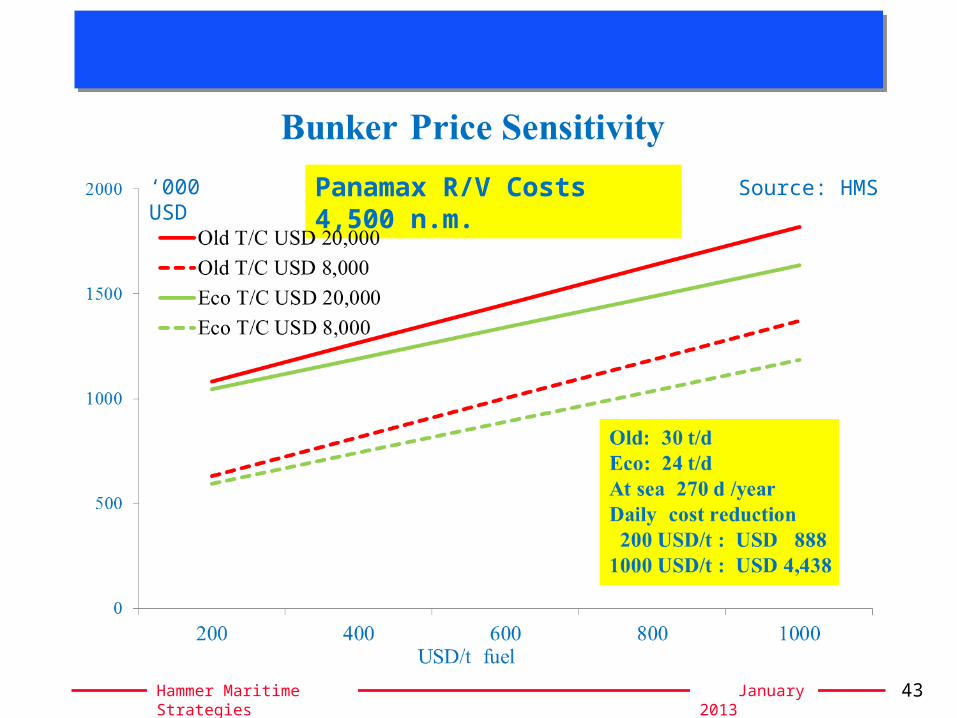
‘000 USD Source: HMSPanamax R/V Costs 4,500 n.m.
HM Strategies ///
January 2013Hammer Maritime Strategies 44
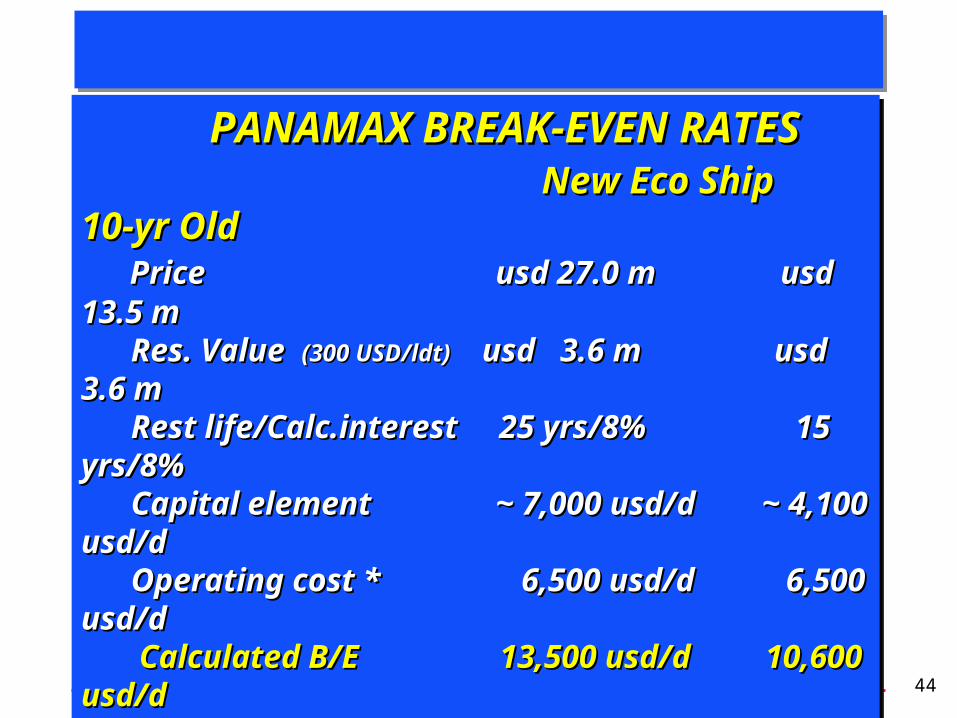
PANAMAX BREAK-EVEN RATESPANAMAX BREAK-EVEN RATES New Eco Ship 10-yr Old New Eco Ship 10-yr Old
Price usd 27.0 m usd 13.5 mPrice usd 27.0 m usd 13.5 m Res. Value Res. Value (300 USD/ldt) (300 USD/ldt) usd 3.6 m usd 3.6 musd 3.6 m usd 3.6 m Rest life/Calc.interest 25 yrs/8% 15 yrs/8%Rest life/Calc.interest 25 yrs/8% 15 yrs/8% Capital element ~ 7,000 usd/d ~ 4,100 usd/dCapital element ~ 7,000 usd/d ~ 4,100 usd/d Operating cost * 6,500 usd/d 6,500 usd/dOperating cost * 6,500 usd/d 6,500 usd/d Calculated B/E 13,500 usd/d 10,600 usd/d Calculated B/E 13,500 usd/d 10,600 usd/d
Bunker advantage Bunker advantage (270 days at sea)(270 days at sea)
200 usd/t ~ 900 usd/d200 usd/t ~ 900 usd/d 600 usd/t ~ 2,700 usd/d600 usd/t ~ 2,700 usd/d 1,000 usd/t ~ 4,400 usd/d 1,000 usd/t ~ 4,400 usd/d Source: HMSSource: HMS
HM Strategies ///
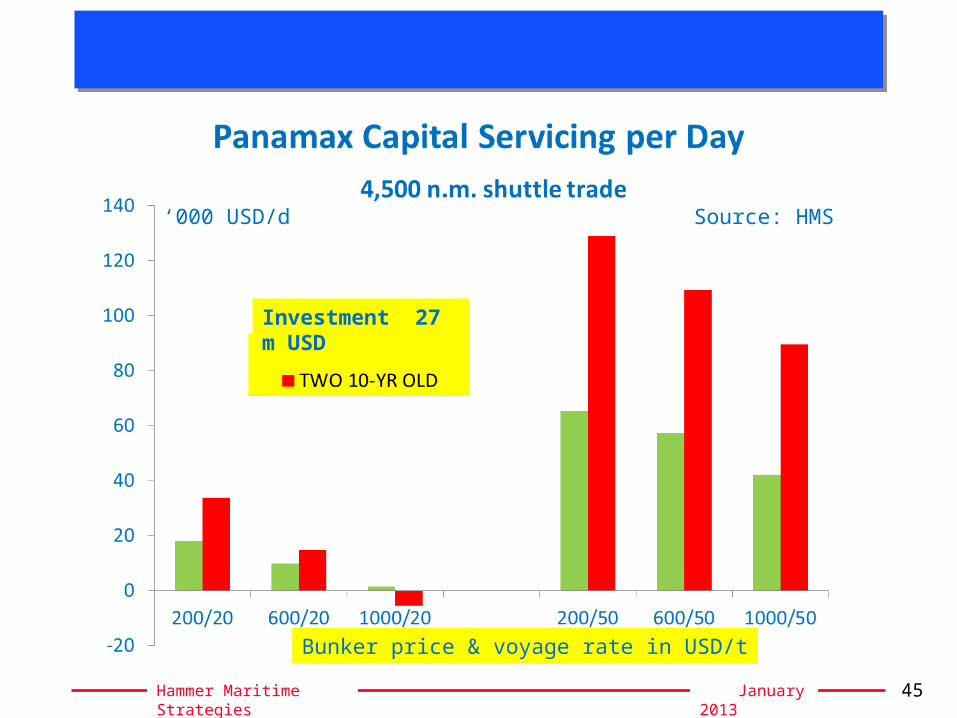
January 2013Hammer Maritime Strategies 45
‘000 USD/d Source: HMS
Bunker price & voyage rate in USD/t
Investment 27 m USD