Embed Size (px)
Citation preview

NEXON Co., Ltd.
Nexon Investor Presentation
Q3 2012

2
Q3 2012 Results

3
Highlights
Quarterly revenue of ¥24.2 bn and operating income of ¥10.0 bn – Revenues flat YoY, up 3% on constant currency basis, slightly below (-2.8%) management outlook
– Operating income down 8% YoY, above (+8.5%) management outlook; operating margins of 41%
– China continues to grow, with revenues of ¥11.4 bn (+31% YoY, +36% on constant currency basis)
– High level of competition in Korea in Q3 relative to Nexon’s release and update schedule
Transformative acquisition of gloops, Inc. – Establishes Nexon as the #1 independent mobile game developer1 by revenue
– Immediately accretive to Nexon
– Strong growth opportunities in Japan and internationally
– Diversifies revenue base significantly
Entering 2013 with strongest pipeline to date – Dota 2 reinforces our competitive position in Korea and Japan; expected launch mid-2013
– FIFA Online 3: positive feedback/engagement metrics collected from first closed beta
– Q4 pipeline also includes Counter-Strike Online 2, Warface, Epic of the Three Kingdoms
Revising Q4 outlook to reflect competitive environment, gloops acquisition and pipeline
1 Based on publicly available information

4
Summary of results1 and key operational metrics
1 Prepared in accordance with Japanese GAAP, which is rounded down to the nearest million yen.
2 Adjusted net income is a non-GAAP measure that excludes non-cash amortization of goodwill related to our acquisitions and negative goodwill in the
case of acquisitions occurring before April 1, 2010, which is required under Japanese GAAP. We provide this information to investors for the purpose of
comparing our net income with that of companies that do not amortize goodwill or negative goodwill associated with acquisitions in their financial results,
including those reporting in accordance with U.S. GAAP.
3 Adjusted to reflect the 1:100 stock split that occurred on July 21, 2011.
(in ¥ millions, except per share data and metrics)
Prev. vs.
Q3 2011 Q4 2011 Q1 2012 Q2 2012 Q3 2012 Outlook QoQ YoY Outlook
Revenues ¥24,156 ¥22,190 ¥30,377 ¥22,876 ¥24,256 ¥24,943 6.0% 0.4% -2.8%
Operating income 10,948 9,354 17,384 10,678 10,032 9,249 -6.0% -8.4% 8.5%
Ordinary income 10,170 8,627 17,677 9,368 9,057 9,191 -3.3% -10.9% 1.5%
Net income 7,232 5,815 12,377 6,768 6,348 6,598 -6.2% -12.2% -3.8%
Adjusted net income2 7,582 6,153 12,738 7,148 6,791 7,007 -5.0% -10.4% -3.1%
Earnings per share3
Basic EPS 20.39 15.59 28.82 15.63 14.63 15.30
Adjusted EPS 21.37 16.49 29.66 16.51 15.65 16.24
Customer metrics
MAU (millions) 87.3 80.0 82.8 77.4 78.8
Pay Rate 9.3% 9.9% 10.9% 10.3% 9.6%
ARPPU ¥1,486 ¥1,350 ¥1,761 ¥1,521 ¥1,729

5
Quarterly revenues and operating income
24,156
22,190
30,377
22,876
24,256
0
5,000
10,000
15,000
20,000
25,000
30,000
35,000
Q3 2011 Q4 2011 Q1 2012 Q2 2012 Q3 2012
Revenues
10,948
9,354
17,384
10,678 10,032
0
5,000
10,000
15,000
20,000
25,000
30,000
35,000
Q3 2011 Q4 2011 Q1 2012 Q2 2012 Q3 2012
Operating income (Unit: ¥ millions)

Q3 2012 Regional Highlights
6

7
Revenue by region1
Q3 2012 revenue by region
Japan 13%
Korea 27% China
47%
North America
6%
Others 7%
1 Based on the region in which revenues originate.
Not a presentation of our revenues according to Nexon entities. 2 Others: United Kingdom, other Asian countries, and South American countries. 3 YoY Constant currency is the growth rate had the currency rate not changed from Q3 2011.
Rates used: 1,344 Korean won/100 Japanese yen, 12.39 Japanese yen/Chinese yuan, and 80.66 Japanese yen/U.S. dollar.
(in ¥ millions)
YoY YoY
Q3 2011 Q4 2011 Q1 2012 Q2 2012 Q3 2012 As-reported Constant currency 3
China ¥8,684 ¥8,281 ¥15,175 ¥10,737 ¥11,404 31% 36%
Korea 8,521 7,224 8,856 6,251 6,578 -23% -20%
Japan 3,459 3,687 3,096 2,826 3,231 -7% -7%
North America 1,700 1,407 1,397 1,515 1,340 -21% -22%
Europe and others 2 1,791 1,590 1,850 1,545 1,701 -5% 1%
Total 24,156 22,190 30,377 22,876 24,256 0% 3%

Continued strength; largest portion of revenue
Growth driven primarily by top 2 titles –
Dungeon&Fighter and Counter-Strike Online – both
launching successful updates for summer and national
holidays
Upcoming pipeline: Cyphers
– Award winning action MMO gaining traction in Korea
– Alpha test: Q4 2012
– Commercial launch: 2013
8
China – Highlights
8,684 8,281
15,175
10,737
11,404
0
2,000
4,000
6,000
8,000
10,000
12,000
14,000
16,000
Q3 2011 Q4 2011 Q1 2012 Q2 2012 Q3 2012
YoY% change
As-reported: +31%
Constant currency: +36%
(Unit: ¥ millions)

9
Korea – Highlights
As anticipated at last quarter’s update, a competitive
quarter in the region’s peak season for games
– Several blockbuster releases by global competitors
impacted the hardcore market
– Our key titles – MapleStory, Dungeon&Fighter, Sudden
Attack – maintained top positions
– No major Nexon releases or updates
Nexon updates for the quarter prioritized user retention
rather than monetization
– Strengthened gameplay elements to keep players engaged
and extend game lifetimes
– Short-term impact on revenue as a result
Solid slate of new games for Q4 and 2013
– Dota 2, FIFA Online 3, Counter-Strike Online 2, Warface,
Epic of the Three Kingdoms, and others
– Mabinogi 2: first collaborative project with NCsoft
8,521
7,224
8,856
6,251 6,578
0
1,000
2,000
3,000
4,000
5,000
6,000
7,000
8,000
9,000
10,000
Q3 2011 Q4 2011 Q1 2012 Q2 2012 Q3 2012Epic of the
Three Kingdoms
YoY% change
As-reported: -23%
Constant currency: -20%
(Unit: ¥ millions)
10
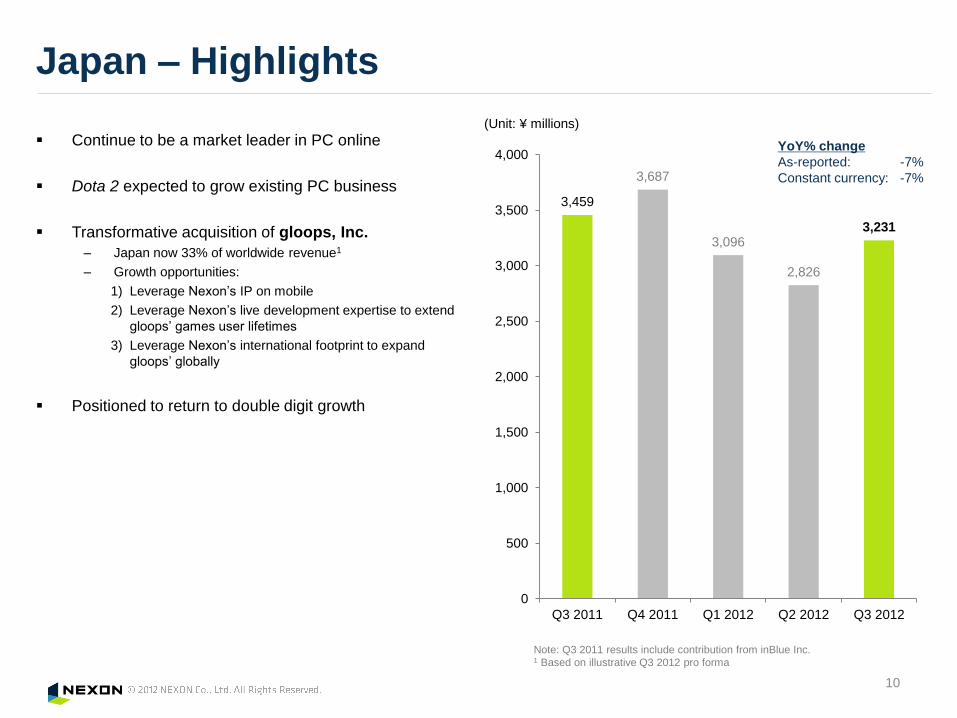
Japan – Highlights
Continue to be a market leader in PC online
Dota 2 expected to grow existing PC business
Transformative acquisition of gloops, Inc.
– Japan now 33% of worldwide revenue1
– Growth opportunities:
1) Leverage Nexon’s IP on mobile
2) Leverage Nexon’s live development expertise to extend
gloops’ games user lifetimes
3) Leverage Nexon’s international footprint to expand
gloops’ globally
Positioned to return to double digit growth
3,459
3,687
3,096
2,826
3,231
0
500
1,000
1,500
2,000
2,500
3,000
3,500
4,000
Q3 2011 Q4 2011 Q1 2012 Q2 2012 Q3 2012
Note: Q3 2011 results include contribution from inBlue Inc. 1 Based on illustrative Q3 2012 pro forma
YoY% change
As-reported: -7%
Constant currency: -7%
(Unit: ¥ millions)

11
North America/Europe and others – Highlights
Europe and others
Europe up 12% YoY on a constant currency basis
Continue to build out team in our new Luxembourg office
Focused on establishing the infrastructure needed to support
larger games in the market
1,700
1,407 1,397 1,515
1,340
0
200
400
600
800
1,000
1,200
1,400
1,600
1,800
Q3 2011 Q4 2011 Q1 2012 Q2 2012 Q3 2012
1,791 1,590
1,850
1,545 1,701
0
500
1,000
1,500
2,000
2,500
Q3 2011 Q4 2011 Q1 2012 Q2 2012 Q3 2012
North America
Hacking and server issues under control
Focusing on customer acquisition and retention to rebuild our
userbase
Made changes to management team and added key live
operations personnel from Korea
YoY% change
As-reported: -21%
Constant currency: -22%
YoY% change
As-reported: -5%
Constant currency: +1%
(Unit: ¥ millions)
(Unit: ¥ millions)

Q4 2012 and Full Year Business Outlook
12

13
Summary of business outlook
1 Adjusted net income is a non-GAAP measure that excludes non-cash amortization of goodwill related to our acquisitions and negative goodwill in the case of acquisitions occurring
before April 1, 2010(, which is required under Japanese GAAP. We provide this information to investors for the purpose of comparing our net income with that of companies that do not
amortize goodwill or negative goodwill associated with acquisitions in their financial results, including those reporting in accordance with U.S. GAAP.
2 Adjusted to reflect the 1:100 stock split that occurred on July 21, 2011.
3 Business outlook includes amortization impacts resulting from consolidation
“Tier 2” content updates focused on supporting game community rather than bolstering near-term revenue
Lowered guidance reflects reduced expectations in North America and Europe regions for the upcoming holiday season
and focus on engagement over near-term monetization for Korea and China
Japan expected to return to double digit growth in Q4 with gloops
(in ¥ millions)
Prev. Outlook Revised Outlook
Nexon Group (excluding gloops) gloops (standalone) Nexon Group (including gloops)3
Full year 2012 Q4 2012 Full year 2012 Q4 2012 Full year 2012 Q4 2012 Full year 2012
Revenues 104,334 21,263 ~ 24,000 98,773 ~ 101,510 6,200 ~ 6,700 6,200 ~ 6,700 27,463 ~ 30,700 104,973 ~ 108,210
Operating income 47,082 5,580 ~ 8,102 43,676 ~ 46,198 1,500 ~ 1,800 1,500 ~ 1,800 6,335 ~ 9,157 44,431 ~ 47,253
Ordinary income 46,043 5,770 ~ 8,292 41,873 ~ 44,395 1,500 ~ 1,800 1,500 ~ 1,800 6,525 ~ 9,347 42,628 ~ 45,450
Net income 32,737 3,188 ~ 5,099 28,684 ~ 30,594 900 ~ 1,080 900 ~ 1,080 3,381 ~ 5,471 28,876 ~ 30,966
Adjusted net income1 34,294 3,597 ~ 5,507 30,275 ~ 32,185 900 ~ 1,080 900 ~ 1,080 4,441 ~ 6,531 31,119 ~ 33,210
Earnings per share2
Basic EPS 75.88 7.34 ~ 11.74 66.31 ~ 70.72 7.78 ~ 12.59 66.75 ~ 71.59
Adjusted EPS 79.49 8.28 ~ 12.68 69.99 ~ 74.40 10.22 ~ 15.03 71.94 ~ 76.77

Acquisition of gloops
14

15
Overview
Immediate and significant opportunities
in the Japanese mobile games market – Mobile is now the largest market by revenue in Japan
– Mobile games market estimated to be ¥425 billion1 in 2012
Overview of gloops, Inc. – Founded: 2005
– Located: Tokyo, Japan
– Financials for 12 months ended June 30, 20122
• Revenue: ¥23.7 billion
• Operating income: ¥5.8 billion
– Robust IP portfolio
Transaction details – Transaction amount: JPY 36.5 billion
– Financed from cash on hand
– Transaction closed October 1, 2012
425
281
80
-
100
200
300
400
500
Mobile Console PC online
(Unit: ¥ billions)
2012 Japanese game markets size estimates1
Guardians of the Royale Three Kingdoms Guild Battle
Warriors of Odin Japan Pro Baseball Card Battle
1 Sources: Nomura Equity Research (Mobile), Enterbrain, Inc. (Console).
Console revenue excludes hardware sales. 2 Unaudited.

16
Transformative deal driving Nexon’s mobile expansion
Strong financial contribution – ¥36.5 billion purchase price: 5.5x EV/EBITDA1
– Immediately accretive to Nexon
Substantial opportunities for growth 1) Combine Nexon’s popular IP with gloops’ world-class mobile development
2) Leverage Nexon’s live game development expertise to extend user lifetimes of gloops’ games
3) Leverage Nexon’s substantial international footprint to expand gloops’ business globally
Transform Nexon’s base of business – #1 independent mobile developer 2
– 20-25% of revenues now from mobile
– Japan now contributes 33% to revenues 3
1 Based on gloops’ balance sheet and financials for most recent fiscal year ended June 30, 2012 2 Based on publicly available information 3 Based on illustrative Q3 2012 pro forma

17
Illustrative pro forma: Q3 2012
Nexon Group Q3 2012 Pro Forma1
1 For illustrative purposes only.
Based on Nexon’s Q3 2012 revenue and gloops’ unaudited quarterly revenue
for the 3 months ended September 30, 2012.
Financial impact
(Units: ¥ billion)
Regional diversity
Platform expansion
24.2 31.1
10.0 11.5
gloops
Nexon group
Revenue
Operating income
13%
27% 47%
6%
7%
33%
21%
37%
4% 5%
China Korea
North
America
Others
Japan
China
Korea
North
America Others
Japan
3%
97%
24%
76% PC Online
Mobile
Mobile
PC Online

18
Key Titles
XXX Three Kingdoms Guild Battle
Warriors of Odin
Japan Pro Baseball Card Battle
Guardians of the Royale
Online real-time synchronous battles among player guilds.
Features characters from Three Kingdoms lore.
Online real-time synchronous battles among player guilds.
Set in a fantasy world, players fight alongside Odin to defeat
the dark forces of Ragnarok.
Card battle game based on Japan’s official professional baseball
league. Over 1,200 cards available based on real life players.
Evolutionary step in synchronous gameplay, with battles
between guilds taking place on interactive maps adding
freedom of movement to gameplay
19
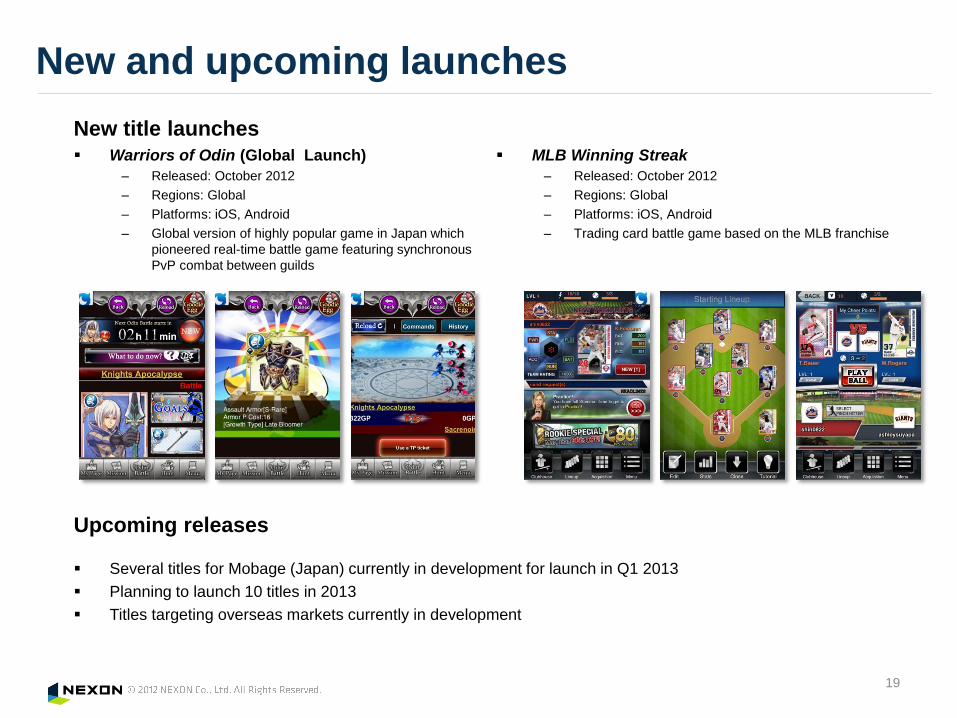
New and upcoming launches
Upcoming releases
Several titles for Mobage (Japan) currently in development for launch in Q1 2013
Planning to launch 10 titles in 2013
Titles targeting overseas markets currently in development
New title launches
MLB Winning Streak
– Released: October 2012
– Regions: Global
– Platforms: iOS, Android
– Trading card battle game based on the MLB franchise
Warriors of Odin (Global Launch)
– Released: October 2012
– Regions: Global
– Platforms: iOS, Android
– Global version of highly popular game in Japan which
pioneered real-time battle game featuring synchronous
PvP combat between guilds

20
Upcoming Pipeline

21
Key upcoming titles: Dota 2 and FIFA Online 3
Regions: Korea
Launch schedule
– 2nd CBT: November 27
– OBT: December
– Commercial launch: 2013
Extremely positive feedback and high retention rates
from 1st CBT held in September
Regions: Korea, Japan
Expected launch: mid-2013
Sequel to the pioneer of “multiplayer online battle
arena” games which inspired League of Legends
172,000 MCCU1 generated in North America’s OBT
1 Maximum Concurrent Users
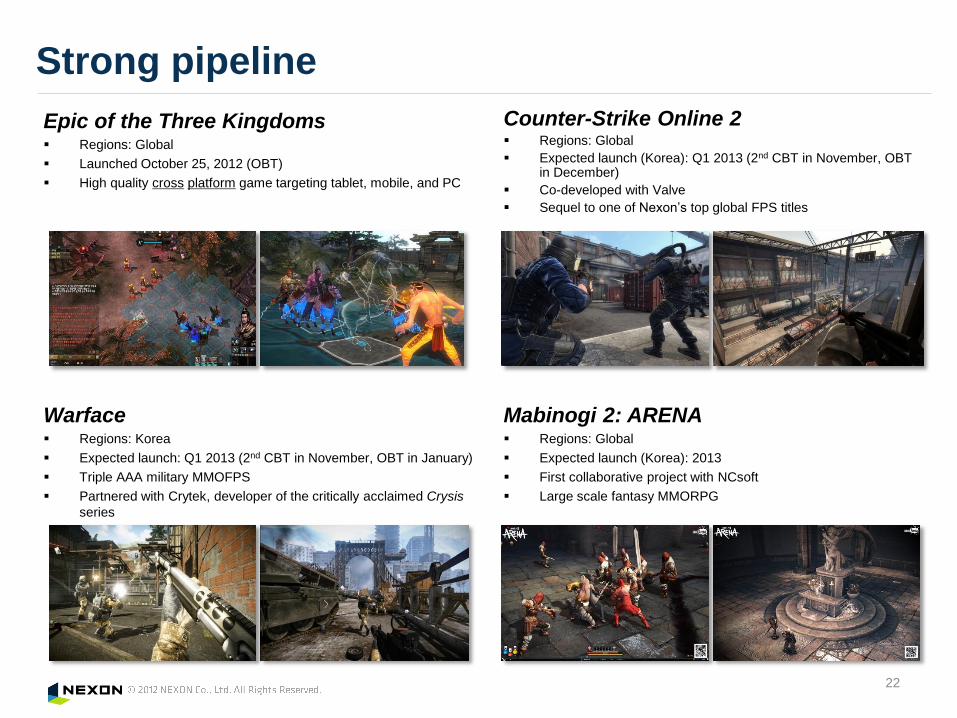
Mabinogi 2: ARENA Regions: Global
Expected launch (Korea): 2013
First collaborative project with NCsoft
Large scale fantasy MMORPG
22
Strong pipeline
Counter-Strike Online 2 Regions: Global
Expected launch (Korea): Q1 2013 (2nd CBT in November, OBT in December)
Co-developed with Valve
Sequel to one of Nexon’s top global FPS titles
Warface Regions: Korea
Expected launch: Q1 2013 (2nd CBT in November, OBT in January)
Triple AAA military MMOFPS
Partnered with Crytek, developer of the critically acclaimed Crysis
series
Epic of the Three Kingdoms Regions: Global
Launched October 25, 2012 (OBT)
High quality cross platform game targeting tablet, mobile, and PC

23
Introduction to Nexon’s Business

24
Nexon overview
Note: 2001 to 2007 revenues from audit reports of NXC, Nexon’s parent company. 2008 revenues from Nexon’s unaudited Consolidated Financial Statements.
Revenue breakdown by region is available from 2009.
2001 2002 2003 2004 2005 2006 2007 2008 2009 2010 2011
Other
North America
Japan
Korea
China
1.3 billion+ cumulative player registrations
60 titles+ in games portfolio
100 countries+ serviced
10 years+ of revenue growth

25
Pioneers of the Free-to-play (F2P) business model
Counter-Strike Online In-Game Item Shop
MapleStory In-Game Item Shop
Counter-Strike Online Gameplay
MapleStory Gameplay
Free-to-play (F2P): Users play games for free and use virtual currency
to purchase in-game items to enhance their playing experience

26
F2P: Revenue model
MASSIVE AUDIENCE (MAU1)
Pay rate
ARPPU2
Retention
FY2011 Consolidated Revenue: ¥87.6 billion
As of Q3 2012:
- MAU: 78.8 million
- Pay rate: 9.6%
- ARPPU: ¥1,729
1 Monthly Active Users
2 Average Revenue per Paying User

27
F2P: Revenues and development costs
Time
Initial
Costs Continuous Development Initial Costs
Revenue
Generating
Period
1 – 2 years
Product
Development
Period
2 – 5 years
Time
Develo
pm
ent C
ost
Revenue
Generating
Period
Over 10 years
Product
Development
Period
1 – 3 years
Time
Develo
pm
ent C
ost
F2P Online Packaged Goods
F2P Online
Packaged Goods
Revenues
Development costs
Revenues

28
Key franchises
Title Year of Launch Cumulative Gross Revenue 1
2005 $2,000,000,000+
2003 $1,500,000,000+
2004 $500,000,000+
2008 $400,000,000+
2004 $300,000,000+
2006 $300,000,000+
2008 $100,000,000+
1 Cumulative gross revenue over the life of each game as of March 31, 2012 includes revenue received from local publishing partners in areas where Nexon doesn’t publish
directly (e.g. China), and those generated prior to acquisition by Nexon (MapleStory in 2004, Dungeon&Fighter in 2008, Sudden Attack in 2010, and Atlantica in 2010). 2 Shared franchise jointly developed by Nexon and Valve.
2

29
Growth drivers
Expansion to new geographies
Growth of existing titles
Expansion onto new platforms
Introduction of new IP
Epic of the Three Kingdoms

30
Growth drivers: Growth of existing titles
2004 2005 2006 2007 2008 2009 2010 2011
Korea (2004)
China (2005)
Taiwan (2005)
North America (2008)
Europe (2010)
Japan (2005)
( ) indicates year of launch
“Mabinogi”: Revenue by Geographic Market

31
Growth drivers: Introduction of new IP
Epic of the Three Kingdoms

32
Growth drivers: Expansion to new geographies
1996 1997 1998 1999 2000 2001 2002 2003 2004 2005 2006 2007 2008 2009 2010
(Kingdom of the Winds)
2011
Q3 2012 revenue breakdown by region
Japan 13%
Korea 27% China
47%
North America
6%
Others 7%

33
Growth drivers: Expansion onto new platforms

34
Worldwide leader in immersive F2P games
Offline Online
Single Player Multiplayer
Pay-to-play Free-to-play

This presentation is prepared to offer reference information about NEXON group to the investors. NEXON Co., Ltd. (“Nexon”) has not verified and would assume no responsibility for the accuracy, appropriation, or completeness thereof. This presentation does not contain all relevant information relating to Nexon or the sale of its shares, including, without limitation, the information that would be stated under the captions “Risk Factors”, “Management’s Discussion and Analysis of Financial Condition and Results of Operations” and “Business” in an annual report. Any investment decision with respect to any shares of Nexon should be made solely upon the basis of the information contained in the disclosure documents and is qualified in its entirety by reference to the detailed information appearing in the disclosure documents.
This presentation includes forward-looking statements. In some cases, you can identify forward-looking statements by terms such as “anticipate”, “assume”, “believe”, “estimate”, “expect”, “forecast”, “may”, “plan”, “potential”, “predict”, “seek”, “should”, or “will”, or by other similar terminology. These statements discuss expectations, identify strategies, contain projections of Nexon’s financial condition or results of operations or state other forward-looking information. The forward-looking statements in this presentation are subject to various risks, uncertainties and assumptions about Nexon’s business and results of operations. The expectations expressed in these forward-looking statements may not be achieved, and actual results could differ materially from and be worse than expectations. Potential risks and uncertainties that could cause actual results to differ materially from expectations include, without limitation:
Continued growth and popularity of Nexon’s key titles;
Nexon’s ability to maintain favorable relationships with key licensing partners;
Nexon’s continued ability to offer games in China, through local partners or otherwise;
Nexon’s ability to compete effectively in the online games industry;
Nexon’s ability to address hacking, viruses, security breaches and other technical challenges;
Fluctuations in currency exchange rates;
Nexon’s ability to maintain and further develop its brand name;
Effective acquisition of new companies, businesses, technologies and games from third parties and the possibility of recognizing impairment losses;
Continued growth of the online games market, including the underlying infrastructure, and free-to-play/item-based revenue generation model;
Nexon’s ability to adapt to new technologies;
Nexon’s ability to enter into licensing arrangements for third-party titles on terms favorable to it;
Effective defense of Nexon’s intellectual property; and
Legislative, regulatory, accounting and taxation changes in the countries in which Nexon operates.
Nexon does not intend, and disclaims any duty, to update or revise any forward-looking statements contained in this presentation to reflect new
information, future events or otherwise. We caution you not to place undue reliance on the forward-looking statements contained in this presentation.
35
Disclaimer