Embed Size (px)
Citation preview
HKT Hong Kong Enterprise
Cyber Security Readiness
Index 2021
April 2018
Table of Content
1. Introduction ................................................................................................ 2
1.1 Background ........................................................................................................................ 2
1.2 The Index ........................................................................................................................... 2
1.3 Thematic Survey of the Year ............................................................................................. 2
1.4 Structure of Report ............................................................................................................ 3
2. Methodology .............................................................................................. 4
2.1 Framework of the Index .................................................................................................... 4
2.2 Sample Distribution ........................................................................................................... 5
2.3 Profile of Respondents ...................................................................................................... 6
3. Findings ...................................................................................................... 8
3.1 Cyber Security Environment .............................................................................................. 8
3.2 The Index ......................................................................................................................... 13
3.3 Thematic Survey of the Year: Managed Security Services (MSS) .................................... 19
3.4 Investment Plans in the Coming 12 Months ................................................................... 19
4 Conclusion & Recommendations ............................................................... 24
4.1 Key Findings ..................................................................................................................... 24
4.2 Recommendations ........................................................................................................... 27
1. Introduction
1.1 Background
Information Technology (IT) is already an essential and crucial element in our daily lives. Both individuals and business parties are inter-connected through the network of the “cyber world”. However, like the real world, the cyber world is exposed to various security threats that can cause immense impact and damage. The HKSAR Government issued the first Smart City Blueprint for Hong Kong in December 2017, aiming to enhance the effectiveness of city management and improve people's quality of living as well as Hong Kong's attractiveness and sustainability by making use of innovation and technology. It involves the promotion of digital transformation in every industry and in the daily lives of citizens, more intensive network communications and the use of big data, providing opportunities for both general users and attackers. Hence, efforts have to be made to regularly monitor the status of cyber security readiness and ensure it can keep up with technological change.
1.2 HKT Hong Kong Enterprise Cyber Security Readiness Index
In view of the above background, the Hong Kong Productivity Council (HKPC), with the support of the Hong Kong Computer Emergency Response Team Coordination Centre (HKCERT), developed a comprehensive framework to construct the Hong Kong Enterprise Cyber Security Readiness Index (to keep track of the status of local cyber security awareness and readiness in business sectors to raise public awareness, to facilitate policy formulation and to support preventive measures to tackle cyber threats. In 2021, HKPC conducted the fourth survey applying this framework with the sponsorship of HKT. Named HKT Hong Kong Enterprise Cyber Security Readiness Index (the Index) to reflect this collaboration, the methodology of the survey, the design of questionnaire and the execution of the interview were decided and conducted by HKPC independently.
1.3 Thematic Survey of the Year
Besides the Index, the survey also picks one special topic each year for in-depth study. For 2021, the chosen special topic was “Managed Security Services” (MSS). An emerging hot topic, MSS is an outsourcing model of security expertise. With the growing success of cloud computing as the forerunner of IT infrastructure and application outsourcing, more people are looking into outsourcing their security management. An all-round MSS provider aims at helping enterprises to assess, mitigate and prevent the threats of cyber attacks. It offers all levels of enterprise network security services, ranging from designing security policies and measures, conducting security tests, to integrating
security solutions and providing secure broadband connectivity, to meet the demands from customer ranging from SMEs to the most demanding multinational companies. Hence, it is worthwhile to study the status of demand and current deployment of MSS among Hong Kong enterprises and its upcoming trend.
1.4 Structure of Report
This report sets out our approach and methodology in conducting the Index survey, before providing the survey findings and presenting the results of data analysis. After this introductory chapter, the rest of this report is structured as follows:
Chapter 2 describes the methodology of the study in detail;
Chapter 3 presents the survey results, data analysis and major findings; and Chapter 4 introduces the conclusions and recommendations.
2. Methodology
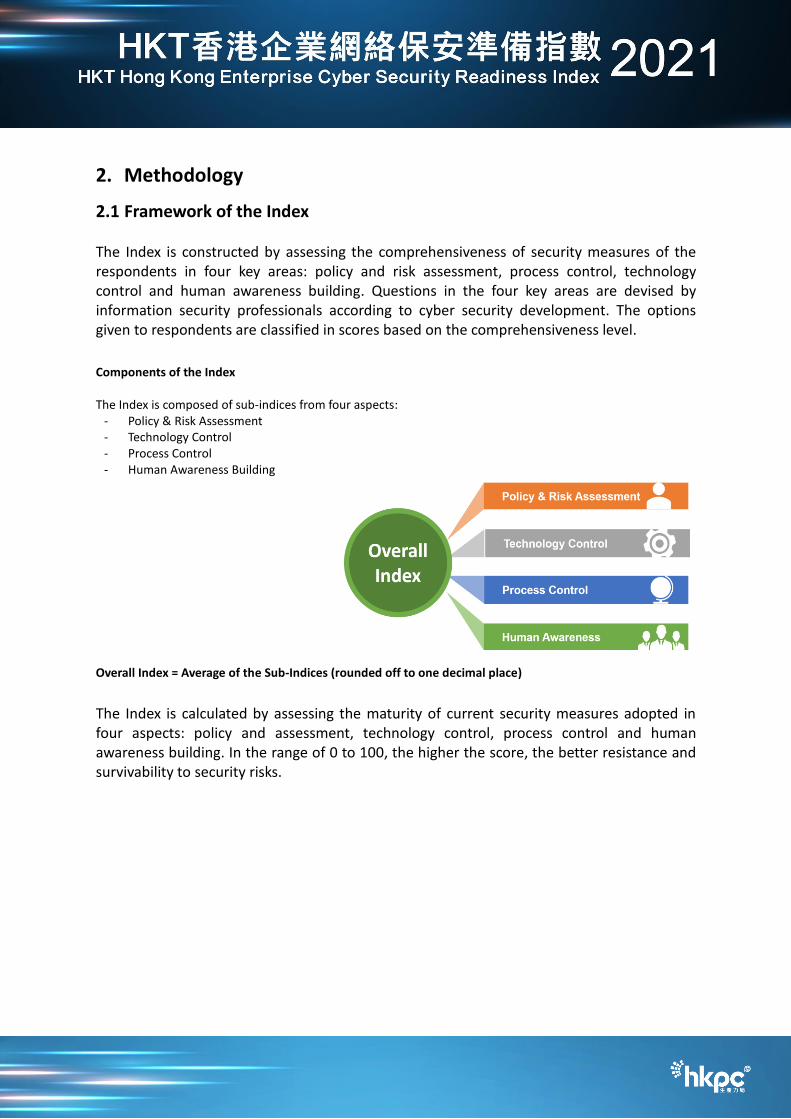
2.1 Framework of the Index The Index is constructed by assessing the comprehensiveness of security measures of the respondents in four key areas: policy and risk assessment, process control, technology control and human awareness building. Questions in the four key areas are devised by information security professionals according to cyber security development. The options given to respondents are classified in scores based on the comprehensiveness level.
Components of the Index The Index is composed of sub-indices from four aspects:
- Policy & Risk Assessment - Technology Control - Process Control - Human Awareness Building
Overall Index = Average of the Sub-Indices (rounded off to one decimal place)
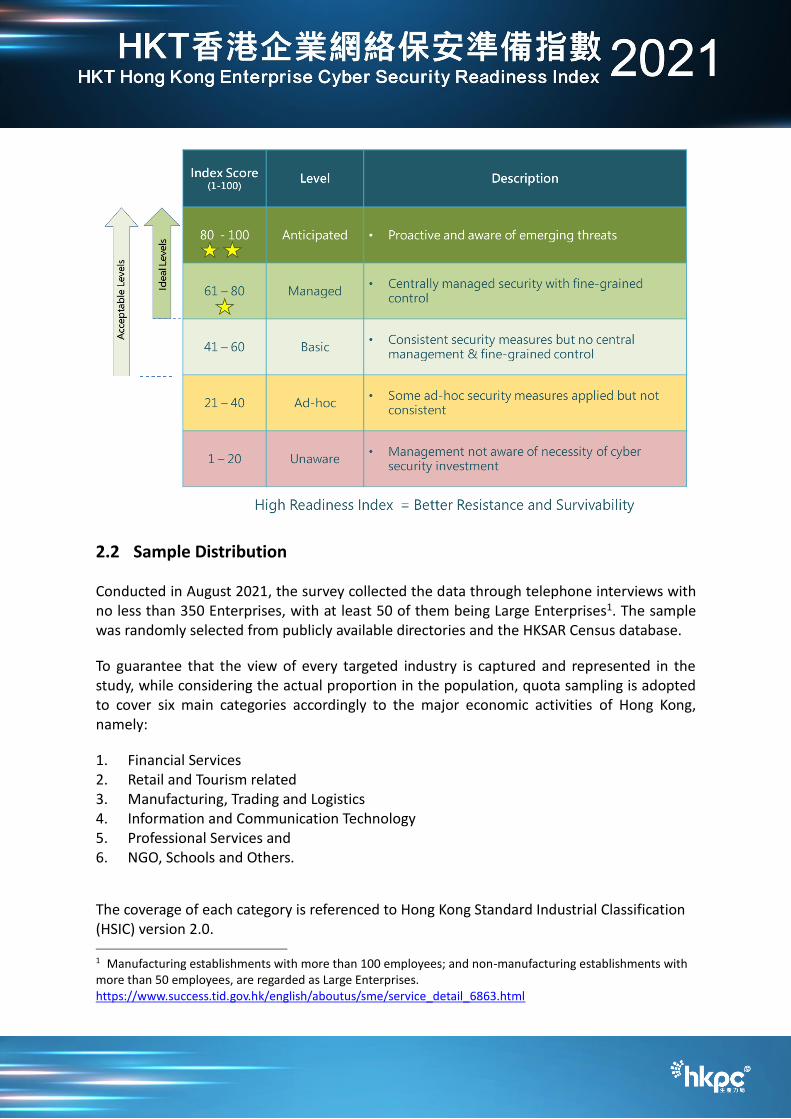
The Index is calculated by assessing the maturity of current security measures adopted in four aspects: policy and assessment, technology control, process control and human awareness building. In the range of 0 to 100, the higher the score, the better resistance and survivability to security risks.
2.2 Sample Distribution
Conducted in August 2021, the survey collected the data through telephone interviews with no less than 350 Enterprises, with at least 50 of them being Large Enterprises1. The sample was randomly selected from publicly available directories and the HKSAR Census database.
To guarantee that the view of every targeted industry is captured and represented in the study, while considering the actual proportion in the population, quota sampling is adopted to cover six main categories accordingly to the major economic activities of Hong Kong, namely:
1. Financial Services 2. Retail and Tourism related 3. Manufacturing, Trading and Logistics 4. Information and Communication Technology 5. Professional Services and 6. NGO, Schools and Others.
The coverage of each category is referenced to Hong Kong Standard Industrial Classification (HSIC) version 2.0. 1 Manufacturing establishments with more than 100 employees; and non-manufacturing establishments with more than 50 employees, are regarded as Large Enterprises. https://www.success.tid.gov.hk/english/aboutus/sme/service_detail_6863.html
Category Coverage
1. Financial Services Banking/ Securities/ Insurance/ Other financial services
2. Retail and Tourism related Retail/ Food & Beverage/ Accommodation/ Travel Services
3. Manufacturing, Trading and Logistics Manufacturing/ Import & export/ Wholesales/ Logistics
4. Information and Communication Technology Information and Communication Technology
5. Professional Services Legal/ Accounting/ Auditing/ Company secretary/ Consultancy, etc.
6. NGO, Schools and Others NGO, Schools and Others
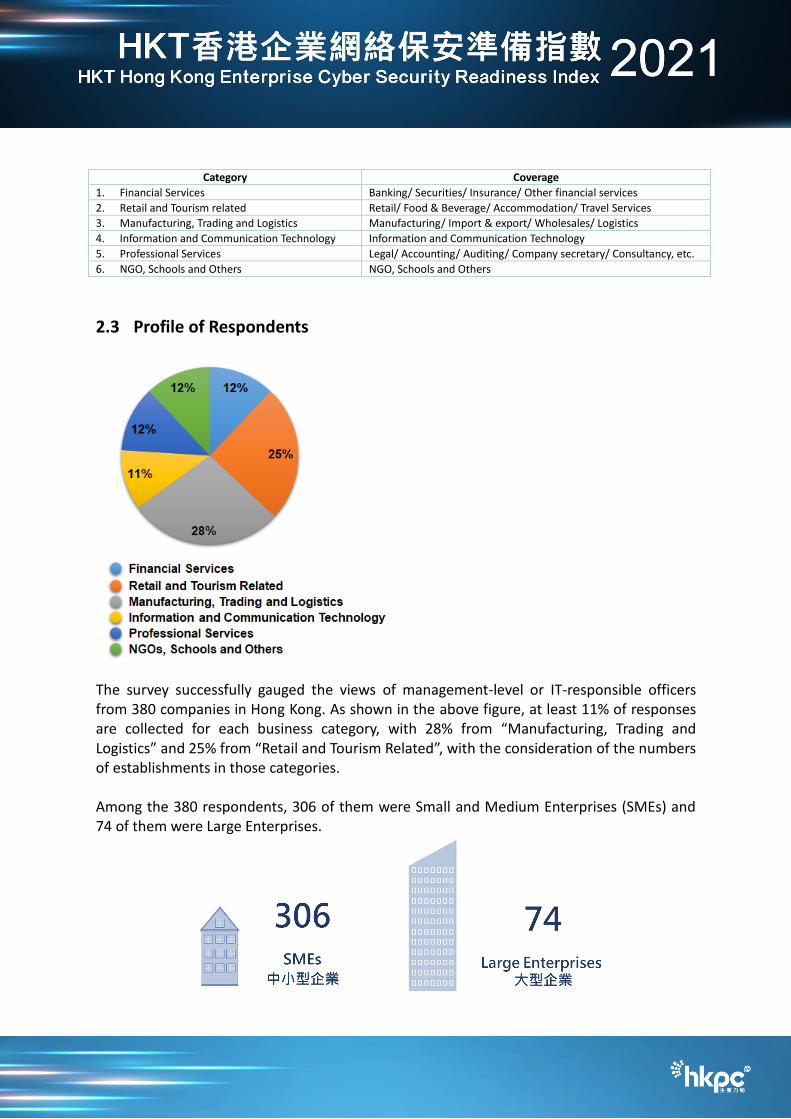
2.3 Profile of Respondents
The survey successfully gauged the views of management-level or IT-responsible officers from 380 companies in Hong Kong. As shown in the above figure, at least 11% of responses are collected for each business category, with 28% from “Manufacturing, Trading and Logistics” and 25% from “Retail and Tourism Related”, with the consideration of the numbers of establishments in those categories. Among the 380 respondents, 306 of them were Small and Medium Enterprises (SMEs) and 74 of them were Large Enterprises.
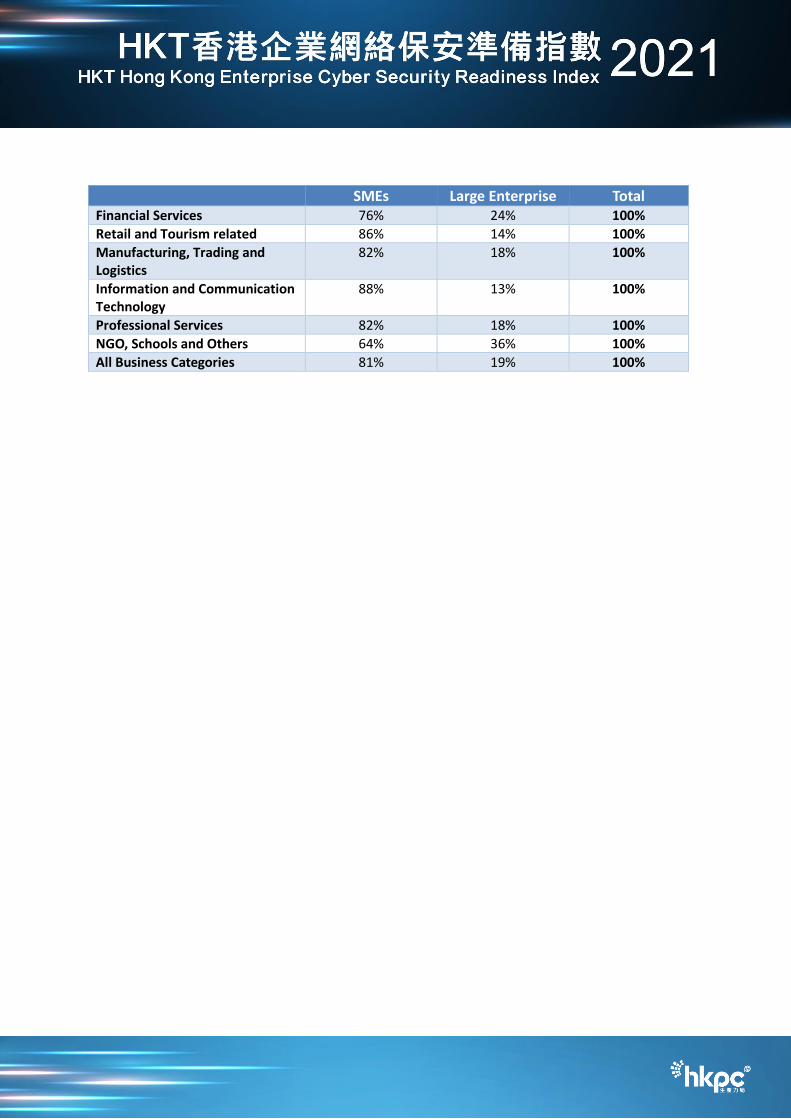
SMEs Large Enterprise Total Financial Services 76% 24% 100%
Retail and Tourism related 86% 14% 100%
Manufacturing, Trading and Logistics
82% 18% 100%
Information and Communication Technology
88% 13% 100%
Professional Services 82% 18% 100%
NGO, Schools and Others 64% 36% 100%
All Business Categories 81% 19% 100%
3. Findings
This chapter presents the survey findings and data analysis for the study and is divided into four sub-sections. The topics covered are as follows: 1. Cyber Security Environment 2. The Index 3. Thematic Survey of the Year: MSS 4. Investment Plans for Cyber Security The survey successfully interviewed 380 enterprises - 306 SMEs and 74 Large Enterprises.
3.1 Cyber Security Environment
This sub-section discusses the cyber security environment of the surveyed companies, including:
Views on the Importance of IT System & Data Type of Data Stored Cyber Attacks Experienced in the Past 12 Months
3.1.1 Views on the Importance of IT System & Data
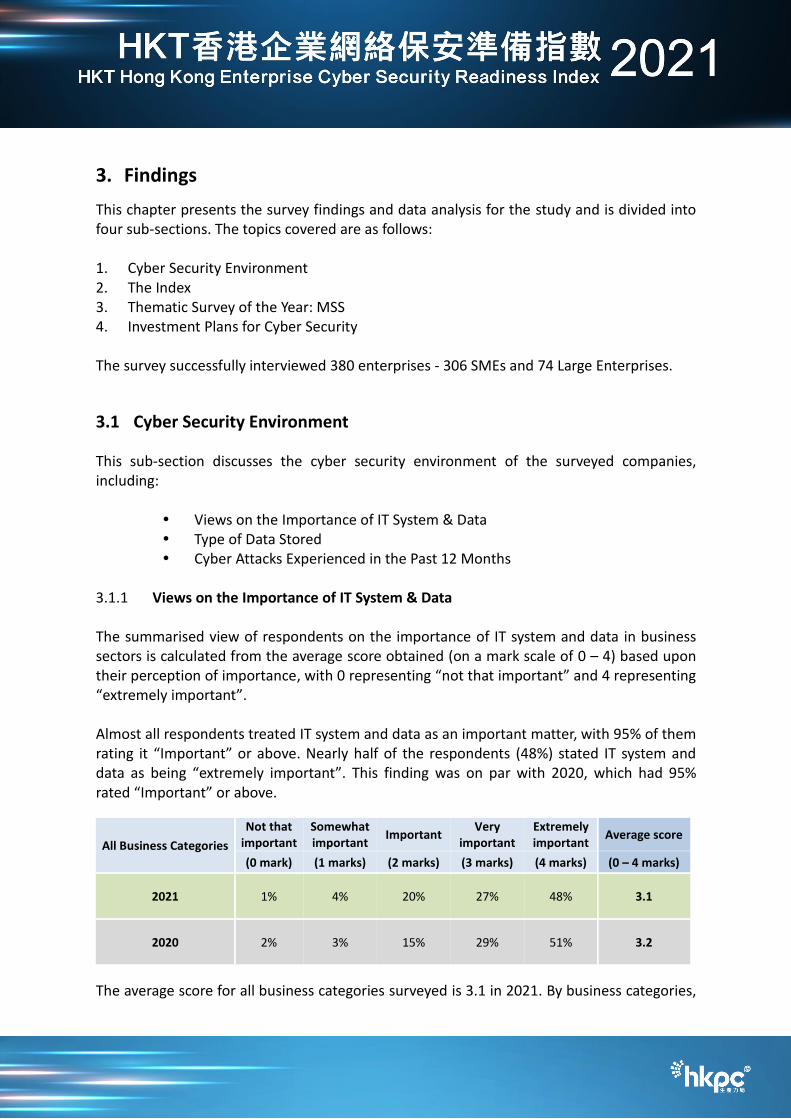
The summarised view of respondents on the importance of IT system and data in business sectors is calculated from the average score obtained (on a mark scale of 0 – 4) based upon their perception of importance, with 0 representing “not that important” and 4 representing “extremely important”. Almost all respondents treated IT system and data as an important matter, with 95% of them rating it “Important” or above. Nearly half of the respondents (48%) stated IT system and data as being “extremely important”. This finding was on par with 2020, which had 95% rated “Important” or above.
All Business Categories
Not that important
Somewhat important
Important Very
important Extremely important
Average score
(0 mark) (1 marks) (2 marks) (3 marks) (4 marks) (0 – 4 marks)
2021 1% 4% 20% 27% 48% 3.1
2020 2% 3% 15% 29% 51% 3.2
The average score for all business categories surveyed is 3.1 in 2021. By business categories,
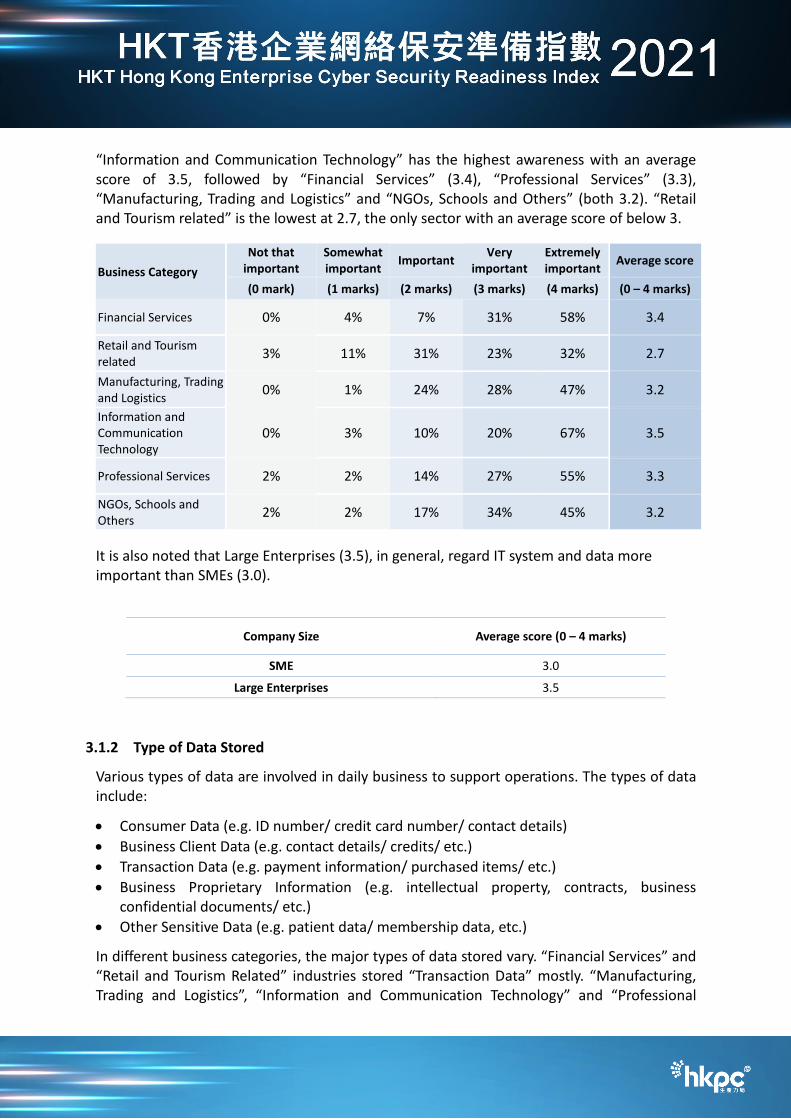
“Information and Communication Technology” has the highest awareness with an average score of 3.5, followed by “Financial Services” (3.4), “Professional Services” (3.3), “Manufacturing, Trading and Logistics” and “NGOs, Schools and Others” (both 3.2). “Retail and Tourism related” is the lowest at 2.7, the only sector with an average score of below 3.
Business Category
Not that important
Somewhat important
Important Very
important Extremely important
Average score
(0 mark) (1 marks) (2 marks) (3 marks) (4 marks) (0 – 4 marks)
Financial Services 0% 4% 7% 31% 58% 3.4
Retail and Tourism related
3% 11% 31% 23% 32% 2.7
Manufacturing, Trading and Logistics
0% 1% 24% 28% 47% 3.2
Information and Communication Technology
0% 3% 10% 20% 67% 3.5
Professional Services 2% 2% 14% 27% 55% 3.3
NGOs, Schools and Others
2% 2% 17% 34% 45% 3.2
It is also noted that Large Enterprises (3.5), in general, regard IT system and data more important than SMEs (3.0).
Company Size Average score (0 – 4 marks)
SME 3.0
Large Enterprises 3.5
3.1.2 Type of Data Stored
Various types of data are involved in daily business to support operations. The types of data include:
Consumer Data (e.g. ID number/ credit card number/ contact details)
Business Client Data (e.g. contact details/ credits/ etc.)
Transaction Data (e.g. payment information/ purchased items/ etc.)
Business Proprietary Information (e.g. intellectual property, contracts, business confidential documents/ etc.)
Other Sensitive Data (e.g. patient data/ membership data, etc.)
In different business categories, the major types of data stored vary. “Financial Services” and “Retail and Tourism Related” industries stored “Transaction Data” mostly. “Manufacturing, Trading and Logistics”, “Information and Communication Technology” and “Professional
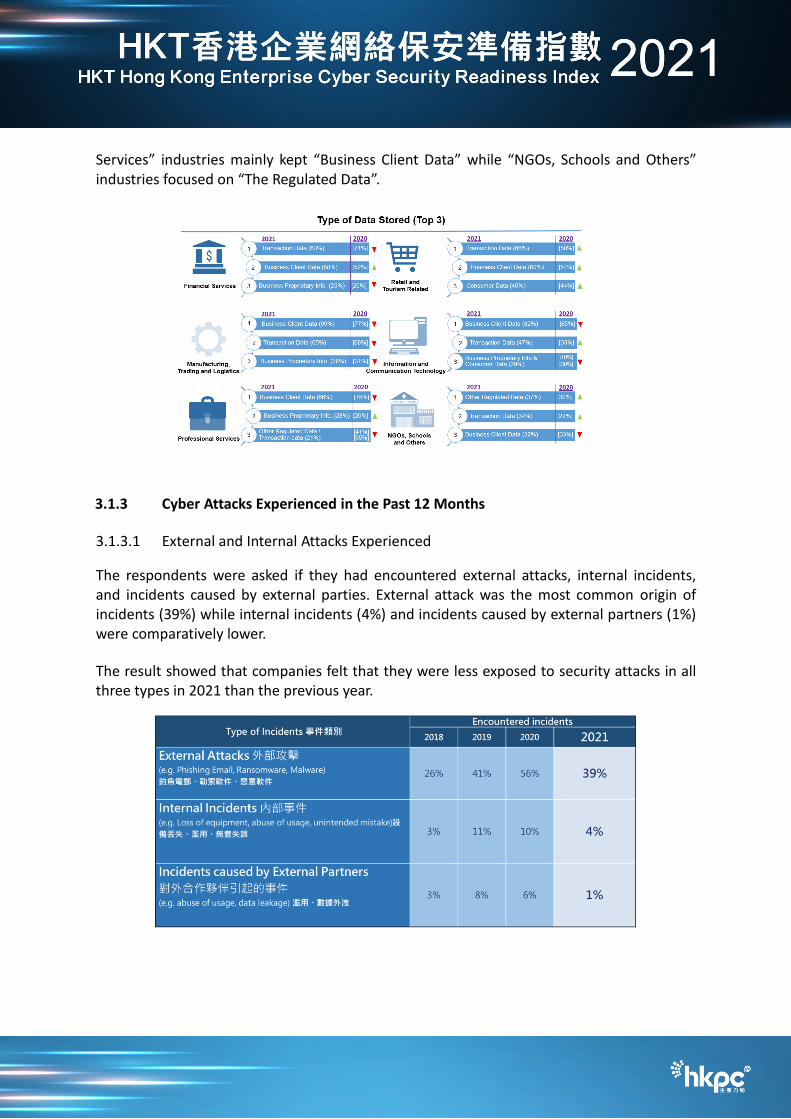
Services” industries mainly kept “Business Client Data” while “NGOs, Schools and Others” industries focused on “The Regulated Data”.
3.1.3 Cyber Attacks Experienced in the Past 12 Months
3.1.3.1 External and Internal Attacks Experienced
The respondents were asked if they had encountered external attacks, internal incidents, and incidents caused by external parties. External attack was the most common origin of incidents (39%) while internal incidents (4%) and incidents caused by external partners (1%) were comparatively lower.
The result showed that companies felt that they were less exposed to security attacks in all three types in 2021 than the previous year.
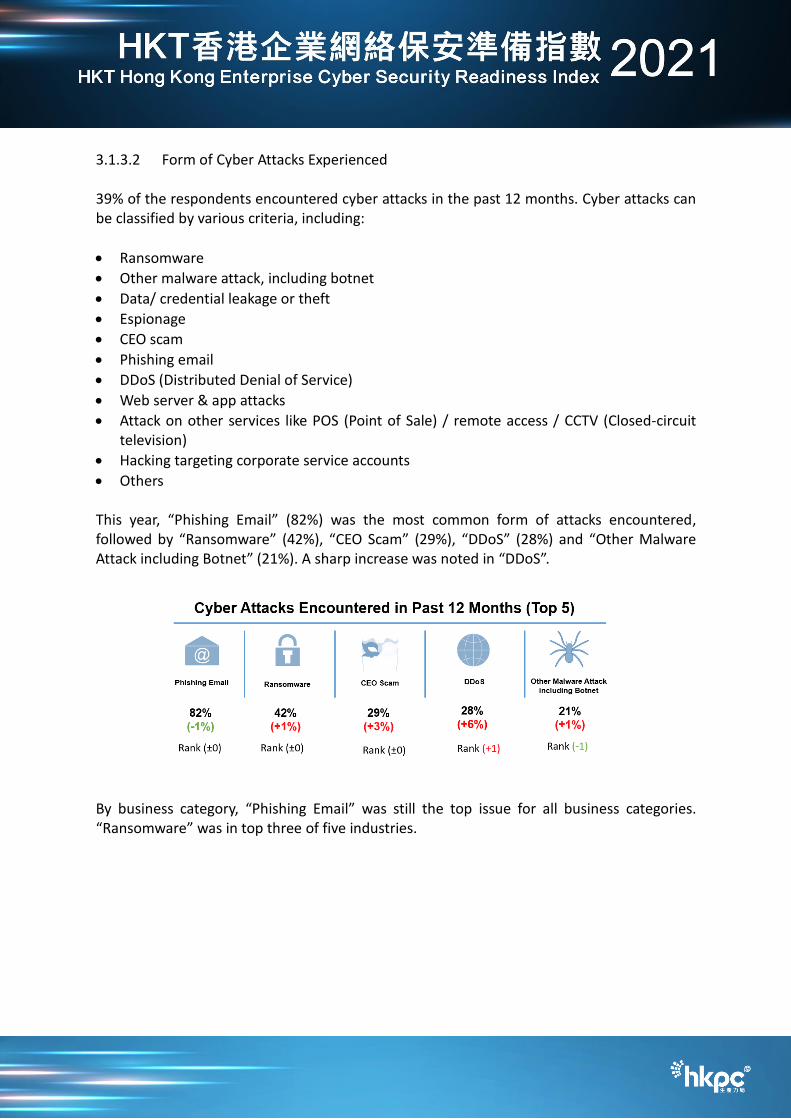
3.1.3.2 Form of Cyber Attacks Experienced 39% of the respondents encountered cyber attacks in the past 12 months. Cyber attacks can be classified by various criteria, including:
Ransomware
Other malware attack, including botnet
Data/ credential leakage or theft
Espionage
CEO scam
Phishing email
DDoS (Distributed Denial of Service)
Web server & app attacks
Attack on other services like POS (Point of Sale) / remote access / CCTV (Closed-circuit television)
Hacking targeting corporate service accounts
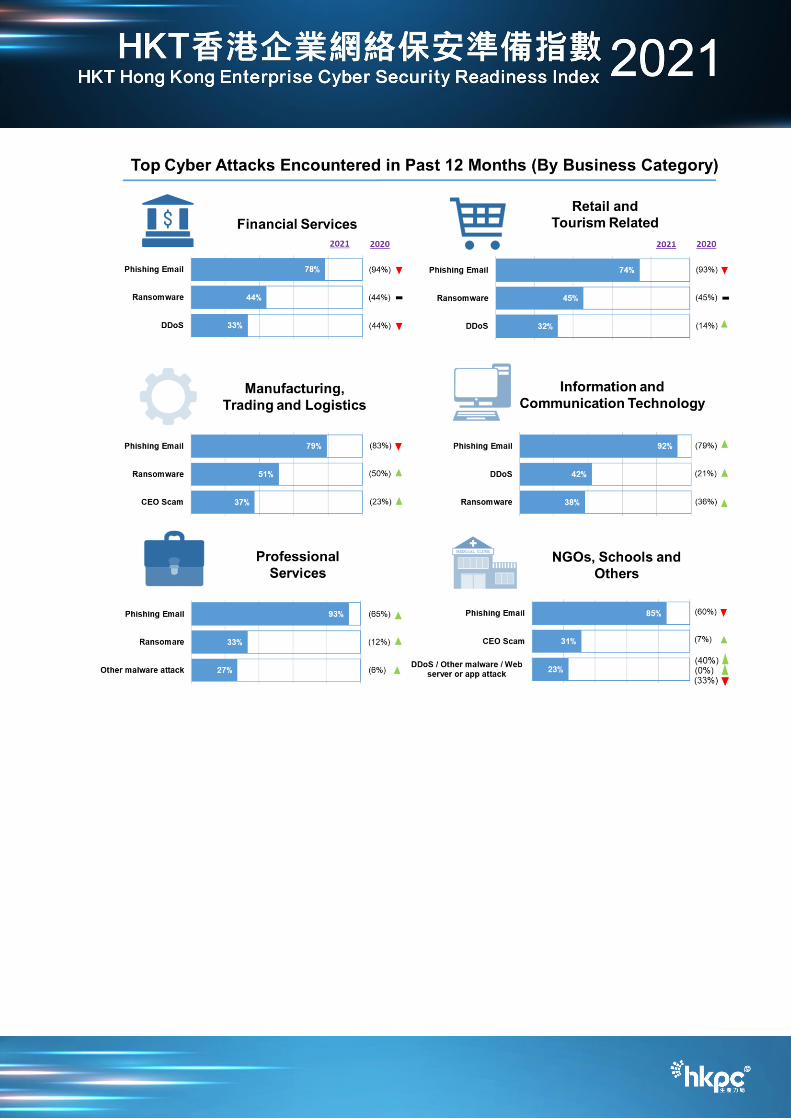
Others This year, “Phishing Email” (82%) was the most common form of attacks encountered, followed by “Ransomware” (42%), “CEO Scam” (29%), “DDoS” (28%) and “Other Malware Attack including Botnet” (21%). A sharp increase was noted in “DDoS”.
By business category, “Phishing Email” was still the top issue for all business categories. “Ransomware” was in top three of five industries.
3.2 The Index
3.2.1 Indicators of the Index
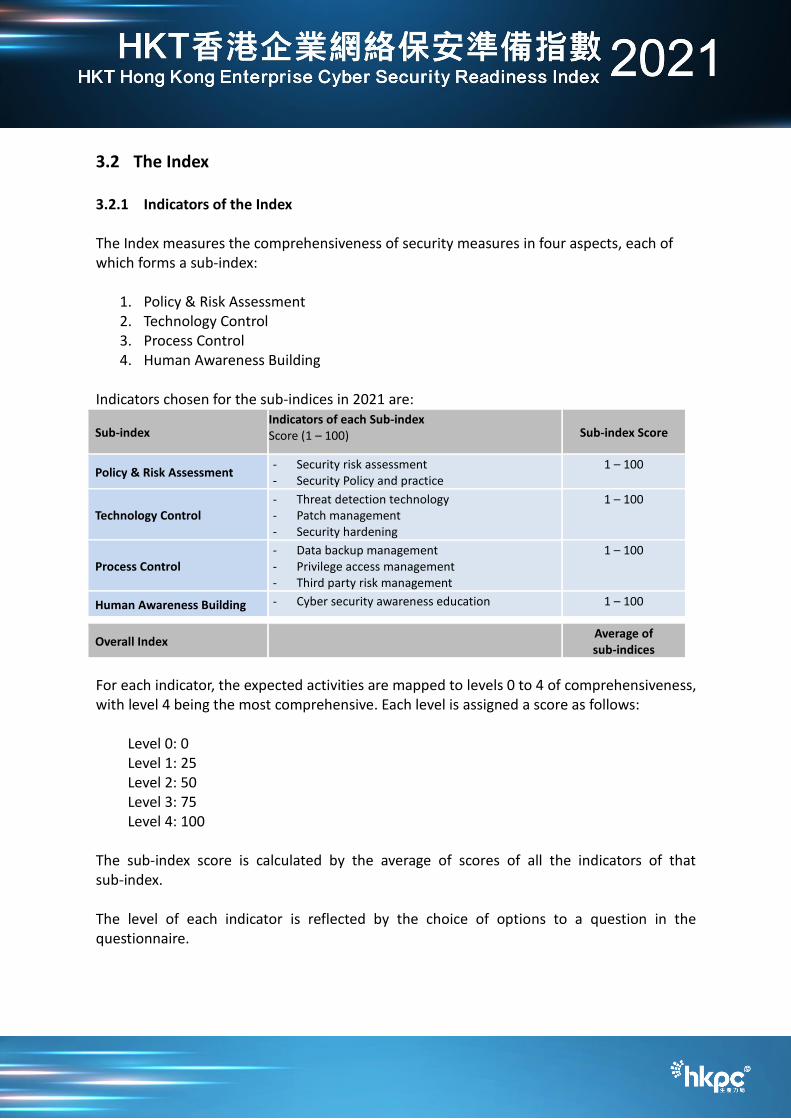
The Index measures the comprehensiveness of security measures in four aspects, each of which forms a sub-index:
1. Policy & Risk Assessment 2. Technology Control 3. Process Control 4. Human Awareness Building
Indicators chosen for the sub-indices in 2021 are:
Sub-index Indicators of each Sub-index Score (1 – 100) Sub-index Score
Policy & Risk Assessment - Security risk assessment - Security Policy and practice
1 – 100
Technology Control - Threat detection technology - Patch management - Security hardening
1 – 100
Process Control - Data backup management - Privilege access management - Third party risk management
1 – 100
Human Awareness Building - Cyber security awareness education 1 – 100
Overall Index
Average of sub-indices
For each indicator, the expected activities are mapped to levels 0 to 4 of comprehensiveness, with level 4 being the most comprehensive. Each level is assigned a score as follows:
Level 0: 0 Level 1: 25 Level 2: 50 Level 3: 75 Level 4: 100
The sub-index score is calculated by the average of scores of all the indicators of that sub-index. The level of each indicator is reflected by the choice of options to a question in the questionnaire.
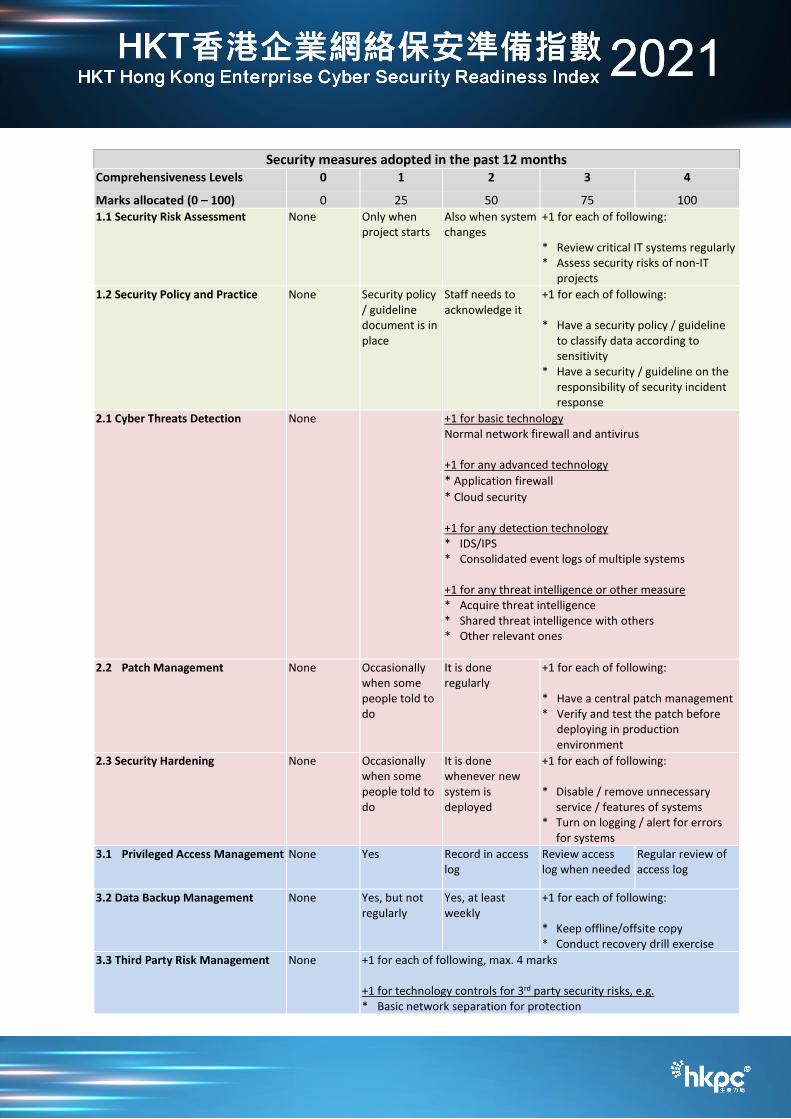
Security measures adopted in the past 12 months Comprehensiveness Levels 0 1 2 3 4
Marks allocated (0 – 100) 0 25 50 75 100 1.1 Security Risk Assessment None Only when
project starts Also when system changes
+1 for each of following: * Review critical IT systems regularly * Assess security risks of non-IT
projects
1.2 Security Policy and Practice None Security policy / guideline document is in place
Staff needs to acknowledge it
+1 for each of following: * Have a security policy / guideline
to classify data according to sensitivity
* Have a security / guideline on the responsibility of security incident response
2.1 Cyber Threats Detection None +1 for basic technology Normal network firewall and antivirus +1 for any advanced technology
* Application firewall
* Cloud security +1 for any detection technology * IDS/IPS * Consolidated event logs of multiple systems +1 for any threat intelligence or other measure * Acquire threat intelligence * Shared threat intelligence with others * Other relevant ones
2.2 Patch Management
None Occasionally when some people told to do
It is done regularly
+1 for each of following: * Have a central patch management * Verify and test the patch before
deploying in production environment
2.3 Security Hardening None Occasionally when some people told to do
It is done whenever new system is deployed
+1 for each of following: * Disable / remove unnecessary
service / features of systems * Turn on logging / alert for errors
for systems
3.1 Privileged Access Management None Yes Record in access log
Review access log when needed
Regular review of access log
3.2 Data Backup Management None Yes, but not regularly
Yes, at least weekly
+1 for each of following: * Keep offline/offsite copy * Conduct recovery drill exercise
3.3 Third Party Risk Management None +1 for each of following, max. 4 marks +1 for technology controls for 3rd party security risks, e.g. * Basic network separation for protection
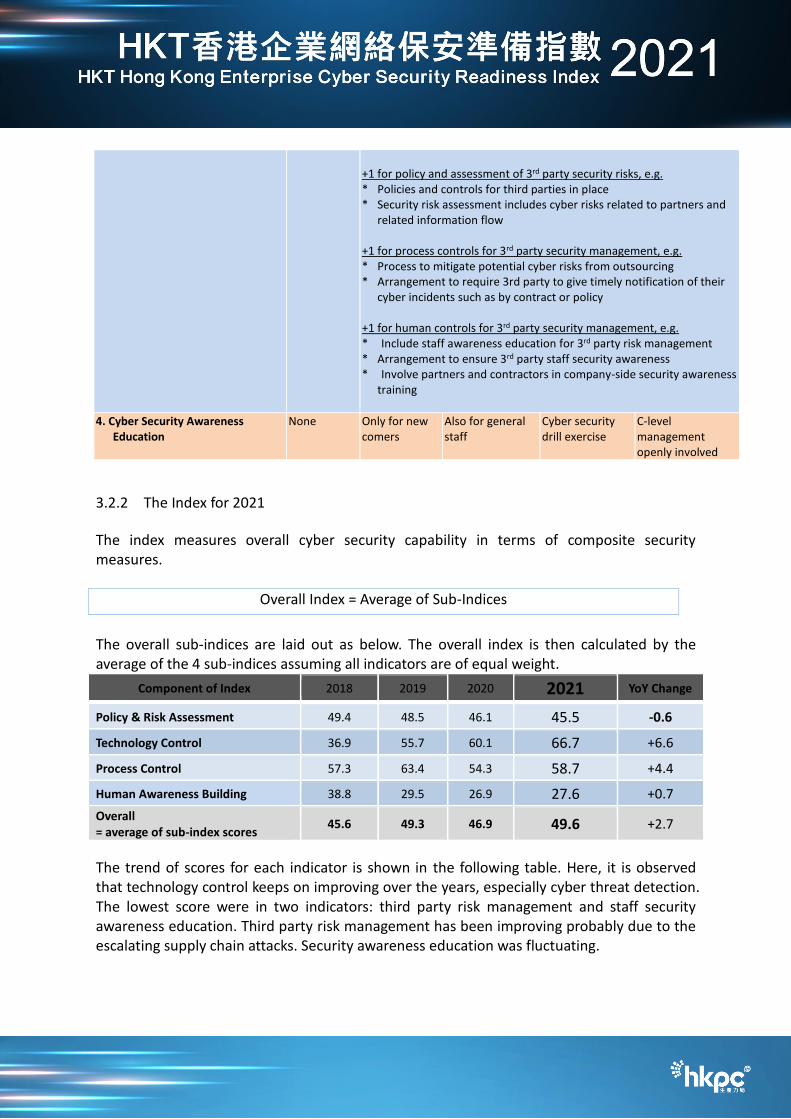
+1 for policy and assessment of 3rd party security risks, e.g. * Policies and controls for third parties in place * Security risk assessment includes cyber risks related to partners and
related information flow +1 for process controls for 3rd party security management, e.g. * Process to mitigate potential cyber risks from outsourcing * Arrangement to require 3rd party to give timely notification of their
cyber incidents such as by contract or policy +1 for human controls for 3rd party security management, e.g. * Include staff awareness education for 3rd party risk management * Arrangement to ensure 3rd party staff security awareness * Involve partners and contractors in company-side security awareness
training
4. Cyber Security Awareness Education
None Only for new comers
Also for general staff
Cyber security drill exercise
C-level management openly involved
3.2.2 The Index for 2021
The index measures overall cyber security capability in terms of composite security measures.
Overall Index = Average of Sub-Indices
The overall sub-indices are laid out as below. The overall index is then calculated by the average of the 4 sub-indices assuming all indicators are of equal weight.
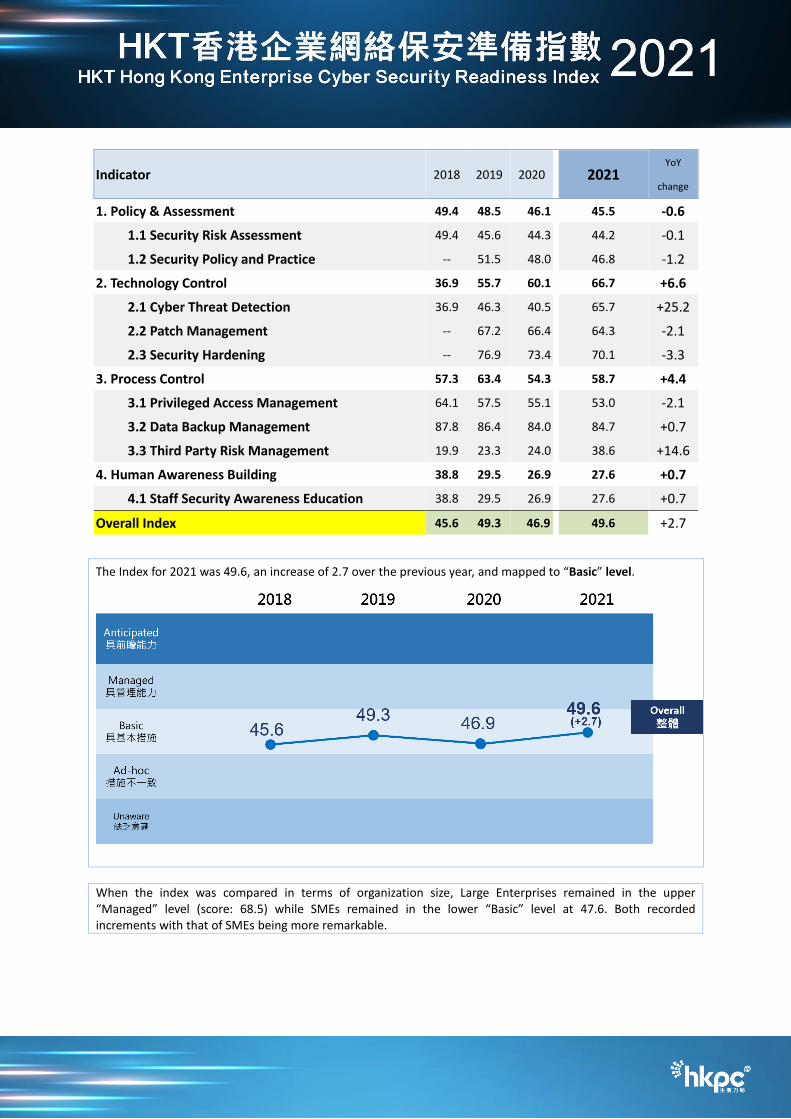
Component of Index 2018 2019 2020 2021 YoY Change
Policy & Risk Assessment 49.4 48.5 46.1 45.5 -0.6
Technology Control 36.9 55.7 60.1 66.7 +6.6
Process Control 57.3 63.4 54.3 58.7 +4.4
Human Awareness Building 38.8 29.5 26.9 27.6 +0.7
Overall = average of sub-index scores
45.6 49.3 46.9 49.6 +2.7
The trend of scores for each indicator is shown in the following table. Here, it is observed that technology control keeps on improving over the years, especially cyber threat detection. The lowest score were in two indicators: third party risk management and staff security awareness education. Third party risk management has been improving probably due to the escalating supply chain attacks. Security awareness education was fluctuating.
Indicator 2018 2019 2020
2021 YoY
change
1. Policy & Assessment 49.4 48.5 46.1 45.5 -0.6
1.1 Security Risk Assessment 49.4 45.6 44.3 44.2 -0.1
1.2 Security Policy and Practice -- 51.5 48.0 46.8 -1.2
2. Technology Control 36.9 55.7 60.1 66.7 +6.6
2.1 Cyber Threat Detection 36.9 46.3 40.5 65.7 +25.2
2.2 Patch Management -- 67.2 66.4 64.3 -2.1
2.3 Security Hardening -- 76.9 73.4 70.1 -3.3
3. Process Control 57.3 63.4 54.3 58.7 +4.4
3.1 Privileged Access Management 64.1 57.5 55.1 53.0 -2.1
3.2 Data Backup Management 87.8 86.4 84.0 84.7 +0.7
3.3 Third Party Risk Management 19.9 23.3 24.0 38.6 +14.6
4. Human Awareness Building 38.8 29.5 26.9 27.6 +0.7
4.1 Staff Security Awareness Education 38.8 29.5 26.9 27.6 +0.7
Overall Index 45.6 49.3 46.9 49.6 +2.7
The Index for 2021 was 49.6, an increase of 2.7 over the previous year, and mapped to “Basic” level.
When the index was compared in terms of organization size, Large Enterprises remained in the upper “Managed” level (score: 68.5) while SMEs remained in the lower “Basic” level at 47.6. Both recorded increments with that of SMEs being more remarkable.
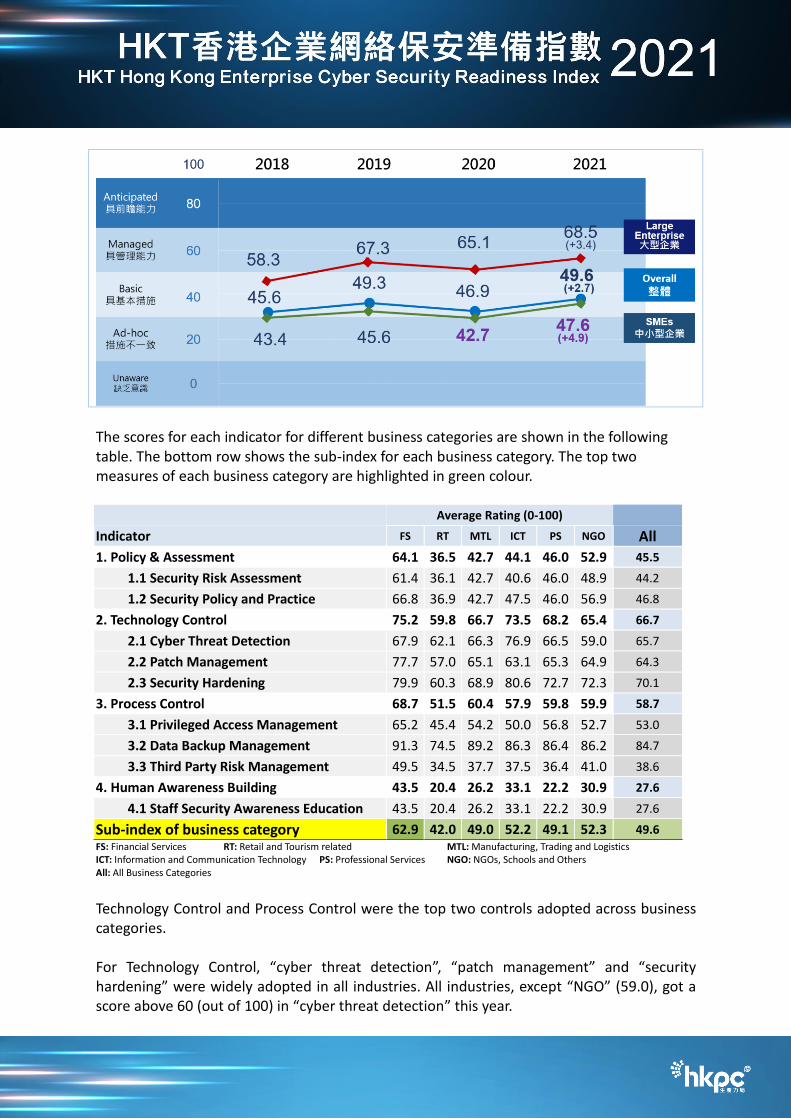
The scores for each indicator for different business categories are shown in the following table. The bottom row shows the sub-index for each business category. The top two measures of each business category are highlighted in green colour.
Average Rating (0-100)
Indicator FS RT MTL ICT PS NGO All
1. Policy & Assessment 64.1 36.5 42.7 44.1 46.0 52.9 45.5
1.1 Security Risk Assessment 61.4 36.1 42.7 40.6 46.0 48.9 44.2
1.2 Security Policy and Practice 66.8 36.9 42.7 47.5 46.0 56.9 46.8
2. Technology Control 75.2 59.8 66.7 73.5 68.2 65.4 66.7
2.1 Cyber Threat Detection 67.9 62.1 66.3 76.9 66.5 59.0 65.7
2.2 Patch Management 77.7 57.0 65.1 63.1 65.3 64.9 64.3
2.3 Security Hardening 79.9 60.3 68.9 80.6 72.7 72.3 70.1
3. Process Control 68.7 51.5 60.4 57.9 59.8 59.9 58.7
3.1 Privileged Access Management 65.2 45.4 54.2 50.0 56.8 52.7 53.0
3.2 Data Backup Management 91.3 74.5 89.2 86.3 86.4 86.2 84.7
3.3 Third Party Risk Management 49.5 34.5 37.7 37.5 36.4 41.0 38.6
4. Human Awareness Building 43.5 20.4 26.2 33.1 22.2 30.9 27.6
4.1 Staff Security Awareness Education 43.5 20.4 26.2 33.1 22.2 30.9 27.6
Sub-index of business category 62.9 42.0 49.0 52.2 49.1 52.3 49.6 FS: Financial Services RT: Retail and Tourism related MTL: Manufacturing, Trading and Logistics ICT: Information and Communication Technology PS: Professional Services NGO: NGOs, Schools and Others All: All Business Categories
Technology Control and Process Control were the top two controls adopted across business categories. For Technology Control, “cyber threat detection”, “patch management” and “security hardening” were widely adopted in all industries. All industries, except “NGO” (59.0), got a score above 60 (out of 100) in “cyber threat detection” this year.
For Process Control, “data backup management” had higher level of adoption across all business categories, while “third party risk management” ware less commonly adopted. Human is the last line of defence, and cyber security awareness is the key success factor for the line of human defence. The score in this indicator has slightly increased but was still not enough. “Financial Services” scored 43.5 at the top, followed by ICT (33.1) and NGO (30.9). The other three industries were in the low range of 20 to 27.
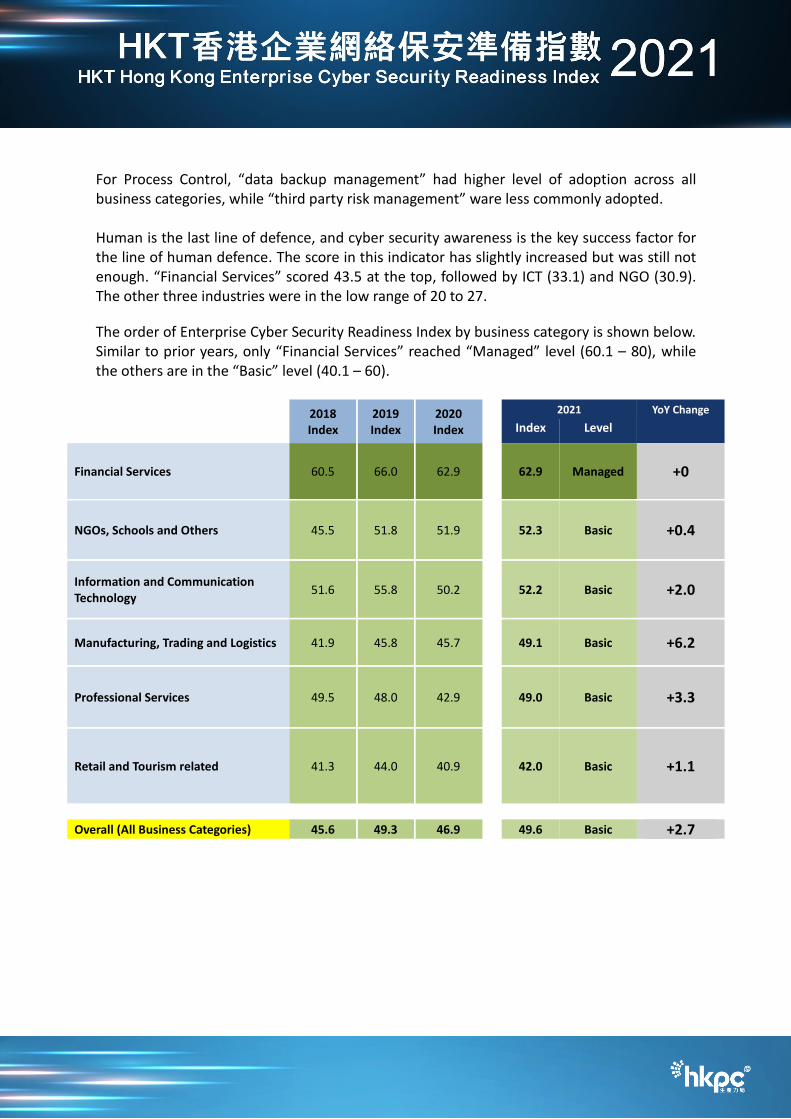
The order of Enterprise Cyber Security Readiness Index by business category is shown below. Similar to prior years, only “Financial Services” reached “Managed” level (60.1 – 80), while the others are in the “Basic” level (40.1 – 60).
2018 Index
2019 Index
2020 Index
2021 YoY Change
Index Level
Financial Services 60.5 66.0 62.9
62.9 Managed +0
NGOs, Schools and Others 45.5 51.8 51.9
52.3 Basic +0.4
Information and Communication Technology
51.6 55.8 50.2
52.2 Basic +2.0
Manufacturing, Trading and Logistics 41.9 45.8 45.7
49.1 Basic +6.2
Professional Services 49.5 48.0 42.9
49.0 Basic +3.3
Retail and Tourism related 41.3 44.0 40.9
42.0 Basic +1.1
Overall (All Business Categories) 45.6 49.3 46.9 49.6 Basic +2.7
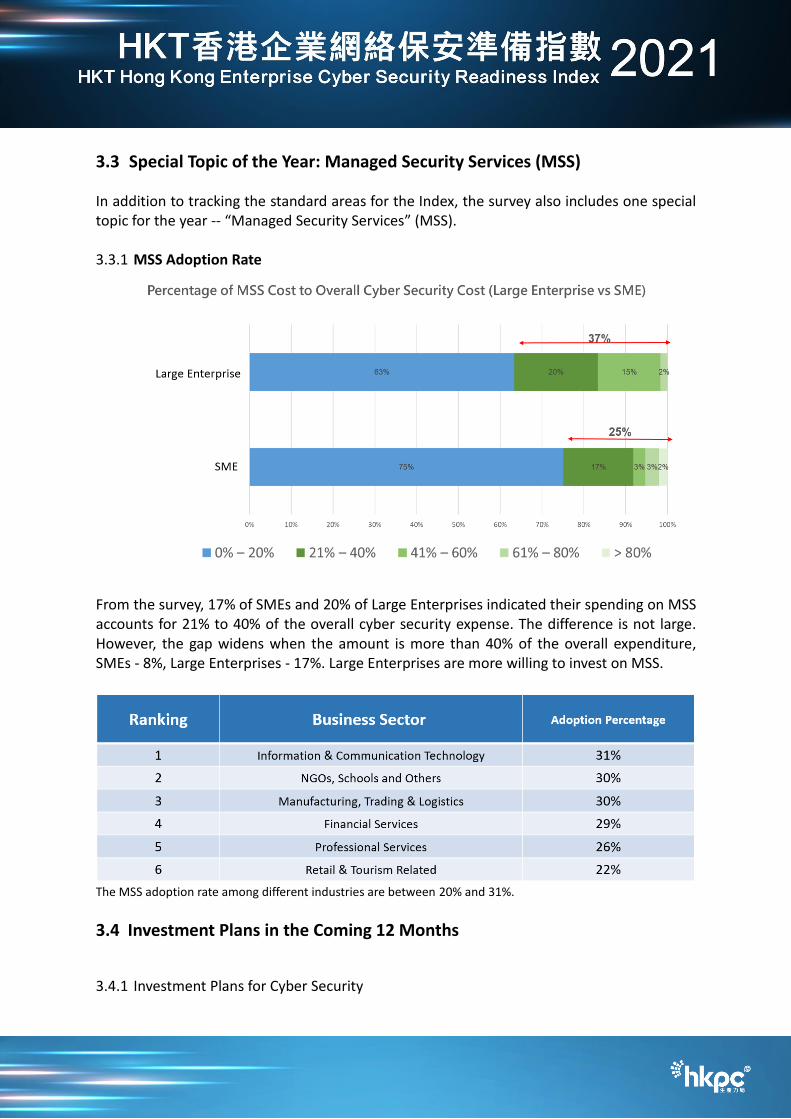
3.3 Special Topic of the Year: Managed Security Services (MSS)
In addition to tracking the standard areas for the Index, the survey also includes one special topic for the year -- “Managed Security Services” (MSS). 3.3.1 MSS Adoption Rate
From the survey, 17% of SMEs and 20% of Large Enterprises indicated their spending on MSS accounts for 21% to 40% of the overall cyber security expense. The difference is not large. However, the gap widens when the amount is more than 40% of the overall expenditure, SMEs - 8%, Large Enterprises - 17%. Large Enterprises are more willing to invest on MSS.
The MSS adoption rate among different industries are between 20% and 31%.
3.4 Investment Plans in the Coming 12 Months
3.4.1 Investment Plans for Cyber Security
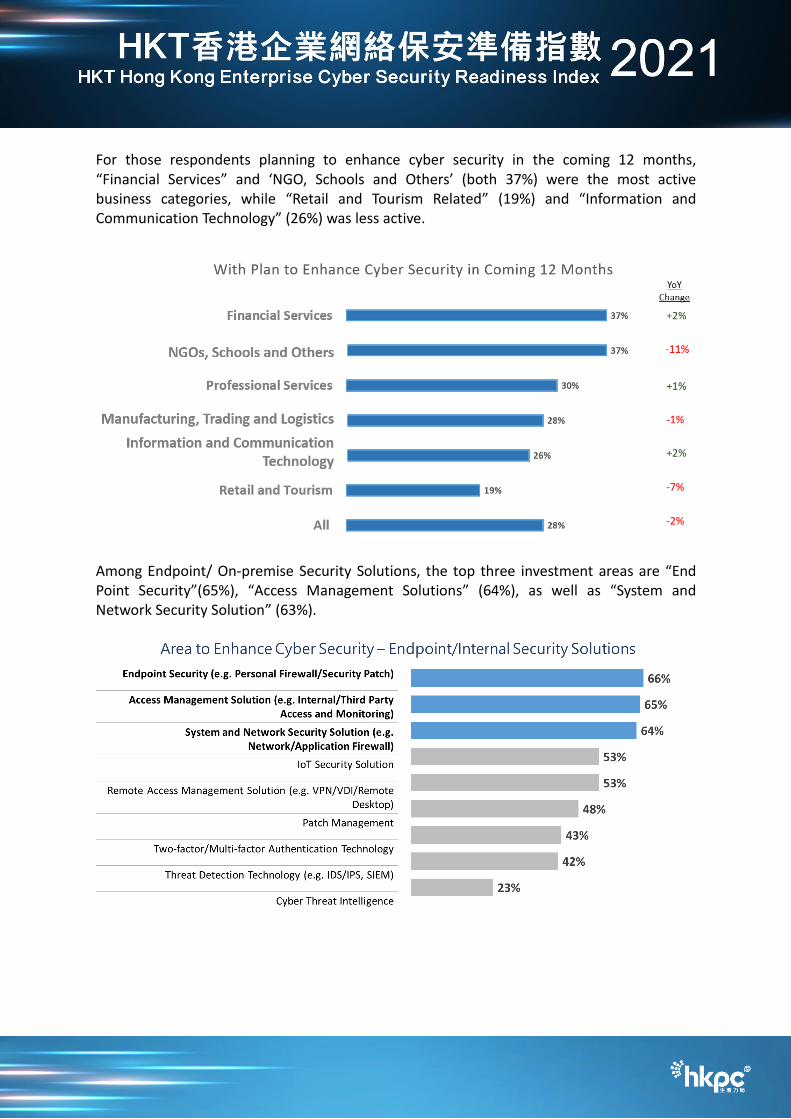
For those respondents planning to enhance cyber security in the coming 12 months, “Financial Services” and ‘NGO, Schools and Others’ (both 37%) were the most active business categories, while “Retail and Tourism Related” (19%) and “Information and Communication Technology” (26%) was less active.
Among Endpoint/ On-premise Security Solutions, the top three investment areas are “End Point Security”(65%), “Access Management Solutions” (64%), as well as “System and Network Security Solution” (63%).
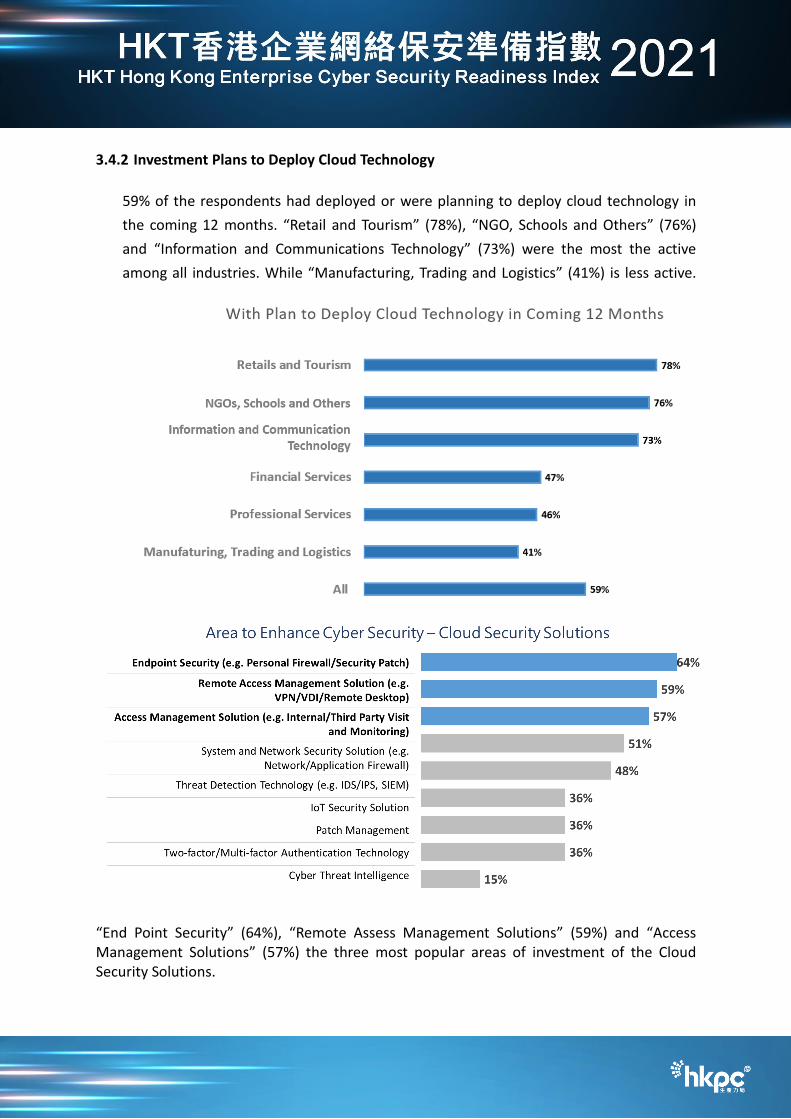
3.4.2 Investment Plans to Deploy Cloud Technology
59% of the respondents had deployed or were planning to deploy cloud technology in
the coming 12 months. “Retail and Tourism” (78%), “NGO, Schools and Others” (76%)
and “Information and Communications Technology” (73%) were the most the active
among all industries. While “Manufacturing, Trading and Logistics” (41%) is less active.
“End Point Security” (64%), “Remote Assess Management Solutions” (59%) and “Access Management Solutions” (57%) the three most popular areas of investment of the Cloud Security Solutions.
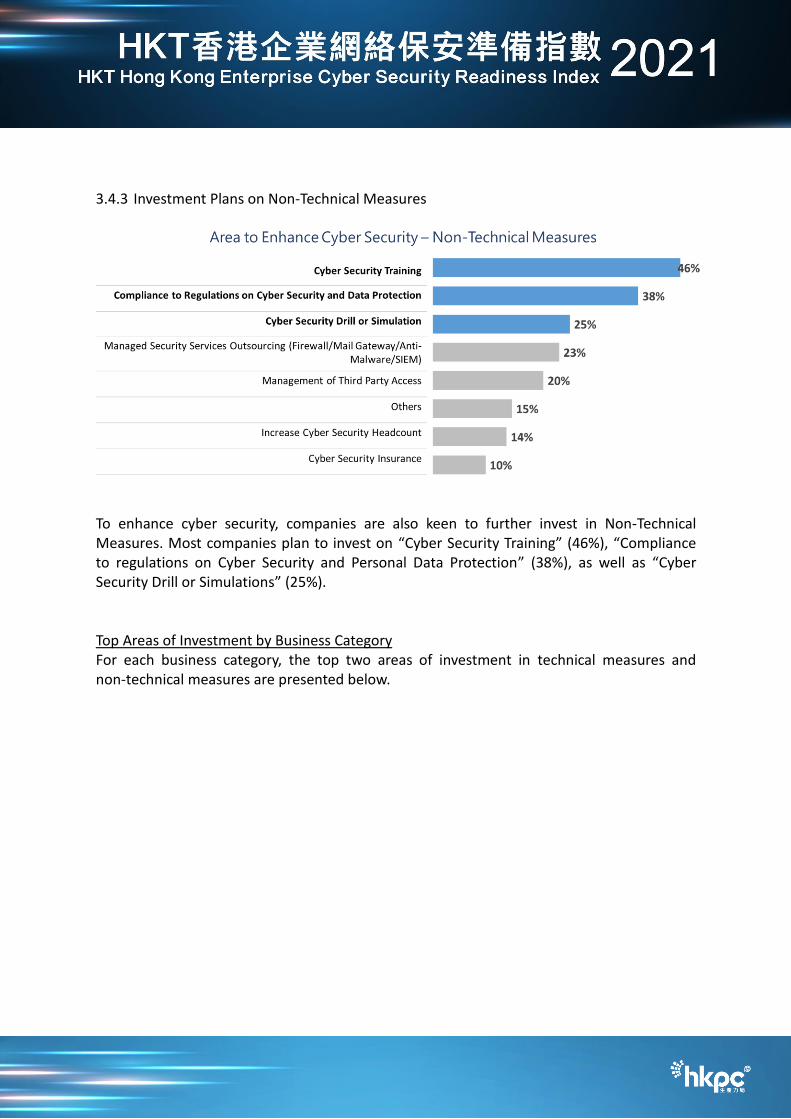
3.4.3 Investment Plans on Non-Technical Measures
To enhance cyber security, companies are also keen to further invest in Non-Technical Measures. Most companies plan to invest on “Cyber Security Training” (46%), “Compliance to regulations on Cyber Security and Personal Data Protection” (38%), as well as “Cyber Security Drill or Simulations” (25%). Top Areas of Investment by Business Category For each business category, the top two areas of investment in technical measures and non-technical measures are presented below.
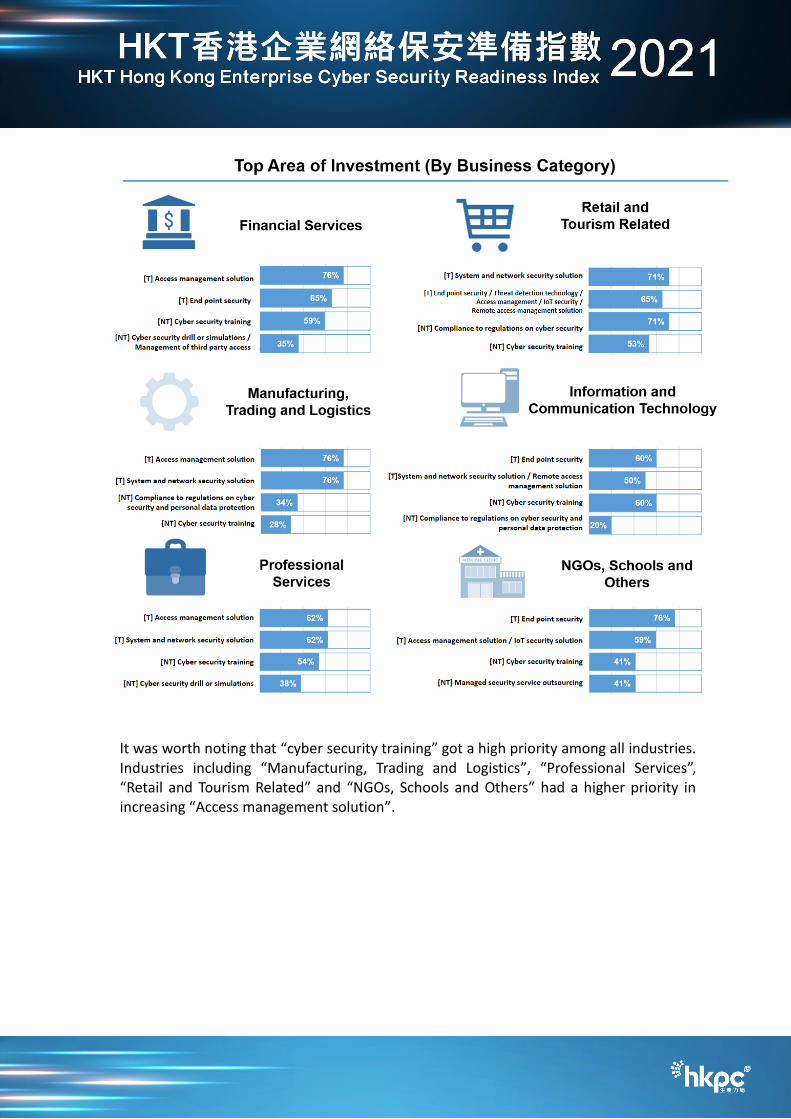
It was worth noting that “cyber security training” got a high priority among all industries. Industries including “Manufacturing, Trading and Logistics”, “Professional Services”, “Retail and Tourism Related” and “NGOs, Schools and Others” had a higher priority in increasing “Access management solution”.
4 Conclusion & Recommendations
4.1 Key Findings
The Index
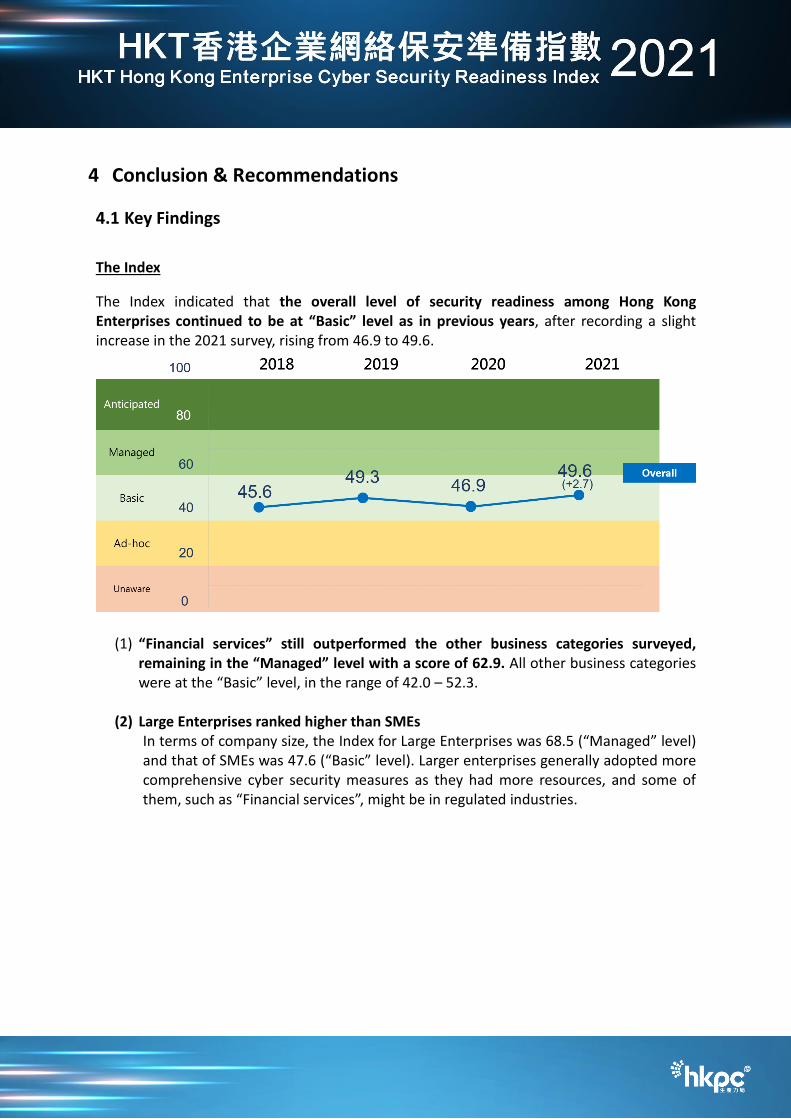
The Index indicated that the overall level of security readiness among Hong Kong Enterprises continued to be at “Basic” level as in previous years, after recording a slight increase in the 2021 survey, rising from 46.9 to 49.6.
(1) “Financial services” still outperformed the other business categories surveyed, remaining in the “Managed” level with a score of 62.9. All other business categories were at the “Basic” level, in the range of 42.0 – 52.3.
(2) Large Enterprises ranked higher than SMEs
In terms of company size, the Index for Large Enterprises was 68.5 (“Managed” level) and that of SMEs was 47.6 (“Basic” level). Larger enterprises generally adopted more comprehensive cyber security measures as they had more resources, and some of them, such as “Financial services”, might be in regulated industries.
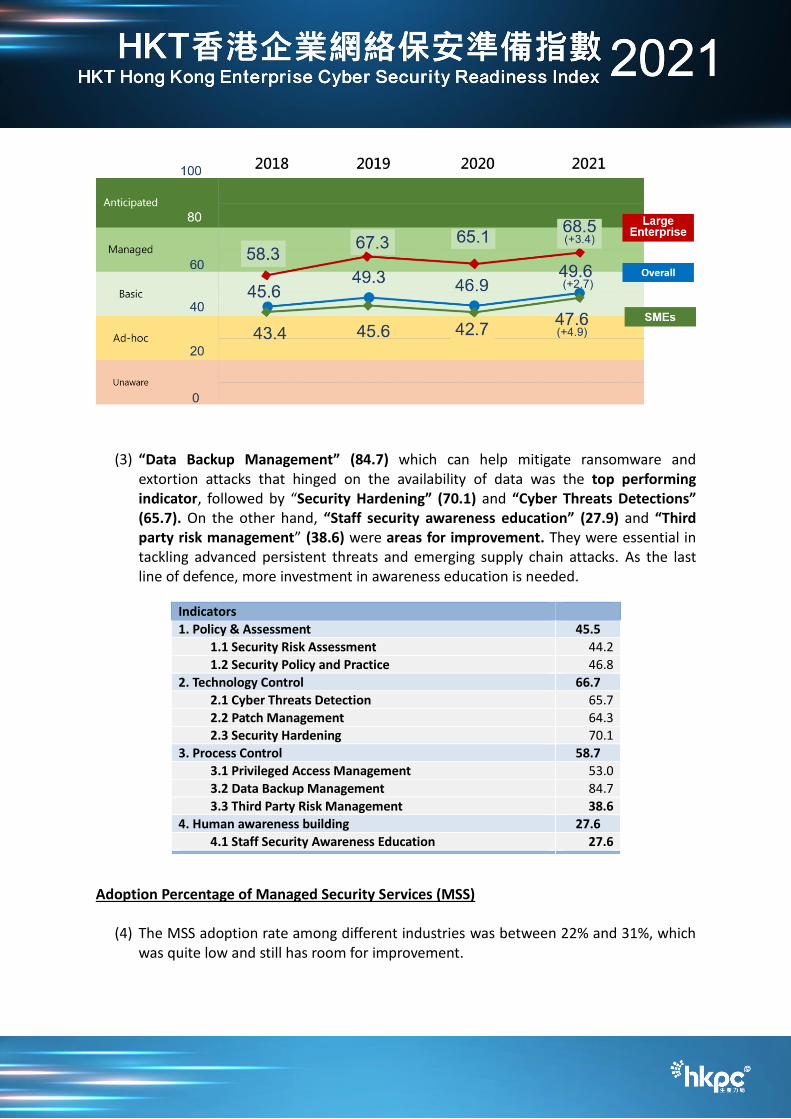
(3) “Data Backup Management” (84.7) which can help mitigate ransomware and
extortion attacks that hinged on the availability of data was the top performing indicator, followed by “Security Hardening” (70.1) and “Cyber Threats Detections” (65.7). On the other hand, “Staff security awareness education” (27.9) and “Third party risk management” (38.6) were areas for improvement. They were essential in tackling advanced persistent threats and emerging supply chain attacks. As the last line of defence, more investment in awareness education is needed.
Indicators
1. Policy & Assessment 45.5
1.1 Security Risk Assessment 44.2
1.2 Security Policy and Practice 46.8
2. Technology Control 66.7
2.1 Cyber Threats Detection 65.7
2.2 Patch Management 64.3 2.3 Security Hardening 70.1
3. Process Control 58.7
3.1 Privileged Access Management 53.0
3.2 Data Backup Management 84.7
3.3 Third Party Risk Management 38.6
4. Human awareness building 27.6
4.1 Staff Security Awareness Education 27.6
Adoption Percentage of Managed Security Services (MSS)
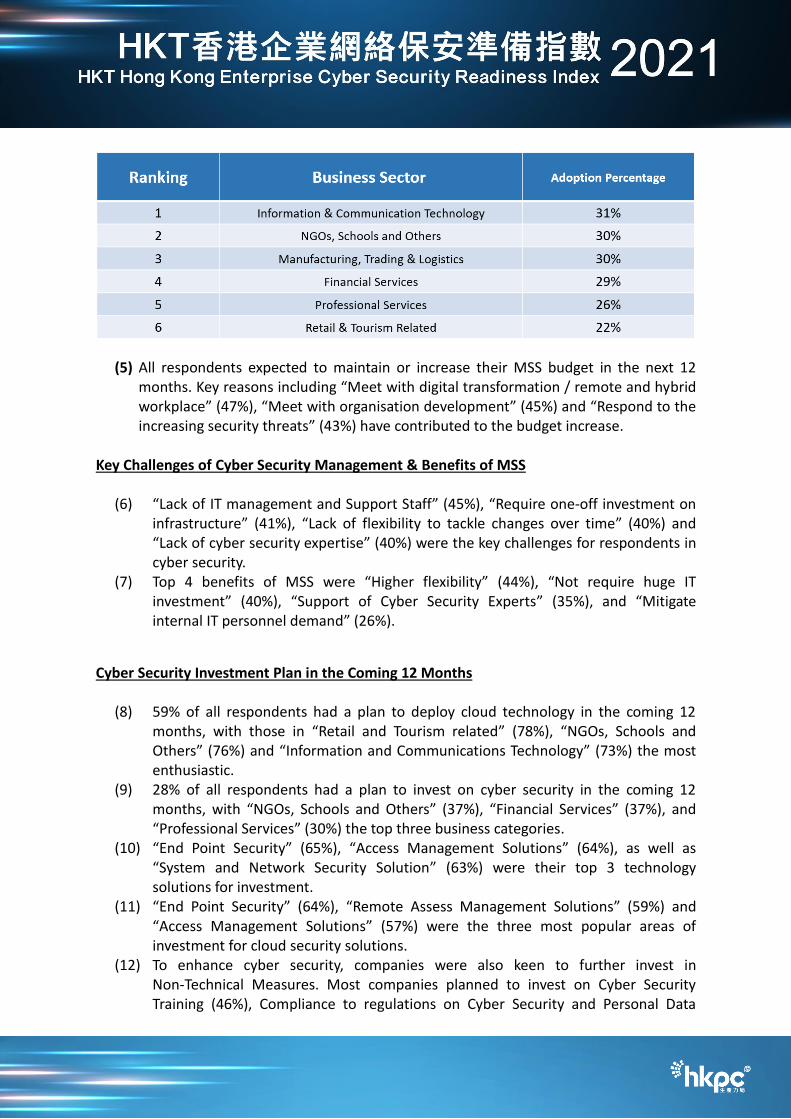
(4) The MSS adoption rate among different industries was between 22% and 31%, which was quite low and still has room for improvement.
(5) All respondents expected to maintain or increase their MSS budget in the next 12 months. Key reasons including “Meet with digital transformation / remote and hybrid workplace” (47%), “Meet with organisation development” (45%) and “Respond to the increasing security threats” (43%) have contributed to the budget increase.
Key Challenges of Cyber Security Management & Benefits of MSS
(6) “Lack of IT management and Support Staff” (45%), “Require one-off investment on
infrastructure” (41%), “Lack of flexibility to tackle changes over time” (40%) and “Lack of cyber security expertise” (40%) were the key challenges for respondents in cyber security.
(7) Top 4 benefits of MSS were “Higher flexibility” (44%), “Not require huge IT investment” (40%), “Support of Cyber Security Experts” (35%), and “Mitigate internal IT personnel demand” (26%).
Cyber Security Investment Plan in the Coming 12 Months
(8) 59% of all respondents had a plan to deploy cloud technology in the coming 12 months, with those in “Retail and Tourism related” (78%), “NGOs, Schools and Others” (76%) and “Information and Communications Technology” (73%) the most enthusiastic.
(9) 28% of all respondents had a plan to invest on cyber security in the coming 12 months, with “NGOs, Schools and Others” (37%), “Financial Services” (37%), and “Professional Services” (30%) the top three business categories.
(10) “End Point Security” (65%), “Access Management Solutions” (64%), as well as “System and Network Security Solution” (63%) were their top 3 technology solutions for investment.
(11) “End Point Security” (64%), “Remote Assess Management Solutions” (59%) and “Access Management Solutions” (57%) were the three most popular areas of investment for cloud security solutions.
(12) To enhance cyber security, companies were also keen to further invest in Non-Technical Measures. Most companies planned to invest on Cyber Security Training (46%), Compliance to regulations on Cyber Security and Personal Data
Protection (38%) and Cyber Security Drill or Simulations (25%)
4.2 Recommendations
(1) HKPC recommended enterprises to put more effort into cyber security to move the security readiness level up to “Managed” level. Amid escalation of cyber threats, more and more enterprises are digitalising their business. This trend won’t go away even after the normalisation of pandemic. The average cyber security readiness index has been in the “Basic Level” for several years with very small improvement. Enterprises, especially smaller ones, should enhance their cyber security readiness to move up into the “Managed” level. To attain the most significant improvement, efforts could be directed towards addressing the weaker areas such as “Third Party Risk Management”, “Cyber Security Awareness Training” and “Cyber Threat Detection”.
(2) Manage Third Party Risks “Supply Chain Attack” has been a major security attack trend in the past few years. ENISA has predicted a four-fold increase in supply chain attacks in 20212. Enterprises are advised to enhance their supply change security management. HKCERT has published the Guideline on “Understanding and Tackling Supply Chain Attacks”3 with details on the nature of supply chain attacks and steps to tackle the risks, including: • Include third party risks in security risk assessment, estimate risks and the flow of
information with partners • Put in place security policy and contract terms to control outsourcing partners • Require partners to include security protection in their processes • Segregate networks with partners and set up proper access control • Involve partners in enterprise awareness education when necessary
(3) Embrace Cyber Threat Detection Establish Security Policy and Practice
The survey results have indicated that enterprises are investing more effort in technology control and less in Policy and Assessment. A security policy provides clear management direction for information security in accordance with business requirements and relevant laws and regulations. Each enterprise should establish its own security policy to demonstrate the commitment of senior management and provide direction for staff, subcontractors and other stakeholders.
2 https://www.enisa.europa.eu/publications/threat-landscape-for-supply-chain-attacks 3 https://www.hkcert.org/my_url/en/guideline/18041201
(4) Raise Cyber Security Awareness via Education Human is always the weakness link in cyber security. Yet cyber security awareness education is usually not put as a top priority until there is huge media exposure of prominent cyber attacks. Top attacks in 2021 such as phishing, ransomware, CEO scams leveraged on human vulnerability, for example, a staff member accidentally opening an attachment with ransomware, causing the data on the enterprise server to be encrypted and become inaccessible. It is advised to increase cyber security awareness education as follows:
Provide training to all general staff and newcomers.
Conduct regular cyber drill exercises, monitor the performance, and address the weakest areas.
Have senior management’s open commitment to reinforcing a culture of security. (5) Rethink the Cyber Security Strategy with Managed Security Services (MSS)
MSS adoption rate is still low. The MSS users responded that MSS could help them tackle key cyber security management challenges and a comparatively higher proportion of them would invest more on MSS. On the other hand, those who are currently not MSS users might not have all the information about the benefits and constraints of MSS and cannot make informed decisions. Hence, enterprises need to provide employees with more training and education on the benefits of MSS that can bring to the companies.
- End of Report -
About HKPC The Hong Kong Productivity Council (HKPC) is a multi-disciplinary organisation established by statute in 1967. HKPC’s mission is to promote productivity excellence through the provision of integrated support across the value chain of Hong Kong firms, to achieve a more effective utilisation of resources, to enhance the value-added content of products and services, and to increase international competitiveness. HKPC conducts independent Study on cyber security and privacy to enable public and private organisations to have a better understanding on the trends in cyber threats and best practices to enhance their reputation and competitiveness in the global market. For more information, please visit http://www.hkpc.org.
About HKCERT Hong Kong Computer Emergency Response Team Coordination Centre (HKCERT) is operated by HKPC. It is the centre for coordination of computer security incident response for local enterprises and Internet Users. Its missions are to facilitate information disseminating, provide advices on preventive measures against security threats and to promote information security awareness. HKCERT collaborates with local bodies to collect and disseminate information and coordinate response actions. HKCERT is also a member of the Forum of Incident Response and Security Teams (FIRST) and the Asia Pacific Computer Emergency Response Teams (APCERT). For more information, please visit https://www.hkcert.org.
About HKT HKT (SEHK: 6823) is Hong Kong's premier telecommunications service provider and a leading innovator. Its fixed-line, broadband, mobile communication and media entertainment services offer a unique quadruple-play experience. HKT meets the needs of the Hong Kong public and local and international businesses with a wide range of services including local telephony, local data and broadband, international telecommunications, mobile, media entertainment, enterprise solutions and other telecommunications businesses such as customer premises equipment sales, outsourcing, consulting and contact centers. HKT is the first local mobile operator to launch a true 5G network with differentiated value-added services. Backed by its substantial holding of 5G spectrum across all bands and a robust and extensive fiber backhaul infrastructure, HKT is committed to providing comprehensive 5G network coverage across the city. HKT delivers end-to-end integrated solutions employing emerging technologies such as 5G, cloud computing, Internet of Things (IoT) and artificial intelligence (AI) to accelerate the digital transformation of enterprises and contribute to Hong Kong's development into a smart city. Riding on its massive loyal customer base, HKT has also built a digital ecosystem integrating its loyalty program, e-commerce, travel, insurance, FinTech and HealthTech services. The ecosystem deepens HKT’s relationship with its customers thereby enhancing customer retention and engagement. For more information, please visit www.hkt.com.
License The content and data in this report is owned by Hong Kong Productivity Council (HKPC). The content of this report is provided under the Creative Commons Attribution 4.0 International License, or “CC BY 4.0” (https://creativecommons.org/licenses/by/4.0). You may share and adapt the content for any purpose, provided that you attribute the work to HKPC.
Disclaimer HKPC and HKCERT shall not have any liability, duty or obligation for or relating to the content and data contained herein, any errors, inaccuracies, omissions or delays in the content and data, or for any actions taken in reliance thereon. In no event shall HKPC be liable for any special, incidental or consequential damages, arising out of the use of the content and data
© Hong Kong Productivity Council. All rights reserved. Published by Hong Kong Productivity Council HKPC Building, 78 Tat Chee Avenue, Kowloon, Hong Kong Tel Fax Website Email
(852) 2788 5678 (852) 2788 5900 www.hkpc.org [email protected]