Embed Size (px)
Citation preview

HIV SURVEILLANCE ANNUAL REPORT, 2013
HIV SURVEILLANCE NEW YORK CITY DEPARTMENT OF HEALTH AND MENTAL HYGIENE
EXECUTIVE SUMMARY
This report presents 2013 surveillance data on the HIV epidemic in New York City (NYC). It highlights trends
in the demographics of the HIV epidemic with a focus on stages of the HIV care continuum from diagnosis
to the ultimate goals of linkage to care and viral suppression. New features of this report include:
• Graphic trends in HIV diagnoses over time for key populations
• Measures of linkage to care and viral suppression
• Measures of adherence to antiretroviral medications
NYC continues to have one of the largest HIV epidemics in the United States, but recent trends persist, with
new HIV and AIDS diagnoses, incident HIV infections and deaths among people with HIV (PWH) continuing
to decline in NYC through 2013. In 2013, 2,832 people were newly diagnosed with HIV in NYC, and 1,784
people were diagnosed with AIDS. As of the end of 2013, 117,618 people had been diagnosed with
HIV/AIDS, reported in NYC, and were presumed to be living. There were 1,527 deaths among NYC PWH in
2013. All populations saw declines in the number of new HIV diagnoses between 2001 and 2013, with the
majority of annual declines in that period reaching statistical significance. All‐cause mortality rates among
PWH in NYC have also fallen dramatically since 2001, driven in large part by the steep decline in the rate of
deaths attributed to HIV infection. Perinatal HIV infections remain at historically low levels in NYC.
Disparities by sex, race/ethnicity, HIV transmission risk, geography and poverty level contribute powerfully
to the distribution of HIV and AIDS diagnoses, prevalence, HIV care outcomes, survival and mortality rates,
incident infections, and detection of acute infections. People newly diagnosed with HIV in NYC in 2013 were
predominantly male, black or Hispanic, young, men who have sex with men (MSM), or people living in
relatively high‐poverty areas. HIV diagnosis rates were strikingly high among black and Hispanic males and
females relative to other racial/ethnic groups. PWH of color living in high‐poverty neighborhoods had
relatively poor short‐term survival rates. MSM were overrepresented among people diagnosed in the acute,
highly infectious phase of HIV infection in NYC in 2013.
The proportions of people linked to care after HIV diagnosis and of people in HIV care who achieve viral
suppression have steadily climbed in NYC in recent years, to approximately three‐quarters each in 2013.
However, linkage to care varied substantially by transmission risk, with people with heterosexual risk and
MSM experiencing higher linkage rates than people in other risk groups. Viral suppression rates varied
widely across all demographic and risk groups; disparities by age showed a particularly strong pattern, with
suppression rates rising sharply with increasing age. In a sample of NYC PWH in care, self‐reported recent
adherence to antiretroviral therapy also varied by demographic and risk subgroups.
CONTENTS
SECTION DESCRIPTION PAGE
1 HISTORY OF THE EPIDEMIC 1
2 HIV DIAGNOSES OVER TIME 1
3 DEMOGRAPHIC AND CLINICAL CHARACTERISTICS 2
4 GEOGRAPHIC DISTRIBUTION OF HIV 3
5 HIV AMONG MALES 4
6 HIV AMONG FEMALES 5
7 HIV AMONG CHILDREN 6
8 HIV CARE 7
9 SURVIVAL AMONG PERSONS WITH HIV 8
10 MORTALITY AMONG PERSONS WITH HIV 8
11 HIV INCIDENCE 9
12 ACUTE HIV INFECTION 9
13 TRANSMITTED DRUG RESISTANCE 10
14 ANTIRETROVIRAL ADHERENCE 10
15 HIV PARTNER SERVICES 11
TECHNICAL NOTES 12
HIV PROVIDER REPORTING 13
ADDITIONAL RESOURCES 13
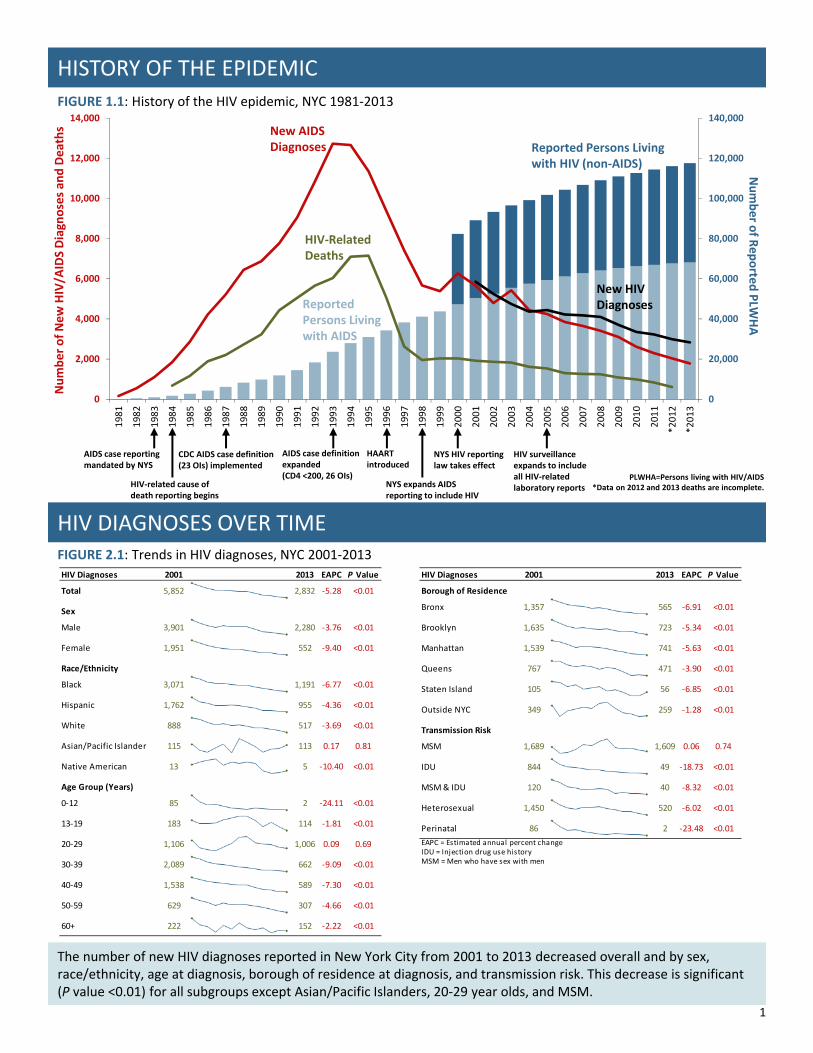
HIV Diagnoses 2001 2013 EAPC P Value
Total 5,852 2,832 ‐5.28 <0.01
Sex
Male 3,901 2,280 ‐3.76 <0.01
Female 1,951 552 ‐9.40 <0.01
Race/Ethnicity
Black 3,071 1,191 ‐6.77 <0.01
Hispanic 1,762 955 ‐4.36 <0.01
White 888 517 ‐3.69 <0.01
Asian/Pacific Islander 115 113 0.17 0.81
Native American 13 5 ‐10.40 <0.01
Age Group (Years)
0‐12 85 2 ‐24.11 <0.01
13‐19 183 114 ‐1.81 <0.01
20‐29 1,106 1,006 0.09 0.69
30‐39 2,089 662 ‐9.09 <0.01
40‐49 1,538 589 ‐7.30 <0.01
50‐59 629 307 ‐4.66 <0.01
60+ 222 152 ‐2.22 <0.01
0
20,000
40,000
60,000
80,000
100,000
120,000
140,000
0
2,000
4,000
6,000
8,000
10,000
12,000
14,0001981
1982
1983
1984
1985
1986
1987
1988
1989
1990
1991
1992
1993
1994
1995
1996
1997
1998
1999
2000
2001
2002
2003
2004
2005
2006
2007
2008
2009
2010
2011
*2012
*2013
Number o
f Reporte
d PLW
HA
Number of New HIV/A
IDS Diagnoses an
d Deaths
PLWHA=Persons living with HIV/AIDS*Data on 2012 and 2013 deaths are incomplete.
HIV DIAGNOSES OVER TIME
HISTORY OF THE EPIDEMIC
FIGURE 1.1: History of the HIV epidemic, NYC 1981‐2013
New HIV Diagnoses
Reported Persons Living with HIV (non‐AIDS)
Reported Persons Living with AIDS
New AIDS Diagnoses
HIV‐Related Deaths
AIDS case reporting mandated by NYS
CDC AIDS case definition (23 OIs) implemented
AIDS case definition expanded(CD4 <200, 26 OIs)
HAART introduced
NYS expands AIDS reporting to include HIV
NYS HIV reporting law takes effect
HIV surveillance expands to include all HIV‐related laboratory reports
FIGURE 2.1: Trends in HIV diagnoses, NYC 2001‐2013
The number of new HIV diagnoses reported in New York City from 2001 to 2013 decreased overall and by sex, race/ethnicity, age at diagnosis, borough of residence at diagnosis, and transmission risk. This decrease is significant (P value <0.01) for all subgroups except Asian/Pacific Islanders, 20‐29 year olds, and MSM.
HIV‐related cause of death reporting begins
HIV Diagnoses 2001 2013 EAPC P Value
Borough of Residence
Bronx 1,357 565 ‐6.91 <0.01
Brooklyn 1,635 723 ‐5.34 <0.01
Manhattan 1,539 741 ‐5.63 <0.01
Queens 767 471 ‐3.90 <0.01
Staten Island 105 56 ‐6.85 <0.01
Outside NYC 349 259 ‐1.28 <0.01
Transmission Risk
MSM 1,689 1,609 0.06 0.74
IDU 844 49 ‐18.73 <0.01
MSM & IDU 120 40 ‐8.32 <0.01
Heterosexual 1,450 520 ‐6.02 <0.01
Perinatal 86 2 ‐23.48 <0.01
EAPC = Estimated annual percent changeIDU = Injection drug use historyMSM = Men who have sex with men
1
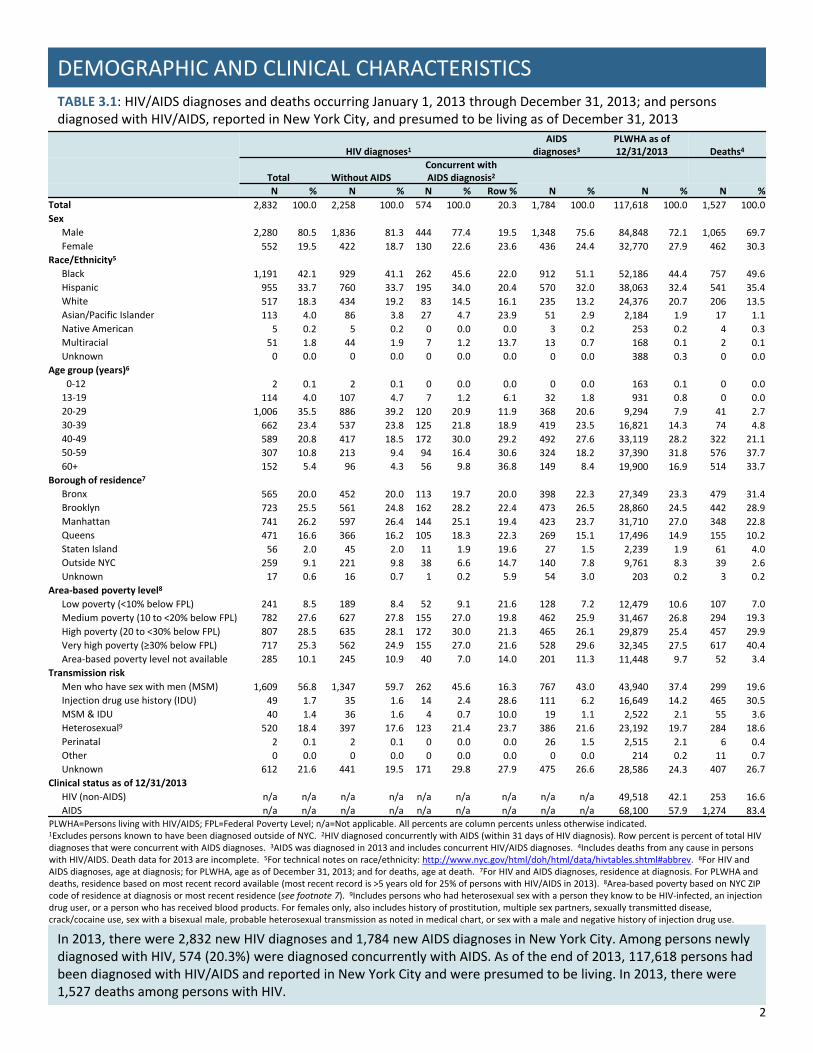
TABLE 3.1: HIV/AIDS diagnoses and deaths occurring January 1, 2013 through December 31, 2013; and persons diagnosed with HIV/AIDS, reported in New York City, and presumed to be living as of December 31, 2013
DEMOGRAPHIC AND CLINICAL CHARACTERISTICS
In 2013, there were 2,832 new HIV diagnoses and 1,784 new AIDS diagnoses in New York City. Among persons newly diagnosed with HIV, 574 (20.3%) were diagnosed concurrently with AIDS. As of the end of 2013, 117,618 persons had been diagnosed with HIV/AIDS and reported in New York City and were presumed to be living. In 2013, there were 1,527 deaths among persons with HIV.
HIV diagnoses1AIDS
diagnoses3PLWHA as of12/31/2013 Deaths4
Total Without AIDSConcurrent with AIDS diagnosis2
N % N % N % Row % N % N % N %
Total 2,832 100.0 2,258 100.0 574 100.0 20.3 1,784 100.0 117,618 100.0 1,527 100.0
Sex
Male 2,280 80.5 1,836 81.3 444 77.4 19.5 1,348 75.6 84,848 72.1 1,065 69.7
Female 552 19.5 422 18.7 130 22.6 23.6 436 24.4 32,770 27.9 462 30.3
Race/Ethnicity5
Black 1,191 42.1 929 41.1 262 45.6 22.0 912 51.1 52,186 44.4 757 49.6
Hispanic 955 33.7 760 33.7 195 34.0 20.4 570 32.0 38,063 32.4 541 35.4
White 517 18.3 434 19.2 83 14.5 16.1 235 13.2 24,376 20.7 206 13.5
Asian/Pacific Islander 113 4.0 86 3.8 27 4.7 23.9 51 2.9 2,184 1.9 17 1.1
Native American 5 0.2 5 0.2 0 0.0 0.0 3 0.2 253 0.2 4 0.3
Multiracial 51 1.8 44 1.9 7 1.2 13.7 13 0.7 168 0.1 2 0.1
Unknown 0 0.0 0 0.0 0 0.0 0.0 0 0.0 388 0.3 0 0.0
Age group (years)6
0‐12 2 0.1 2 0.1 0 0.0 0.0 0 0.0 163 0.1 0 0.0
13‐19 114 4.0 107 4.7 7 1.2 6.1 32 1.8 931 0.8 0 0.0
20‐29 1,006 35.5 886 39.2 120 20.9 11.9 368 20.6 9,294 7.9 41 2.7
30‐39 662 23.4 537 23.8 125 21.8 18.9 419 23.5 16,821 14.3 74 4.8
40‐49 589 20.8 417 18.5 172 30.0 29.2 492 27.6 33,119 28.2 322 21.1
50‐59 307 10.8 213 9.4 94 16.4 30.6 324 18.2 37,390 31.8 576 37.7
60+ 152 5.4 96 4.3 56 9.8 36.8 149 8.4 19,900 16.9 514 33.7
Borough of residence7
Bronx 565 20.0 452 20.0 113 19.7 20.0 398 22.3 27,349 23.3 479 31.4
Brooklyn 723 25.5 561 24.8 162 28.2 22.4 473 26.5 28,860 24.5 442 28.9
Manhattan 741 26.2 597 26.4 144 25.1 19.4 423 23.7 31,710 27.0 348 22.8
Queens 471 16.6 366 16.2 105 18.3 22.3 269 15.1 17,496 14.9 155 10.2
Staten Island 56 2.0 45 2.0 11 1.9 19.6 27 1.5 2,239 1.9 61 4.0
Outside NYC 259 9.1 221 9.8 38 6.6 14.7 140 7.8 9,761 8.3 39 2.6
Unknown 17 0.6 16 0.7 1 0.2 5.9 54 3.0 203 0.2 3 0.2
Area‐based poverty level8
Low poverty (<10% below FPL) 241 8.5 189 8.4 52 9.1 21.6 128 7.2 12,479 10.6 107 7.0
Medium poverty (10 to <20% below FPL) 782 27.6 627 27.8 155 27.0 19.8 462 25.9 31,467 26.8 294 19.3
High poverty (20 to <30% below FPL) 807 28.5 635 28.1 172 30.0 21.3 465 26.1 29,879 25.4 457 29.9
Very high poverty (≥30% below FPL) 717 25.3 562 24.9 155 27.0 21.6 528 29.6 32,345 27.5 617 40.4
Area‐based poverty level not available 285 10.1 245 10.9 40 7.0 14.0 201 11.3 11,448 9.7 52 3.4
Transmission risk
Men who have sex with men (MSM) 1,609 56.8 1,347 59.7 262 45.6 16.3 767 43.0 43,940 37.4 299 19.6
Injection drug use history (IDU) 49 1.7 35 1.6 14 2.4 28.6 111 6.2 16,649 14.2 465 30.5
MSM & IDU 40 1.4 36 1.6 4 0.7 10.0 19 1.1 2,522 2.1 55 3.6
Heterosexual9 520 18.4 397 17.6 123 21.4 23.7 386 21.6 23,192 19.7 284 18.6
Perinatal 2 0.1 2 0.1 0 0.0 0.0 26 1.5 2,515 2.1 6 0.4
Other 0 0.0 0 0.0 0 0.0 0.0 0 0.0 214 0.2 11 0.7
Unknown 612 21.6 441 19.5 171 29.8 27.9 475 26.6 28,586 24.3 407 26.7
Clinical status as of 12/31/2013
HIV (non‐AIDS) n/a n/a n/a n/a n/a n/a n/a n/a n/a 49,518 42.1 253 16.6
AIDS n/a n/a n/a n/a n/a n/a n/a n/a n/a 68,100 57.9 1,274 83.4PLWHA=Persons living with HIV/AIDS; FPL=Federal Poverty Level; n/a=Not applicable. All percents are column percents unless otherwise indicated.1Excludes persons known to have been diagnosed outside of NYC. 2HIV diagnosed concurrently with AIDS (within 31 days of HIV diagnosis). Row percent is percent of total HIV diagnoses that were concurrent with AIDS diagnoses. 3AIDS was diagnosed in 2013 and includes concurrent HIV/AIDS diagnoses. 4Includes deaths from any cause in persons with HIV/AIDS. Death data for 2013 are incomplete. 5For technical notes on race/ethnicity: http://www.nyc.gov/html/doh/html/data/hivtables.shtml#abbrev. 6For HIV and AIDS diagnoses, age at diagnosis; for PLWHA, age as of December 31, 2013; and for deaths, age at death. 7For HIV and AIDS diagnoses, residence at diagnosis. For PLWHA and deaths, residence based on most recent record available (most recent record is >5 years old for 25% of persons with HIV/AIDS in 2013). 8Area‐based poverty based on NYC ZIP code of residence at diagnosis or most recent residence (see footnote 7). 9Includes persons who had heterosexual sex with a person they know to be HIV‐infected, an injection drug user, or a person who has received blood products. For females only, also includes history of prostitution, multiple sex partners, sexually transmitted disease, crack/cocaine use, sex with a bisexual male, probable heterosexual transmission as noted in medical chart, or sex with a male and negative history of injection drug use.
2

FIGURE 4.1: Poverty level, NYC 2008‐2012 FIGURE 4.2: HIV diagnosis rates, NYC 2013
GEOGRAPHIC DISTRIBUTION OF HIV
ZIP codes in the Chelsea‐Clinton, Central Harlem‐Morningside Heights and Williamsburg‐Bushwick neighborhoods had the highest HIV diagnosis rates in 2013 (Figure 4.2). In 2013, ZIP codes in Chelsea‐Clinton, West Queens and East Harlem had the highest HIV prevalence (Figure 4.3), and ZIP codes in Lower Manhattan, Stapleton‐St. George andWillowbrook had the highest mortality among persons with HIV (Figure 4.4). Many ZIP codes with high HIV diagnosis rates also had among the highest poverty rates (Figure 4.1), including Central Harlem‐Morningside Heights, Williamsburg‐Bushwick and Bedford Stuyvesant‐Crown Heights. However, the Chelsea‐Clinton neighborhood was the exception with the highest HIV diagnosis rates but relatively low poverty and mortality rates.
FIGURE 4.3: HIV prevalence, NYC 2013 FIGURE 4.4: Age‐adjusted death rates among persons with HIV/AIDS, NYC 2013
PLWHA=Persons living with HIV/AIDS1 Rates calculated using the intercensal 2013 NYC population. 2 2013 death data are incomplete.3 Age‐adjusted to the NYC Census 2010 population.
3
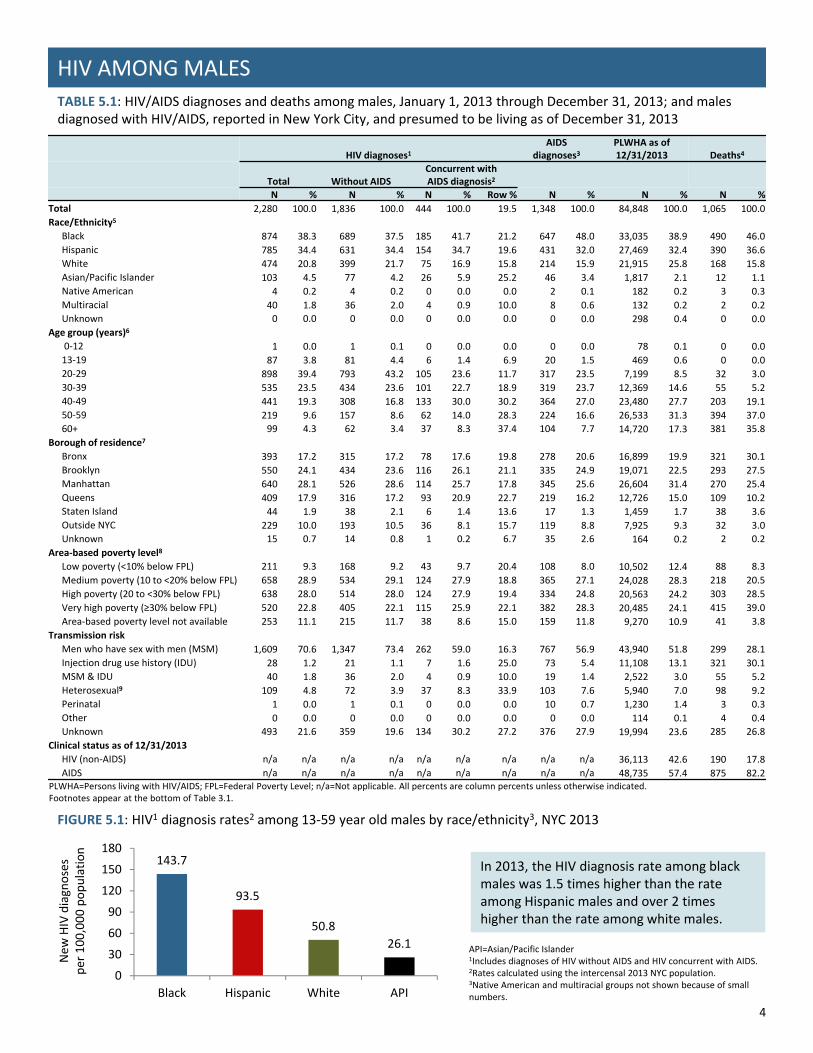
TABLE 5.1: HIV/AIDS diagnoses and deaths among males, January 1, 2013 through December 31, 2013; and males diagnosed with HIV/AIDS, reported in New York City, and presumed to be living as of December 31, 2013
HIV AMONG MALES
HIV diagnoses1AIDS
diagnoses3PLWHA as of12/31/2013 Deaths4
Total Without AIDSConcurrent with AIDS diagnosis2
N % N % N % Row % N % N % N %
Total 2,280 100.0 1,836 100.0 444 100.0 19.5 1,348 100.0 84,848 100.0 1,065 100.0
Race/Ethnicity5
Black 874 38.3 689 37.5 185 41.7 21.2 647 48.0 33,035 38.9 490 46.0
Hispanic 785 34.4 631 34.4 154 34.7 19.6 431 32.0 27,469 32.4 390 36.6
White 474 20.8 399 21.7 75 16.9 15.8 214 15.9 21,915 25.8 168 15.8
Asian/Pacific Islander 103 4.5 77 4.2 26 5.9 25.2 46 3.4 1,817 2.1 12 1.1
Native American 4 0.2 4 0.2 0 0.0 0.0 2 0.1 182 0.2 3 0.3
Multiracial 40 1.8 36 2.0 4 0.9 10.0 8 0.6 132 0.2 2 0.2
Unknown 0 0.0 0 0.0 0 0.0 0.0 0 0.0 298 0.4 0 0.0
Age group (years)6
0‐12 1 0.0 1 0.1 0 0.0 0.0 0 0.0 78 0.1 0 0.0
13‐19 87 3.8 81 4.4 6 1.4 6.9 20 1.5 469 0.6 0 0.0
20‐29 898 39.4 793 43.2 105 23.6 11.7 317 23.5 7,199 8.5 32 3.0
30‐39 535 23.5 434 23.6 101 22.7 18.9 319 23.7 12,369 14.6 55 5.2
40‐49 441 19.3 308 16.8 133 30.0 30.2 364 27.0 23,480 27.7 203 19.1
50‐59 219 9.6 157 8.6 62 14.0 28.3 224 16.6 26,533 31.3 394 37.0
60+ 99 4.3 62 3.4 37 8.3 37.4 104 7.7 14,720 17.3 381 35.8
Borough of residence7
Bronx 393 17.2 315 17.2 78 17.6 19.8 278 20.6 16,899 19.9 321 30.1
Brooklyn 550 24.1 434 23.6 116 26.1 21.1 335 24.9 19,071 22.5 293 27.5
Manhattan 640 28.1 526 28.6 114 25.7 17.8 345 25.6 26,604 31.4 270 25.4
Queens 409 17.9 316 17.2 93 20.9 22.7 219 16.2 12,726 15.0 109 10.2
Staten Island 44 1.9 38 2.1 6 1.4 13.6 17 1.3 1,459 1.7 38 3.6
Outside NYC 229 10.0 193 10.5 36 8.1 15.7 119 8.8 7,925 9.3 32 3.0
Unknown 15 0.7 14 0.8 1 0.2 6.7 35 2.6 164 0.2 2 0.2
Area‐based poverty level8
Low poverty (<10% below FPL) 211 9.3 168 9.2 43 9.7 20.4 108 8.0 10,502 12.4 88 8.3
Medium poverty (10 to <20% below FPL) 658 28.9 534 29.1 124 27.9 18.8 365 27.1 24,028 28.3 218 20.5
High poverty (20 to <30% below FPL) 638 28.0 514 28.0 124 27.9 19.4 334 24.8 20,563 24.2 303 28.5
Very high poverty (≥30% below FPL) 520 22.8 405 22.1 115 25.9 22.1 382 28.3 20,485 24.1 415 39.0
Area‐based poverty level not available 253 11.1 215 11.7 38 8.6 15.0 159 11.8 9,270 10.9 41 3.8
Transmission risk
Men who have sex with men (MSM) 1,609 70.6 1,347 73.4 262 59.0 16.3 767 56.9 43,940 51.8 299 28.1
Injection drug use history (IDU) 28 1.2 21 1.1 7 1.6 25.0 73 5.4 11,108 13.1 321 30.1
MSM & IDU 40 1.8 36 2.0 4 0.9 10.0 19 1.4 2,522 3.0 55 5.2
Heterosexual9 109 4.8 72 3.9 37 8.3 33.9 103 7.6 5,940 7.0 98 9.2
Perinatal 1 0.0 1 0.1 0 0.0 0.0 10 0.7 1,230 1.4 3 0.3
Other 0 0.0 0 0.0 0 0.0 0.0 0 0.0 114 0.1 4 0.4
Unknown 493 21.6 359 19.6 134 30.2 27.2 376 27.9 19,994 23.6 285 26.8
Clinical status as of 12/31/2013
HIV (non‐AIDS) n/a n/a n/a n/a n/a n/a n/a n/a n/a 36,113 42.6 190 17.8
AIDS n/a n/a n/a n/a n/a n/a n/a n/a n/a 48,735 57.4 875 82.2PLWHA=Persons living with HIV/AIDS; FPL=Federal Poverty Level; n/a=Not applicable. All percents are column percents unless otherwise indicated.Footnotes appear at the bottom of Table 3.1.
FIGURE 5.1: HIV1 diagnosis rates2 among 13‐59 year old males by race/ethnicity3, NYC 2013
143.7
93.5
50.8
26.1
0
30
60
90
120
150
180
Black Hispanic White API
In 2013, the HIV diagnosis rate among black males was 1.5 times higher than the rate among Hispanic males and over 2 times higher than the rate among white males.
API=Asian/Pacific Islander1Includes diagnoses of HIV without AIDS and HIV concurrent with AIDS.2Rates calculated using the intercensal 2013 NYC population.3Native American and multiracial groups not shown because of small numbers.
New
HIV diagnoses
per 100,000 population
4

TABLE 6.1: HIV/AIDS diagnoses and deaths among females, January 1, 2013 through December 31, 2013; and females diagnosed with HIV/AIDS, reported in New York City, and presumed to be living as of December 31, 2013
HIV AMONG FEMALES
HIV diagnoses1AIDS
diagnoses3PLWHA as of12/31/2013 Deaths4
Total Without AIDSConcurrent with AIDS diagnosis2
N % N % N % Row % N % N % N %
Total 552 100.0 422 100.0 130 100.0 23.6 436 100.0 32,770 100.0 462 100.0
Race/Ethnicity5
Black 317 57.4 240 56.9 77 59.2 24.3 265 60.8 19,151 58.4 267 57.8
Hispanic 170 30.8 129 30.6 41 31.5 24.1 139 31.9 10,594 32.3 151 32.7
White 43 7.8 35 8.3 8 6.2 18.6 21 4.8 2,461 7.5 38 8.2
Asian/Pacific Islander 10 1.8 9 2.1 1 0.8 10.0 5 1.1 367 1.1 5 1.1
Native American 1 0.2 1 0.2 0 0.0 0.0 1 0.2 71 0.2 1 0.2
Multiracial 11 2.0 8 1.9 3 2.3 27.3 5 1.1 36 0.1 0 0.0
Unknown 0 0.0 0 0.0 0 0.0 0.0 0 0.0 90 0.3 0 0.0
Age group (years)6
0‐12 1 0.2 1 0.2 0 0.0 0.0 0 0.0 85 0.3 0 0.0
13‐19 27 4.9 26 6.2 1 0.8 3.7 12 2.8 462 1.4 0 0.0
20‐29 108 19.6 93 22.0 15 11.5 13.9 51 11.7 2,095 6.4 9 1.9
30‐39 127 23.0 103 24.4 24 18.5 18.9 100 22.9 4,452 13.6 19 4.1
40‐49 148 26.8 109 25.8 39 30.0 26.4 128 29.4 9,639 29.4 119 25.8
50‐59 88 15.9 56 13.3 32 24.6 36.4 100 22.9 10,857 33.1 182 39.4
60+ 53 9.6 34 8.1 19 14.6 35.8 45 10.3 5,180 15.8 133 28.8
Borough of residence7
Bronx 172 31.2 137 32.5 35 26.9 20.3 120 27.5 10,450 31.9 158 34.2
Brooklyn 173 31.3 127 30.1 46 35.4 26.6 138 31.7 9,789 29.9 149 32.3
Manhattan 101 18.3 71 16.8 30 23.1 29.7 78 17.9 5,106 15.6 78 16.9
Queens 62 11.2 50 11.8 12 9.2 19.4 50 11.5 4,770 14.6 46 10.0
Staten Island 12 2.2 7 1.7 5 3.8 41.7 10 2.3 780 2.4 23 5.0
Outside NYC 30 5.4 28 6.6 2 1.5 6.7 21 4.8 1,836 5.6 7 1.5
Unknown 2 0.4 2 0.5 0 0.0 0.0 19 4.4 39 0.1 1 0.2
Area‐based poverty level8
Low poverty (<10% below FPL) 30 5.4 21 5.0 9 6.9 30.0 20 4.6 1,977 6.0 19 4.1
Medium poverty (10 to <20% below FPL) 124 22.5 93 22.0 31 23.8 25.0 97 22.2 7,439 22.7 76 16.5
High poverty (20 to <30% below FPL) 169 30.6 121 28.7 48 36.9 28.4 131 30.0 9,316 28.4 154 33.3
Very high poverty (≥30% below FPL) 197 35.7 157 37.2 40 30.8 20.3 146 33.5 11,860 36.2 202 43.7
Area‐based poverty level not available 32 5.8 30 7.1 2 1.5 6.3 42 9.6 2,178 6.6 11 2.4
Transmission risk
Injection drug use history 21 3.8 14 3.3 7 5.4 33.3 38 8.7 5,541 16.9 144 31.2
Heterosexual9 411 74.5 325 77.0 86 66.2 20.9 283 64.9 17,252 52.6 186 40.3
Perinatal 1 0.2 1 0.2 0 0.0 0.0 16 3.7 1,285 3.9 3 0.6
Other 0 0.0 0 0.0 0 0.0 0.0 0 0.0 100 0.3 7 1.5
Unknown 119 21.6 82 19.4 37 28.5 31.1 99 22.7 8,592 26.2 122 26.4
Clinical status as of 12/31/2013
HIV (non‐AIDS) n/a n/a n/a n/a n/a n/a n/a n/a n/a 13,405 40.9 63 13.6
AIDS n/a n/a n/a n/a n/a n/a n/a n/a n/a 19,365 59.1 399 86.4PLWHA=Persons living with HIV/AIDS; FPL=Federal Poverty Level; n/a=Not applicable. All percents are column percents unless otherwise indicated.Footnotes appear at the bottom of Table 3.1.
FIGURE 6.1: HIV1 diagnosis rates2 among 13‐59 year old females by race/ethnicity3, NYC 2013
42.5
18.04.3 2.1
0
30
60
90
120
150
180
Black Hispanic White API
New
HIV diagnoses
per 100,000 population
In 2013, the HIV diagnosis rate among black females was over 2 times higher than the rate among Hispanic females and over 9 times higher than the rate among white females.
API=Asian/Pacific Islander1Includes diagnoses of HIV without AIDS and HIV concurrent with AIDS.2Rates calculated using the intercensal 2013 NYC population.3Native American and multiracial groups not shown because of small numbers.
5

0
200
400
600
800
1000
1200
1400
1600
1988
1989
1990
1991
1992
1993
1994
1995
1996
1997
1998
1999
2000
2001
2002
2003
2004
2005
2006
2007
2008
2009
2010
2011
2012
*2013
Indeterminate
HIV‐uninfected
HIV‐infected
Number
of children
Year of birth
HIV AMONG CHILDREN
FIGURE 7.1: Perinatally HIV‐infected children (N=4,011), by year of birth and current vital status, NYC 1977‐2013*
0
50
100
150
200
250
300
350
1977
1978
1979
1980
1981
1982
1983
1984
1985
1986
1987
1988
1989
1990
1991
1992
1993
1994
1995
1996
1997
1998
1999
2000
2001
2002
2003
2004
2005
2006
2007
2008
2009
2010
2011
2012
* 2013
Alive Dead
Year of birth
Number of children
Milestones in Reduction of Perinatal HIV Transmission
1985: CDC recommends women with HIV avoid breastfeeding.
1994: ACTG 076 study shows AZT reduces perinatal transmission.
1997: Routine newborn screening begins in New York.
1999: Expedited testing in obstetrical settings implemented.
In NYC, the number of perinatally HIV‐infected infants peaked in 1990 (n=338), and was followed by a steep declinein the annual number of new infections (Figure 7.1). During 2008‐2012, there were 25 perinatally‐infected infantsborn in NYC. The decrease since the early 1990s is attributed to a decrease in the number of HIV‐infected womendelivering, the introduction of antiretroviral therapies to prevent mother‐to‐child transmission, recommendations foruniversal counseling and voluntary HIV testing of pregnant women, and routine rapid testing at labor and delivery forwomen whose HIV status is unknown. The number of children born to HIV‐infected mothers has steadily decreasedranging from 328 births in 2006 to 166 births in 2012 (Figure 7.2). Since 2002, nearly 90% of infants born to HIV‐infected mothers each year have remained HIV‐uninfected.
*Data for 2013 are incomplete due to reporting lag. Data reported as of July 2014.1Includes data collected at high‐volume NYC medical facilities that care for the majority of HIV‐exposed and infected children.2Children born to HIV‐infected mothers are followed for 2 years after birth to determine HIV status. HIV status is indeterminate if mother and/or child are lost to follow‐up. 3Data from the New York State Comprehensive Newborn Screening Program.
All HIV‐exposed births in NYC 3
FIGURE 7.2: All HIV‐exposed births in NYC and current HIV status of children born to HIV‐infected women at select NYC medical facilities1, by year of birth, NYC 1988‐2013*
2
6
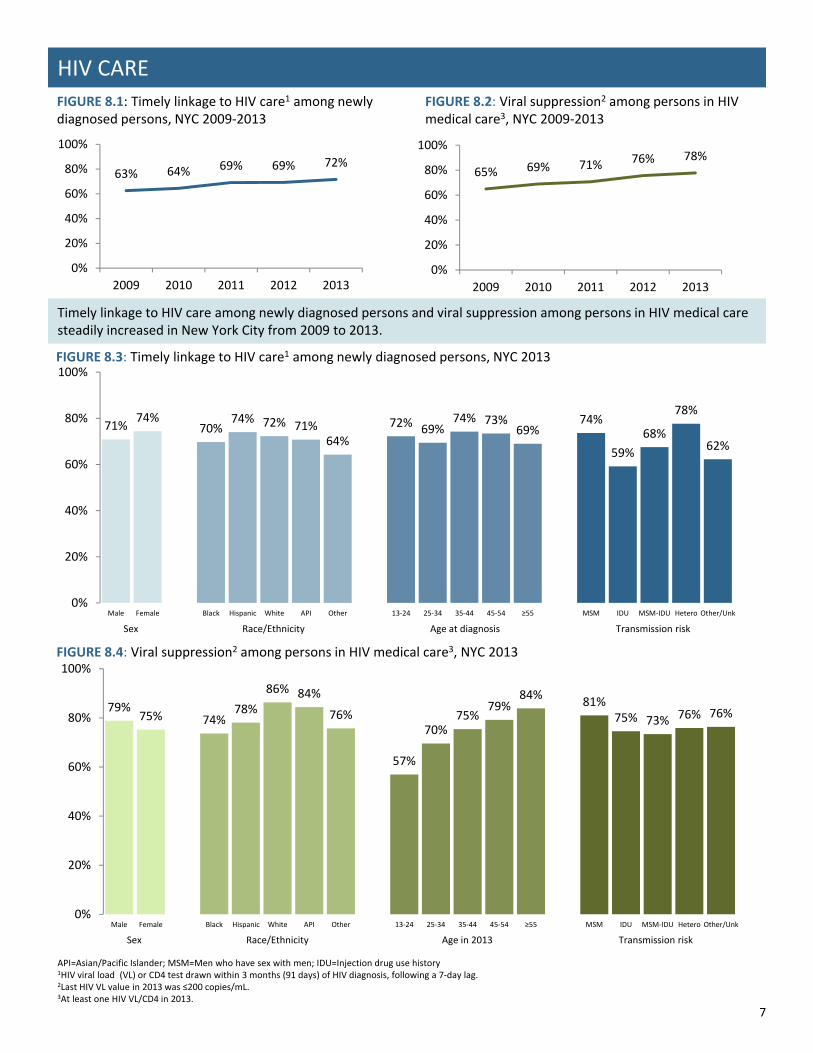
FIGURE 8.1: Timely linkage to HIV care1 among newly diagnosed persons, NYC 2009‐2013
FIGURE 8.3: Timely linkage to HIV care1 among newly diagnosed persons, NYC 2013
HIV CARE
FIGURE 8.2: Viral suppression2 among persons in HIV medical care3, NYC 2009‐2013
FIGURE 8.4: Viral suppression2 among persons in HIV medical care3, NYC 2013
API=Asian/Pacific Islander; MSM=Men who have sex with men; IDU=Injection drug use history 1HIV viral load (VL) or CD4 test drawn within 3 months (91 days) of HIV diagnosis, following a 7‐day lag.2Last HIV VL value in 2013 was ≤200 copies/mL.3At least one HIV VL/CD4 in 2013.
Timely linkage to HIV care among newly diagnosed persons and viral suppression among persons in HIV medical care steadily increased in New York City from 2009 to 2013.
71%74%
70%74% 72% 71%
64%
72% 69%74% 73%
69%74%
59%
68%
78%
62%
0%
20%
40%
60%
80%
100%
Male Female Black Hispanic White API Other 13‐24 25‐34 35‐44 45‐54 ≥55 MSM IDU MSM‐IDU Hetero Other/Unk
63% 64% 69% 69% 72%
0%
20%
40%
60%
80%
100%
2009 2010 2011 2012 2013
65% 69% 71% 76% 78%
0%
20%
40%
60%
80%
100%
2009 2010 2011 2012 2013
79%75% 74%
78%
86% 84%
76%
57%
70%75%
79%84%
81%75% 73% 76% 76%
0%
20%
40%
60%
80%
100%
Male Female Black Hispanic White API Other 13‐24 25‐34 35‐44 45‐54 ≥55 MSM IDU MSM‐IDU Hetero Other/Unk
Sex Race/Ethnicity Age at diagnosis Transmission risk
Sex Race/Ethnicity Age in 2013 Transmission risk
7

32.0
12.1
20.1
5.3
10.7
5.8
0
5
10
15
20
25
30
35
2001 2002 2003 2004 2005 2006 2007 2008 2009 2010 2011 2012
FIGURE 9.1: Survival among persons newly diagnosed with HIV and residing in low‐poverty areas1, by race/ethnicity2, NYC 2008‐2012
Disparities in survival by race/ethnicity persist in NYC (all differences p<0.05), with blacks having the poorest short‐term survival after HIV diagnosis. Racial/ethnic disparities are evident in both low‐poverty and high‐poverty areas, but are most pronounced among those living in high‐poverty areas at the time of HIV diagnosis (Figures 9.1 and 9.2).
FIGURE 9.2: Survival among persons newly diagnosed with HIV and residing in high‐poverty areas1, by race/ethnicity2, NYC 2008‐2012
Years after diagnosis
Survival (%)
Years after diagnosis
Survival (%)
SURVIVAL AMONG PERSONS WITH HIV
API=Asian/Pacific Islander1Poverty level based on NYC ZIP code of residence at diagnosis (if available). Curves include persons diagnosed with HIV from 2008 through 2012 and followed through December 31, 2012; persons not known to have died were censored on December 31, 2012. Low‐poverty area defined as <20% of population below Federal Poverty Level; high‐poverty area defined as ≥20% of population below Federal Poverty Level. 2Native American and multiracial groups not shown because of small numbers.
MORTALITY AMONG PERSONS WITH HIV
FIGURE 10.1: Age‐adjusted death rates among persons with HIV/AIDS, by HIV‐related and non‐HIV‐related cause of death, NYC 2001‐2012
Year of death
Age‐adjusted
1death rates per 1,000
mid‐year PLW
HA
PLWHA = Persons living with HIV/AIDS1Age‐adjusted to the NYC Census 2010 population. Persons newly diagnosed with HIV at death were excluded from the numerator.22012 deaths outside NYC are incomplete. 3Includes persons with unknown cause of death (4% of all deaths).
All‐cause3
Non‐HIV‐related
HIV‐related
The overall death rate among persons diagnosed with HIV/AIDS decreased by 62% from 2001 to 2012. Although the rates of both HIV‐related and non‐HIV‐related deaths decreased during this time, the overall decrease was driven largely by the decline in deaths attributed to HIV.
2
90%
92%
94%
96%
98%
100%
0 1 2 3 4 5
API
White Hispanic
Black
90%
92%
94%
96%
98%
100%
0 1 2 3 4 5
API
White
Hispanic
Black
8
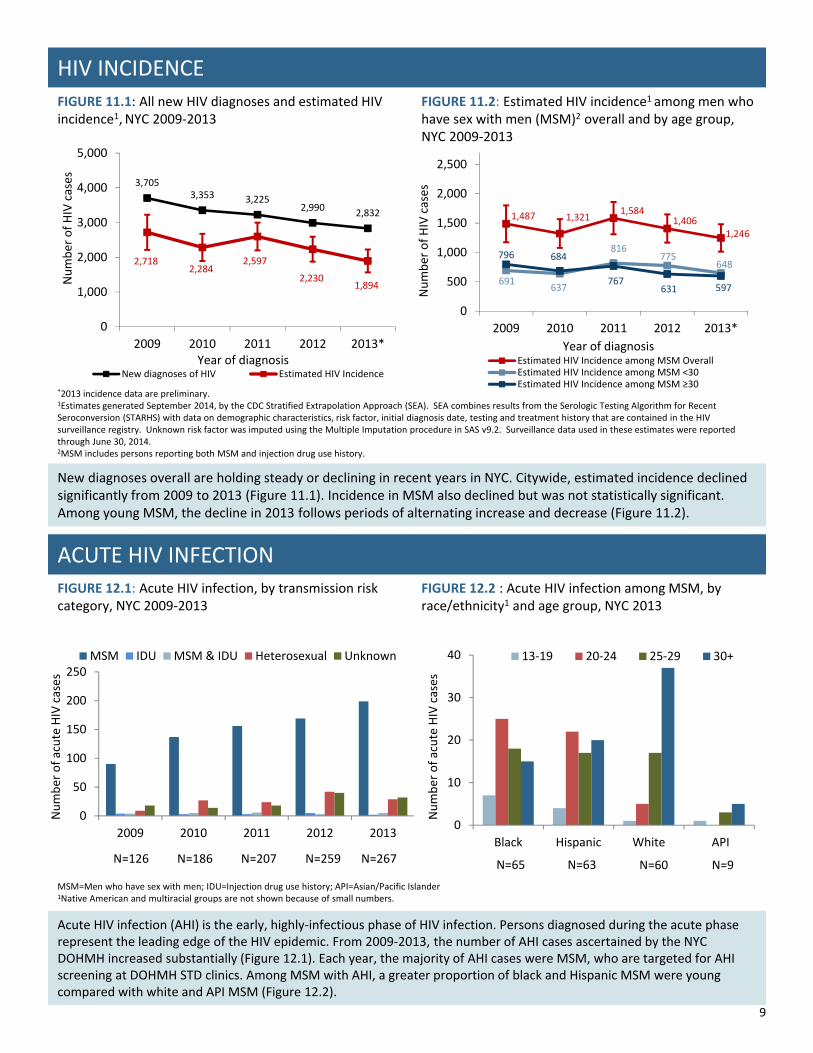
FIGURE 11.1: All new HIV diagnoses and estimated HIV incidence1, NYC 2009‐2013
FIGURE 11.2: Estimated HIV incidence1 among men who have sex with men (MSM)2 overall and by age group, NYC 2009‐2013
HIV INCIDENCE
New diagnoses overall are holding steady or declining in recent years in NYC. Citywide, estimated incidence declined significantly from 2009 to 2013 (Figure 11.1). Incidence in MSM also declined but was not statistically significant. Among young MSM, the decline in 2013 follows periods of alternating increase and decrease (Figure 11.2).
*2013 incidence data are preliminary.1Estimates generated September 2014, by the CDC Stratified Extrapolation Approach (SEA). SEA combines results from the Serologic Testing Algorithm for Recent Seroconversion (STARHS) with data on demographic characteristics, risk factor, initial diagnosis date, testing and treatment history that are contained in the HIV surveillance registry. Unknown risk factor was imputed using the Multiple Imputation procedure in SAS v9.2. Surveillance data used in these estimates were reported through June 30, 2014.2MSM includes persons reporting both MSM and injection drug use history.
ACUTE HIV INFECTION
0
50
100
150
200
250
2009 2010 2011 2012 2013
MSM IDU MSM & IDU Heterosexual Unknown
FIGURE 12.1: Acute HIV infection, by transmission risk category, NYC 2009‐2013
FIGURE 12.2 : Acute HIV infection among MSM, by race/ethnicity1 and age group, NYC 2013
Number of acute HIV cases
Number of acute HIV cases
MSM=Men who have sex with men; IDU=Injection drug use history; API=Asian/Pacific Islander1Native American and multiracial groups are not shown because of small numbers.
Acute HIV infection (AHI) is the early, highly‐infectious phase of HIV infection. Persons diagnosed during the acute phase represent the leading edge of the HIV epidemic. From 2009‐2013, the number of AHI cases ascertained by the NYC DOHMH increased substantially (Figure 12.1). Each year, the majority of AHI cases were MSM, who are targeted for AHI screening at DOHMH STD clinics. Among MSM with AHI, a greater proportion of black and Hispanic MSM were young compared with white and API MSM (Figure 12.2).
N=126 N=186 N=207 N=259 N=267 N=65 N=63 N=60 N=9
0
10
20
30
40
Black Hispanic White API
13‐19 20‐24 25‐29 30+
3,7053,353 3,225
2,9902,832
2,7182,284
2,597
2,2301,894
0
1,000
2,000
3,000
4,000
5,000
2009 2010 2011 2012 2013*
Number of HIV cases
Year of diagnosisNew diagnoses of HIV Estimated HIV Incidence
1,487 1,3211,584
1,4061,246
691637
816775
648796 684
767631 597
0
500
1,000
1,500
2,000
2,500
2009 2010 2011 2012 2013*
Number of HIV cases
Year of diagnosisEstimated HIV Incidence among MSM OverallEstimated HIV Incidence among MSM <30Estimated HIV Incidence among MSM ≥30
9
65%
59%
63%
48%
46%
62%
60%
64%
70%
58%
62%
50+
40‐49
30‐39
18‐29
Age group
Other
Hispanic
White
Black
Race/Ethnicity
Female
Male
Sex
Total
0% 20% 40% 60% 80% 100%
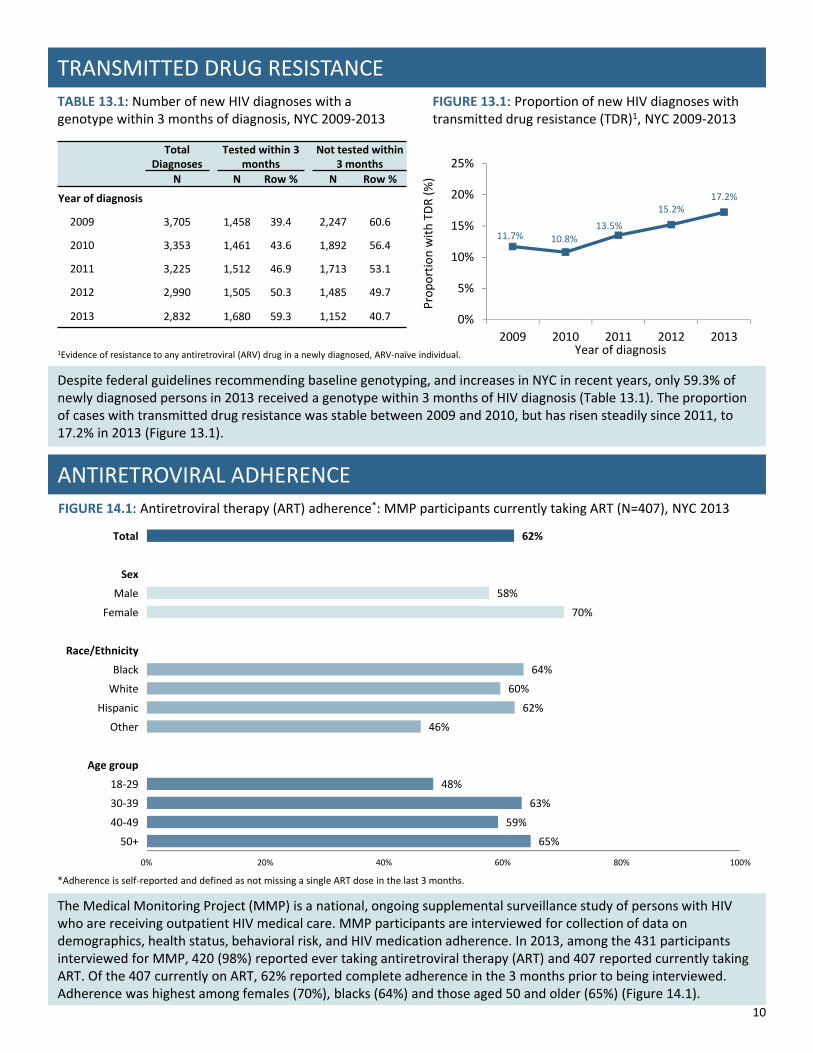
ANTIRETROVIRAL ADHERENCE
FIGURE 14.1: Antiretroviral therapy (ART) adherence*: MMP participants currently taking ART (N=407), NYC 2013
The Medical Monitoring Project (MMP) is a national, ongoing supplemental surveillance study of persons with HIV who are receiving outpatient HIV medical care. MMP participants are interviewed for collection of data on demographics, health status, behavioral risk, and HIV medication adherence. In 2013, among the 431 participants interviewed for MMP, 420 (98%) reported ever taking antiretroviral therapy (ART) and 407 reported currently taking ART. Of the 407 currently on ART, 62% reported complete adherence in the 3 months prior to being interviewed. Adherence was highest among females (70%), blacks (64%) and those aged 50 and older (65%) (Figure 14.1).
*Adherence is self‐reported and defined as not missing a single ART dose in the last 3 months.
TRANSMITTED DRUG RESISTANCE
TABLE 13.1: Number of new HIV diagnoses with a genotype within 3 months of diagnosis, NYC 2009‐2013
FIGURE 13.1: Proportion of new HIV diagnoses with transmitted drug resistance (TDR)1, NYC 2009‐2013
Despite federal guidelines recommending baseline genotyping, and increases in NYC in recent years, only 59.3% of newly diagnosed persons in 2013 received a genotype within 3 months of HIV diagnosis (Table 13.1). The proportion of cases with transmitted drug resistance was stable between 2009 and 2010, but has risen steadily since 2011, to 17.2% in 2013 (Figure 13.1).
11.7% 10.8%13.5%
15.2%17.2%
0%
5%
10%
15%
20%
25%
2009 2010 2011 2012 2013
Proportion with TDR (%)
Year of diagnosis1Evidence of resistance to any antiretroviral (ARV) drug in a newly diagnosed, ARV‐naïve individual.
Total Diagnoses
Tested within 3 months
Not tested within 3 months
N N Row % N Row %
Year of diagnosis
2009 3,705 1,458 39.4 2,247 60.6
2010 3,353 1,461 43.6 1,892 56.4
2011 3,225 1,512 46.9 1,713 53.1
2012 2,990 1,505 50.3 1,485 49.7
2013 2,832 1,680 59.3 1,152 40.7
10
14% 17% 20% 22%31%
40%47%
59%
86% 83% 80% 78%69%
60%53%
41%
0%
10%
20%
30%
40%
50%
60%
70%
80%
90%
100%
2006* 2007 2008 2009 2010 2011 2012 2013
FIGURE 15.1: Proportion of new HIV diagnoses interviewed by the NYC DOHMH Field Services Unit, NYC 2006‐2013Proportion interviewed
(%)
*FSU created in June 2006; data for 2006 are for 6 months only.
Year of diagnosis
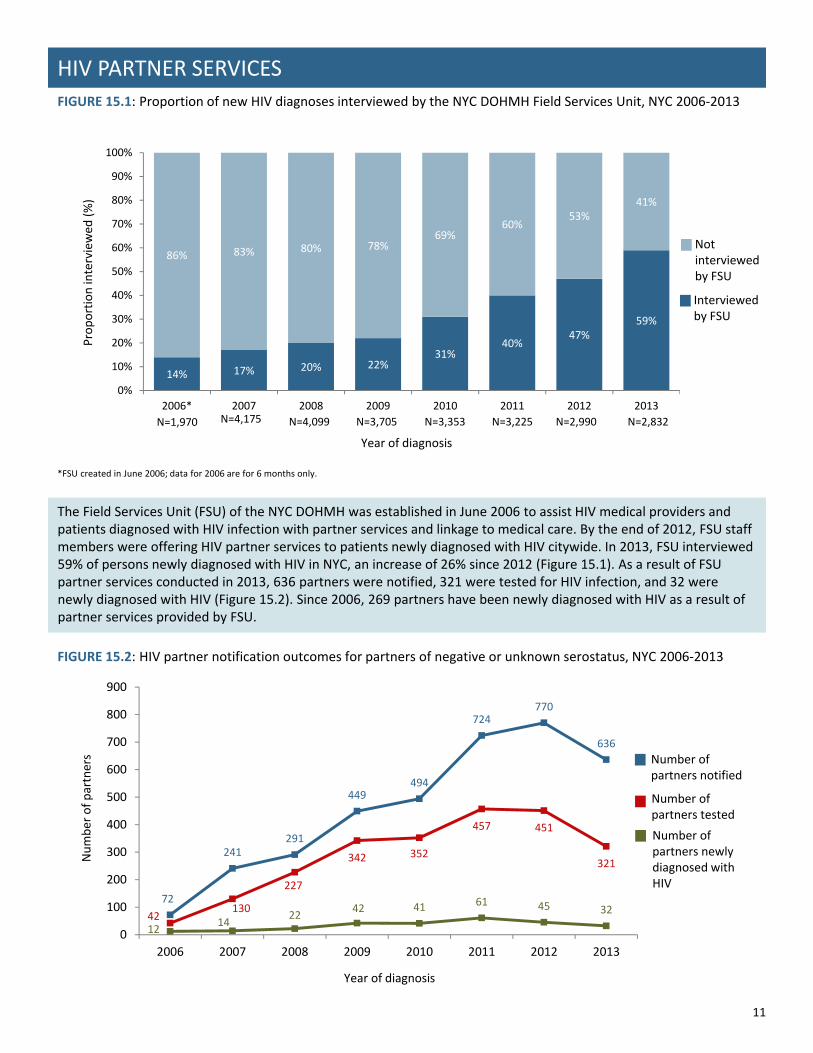
HIV PARTNER SERVICES
72
241291
449494
724770
636
42130
227
342 352
457 451
321
1214
2242 41 61 45 32
0
100
200
300
400
500
600
700
800
900
2006 2007 2008 2009 2010 2011 2012 2013
Number of partners Number of
partners notified
Number of partners tested
Number of partners newly diagnosed with HIV
The Field Services Unit (FSU) of the NYC DOHMH was established in June 2006 to assist HIV medical providers and patients diagnosed with HIV infection with partner services and linkage to medical care. By the end of 2012, FSU staff members were offering HIV partner services to patients newly diagnosed with HIV citywide. In 2013, FSU interviewed 59% of persons newly diagnosed with HIV in NYC, an increase of 26% since 2012 (Figure 15.1). As a result of FSU partner services conducted in 2013, 636 partners were notified, 321 were tested for HIV infection, and 32 were newly diagnosed with HIV (Figure 15.2). Since 2006, 269 partners have been newly diagnosed with HIV as a result of partner services provided by FSU.
FIGURE 15.2: HIV partner notification outcomes for partners of negative or unknown serostatus, NYC 2006‐2013
Year of diagnosis
Not interviewed by FSU
Interviewed by FSU
N=1,970 N=4,175 N=4,099 N=3,705 N=3,353 N=3,225 N=2,990 N=2,832
11

ABOUT THIS REPORT: This report provides an overview of the HIV epidemic in New York City using HIV surveillance data, and presents highlights for the reporting period based on core surveillance activities. All data are based on information received by the NYC DOHMH as of June 30, 2014, and are for calendar year 2013 unless otherwise noted.
HIV SURVEILLANCE: The NYC HIV Epidemiology and Field Services Program (HEFSP) manages the HIV surveillance registry, a population‐based registry of all persons diagnosed with AIDS (since 1981) or HIV infection (since 2000) and reported to the NYC DOHMH according to standard Centers for Disease Control and Prevention (CDC) case definitions.1 The Registry contains demographic, HIV transmission risk and clinical information on HIV‐diagnosed persons, as well as all diagnostic tests, viral load tests, CD4 counts, and HIV genotypes reportable under New York State law.2 For a list of surveillance definitions and technical notes see: http://www.nyc.gov/html/doh/html/data/hivtables.shtml#abbrev.
PERINATAL AND PEDIATRIC HIV SURVEILLANCE: HEFSP collects data on HIV‐exposed and ‐infected infants and children diagnosed with HIV before 13 years of age. Data are used to monitor the prevention of mother‐to‐child HIV transmission, to measure perinatal HIV transmission rates, and describe morbidity and mortality among HIV‐infected children. In addition to routine HIV and AIDS case surveillance, perinatal and pediatric surveillance data are informed by a range of other activities and data sources, including longitudinal case follow‐up, the New York State Department of Health’s Comprehensive Newborn Screening Program, and CDC‐funded special projects related to pediatric HIV.
ACUTE HIV INFECTION SURVEILLANCE: Since 2008, HEFSP has conducted routine surveillance and field investigation of individuals diagnosed in the acute stage of HIV infection (AHI) in New York City. For NYC’s AHI case definition see: http://www.nyc.gov/html/doh/downloads/pdf/ah/ahi‐case‐definition‐current.pdf.
DEATH DATA: Data on deaths occurring in NYC are from matches with the NYC Vital Statistics Registry, medical chart reviews, and provider reports via the Provider Report Form, including HIV‐positive autopsies by the Office of the Chief Medical Examiner. Data on deaths occurring outside NYC are from matches with the Social Security Death Master File and National Death Index. Death data for 2013 are incomplete. Death data for 2012 are incomplete for deaths occurring outside NYC. The most recent year of complete death data is 2011. Cause of death used for analyses in this report is persons’ underlying cause of death. For deaths occurring in 1984‐1986, ICD9 code 279.1 was used to denote AIDS‐related deaths. For deaths occurring in 1987‐1998, ICD9 codes 042‐044 were used to denote HIV/AIDS‐related deaths. For deaths occurring in 1999‐2013, ICD10 codes B20‐B24 were used to denote HIV/AIDS‐related deaths. For technical notes on cause of death by the NYC DOHMH’s Office of Vital Statistics see: http://www.nyc.gov/html/doh/downloads/pdf/vs/vs‐appendix‐b‐2012.pdf.
AREA‐BASED POVERTY: Area‐based poverty is based on NYC ZIP code of residence and is defined as the percent of the population in a given ZIP code whose household income is below the Federal Poverty Level. This measure is not available for persons missing ZIP code information or living outside NYC. Income data used for analyses in this report are from the 2007‐2011 American Community Survey (ACS) for events occurring in 2006‐2009 and ACS 2008‐2012 for events occurring in 2010‐2013. Cut‐points for categories of area‐based poverty in NYC were defined by a NYC DOHMH workgroup.3
MEDICAL MONITORING PROJECT: The Medical Monitoring Project (MMP) is a national, ongoing supplemental surveillance study of persons with HIV who are receiving outpatient HIV medical care. MMP is sponsored by the Centers for Disease Control and Prevention and is conducted by 23 local health departments, universities and other collaborators in the US, including the NYC DOHMH. A three‐stage sampling design is used to obtain a probability sample of HIV‐infected adults receiving HIV care at randomly selected HIV medical care facilities in the first four months of a study year. The project is cross‐sectional and is conducted yearly. Face‐to‐face structured interviews are used to collect information on demographics, health status, behavioral risk factors, and adherence to HIV medication regimens, and information on prescription of antiretroviral therapy, comorbidities, and health service utilization is abstracted from patients’ medical records. For more information on The Medical Monitoring Project see: http://www.cdc.gov/hiv/prevention/ongoing/mmp/index.html.
TECHNICAL NOTES
1Centers for Disease Control and Prevention. Revised surveillance case definition for HIV infection—United States, 2014. MMWR 2014; 63:1‐10.2State of New York Laws. HIV Testing and Counseling. Amendment to New York State Public Health Law Article 21, Amendment of Part 63 of Title 10, Codes, Rules and Regulations of the State of New York (HIV/AIDS Testing, Reporting and Confidentiality of HIV‐Related Information). Chapter 308. Albany, NY: State of New York; 2010.3Toprani A, Hadler JL. Selecting and applying a standard area‐based socioeconomic status measure for public health data: analysis for New York City. New York City Department of Health and Mental Hygiene: Epi Res Report. May 2013; 1‐12.
12

NYC DEPARTMENT OF HEALTH AND MENTAL HYGIENE WEBSITE: www.nyc.gov/health
ADDITIONAL NYC DOHMH RESOURCES ON HIV IN NYC:
NYC HIV Epidemiology and Field Services Program, including additional data on HIV by NYC neighborhood, HIV among subpopulations, and other HIV statistics: http://www.nyc.gov/html/doh/html/data/hivepi.shtml
Other information on HIV/AIDS, including HIV testing sites in NYC, condom distribution, and DOHMH STD clinics: http://www.nyc.gov/html/doh/html/living/std‐hiv.shtml
ADDITIONAL NYC DOHMH DATA RESOURCES:
Data & Statistics: http://www.nyc.gov/html/doh/html/data/data.shtml
EpiQuery, NYC Interactive Health Data System: http://www.nyc.gov/health/epiquery
Maps of ZIP codes by NYC borough: http://www.nyc.gov/html/doh/html/data/map‐gallery.shtml
CENTERS FOR DISEASE CONTROL AND PREVENTION:
National HIV surveillance, including CDC’s case definitions for HIV surveillance: http://www.cdc.gov/hiv/statistics/
HIV PROVIDER REPORTING
ADDITIONAL RESOURCES
All diagnostic and clinical providers (doctors, nurses, physician assistants, and all others diagnosing HIV or providing care toHIV‐infected persons) and laboratories are required by law to report specific HIV‐related events.
REPORT HIV/AIDS CASES:
Providers are required by law to report cases of HIV/AIDS to the NYC DOHMH. The New York State Medical Provider Report Form (PRF) (DOH‐4189 revised 03/09 and 8/05) must be completed for the following events: 1) new diagnosis of HIV (i.e., acute HIV infection or first report of an HIV antibody positive test result); 2) new diagnosis of AIDS (CD4<200 or opportunistic infection); or 3) patient with previously diagnosed HIV or AIDS during their first visit. Providers are required to report such events to the DOHMH within 14 days. In order to protect patient confidentiality, PRF are not permitted to be mailed or faxed to the DOHMH. DOHMH staff are available to pick up PRF from medical facilities at agreed‐upon intervals. To arrange PRF pick‐up, call the HIV Surveillance Provider line at (212) 442‐3388.
DISCUSS PARTNER SERVICES AND REPORT PARTNERS:
Partner services (PS), a free program offered by the NYC DOHMH to all persons diagnosed with HIV, helps persons with HIV determine how to best notify their sex or needle sharing partners. As required by New York State Public Health Law, providers must report all known sex or needle sharing partners to the NYC DOHMH so that partners can be notified of their potential exposure to HIV.
To report partners, call the DOHMH’s Contact Notification Assistance Program (CNAP) at (212) 693‐1419, or complete the PRF whenever partner information is available (either at the time of the reportable event or at a follow‐up visit). Key partner information to report includes: each partner’s first/last name (alias, if applicable), date of birth/estimated age, gender, and domestic violence screening.
For more information on HIV provider reporting, including how to obtain copies of the PRF, see: http://www.nyc.gov/html/doh/html/data/hcpreporting.shtml
SUGGESTED CITATION:
HIV Epidemiology and Field Services Program. HIV Surveillance Annual Report, 2013. New York City Department of Health and Mental Hygiene: New York, NY. December 2014.
13
HIV EPIDEMIOLOGY AND FIELD SERVICES PROGRAM New York City Department of Health and Mental Hygiene
42-09 28th Street, Queens, NY 11101
Published December 2014