Embed Size (px)
Citation preview
1
HIV-1 co-infection does not reduce exposure to rifampicin, isoniazid, and 1
pyrazinamide in South African tuberculosis outpatients 2
Running title: HIV co-infection in pharmacokinetics of anti-TB drugs 3
Authors: Neesha Rockwood N1,2, Graeme Meintjes 1,2,4, Maxwell Chirehwa3, Lubbe 4 Wiesner3, Helen McIlleron 3, Robert J Wilkinson1,2,4,5, Paolo Denti3 5
6
Affiliations: 1 Department of Medicine, Imperial College, London W2 1PG, UK 7
2 Clinical Infectious Diseases Research Initiative, Institute of Infectious Disease and 8 Molecular Medicine, University of Cape Town, South Africa 9
3 Division of Clinical Pharmacology, Department of Medicine, University of Cape 10 Town, South Africa 11
4 Department of Medicine, University of Cape Town, South Africa 12
5 Francis Crick Institute Mill Hill Laboratory, London, NW7 1AA UK 13
14
Contact information for corresponding author: 15
Dr. Paolo Denti 16
K45, Old Main Building, Groote Schuur Hospital 17
Observatory 7925 18
South Africa 19
Tel: +27 21 404 7719 20
Fax: +27 21 448 1989 21
E-mail: [email protected]
AAC Accepted Manuscript Posted Online 1 August 2016Antimicrob. Agents Chemother. doi:10.1128/AAC.00480-16Copyright © 2016 Rockwood et al.This is an open-access article distributed under the terms of the Creative Commons Attribution 4.0 International license.
on April 13, 2018 by guest
http://aac.asm.org/
Dow
nloaded from
2
Abstract (227 words) 23
There is contrasting data in the literature about anti-tuberculosis plasma drug 24
concentrations in HIV-1 co-infected patients. We report pharmacokinetics of 25
rifampicin, isoniazid, and pyrazinamide in a cohort of patients being treated for active 26
tuberculosis, the majority of whom were HIV-1 co-infected and commenced 27
antiretroviral therapy within 2 months of starting anti-tuberculosis treatment. We also 28
examined the association between anti-tuberculosis drug concentrations and 29
reported drug side-effects at 2-month clinical review. 30
One hundred patients with pulmonary tuberculosis (65% HIV-1 co-infected) were 31
intensively sampled to determine rifampicin, isoniazid, and pyrazinamide plasma 32
concentrations after 7-8 weeks of a daily quadruple therapy regimen, dosed 33
according to World Health Organization weight bands. Pharmacokinetic parameters 34
were determined for each patient using nonlinear mixed-effects models. 35
HIV-1 co-infected patients had lower clearance of rifampicin (21% decrease) and 36
isoniazid (23% decrease) compared with HIV-1 uninfected patients, with resulting 37
higher AUC0-24hr and Cmax. Antiretroviral therapy (ART) that included double standard 38
dose lopinavir/ritonavir further lowered rifampicin clearance by 46% and increased 39
AUC0-24hr. Current uniform dosing per kilogram of body weight across WHO weight 40
bands was associated with a trend of decreased pharmacokinetic exposures in the 41
lowest weight-band. Use of fat-free mass for allometric scaling of clearance, as 42
opposed to total body weight, significantly improved the model. 43
Ambulant HIV-1 co-infected patients, the majority of whom were co-prescribed ART, 44
did not have reduced anti-tuberculosis drug concentrations compared with HIV-1 45
uninfected patients. 46
on April 13, 2018 by guest
http://aac.asm.org/
Dow
nloaded from
3
Main text (3219 words) 47
Despite global initiatives prioritising reduction of incidence and mortality attributable 48
to tuberculosis (TB), in 2014 there were an estimated 9.6 million new TB cases (12% 49
were HIV-1 co-infected) and 1.5 million deaths (27% were HIV-1 co-infected) (1). In 50
the case of rifampicin-susceptible pulmonary tuberculosis, World Health 51
Organization (WHO) guidelines advocate a daily regimen inclusive of 2 months of 52
intensive phase therapy with first line drugs rifampicin, isoniazid, pyrazinamide, and 53
ethambutol followed by 4 months of continuation phase therapy with rifampicin and 54
isoniazid. Fixed dose combination formulation (FDC) tablets are widely used to 55
deliver standardized doses according to weight(2). 56
There are multiple causes leading to significant inter-individual pharmacokinetic 57
variability including pharmacogenomics (3, 4), sex (5, 6), weight(6), and co-58
morbidities like diabetes mellitus (5, 7-9) There have been contrasting findings 59
published regarding the effect of HIV-1 co-infection on anti-TB drug 60
pharmacokinetics with some studies showing reduced drug exposures (10-12) and 61
others no significant difference between HIV-1 co-infected and uninfected patients 62
(5, 13-15). Of note, cohorts studied had varying degrees of nutritional deprivation, 63
immunosuppression, and varying proportions concurrently taking antiretroviral 64
therapy (ART). As other studies have shown contradictory findings on the role of 65
plasma drug concentrations on anti-TB, we thus wished to further address this in a 66
contemporary cohort with good access to ART resulting in many patient being on 67
ART and HIV1- co-infected patients generally being less advanced in terms of 68
immunosuppression than in historical reports. 69
We hypothesized there would be lower plasma drug concentrations of anti-TB drugs 70
on April 13, 2018 by guest
http://aac.asm.org/
Dow
nloaded from
4
in HIV-1 co-infected patients compared with HIV-1 uninfected patients. We aimed to 71
assess pharmacokinetic parameters for rifampicin, isoniazid and pyrazinamide in a 72
cohort with a good sample size, utilizing strong pharmacokinetic analysis methods to 73
allow relatively accurate delineation and attribution of PK variability. Due to 74
budgetary constraints we focused on the 3 drugs with foremost importance in the 75
anti-TB regimen (16). 76
The relationship between drug concentrations of standard dose first line anti-TB 77
drugs and drug side effect profiles is unclear. Serious adverse drug reactions 78
(Common Terminology Criteria for Adverse Events (CTCAE)(17) grade 3 and above) 79
such as drug-induced hepatotoxicity are well documented and can sometimes be 80
attributed to a specific anti-TB drug based upon temporality, cessation and 81
sequential drug re-challenge(18) . Mild to moderate drug side-effects of CTCAE 82
grades 1-2 are common (19-21). Even though they may be difficult to attribute to a 83
specific anti-TB drug with any certainty, they are likely to contribute to sub-optimal 84
adherence (22) and may adversely affect treatment outcomes (19). 85
We also aimed to determine whether plasma drug concentrations were associated 86
with reported drug side effects at 2 months. 87
MATERIALS AND METHODS 88
Patients 89
Patients with GeneXpert ® MTB/RIF confirmed rifampicin-susceptible pulmonary TB 90
were recruited at Ubuntu HIV/TB clinic, Site B, Khayelitsha, South Africa as part of a 91
prospective cohort study (Human Research Ethics Committee approval 568/2012) 92
assessing frequency and determinants of acquired drug resistance in a 93
programmatic setting. A sub-cohort was invited to participate in a nested 94
on April 13, 2018 by guest
http://aac.asm.org/
Dow
nloaded from
5
pharmacokinetic study between July 2013 and April 2014. All patients provided 95
written consent prior to participation. Detailed sociodemographic data, past TB 96
treatment history and co-morbidity data were collected. Participants underwent HIV 97
testing (Abbott Architect HIV Ag/Ab Combo test) and CD4 lymphocyte count and 98
HIV-1 viral load quantification at baseline. Anti-TB drugs were delivered in a 4-drug 99
FDC supplied by the National Tuberculosis Control Programme (Rifafour® e-275 100
,Sanofi-Aventis or Ritib®, Aspen, South Africa). Each tablet contained rifampin at 101
150 mg, isoniazid at 75 mg, pyrazinamide at 400 mg, and ethambutol at 275 mg. 102
Weight band-based dosing was used in line with WHO guidelines(2). Patients 103
weighing 38 to 55 kg, >55 to 70 kg, and >70 kg were given doses of 3, 4, and 5 104
tablets, respectively. Anti-TB drugs was administered 7 days/week, along with 25mg 105
pyridoxine. Clinical care remained the responsibility of Site B TB clinic. 106
Characterization of side effects 107
Patients were interviewed at the 2-month clinical review using a systems-based 108
symptom questionnaire that included the categories central nervous 109
/neuropsychiatric, peripheral nervous, gastrointestinal, musculoskeletal, skin and 110
other. Attribution of causality to the anti-TB regimen was made in the 111
“probable”/“possible” categories as per WHO-Uppsala Monitoring Center system(18). 112
Pharmacokinetics 113
Pharmacokinetic sampling was carried out for rifampicin, isoniazid, and 114
pyrazinamide after 7-8 weeks of anti-TB drugs. This time point was chosen to 115
maximise applicability to a programmatic setting, i.e. point of routine evaluation prior 116
to switching from intensive phase to continuation phase therapy. In addition, this time 117
point ensured a majority of HIV-1 co-infected patients were prescribed ART and 118
on April 13, 2018 by guest
http://aac.asm.org/
Dow
nloaded from
6
rifampicin autoinduction would be complete. Patients were fasted 8 hours on the day 119
of pharmacokinetic study and consumed standardized meals at 2 hours and 4-5 120
hours post dose. Blood samples were obtained immediately before (pre-dose) and 1, 121
2, 3, 4, 6, and 8 hours after drug ingestion. They were immediately placed on ice and 122
plasma separated by centrifugation within 30 min, before storage at -80°C until 123
analysis. The storage tubes containing the plasma samples were transferred on dry 124
ice to the Pharmacology Laboratory at the University of Cape Town, where drug 125
concentrations were determined using validated liquid chromatography tandem mass 126
spectrometry methods. The methods were validated over the concentration ranges 127
0.0977 to 26.0 µg/mL for isoniazid, 0.117 to 30.0 µg/mL for rifampicin and 0.200 to 128
80.0 µg/mL for pyrazinamide. (23). The % nominal concentration (accuracy) for 129
rifampicin was 99.2%, 98.1% and 99.4%, for isoniazid was 100.5%, 100.1% and 130
99.4%, and for pyrazinamide was 100.8%, 103.7% and 102.1% at the low, medium, 131
and high quality control levels respectively, during inter-day sample analysis. The 132
precision (% CV) was less than 3% at low, medium, and high quality control levels. 133
Concentrations of rifampicin, isoniazid, and pyrazinamide below the validation range 134
of the assay were reported as “below the limit of quantification” (BLQ). 135
136
Plasma concentration-time data from all subjects were simultaneously analysed by a 137
non-linear mixed-effects model utilising Monolix (version 4.3.3)(24). Previously 138
published structural models were selected and optimized on the current data (25-27). 139
The structural models tested included one- and two- compartment disposition with 140
first-order elimination and first-order absorption, testing the presence of an 141
absorption lag time or a delay modelled via a chain of transit compartments. Inter-142
occasional variability (IOV) was included by treating the drug concentration 143
on April 13, 2018 by guest
http://aac.asm.org/
Dow
nloaded from
7
measured prior to the observed dose administration (pre-dose concentration) as a 144
separate pharmacokinetic occasion. Random inter-individual variability (IIV) and IOV 145
were assumed log-normally distributed, and correlations between the random effects 146
was tested. A mixture model was evaluated to explore the multi-modal distribution of 147
isoniazid CL, due to the polymorphic N-acetyltransferase-2 (NAT2) gene. Data points 148
which were BLQ were treated as censored and handled with the Monolix 149
implementation of the M3 method (28). Allometric scaling with either total body 150
weight, or fat-free mass (FFM)(29) was applied to clearance (CL) and volume of 151
distribution (V), as suggested by Anderson and Holford (30). Fat-free mass was 152
calculated using the empirical model developed by Janmahasatian et al (31). 153
= ∙ ∙∙ ∙ where Wt denotes body weight in kg, Ht is height in m, and the constants WHSmax 154
and WHS50 have the value of 42.92 and 30.93 in men, and 37.99 and 35.98 in 155
women, respectively. 156
157
Other covariates tested included the effect of sex, age, serum albumin, total protein, 158
HIV serostatus, CD4 lymphocyte count (as a binary variable above and below 200 159
cells/mm3), type of ART (none vs. non-nucleoside reverse transcriptase (NNRTI)-160
based vs. protease inhibitor (PI)-based), total dose, and dose in mg/kg. Model 161
development and selection was based on optimisation of the objective function value 162
(OFV), inspection of goodness of fit plots including visual predictive checks (n=500), 163
and biological plausibility. Stepwise covariate selection was performed using a drop 164
in OFV of >3.84 (corresponding to a significance level of 5%) as the cut-off for 165
inclusion and an increase of >6.63 OFV points as a cut-off for the backward 166
on April 13, 2018 by guest
http://aac.asm.org/
Dow
nloaded from
8
elimination step. The OFV was obtained using Importance Sampling (n=20000) and 167
the precision of the parameter estimates was obtained using the stochastic 168
approximation to the Fisher information matrix. 169
Finally, model-based individual pharmacokinetic parameter values referring to the 170
pharmacokinetic profile after the observed dose were used in the R package Simulx 171
(32) to simulate steady-state individual profiles and calculate peak concentration 172
(Cmax) and area under the concentration-time profile curve from 0 to 24 hours (AUC0-173
24). 174
Statistical analyses 175
The Wilcoxon-Mann-Whitney test was used to compare PK exposures between 176
those with side effects and those without. Logistic regression analyses were used to 177
calculate odds ratios for side effects at different drug exposure quartiles and 178
adjusted for potential confounders. Stata version 13.1 (College station, TX) and 179
GraphPad Prism 6.0 (La Jolla, CA) were used for all analyses.180
on April 13, 2018 by guest
http://aac.asm.org/
Dow
nloaded from
9
Results 181
Patient demographics 182
Of the 100 study participants, 57% were male and 65% were HIV-1 co-infected with 183
a median CD4 lymphocyte count of 233 cells/mm3 (IQR 106-386). Amongst HIV-1 184
co-infected patients the proportion on ART increased from 27/65 (42%) at baseline 185
to 50/65 (77%) at the time of pharmacokinetic study with 45/50 (90%) on NNRTI-186
based (96% on efavirenz, 5% on nevirapine) regimens and 5/50 (10%) on protease 187
inhibitor (PI) based (Lopinavir/ritonavir (LPV/r)) regimens. 188
The median (IQR) body mass index (BMI) and age were 21 kg/m2 (19-23), 33 years 189
(29-40). Table 1 provides the clinical characteristics of the pharmacokinetic cohort, 190
stratified by HIV-1 serostatus. 191
192
Patient pharmacokinetic parameters 193
The population pharmacokinetic final parameter estimates for rifampicin, isoniazid, 194
and pyrazinamide are shown in tables 2-4, including the precision of parameter 195
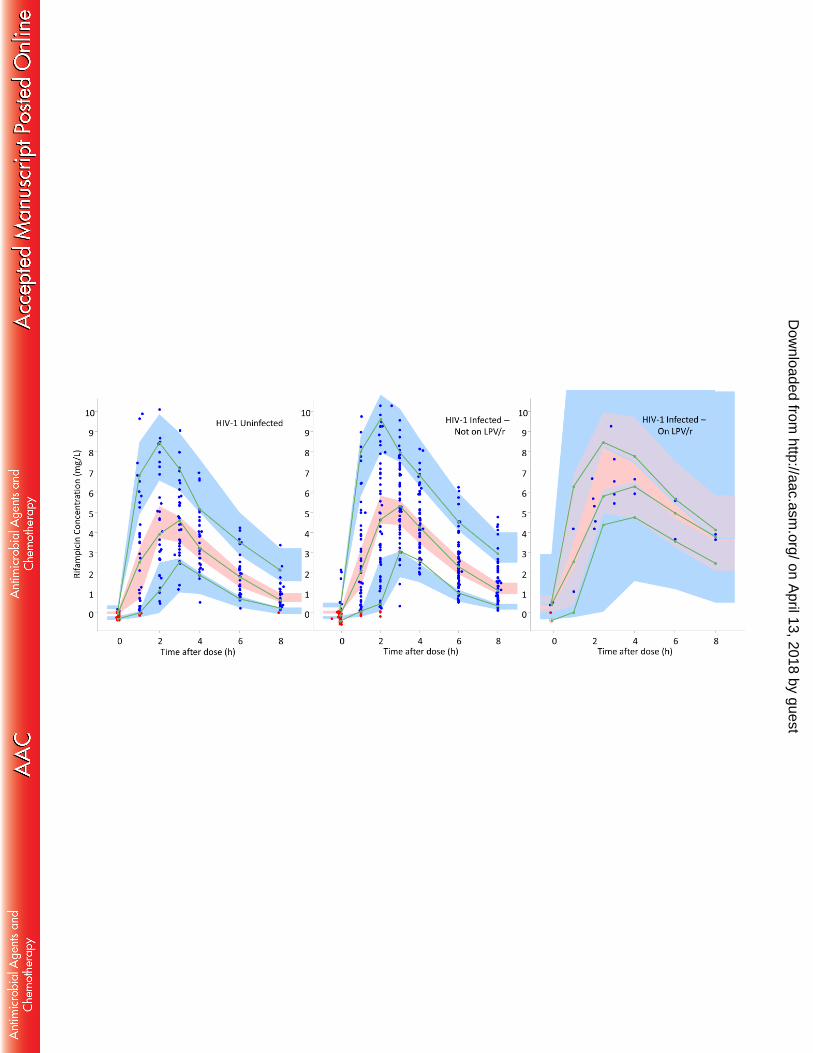
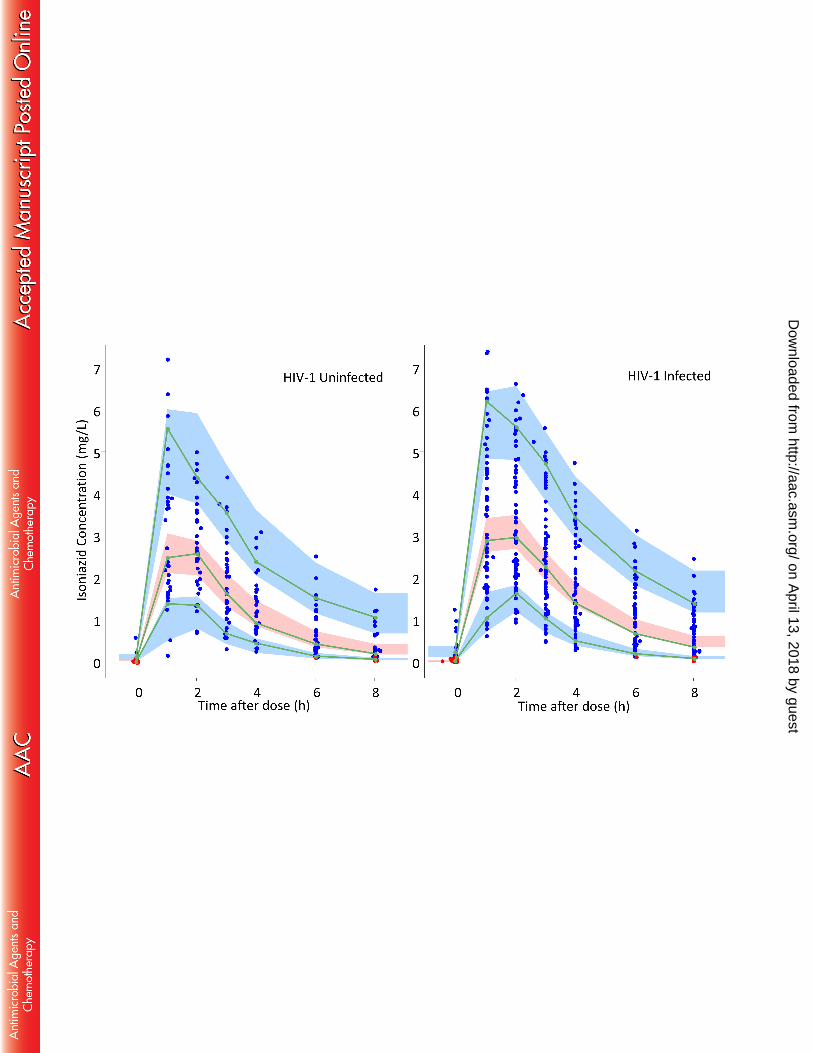
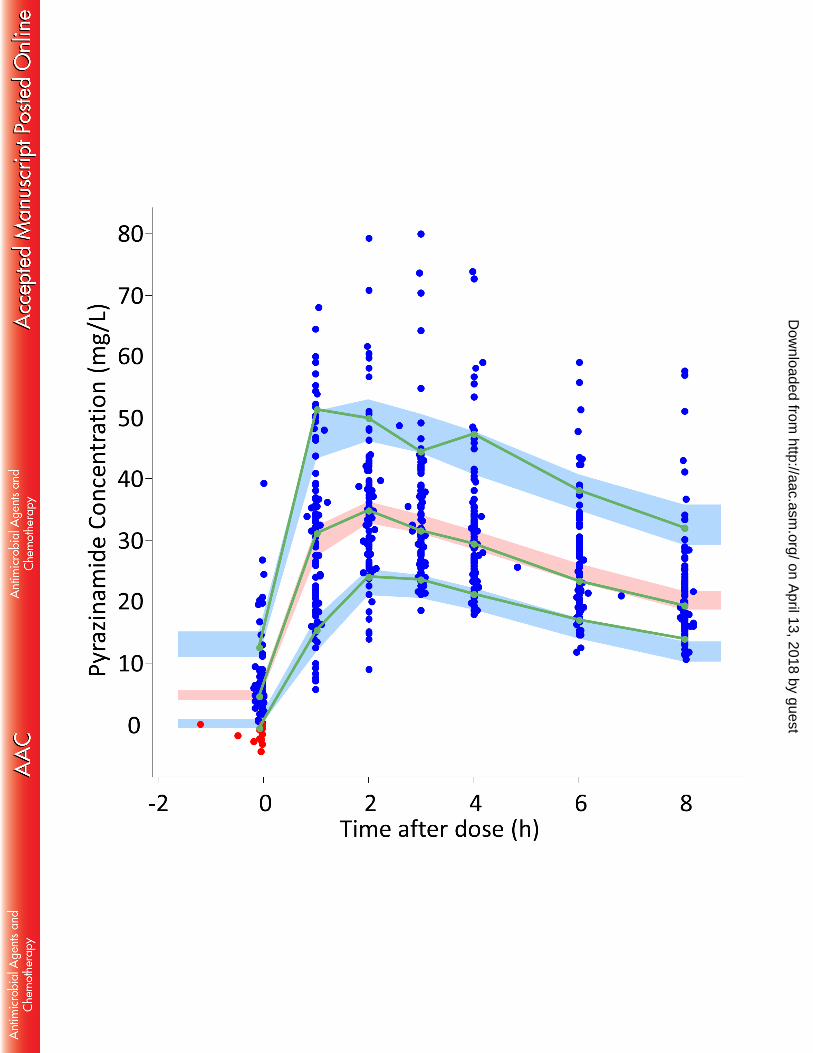
estimates and shrinkage values for the random effects (33) .Visual predictive checks 196
are provided in Figure 1. 197
The optimised structural model for rifampicin was a one-compartment model with 198
first-order elimination and first-order absorption with an absorption lag time. A two-199
compartment model with first-order elimination and absorption through a series of 200
transit compartments was optimal for isoniazid. Finally, a one-compartment model 201
with first-order elimination, and transit compartment absorption was used for 202
pyrazinamide. FFM was found to be the most suitable body size descriptor for 203
allometric scaling of all CL and V parameters, and it improved the OFV by 20, 34, 204
on April 13, 2018 by guest
http://aac.asm.org/
Dow
nloaded from
10
and 64 points for rifampicin, isoniazid, and pyrazinamide, respectively. 205
Since HIV-1 serostatus (infected vs. not infected) and ART status (on ART vs not on 206
ART) are collinear, the covariate effect “HIV-1 status” and “ART status” on the 207
pharmacokinetic parameters were tested separately. ‘HIV-1 status’ as a covariate 208
caused improvement in the model to greater extent than ‘ART status’ (7 point drop in 209
OFV, as compared to only 4) and diagnostics plots were better for the model 210
including HIV, hence this was selected in the final model rather than ART. The 211
models found that HIV-1 co-infection significantly decreased CL of rifampicin (21% 212
decrease, OFV drop 7.00, p<0.01, see Table 2) and isoniazid (23% decrease, OFV 213
drop 8.63, p<0.01, see Table 3). Inclusion of HIV-1 co-infection in the covariate 214
model, did not significantly improve the model fit for pyrazinamide. Although HIV-1 215
infected participants had lower FFM than HIV-1 uninfected participants (see Table 216
1), the effect of HIV-1 on CL was independent of differences in FFM. 217
We split ‘ART status’ into ‘type of ART’ (i.e. no ART, NNRTI-based ART, LPV/r-218
based ART) and tested it as a further covariate (in addition to the HIV effect). We 219
separately tested the effect of both NNRTI-based regimen (yes/no) and LPV/r-based 220
regimen (yes/no) as a covariate on bioavailability, V and CL in an optimised model 221
which was already adjusting for the effect of ‘HIV-1 status’ on CL. On top of the 222
effect of HIV-1 on CL, patients on double-dose LPV/r-based ART regimen (dosed at 223
800mg/200mg twice daily in all 5 cases) had a further significant decrease in 224
rifampicin CL of 46% (OFV drop 7.00, p<0.01) and hence, increased AUC0-24 (Table 225
2). When the model was re-run excluding the 5 participants on PI-based regimens, 226
the effect of HIV-1 on CL was still significant. 227
During model development, the multi-modal distribution of isoniazid CL attributed to 228
the polymorphic nature of the NAT2 genotype (3) was described using a mixture-229
on April 13, 2018 by guest
http://aac.asm.org/
Dow
nloaded from
11
model which improved the model fit. However, the current version of Monolix does 230
not support both mixture modelling and estimation of inter-occasional variability, 231
which was used to describe variability in the pre-dose sample, so the latter was 232
included because it was more significant in terms of model fit. 233
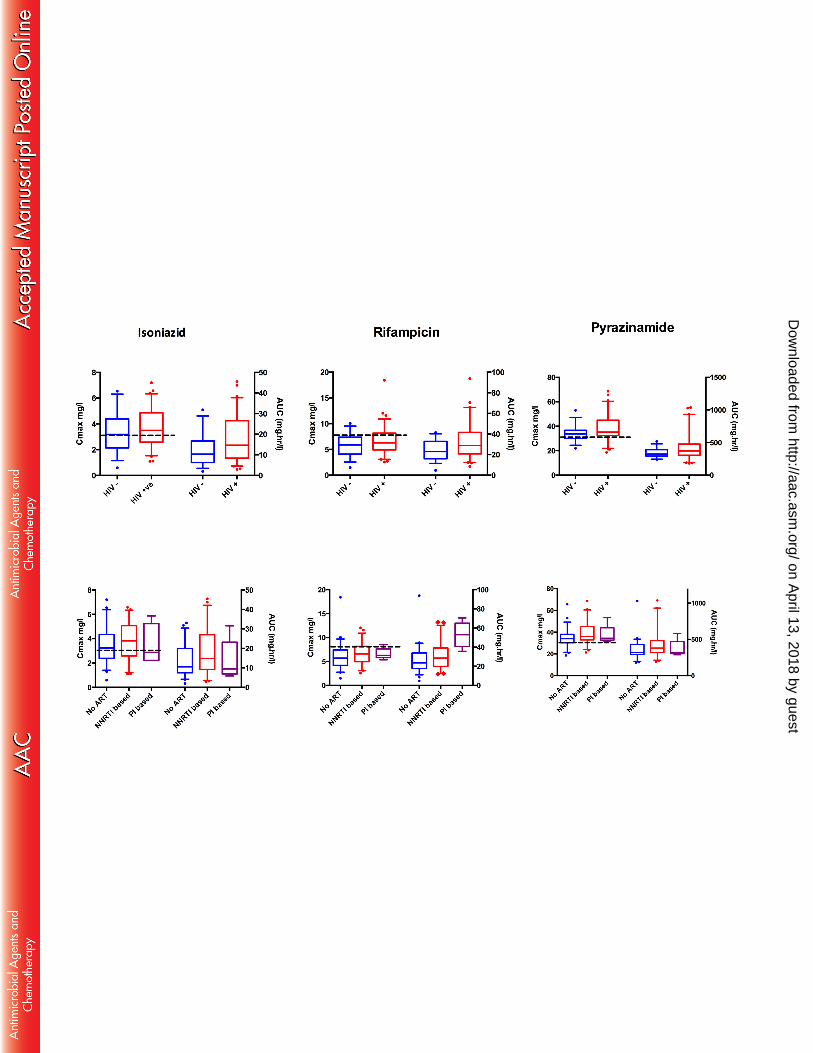
Figure 2 shows Cmax and AUC0-24 stratified by HIV-1 serostatus. For all 3 drugs, 234
pharmacokinetic exposures were either increased in those HIV-1 infected or no 235
difference was detected. There were no differences in exposures, comparing HIV-1 236
infected patients with CD4 lymphocyte counts above or below 200 cells/mm3. In HIV-237
1 infected participants, 41% had low isoniazid Cmax (<3mg/L), 75% had low rifampicin 238
Cmax (<8mg/L) and 31% had low pyrazinamide Cmax (<35mg/L) (34). In HIV-1 239
uninfected participants, 46% had low isoniazid Cmax, 88% had low rifampicin Cmax 240
and 63% had low pyrazinamide Cmax. 241
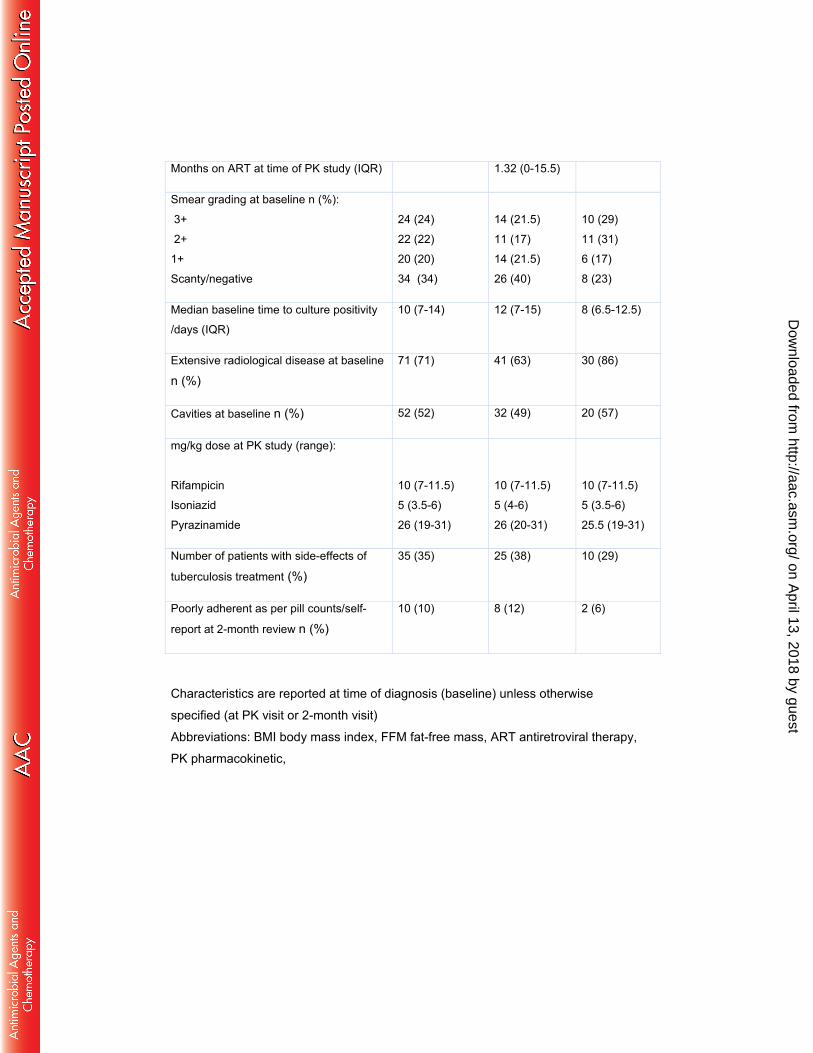
The range of doses in milligrams per kilogram of body weight for the 3 drugs are 242
shown in Table 1. Eight participants required change in weight band during 243
treatment. Three had their dose adjusted appropriately, one was put in a weight 244
band higher than his weight and 4 were put in a weight band lower than their weight. 245
Hence, on the day of pharmacokinetic sampling, 95 participants were being dosed 246
correctly according to current weight and weight band. Patients in the lowest weight 247
band had lower drug exposures and this was explained by a relatively higher CL in 248
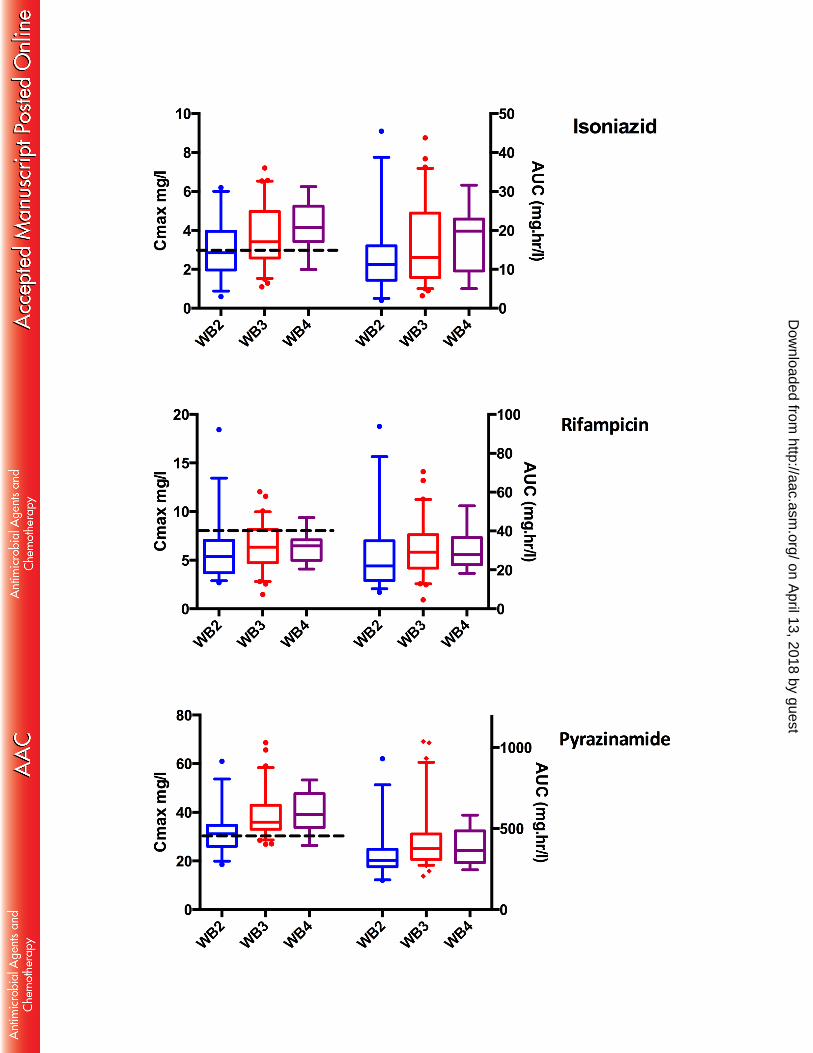
smaller individuals. Figure 3 shows differences in pharmacokinetic exposures 249
stratified by the WHO weight band doses assigned by the programme. The 250
predictions shown included allometric scaling with FFM, which accounted for the 251
increased clearance per kilogram of body weight in smaller individuals and resulted 252
in a significant improvement of the model. 253
on April 13, 2018 by guest
http://aac.asm.org/
Dow
nloaded from
12
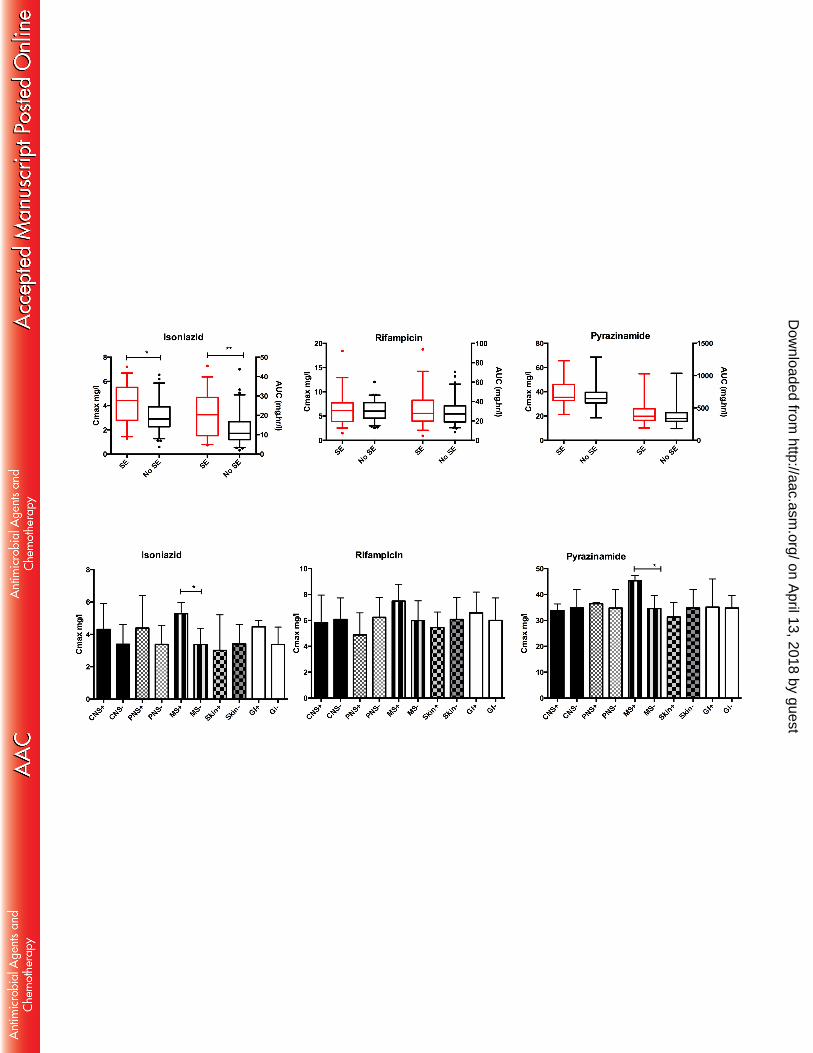
All side-effects were CTCAE grade 1-2 and did not require drug withdrawal. Thirty-254
five participants (35%) reported CTCAE grade 1-2 side effects which were 255
possibly/probably attributed to anti-TB drugs including central nervous system/neuro-256
psychiatric (4/35), peripheral neuropathy (7/35), nausea/gastro-intestinal (11/35), 257
musculoskeletal (11/35), skin (8/35), other (2/35). Patients presenting side effects 258
had a significantly higher median Cmax for isoniazid [4.42 mg/L (IQR 2.79-5.51)] 259
compared with those who did not [2.89 mg/L (IQR 2.28-3.87, p=0.001)]. Having 260
adjusted for age, HIV-1 serostatus, diabetes mellitus status, alcohol intake, age, and 261
previous isoniazid treatment, the highest quartile of isoniazid AUC 0-24 was still 262
associated with increased side effects [OR 7.11 (95% CI 1.99- 25.47, p=0.003)] 263
compared with the lowest quartile of isoniazid AUC0-24 (see table 5). There were no 264
significant differences for rifampicin or pyrazinamide (Figure 4). Although there was a 265
trend of high isoniazid Cmax in those with central nervous system, peripheral nervous 266
system, gastro-intestinal, and musculoskeletal side-effects, this was only statistically 267
significant for musculoskeletal side effects. A significantly higher pyrazinamide Cmax 268
was also seen in patients with musculoskeletal side effects (Figure 4). 269
on April 13, 2018 by guest
http://aac.asm.org/
Dow
nloaded from
13
Discussion 270
Peak concentrations and AUC0-24 of rifampicin, isoniazid, and pyrazinamide were low 271
and highly variable, and findings were comparable with other cohorts in both similar 272
(Southern African) (6, 10, 13, 35, 36) and different (37-39) study populations. There 273
have been previous studies examining anti-TB pharmacokinetics in HIV-1 co-274
infected patients with a HIV-1 uninfected comparator group. However, none of these 275
studies included HIV-1 co-infected patients concomitantly taking ART. Reduced 276
rifampicin concentrations have been recorded in HIV-1 co-infected patients with 277
diarrhoea and this has been associated with malabsorption and advanced 278
immunosuppression (11, 40, 41). Further studies have also shown evidence for 279
reduced rifampicin concentration in HIV-1 co-infected patients (10, 12), whilst others 280
show no significant difference (5, 13, 15, 42). There have also been contrasting 281
results in the literature regarding the effect of HIV-1 co-infection on pyrazinamide 282
concentrations (10, 43). 283
In this cohort of ambulatory patients, with 77% of HIV-1 co-infected patients on ART, 284
there was no evidence of lower plasma concentrations of rifampicin, isoniazid, or 285
pyrazinamide in HIV-1 co-infected patients. Conversely, the population 286
pharmacokinetic model, which accounted for the effect of FFM, showed evidence of 287
reduced rifampicin and isoniazid CL in HIV-1 co-infected compared to HIV-1 288
uninfected patients leading to increased AUC 0-24. 289
Although use of ART or CD4 stratification as a covariate did not significantly improve 290
the model, there was an independent effect of “LPV/r” vs “no LPV/r” on rifampicin 291
AUC0-24, again explained by a reduction in CL. Although only 5 patients in the study 292
were on an ART regimen inclusive of LPV/r, this effect of double dose LPV/r on 293
on April 13, 2018 by guest
http://aac.asm.org/
Dow
nloaded from
14
rifampicin exposures was statistically significant. This has not been reported 294
previously. Rifampicin is a substrate of p-glycoprotein and organic anion-transporting 295
polypeptide (OATP) 1B1 and OATP 1B3 which are involved in its transporter-296
mediated efflux in the liver and hence, biliary clearance. Lopinavir and ritonavir are 297
inhibitors of both p-glycoprotein and OATP1/3(44). Hence, this may be a potential 298
mechanism for decreased clearance of rifampicin. Inhibition of gastrointestinal p-299
glycoprotein could also increase systemic rifampicin concentrations. There are 300
potential implications for dosing and toxicity profiles, particularly in future regimens 301
incorporating higher dose/kg of rifampicin and these findings should be explored in 302
further pharmacokinetic studies. These results provide evidence that, at the time of 303
switch to continuation phase, ambulant HIV-1 co-infected patients who are 304
reconstituting on ART, do not have reduced anti-TB drug concentrations compared 305
with HIV-1 uninfected patients. These findings are not necessarily generalizable to 306
HIV-1 co-infected patients in an inpatient setting, or those with advanced 307
immunosuppression (median CD4 of this cohort was 233 cells/mm3). 308
As previously reported (6), weight and in particular FFM, influenced CL in a non-309
linear fashion and hence uniform dosing in mg/kg across the WHO weight bands, 310
was associated with the lowest weight band having a trend of lower drug 311
concentrations compared with the highest weight band. Therefore, dosing could be 312
optimised according to FFM and in particular, dosing for the lower weight band 313
should be reviewed. 314
Having adjusted for potential confounders, there was still a significantly increased 315
proportion of side-effects in patients with the highest isoniazid AUC0-24 quartile. 316
Overall incidence of drug side-effects secondary to isoniazid reported in the literature 317
ranges from 1-3% for dermatological, gastrointestinal and neurological side effects, 318
on April 13, 2018 by guest
http://aac.asm.org/
Dow
nloaded from
15
to 1-17% for hypersensitivity reactions (20). Thirteen of the 16 patients who had side 319
effects and were in the highest isoniazid AUC0-24 quartile were HIV-1 co-infected. 320
Studies have shown that 8-20% of patients taking isoniazid can develop anti-nuclear 321
antibodies. This is increased in slow acetylators (45) and may be potentiated in HIV-322
1 co-infection. One randomized controlled clinical trial conducted in Japan, showed 323
that isoniazid related liver injury in the first 8 weeks of anti-TB treatment occurred in 324
78% of slow acetylators given standard 5 mg/kg dose compared to 0% in slow 325
acetylators given 2.5 mg/kg dose (46). Hence, significant pharmacokinetic variability 326
for isoniazid, even at standard dosing, may be contributing to toxicity. 327
There were several limitations in this study. Pharmacogenomic data such as NAT-2 328
and SLCO1B1 genotype was not available for incorporation into the population PK 329
models. Drug concentrations sampling was not repeated at different times during 330
treatment and hence may have under/over-estimated IOV secondary to change in 331
weight and immune reconstitution secondary to ART. A previous study in HIV-1 co-332
infected patients did not find an independent effect of first dose ART or steady state 333
ART (at 2 weeks) on TB pharmacokinetics compared with day 1 of anti-TB drugs (6). 334
There was no routine monitoring of blood tests such as liver and renal function. 335
Hence, asymptomatic adverse drug reactions would not have been ascertained. 336
In this outpatient setting with a high burden of HIV-1 co-infected patients, the 337
majority of whom were immune reconstituting on ART, there was no evidence that 338
HIV-1 co-infection led to lower anti-TB drug concentrations. 339
Funding information 340
Robert J.Wilkinson is supported by the Wellcome Trust [WT 104803 ; WT084323], 341
UK MRC [UKMRC U1175.02.002.00014] and the European Union [EU FP7 342
on April 13, 2018 by guest
http://aac.asm.org/
Dow
nloaded from
16
HEALTH-F3-2012-305578] and the National Research Foundation (NRF) of South 343
Africa (96841). Graeme Meintjes was supported by the Wellcome Trust 344
(098316), the South African Research Chairs Initiative of the Department of Science 345
and Technology and National Research Foundation (NRF) of South Africa (Grant No 346
64787), NRF incentive funding (UID: 85858) and the South African Medical 347
Research Council through its TB and HIV Collaborating Centres Programme with 348
funds received from the National Department of Health (RFA# SAMRC-RFA-CC: 349
TB/HIV/AIDS-01-2014). Helen McIlleron was supported in part by the NRF of South 350
Africa [grant 90729]. 351
The funders had no role in the study design, data collection, data analysis, data 352
interpretation, or writing of this report. The opinions, findings and conclusions 353
expressed in this manuscript reflect those of the authors alone. 354
Acknowledgements 355
We wish to acknowledge the National Institute of Allergy and Infectious Diseases 356
(NIAID) who support the overall running of the analytical laboratory at the 357
department of Clinical Pharmacology, University of Cape Town through award 358
numbers UM1 AI068634, UM1 AI068636, UM1 AI106701 and U01 AI068632. The 359
Division of Clinical Pharmacology at the University of Cape Town would like to 360
gracefully acknowledge Novartis Pharma for their support of the development of 361
pharmacometrics skills in Africa. 362
Author Contributions 363
NR, HM, RJW and GM conceived and designed the experiments; RJW contributed 364
materials and reagents; NR recruited, sampled and collected data from patients; LW 365
did the LC-MS work; NR, PD, MC and HM analysed the data; NR, PD, GM, HM and 366
on April 13, 2018 by guest
http://aac.asm.org/
Dow
nloaded from
17
RJW contributed intellectual input; NR, PD, HM, GM and RJW drafted the 367
manuscript; all authors approved the final version of the manuscript. 368
Conflict of Interest Statement 369
No author declares a conflict of interest.370
on April 13, 2018 by guest
http://aac.asm.org/
Dow
nloaded from
18
REFERENCES 371
1. World Health Organization. 2015. Global Tuberculosis Report 2015. 372 http://www.who.int/tb/publications/global_report/gtbr2015_executive_summary373 .pdf?ua=1. Accessed 28/12/2015. 374
2. World Health Organisation. 2010. Treatment of tuberculosis guidelines. 375 Fourth edition. 376 http://apps.who.int/iris/bitstream/10665/44165/1/9789241547833_eng.pdf?ua377 =1&ua=1. Accessed 28/12/2015. 378
3. Parkin DP, Vandenplas S, Botha FJ, Vandenplas ML, Seifart HI, van 379 Helden PD, van der Walt BJ, Donald PR, van Jaarsveld PP. 1997. 380 Trimodality of isoniazid elimination: phenotype and genotype in patients with 381 tuberculosis. Am J Respir Crit Care Med 155:1717-1722. 382
4. Chigutsa E, Visser ME, Swart EC, Denti P, Pushpakom S, Egan D, 383 Holford NH, Smith PJ, Maartens G, Owen A, McIlleron H. 2011. The 384 SLCO1B1 rs4149032 polymorphism is highly prevalent in South Africans and 385 is associated with reduced rifampin concentrations: dosing implications. 386 Antimicrob Agents Chemother 55:4122-4127. 387
5. Requena-Mendez A, Davies G, Ardrey A, Jave O, Lopez-Romero SL, 388 Ward SA, Moore DA. 2012. Pharmacokinetics of rifampin in Peruvian 389 tuberculosis patients with and without comorbid diabetes or HIV. Antimicrob 390 Agents Chemother 56:2357-2363. 391
6. McIlleron H, Rustomjee R, Vahedi M, Mthiyane T, Denti P, Connolly C, 392 Rida W, Pym A, Smith PJ, Onyebujoh PC. 2012. Reduced antituberculosis 393 drug concentrations in HIV-infected patients who are men or have low weight: 394 implications for international dosing guidelines. Antimicrob Agents Chemother 395 56:3232-3238. 396
7. Nijland HM, Ruslami R, Stalenhoef JE, Nelwan EJ, Alisjahbana B, Nelwan 397 RH, van der Ven AJ, Danusantoso H, Aarnoutse RE, van Crevel R. 2006. 398 Exposure to rifampicin is strongly reduced in patients with tuberculosis and 399 type 2 diabetes. Clin Infect Dis 43:848-854. 400
8. Ruslami R, Nijland HM, Adhiarta IG, Kariadi SH, Alisjahbana B, 401 Aarnoutse RE, van Crevel R. 2010. Pharmacokinetics of antituberculosis 402 drugs in pulmonary tuberculosis patients with type 2 diabetes. Antimicrob 403 Agents Chemother 54:1068-1074. 404
9. Babalik A, Ulus IH, Bakirci N, Kuyucu T, Arpag H, Dagyildizi L, Capaner 405 E. 2013. Plasma concentrations of isoniazid and rifampin are decreased in 406 adult pulmonary tuberculosis patients with diabetes mellitus. Antimicrob 407 Agents Chemother 57:5740-5742. 408
10. Chideya S, Winston CA, Peloquin CA, Bradford WZ, Hopewell PC, Wells 409 CD, Reingold AL, Kenyon TA, Moeti TL, Tappero JW. 2009. Isoniazid, 410 rifampin, ethambutol, and pyrazinamide pharmacokinetics and treatment 411 outcomes among a predominantly HIV-infected cohort of adults with 412 tuberculosis from Botswana. Clin Infect Dis 48:1685-1694. 413
11. Sahai J, Gallicano K, Swick L, Tailor S, Garber G, Seguin I, Oliveras L, 414 Walker S, Rachlis A, Cameron DW. 1997. Reduced plasma concentrations 415 of antituberculosis drugs in patients with HIV infection. Ann Intern Med 416 127:289-293. 417
12. Jeremiah K, Denti P, Chigutsa E, Faurholt-Jepsen D, PrayGod G, Range 418 N, Castel S, Wiesner L, Hagen CM, Christiansen M, Changalucha J, 419
on April 13, 2018 by guest
http://aac.asm.org/
Dow
nloaded from
19
McIlleron H, Friis H, Andersen AB. 2014. Nutritional supplementation 420 increases rifampin exposure among tuberculosis patients coinfected with HIV. 421 Antimicrob Agents Chemother 58:3468-3474. 422
13. Tappero JW, Bradford WZ, Agerton TB, Hopewell P, Reingold AL, 423 Lockman S, Oyewo A, Talbot EA, Kenyon TA, Moeti TL, Moffat HJ, 424 Peloquin CA. 2005. Serum concentrations of antimycobacterial drugs in 425 patients with pulmonary tuberculosis in Botswana. Clin Infect Dis 41:461-469. 426
14. Taylor IK, Evans DJ, Coker RJ, Mitchell DM, Shaw RJ. 1995. 427 Mycobacterial Infection in Hiv-Seropositive and Seronegative Populations, 428 1987-93. Thorax 50:1147-1150. 429
15. Choudhri SH, Hawken M, Gathua S, Minyiri GO, Watkins W, Sahai J, Sitar 430 DS, Aoki FY, Long R. 1997. Pharmacokinetics of antimycobacterial drugs in 431 patients with tuberculosis, AIDS, and diarrhea. Clin Infect Dis 25:104-111. 432
16. Mitchison DA. 2000. Role of individual drugs in the chemotherapy of 433 tuberculosis. Int J Tuberc lung Dis 4:796-806. 434
17. US Department of Health and Human Services NIoH, National Cancer 435 Institute,. 2009. Common Terminology Criteria for Adverse Events (CTCAE) 436 version 4. http://evs.nci.nih.gov/ftp1/CTCAE/CTCAE_4.03_2010-06-437 14_QuickReference_8.5x11.pdf. Accessed Accessed 28/12/2015. 438
18. World Health Organisation. The use of the WHO-UMC system for 439 standardised case causality assessment. 440 http://www.who.int/medicines/areas/quality_safety/safety_efficacy/WHOcausal441 ity_assessment.pdf. Accessed 28/12/2015. 442
19. Lv X, Tang S, Xia Y, Wang X, Yuan Y, Hu D, Liu F, Wu S, Zhang Y, Yang 443 Z, Tu D, Chen Y, Deng P, Ma Y, Chen R, Zhan S. 2013. Adverse reactions 444 due to directly observed treatment strategy therapy in Chinese tuberculosis 445 patients: a prospective study. PLoS One 8:e65037. 446
20. Forget EJ, Menzies D. 2006. Adverse reactions to first-line antituberculosis 447 drugs. Expert Opin Drug Saf 5:231-249. 448
21. Vieira DE, Gomes M. 2008. Adverse effects of tuberculosis treatment: 449 experience at an outpatient clinic of a teaching hospital in the city of Sao 450 Paulo, Brazil. J Bras Pneumol 34:1049-1055. 451
22. Awofeso N. 2008. Anti-tuberculosis medication side-effects constitute major 452 factor for poor adherence to tuberculosis treatment. Bull World Health Organ 453 86:B-D. 454
23. Kwara A, Enimil A, Gillani FS, Yang H, Sarfo AM, Dompreh A, Ortsin A, 455 Osei-Tutu L, Kwarteng Owusu S, Wiesner L, Norman J, Kurpewski J, 456 Peloquin CA, Ansong D, Antwi S. 2015. Pharmacokinetics of First-Line 457 Antituberculosis Drugs Using WHO Revised Dosage in Children With 458 Tuberculosis With and Without HIV Coinfection. J Pediatric Infect Dis Soc 459 doi:10.1093/jpids/piv035. 460
24. Monolix. http://www.lixoft.com/products/monolix. Accessed 28/12/2015. 461 25. Wilkins JJ, Savic RM, Karlsson MO, Langdon G, McIlleron H, Pillai G, 462
Smith PJ, Simonsson US. 2008. Population pharmacokinetics of rifampin in 463 pulmonary tuberculosis patients, including a semimechanistic model to 464 describe variable absorption. Antimicrob Agents Chemother 52:2138-2148. 465
26. Wilkins JJ, Langdon G, McIlleron H, Pillai G, Smith PJ, Simonsson US. 466 2011. Variability in the population pharmacokinetics of isoniazid in South 467 African tuberculosis patients. Br J Clin Pharmacol 72:51-62. 468
on April 13, 2018 by guest
http://aac.asm.org/
Dow
nloaded from
20
27. Wilkins JJ, Langdon G, McIlleron H, Pillai GC, Smith PJ, Simonsson US. 469 2006. Variability in the population pharmacokinetics of pyrazinamide in South 470 African tuberculosis patients. Eur J Clin Pharmacol 62:727-735. 471
28. Bergstrand M, Karlsson MO. 2009. Handling data below the limit of 472 quantification in mixed effect models. AAPS J 11:371-380. 473
29. Holford NH. 1996. A size standard for pharmacokinetics. Clin Pharmacokinet 474 30:329-332. 475
30. Anderson BJ, Holford NH. 2008. Mechanism-based concepts of size and 476 maturity in pharmacokinetics. Annu Rev Pharmacol Toxicol 48:303-332. 477
31. Janmahasatian S, Duffull SB, Ash S, Ward LC, Byrne NM, Green B. 2005. 478 Quantification of lean bodyweight. Clin Pharmacokinet 44:1051-1065. 479
32. Lavielle M. 2015. mlxR: Simulation of longitudinal data. https://cran.r-480 project.org/web/packages/mlxR/index.html. Accessed 28/12/2015. 481
33. Savic RM, Karlsson MO. 2009. Importance of shrinkage in empirical bayes 482 estimates for diagnostics: problems and solutions. AAPS J 11:558-569. 483
34. Peloquin CA. 2002. Therapeutic drug monitoring in the treatment of 484 tuberculosis. Drugs 62:2169-2183. 485
35. Pasipanodya JG, McIlleron H, Burger A, Wash PA, Smith P, Gumbo T. 486 2013. Serum Drug Concentrations Predictive of Pulmonary Tuberculosis 487 Outcomes. J Infect Dis 208:1464-1473. 488
36. Chigutsa E, Pasipanodya JG, Visser ME, van Helden PD, Smith PJ, 489 Sirgel FA, Gumbo T, McIlleron H. 2015. Impact of nonlinear interactions of 490 pharmacokinetics and MICs on sputum bacillary kill rates as a marker of 491 sterilizing effect in tuberculosis. Antimicrob Agents Chemother 59:38-45. 492
37. Burhan E, Ruesen C, Ruslami R, Ginanjar A, Mangunnegoro H, Ascobat 493 P, Donders R, van Crevel R, Aarnoutse R. 2013. Isoniazid, rifampin, and 494 pyrazinamide plasma concentrations in relation to treatment response in 495 Indonesian pulmonary tuberculosis patients. Antimicrob Agents Chemother 496 57:3614-3619. 497
38. Babalik A, Ulus IH, Bakirci N, Kuyucu T, Arpag H, Dagyildiz L, Carpaner 498 E. 2013. Pharmacokinetics and serum concentrations of antimycobacterial 499 drugs in adult Turkish patients. Int J Tuberc Lung Dis 17:1442-1447. 500
39. Tostmann A, Mtabho CM, Semvua HH, van den Boogaard J, Kibiki GS, 501 Boeree MJ, Aarnoutse RE. 2013. Pharmacokinetics of first-line tuberculosis 502 drugs in Tanzanian patients. Antimicrob Agents Chemother 57:3208-3213. 503
40. Gurumurthy P, Ramachandran G, Hemanth Kumar AK, Rajasekaran S, 504 Padmapriyadarsini C, Swaminathan S, Venkatesan P, Sekar L, Kumar S, 505 Krishnarajasekhar OR, Paramesh P. 2004. Malabsorption of rifampin and 506 isoniazid in HIV-infected patients with and without tuberculosis. Clin infec Dis 507 38:280-283. 508
41. Gurumurthy P, Ramachandran G, Hemanth Kumar AK, Rajasekaran S, 509 Padmapriyadarsini C, Swaminathan S, Bhagavathy S, Venkatesan P, 510 Sekar L, Mahilmaran A, Ravichandran N, Paramesh P. 2004. Decreased 511 bioavailability of rifampin and other antituberculosis drugs in patients with 512 advanced human immunodeficiency virus disease. Antimicrob Agents 513 Chemother 48:4473-4475. 514
42. Taylor B, Smith PJ. 1998. Does AIDS impair the absorption of 515 antituberculosis agents? Int J Tuberc Lung Dis 2:670-675. 516
43. Zhu M, Starke JR, Burman WJ, Steiner P, Stambaugh JJ, Ashkin D, 517 Bulpitt AE, Berning SE, Peloquin CA. 2002. Population pharmacokinetic 518
on April 13, 2018 by guest
http://aac.asm.org/
Dow
nloaded from
21
modeling of pyrazinamide in children and adults with tuberculosis. 519 Pharmacotherapy 22:686-695. 520
44. Niemi M, Pasanen MK, Neuvonen PJ. 2011. Organic anion transporting 521 polypeptide 1B1: a genetically polymorphic transporter of major importance 522 for hepatic drug uptake. Pharmacol Rev 63:157-181. 523
45. Alarcon-Segovia D, Fishbein E, Alcala H. 1971. Isoniazid acetylation rate 524 and development of antinuclear antibodies upon isoniazid treatment. Arthritis 525 Rheum 14:748-752. 526
46. Azuma J, Ohno M, Kubota R, Yokota S, Nagai T, Tsuyuguchi K, Okuda Y, 527 Takashima T, Kamimura S, Fujio Y, Kawase I, Pharmacogenetics-based 528 tuberculosis therapy research g. 2013. NAT2 genotype guided regimen 529 reduces isoniazid-induced liver injury and early treatment failure in the 6-530 month four-drug standard treatment of tuberculosis: a randomized controlled 531 trial for pharmacogenetics-based therapy. Eur J Clin Pharmacol 69:1091-532 1101. 533
534
on April 13, 2018 by guest
http://aac.asm.org/
Dow
nloaded from
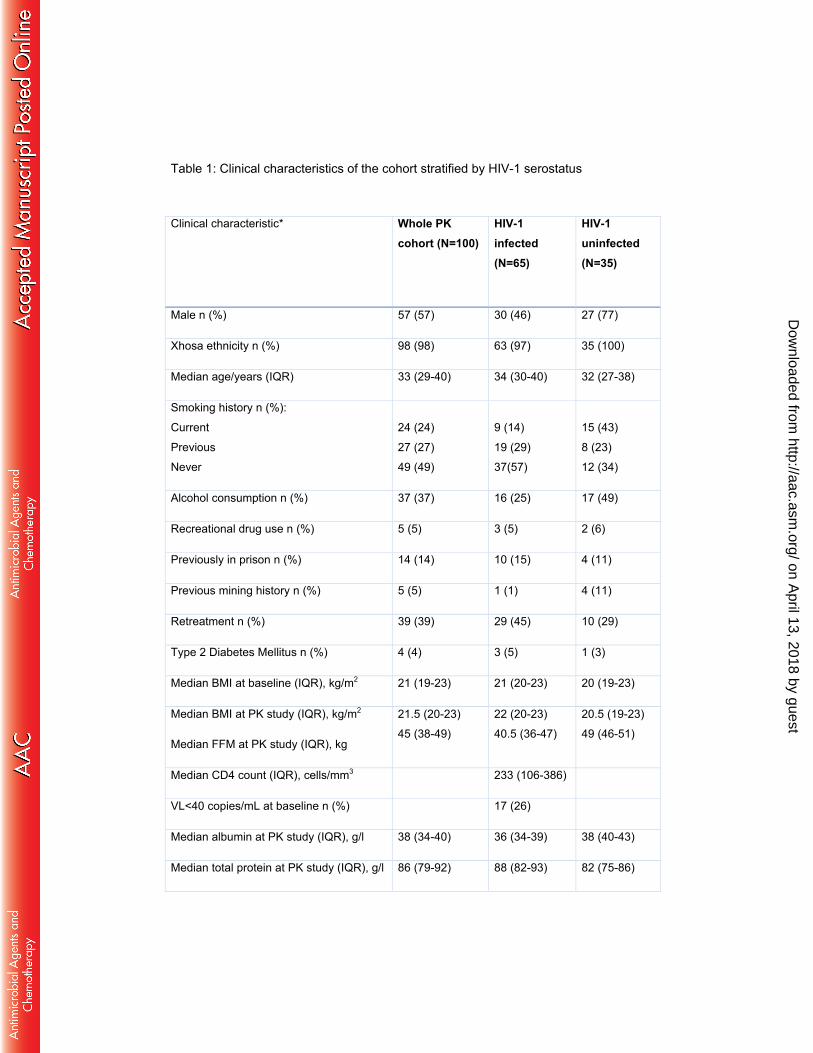
Table 1: Clinical characteristics of the cohort stratified by HIV-1 serostatus
Clinical characteristic* Whole PK
cohort (N=100)
HIV-1 infected (N=65)
HIV-1 uninfected (N=35)
Male n (%) 57 (57) 30 (46) 27 (77)
Xhosa ethnicity n (%) 98 (98) 63 (97) 35 (100)
Median age/years (IQR) 33 (29-40) 34 (30-40) 32 (27-38)
Smoking history n (%):
Current
Previous
Never
24 (24)
27 (27)
49 (49)
9 (14)
19 (29)
37(57)
15 (43)
8 (23)
12 (34)
Alcohol consumption n (%) 37 (37) 16 (25) 17 (49)
Recreational drug use n (%) 5 (5) 3 (5) 2 (6)
Previously in prison n (%) 14 (14) 10 (15) 4 (11)
Previous mining history n (%) 5 (5) 1 (1) 4 (11)
Retreatment n (%) 39 (39) 29 (45) 10 (29)
Type 2 Diabetes Mellitus n (%) 4 (4) 3 (5) 1 (3)
Median BMI at baseline (IQR), kg/m2 21 (19-23) 21 (20-23) 20 (19-23)
Median BMI at PK study (IQR), kg/m2
Median FFM at PK study (IQR), kg
21.5 (20-23)
45 (38-49)
22 (20-23)
40.5 (36-47)
20.5 (19-23)
49 (46-51)
Median CD4 count (IQR), cells/mm3 233 (106-386)
VL<40 copies/mL at baseline n (%) 17 (26)
Median albumin at PK study (IQR), g/l 38 (34-40) 36 (34-39) 38 (40-43)
Median total protein at PK study (IQR), g/l 86 (79-92) 88 (82-93) 82 (75-86)
on April 13, 2018 by guest
http://aac.asm.org/
Dow
nloaded from
Characteristics are reported at time of diagnosis (baseline) unless otherwise
specified (at PK visit or 2-month visit)
Abbreviations: BMI body mass index, FFM fat-free mass, ART antiretroviral therapy,
PK pharmacokinetic,
Months on ART at time of PK study (IQR) 1.32 (0-15.5)
Smear grading at baseline n (%):
3+
2+
1+
Scanty/negative
24 (24)
22 (22)
20 (20)
34 (34)
14 (21.5)
11 (17)
14 (21.5)
26 (40)
10 (29)
11 (31)
6 (17)
8 (23)
Median baseline time to culture positivity
/days (IQR)
10 (7-14) 12 (7-15) 8 (6.5-12.5)
Extensive radiological disease at baseline
n (%) 71 (71) 41 (63) 30 (86)
Cavities at baseline n (%) 52 (52) 32 (49) 20 (57)
mg/kg dose at PK study (range):
Rifampicin
Isoniazid
Pyrazinamide
10 (7-11.5)
5 (3.5-6)
26 (19-31)
10 (7-11.5)
5 (4-6)
26 (20-31)
10 (7-11.5)
5 (3.5-6)
25.5 (19-31)
Number of patients with side-effects of
tuberculosis treatment (%) 35 (35) 25 (38) 10 (29)
Poorly adherent as per pill counts/self-
report at 2-month review n (%) 10 (10) 8 (12) 2 (6)
on April 13, 2018 by guest
http://aac.asm.org/
Dow
nloaded from
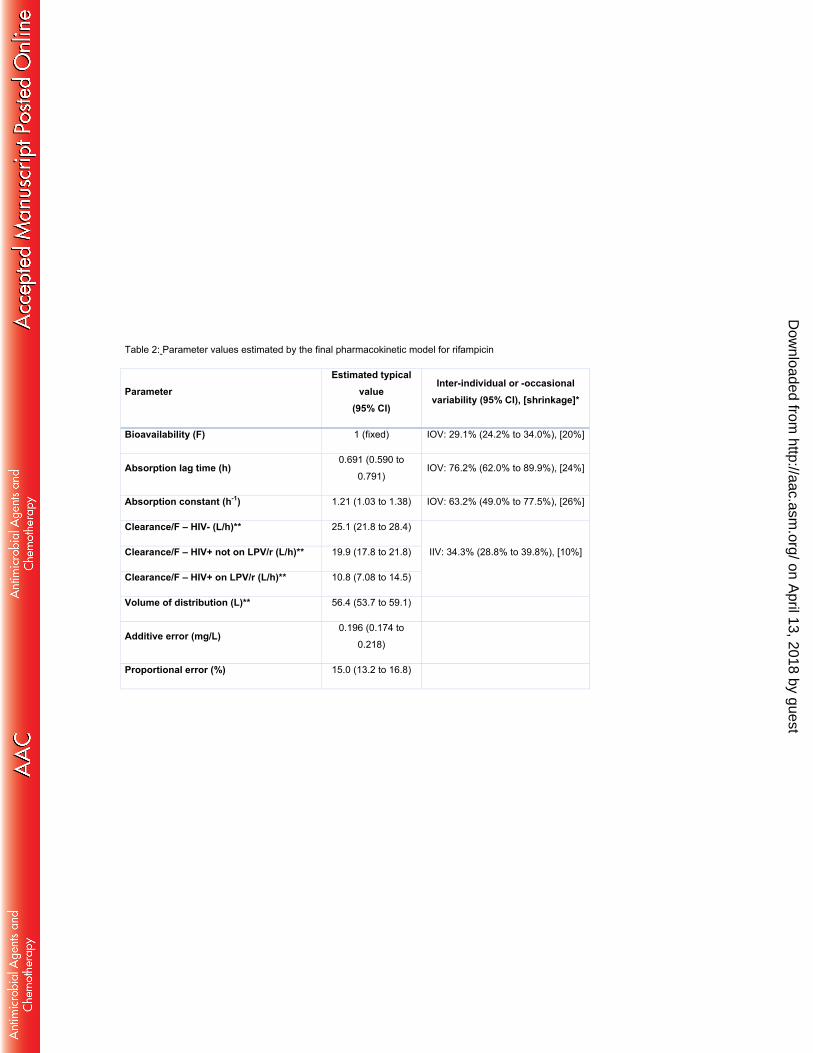
Table 2: Parameter values estimated by the final pharmacokinetic model for rifampicin
Parameter Estimated typical
value (95% CI)
Inter-individual or -occasional variability (95% CI), [shrinkage]*
Bioavailability (F) 1 (fixed) IOV: 29.1% (24.2% to 34.0%), [20%]
Absorption lag time (h) 0.691 (0.590 to
0.791) IOV: 76.2% (62.0% to 89.9%), [24%]
Absorption constant (h-1) 1.21 (1.03 to 1.38) IOV: 63.2% (49.0% to 77.5%), [26%]
Clearance/F – HIV- (L/h)** 25.1 (21.8 to 28.4)
IIV: 34.3% (28.8% to 39.8%), [10%] Clearance/F – HIV+ not on LPV/r (L/h)** 19.9 (17.8 to 21.8)
Clearance/F – HIV+ on LPV/r (L/h)** 10.8 (7.08 to 14.5)
Volume of distribution (L)** 56.4 (53.7 to 59.1)
Additive error (mg/L) 0.196 (0.174 to
0.218)
Proportional error (%) 15.0 (13.2 to 16.8)
on April 13, 2018 by guest
http://aac.asm.org/
Dow
nloaded from
*Inter-individual and –occasional variability were assumed log normally distributed and are reported here as approximate %CV. For
Inter-occasional variability terms, the shrinkage is reported only for the occasion with intensive sampling (not the pre-dose).
**Clearance and volume of distribution have been allometrically scaled using individual values of fat-free mass (FFM), so the typical
values reported here refer to the median value of FFM in the cohort, 45 kg (e.g. a 1.7 m tall man weighing 51 kg)
Abbreviations: F bioavailability, HIV+/HIV- HIV-1-infected/uninfected, IIV Inter-individual variability, IOV inter-occasional variability,
LPV/r lopinavir/ritonavir
on April 13, 2018 by guest
http://aac.asm.org/
Dow
nloaded from
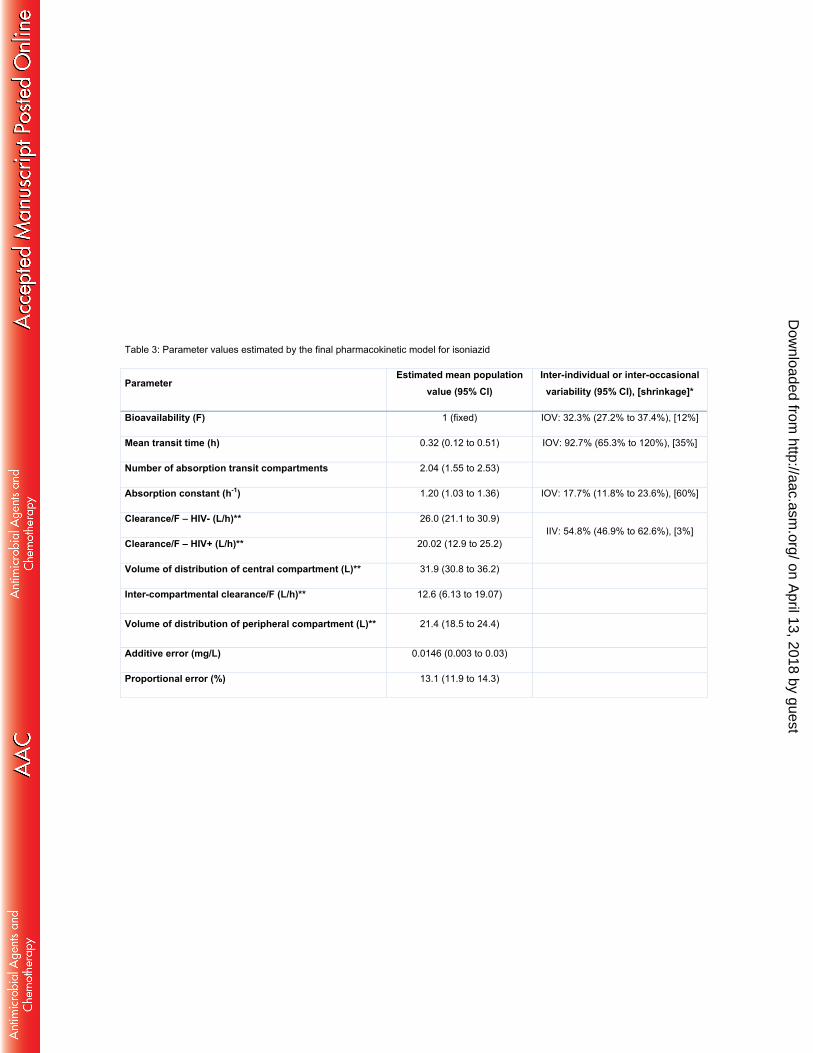
Table 3: Parameter values estimated by the final pharmacokinetic model for isoniazid
Parameter Estimated mean population
value (95% CI) Inter-individual or inter-occasional
variability (95% CI), [shrinkage]*
Bioavailability (F) 1 (fixed) IOV: 32.3% (27.2% to 37.4%), [12%]
Mean transit time (h) 0.32 (0.12 to 0.51) IOV: 92.7% (65.3% to 120%), [35%]
Number of absorption transit compartments 2.04 (1.55 to 2.53)
Absorption constant (h-1) 1.20 (1.03 to 1.36) IOV: 17.7% (11.8% to 23.6%), [60%]
Clearance/F – HIV- (L/h)** 26.0 (21.1 to 30.9) IIV: 54.8% (46.9% to 62.6%), [3%]
Clearance/F – HIV+ (L/h)** 20.02 (12.9 to 25.2)
Volume of distribution of central compartment (L)** 31.9 (30.8 to 36.2)
Inter-compartmental clearance/F (L/h)** 12.6 (6.13 to 19.07)
Volume of distribution of peripheral compartment (L)** 21.4 (18.5 to 24.4)
Additive error (mg/L) 0.0146 (0.003 to 0.03)
Proportional error (%) 13.1 (11.9 to 14.3)
on April 13, 2018 by guest
http://aac.asm.org/
Dow
nloaded from
*Inter-individual and –occasional variability were assumed log normally distributed and are reported here as approximate %CV. For
Inter-occasional variability terms, the shrinkage is reported only for the occasion with intensive sampling (not the pre-dose).
**All clearance and volume parameters have been allometrically scaled using individual values of fat-free mass (FFM), so the
typical values reported here refer to the median value of FFM in the cohort, 45 kg (e.g. a 1.7 m tall man weighing 51 kg)
Abbreviations: F bioavailability, HIV+/HIV- HIV-1-infected/uninfected, IIV Inter-individual variability, IOV inter-occasional variability
on April 13, 2018 by guest
http://aac.asm.org/
Dow
nloaded from
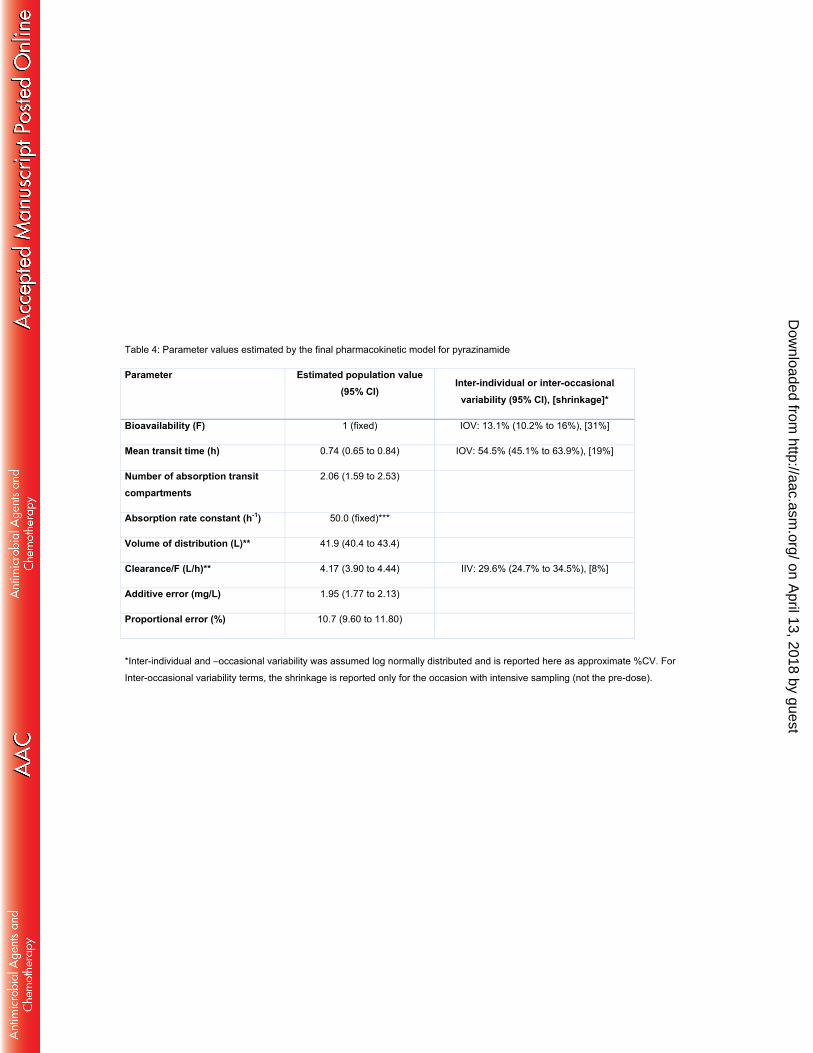
Table 4: Parameter values estimated by the final pharmacokinetic model for pyrazinamide
Parameter Estimated population value (95% CI)
Inter-individual or inter-occasional variability (95% CI), [shrinkage]*
Bioavailability (F) 1 (fixed) IOV: 13.1% (10.2% to 16%), [31%]
Mean transit time (h) 0.74 (0.65 to 0.84) IOV: 54.5% (45.1% to 63.9%), [19%]
Number of absorption transit compartments
2.06 (1.59 to 2.53)
Absorption rate constant (h-1) 50.0 (fixed)***
Volume of distribution (L)** 41.9 (40.4 to 43.4)
Clearance/F (L/h)** 4.17 (3.90 to 4.44) IIV: 29.6% (24.7% to 34.5%), [8%]
Additive error (mg/L) 1.95 (1.77 to 2.13)
Proportional error (%) 10.7 (9.60 to 11.80)
*Inter-individual and –occasional variability was assumed log normally distributed and is reported here as approximate %CV. For
Inter-occasional variability terms, the shrinkage is reported only for the occasion with intensive sampling (not the pre-dose).
on April 13, 2018 by guest
http://aac.asm.org/
Dow
nloaded from
**All clearance and volume parameters have been allometrically scaled using individual values of fat-free mass (FFM), so the
typical values reported here refer to the median value of FFM in the cohort, 45 kg (e.g. a 1.7 m tall man weighing 51 kg)
***The model estimated a very large value of absorption constant, so it was fixed to 50 to stabilise the model without significantly
affecting the fit.
Abbreviations: F bioavailability IIV Inter-individual variability, IOV inter-occasional variability
on April 13, 2018 by guest
http://aac.asm.org/
Dow
nloaded from
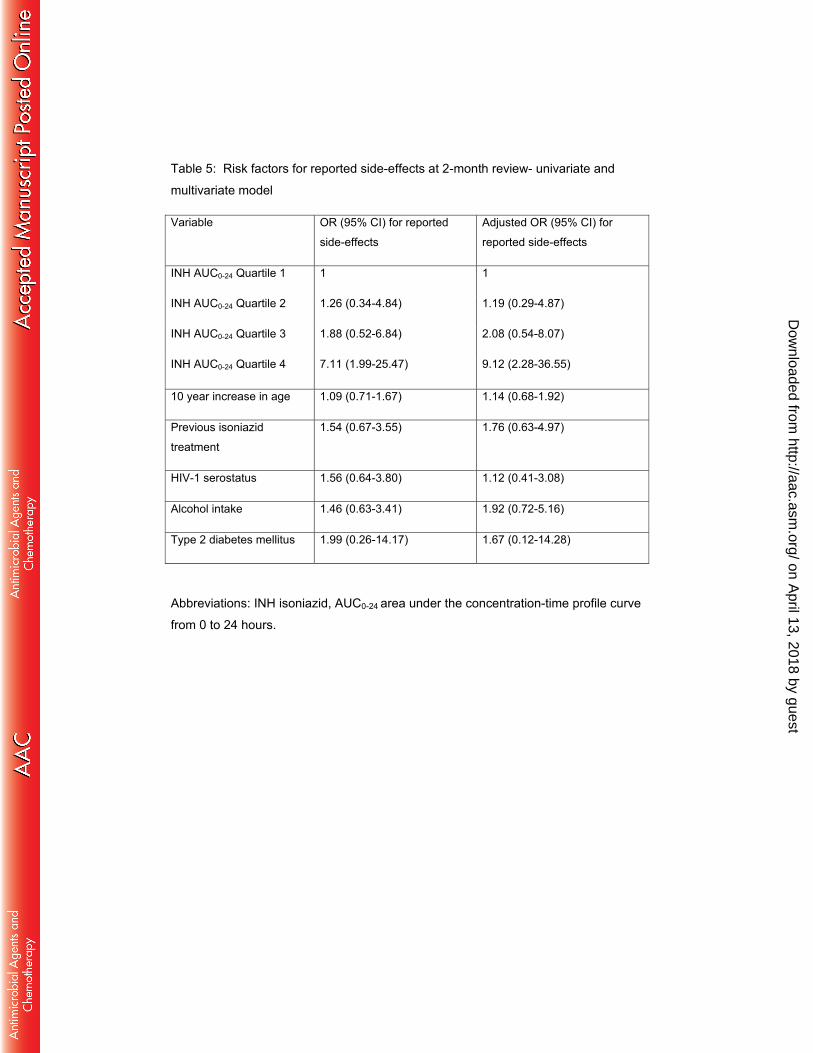
Table 5: Risk factors for reported side-effects at 2-month review- univariate and
multivariate model
Variable OR (95% CI) for reported
side-effects
Adjusted OR (95% CI) for
reported side-effects
INH AUC0-24 Quartile 1
INH AUC0-24 Quartile 2
INH AUC0-24 Quartile 3
INH AUC0-24 Quartile 4
1
1.26 (0.34-4.84)
1.88 (0.52-6.84)
7.11 (1.99-25.47)
1
1.19 (0.29-4.87)
2.08 (0.54-8.07)
9.12 (2.28-36.55)
10 year increase in age 1.09 (0.71-1.67) 1.14 (0.68-1.92)
Previous isoniazid
treatment
1.54 (0.67-3.55) 1.76 (0.63-4.97)
HIV-1 serostatus 1.56 (0.64-3.80) 1.12 (0.41-3.08)
Alcohol intake 1.46 (0.63-3.41) 1.92 (0.72-5.16)
Type 2 diabetes mellitus 1.99 (0.26-14.17) 1.67 (0.12-14.28)
Abbreviations: INH isoniazid, AUC0-24 area under the concentration-time profile curve
from 0 to 24 hours.
on April 13, 2018 by guest
http://aac.asm.org/
Dow
nloaded from
Figure 1A: Visual predictive check for rifampicin concentration versus time, stratified
by HIV-1 serostatus and co-administration of Lopinavir/ritonavir (LPV/r)
The blue dots are observed concentrations, while the red dots are simulation-based
values below the limit of quantification (BLQ). Lines are 10th, 50th, and 90th percentile
of observed data, while the shaded areas represent the 90% confidence intervals for
the same percentiles, as predicted by the model.
on April 13, 2018 by guest
http://aac.asm.org/
Dow
nloaded from
Figure 1B: Visual predictive check for isoniazid concentration versus time, stratified
by HIV-1 serostatus
The blue dots are observed concentrations, while the red dots are simulation-based
values below the limit of quantification (BLQ). Lines are 10th, 50th, and 90th percentile
of observed data, while the shaded areas represent the 90% confidence intervals for
the same percentiles, as predicted by the model.
on April 13, 2018 by guest
http://aac.asm.org/
Dow
nloaded from
Figure 1C: Visual predictive check for pyrazinamide concentration versus time
The blue dots are observed concentrations, while the red dots are simulation-based
values below the limit of quantification (BLQ). Lines are 10th, 50th, and 90th percentile
of observed data, while the shaded areas represent the 90% confidence intervals for
the same percentiles, as predicted by the model.
on April 13, 2018 by guest
http://aac.asm.org/
Dow
nloaded from
Figure 2: Pharmacokinetic measures Cmax and AUC0-24 stratified by HIV serostatus
and antiretroviral therapy regimen
The box and whisker plots show model derived PK measures. Cmax and AUC0-24 are
plotted on the left and right y-axes. The boxes show median and interquartile range.
The whiskers represent the 5th to 95th percentiles and illustrate variability in both HIV-
1 infected (+) and HIV-1 uninfected (-) patients and different antiretroviral therapy
categories. Patients on inhibitors appear to have higher rifampicin AUC0-24 compared
with ‘No ART’ and NNRTI based’ categories
The dotted black line indicates current recommended thresholds for Cmax of 3 mg/L,
8 mg/L and 30 mg/L for isoniazid, rifampicin and pyrazinamide respectively.
No tests for statistical significance were run to generate p-values on these post-hoc
individual estimates, as these reported individual values are based on the population
PK models and are hence inter-dependent. Significance of the respective covariate
effects were tested within the model (table 2-4).
Abbreviations: ART antiretroviral therapy, NNRTI non-nucleoside reverse
transcriptase inhibitor, PI protease inhibitor, Cmax maximum concentration, AUC area
under curve from 0 to 24 hours on April 13, 2018 by guest
http://aac.asm.org/
Dow
nloaded from
Figure 3: Pharmacokinetic measures Cmax and AUC0-24, respectively stratified by
WHO weight band
The box and whisker plots show model derived PK measures stratified by WHO
weight band. Cmax and AUC0-24 are plotted on the left and right y-axes. The boxes
show median and interquartile range. The whiskers represent the 5th to 95th
percentiles. The predictions include allometric scaling which is necessary to account
for the nonlinear differences by weight/size. This explains differences in PK
measures -in spite of same mg/kg dosing by weight band.
The dotted black line indicates current recommended thresholds for Cmax of 3 mg/L,
8 mg/L and 30 mg/L for isoniazid, rifampicin and pyrazinamide respectively
Abbreviations: Cmax maximum concentration, AUC area under curve from 0 to 24
hours, WB weight band
on April 13, 2018 by guest
http://aac.asm.org/
Dow
nloaded from
Figure 4: Pharmacokinetic measures Cmax and AUC0-24 stratified by side-effect
profile
The upper 3 graphs show Cmax on the left axis and AUC0-24 on the right y-axis,
stratified by presence or absence of drug side-effects. The bottom 3 graphs detail
drug peak concentrations in those with (+) and without (-) CNS, PNS, MS, skin
and GI side-effects
Abbreviations: Cmax peak concentration, AUC 0-24, SE side-effects, CNS central
nervous system, PNS peripheral nervous system, MS musculoskeletal system,
GI gastrointestinal
on April 13, 2018 by guest
http://aac.asm.org/
Dow
nloaded from