Embed Size (px)
Citation preview

Hitachi VSP Array with HAF FLASH Performance of the Hitachi VSP HAF Flash Product - Benchmark + in Production Analysis
Mark Weber, Optum Technology
September 25, 2014
Confidential property of Optum. Do not distribute or reproduce without express permission from Optum. 2
About the Presenter, Context, and Disclaimers
• IT 20 years, lots of storage performance.
• In CMG since the mid 90’s.
• User West Publishing, vendor at Xiotech, user at Optum
• This doc is detail-level from the trenches and is about supporting storage more than
it is about inventing strategy.
• Specific interest in simple and functional no-nonsense solutions that solve
problems.
• Presentation is built around a managed services environment; not HPC, not special
anything. My group provides the most PB to the most users at an acceptable
performance level with the smallest amount of people.
• Cant split hairs over a few hundred microseconds:1.3ms,1ms, .75ms – its all
good.
• Ask questions as we go
Confidential property of Optum. Do not distribute or reproduce without express permission from Optum. 3
Hitachi Adds All-FLASH Storage Module
Hitachi’s all FLASH module is called Hitachi Accelerated
Flash (HAF).
HAF is MLC FLASH on a Flash Module Drive (i.e. like a
“disk”)
HAF is fully integrated into Hitachi VSP storage array
functions: • Management tool support
• Monitoring support.
• Use as standard basic LDEVs or integrates seamlessly into Hitachi Dynamic Pooling / Hitachi
Dynamic Tiering (HDP / HDT) as VVOLs.
• Full RAID level support across FMDs.
Full feature support, add to pool, shrink from pool, assign to tier, etc.
Can use Hitachi FLASH Acceleration Code (FA) to enhance FLASH performance.

Confidential property of Optum. Do not distribute or reproduce without express permission from Optum. 4
HAF test Configuration
• 2 DKC Hitachi VSP array, 8 VSDs
• 512 GB array Cache
• 16 x 1.6TB HAF cards, RAID6(16+2)
• 12 x 200GB SLC SSD drives, RAID5(3+1)
• 136 x 10K SAS in a Hitachi Dynamic Pool (HDP), RAID6(6+2)
• 8Gb connected servers
• 2 x dual port Brocade 16Gb adapters
• Brocade switch
Confidential property of Optum. Do not distribute or reproduce without express permission from Optum. 5
64K Rnd Read Response Time: HAF vs Spinning Disk
Random read is the quintessential workload that FLASH solves. This is 64K random read test.
Under the exact same load at the lower queue depths the HAF is netting out 1000% more IO than
spinning 10K disk (in RAID6, HDP) at 10% of the response time. Under deeper queue depths 550%
more IOPS from HAF.
NOTE THAT under the deeper queue testing the HAF was pushing 2,900 MB/sec on 4 x 8Gb HBAs, so
about max MB/sec for the server ports.
Confidential property of Optum. Do not distribute or reproduce without express permission from Optum. 6
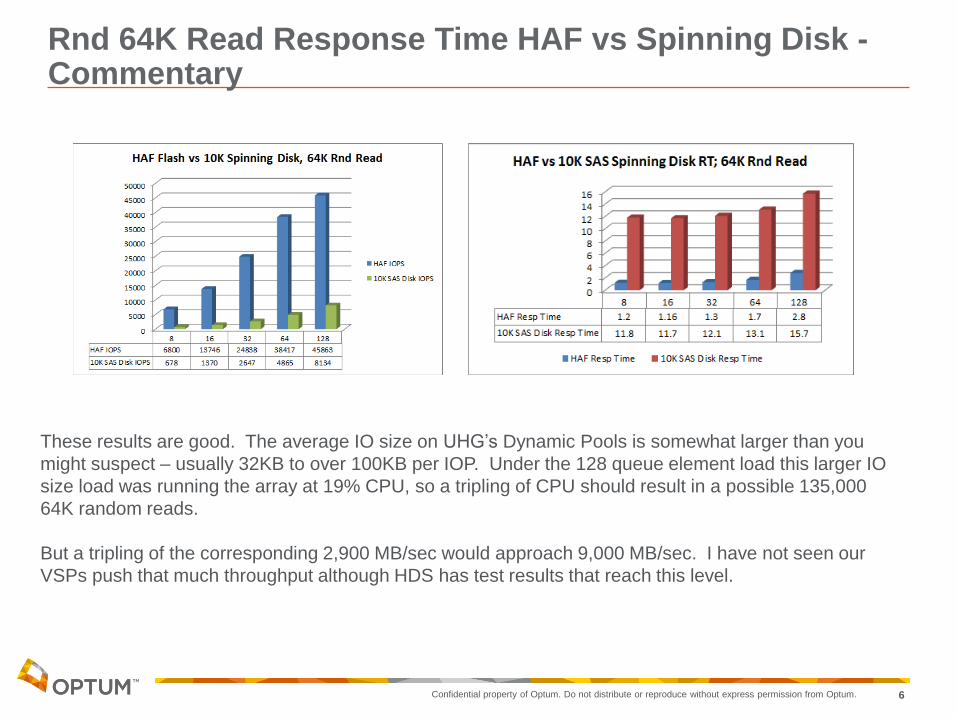
Rnd 64K Read Response Time HAF vs Spinning Disk - Commentary
These results are good. The average IO size on UHG’s Dynamic Pools is somewhat larger than you
might suspect – usually 32KB to over 100KB per IOP. Under the 128 queue element load this larger IO
size load was running the array at 19% CPU, so a tripling of CPU should result in a possible 135,000
64K random reads.
But a tripling of the corresponding 2,900 MB/sec would approach 9,000 MB/sec. I have not seen our
VSPs push that much throughput although HDS has test results that reach this level.
Confidential property of Optum. Do not distribute or reproduce without express permission from Optum. 7
Rnd 64K Write HAF vs Spinning Disk
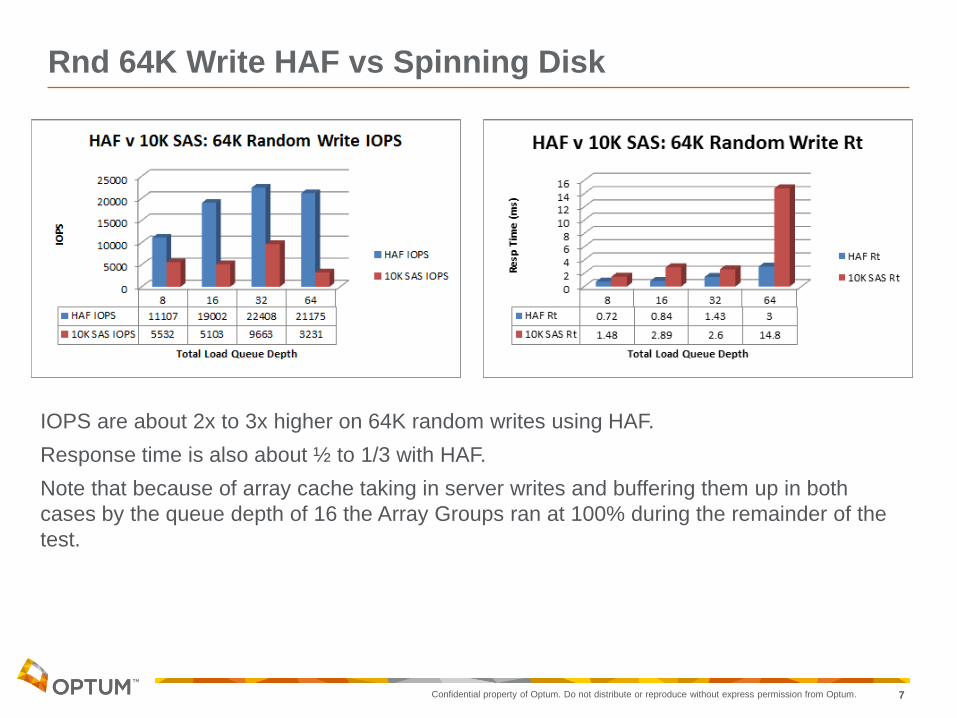
IOPS are about 2x to 3x higher on 64K random writes using HAF.
Response time is also about ½ to 1/3 with HAF.
Note that because of array cache taking in server writes and buffering them up in both
cases by the queue depth of 16 the Array Groups ran at 100% during the remainder of the
test.

Confidential property of Optum. Do not distribute or reproduce without express permission from Optum. 8
32K 50505050 rwrs: HAF vs. SSD vs. 10K SAS
This is my IO Fidelity test: It is complex IO with mixed read – write – random – sequential that is not
designed to find some number of max IO or MB/sec, but rather response time sensitivity at low queue
depths. The HAF is 10% to 20% faster than SSD at low queue depths. All Flash is 400% or 500%
faster than spinning disk here.
HAF performs better than the SLC SSD drives in this test. “Same or better” is satisfied. There were 16
HAF FMDs under test and only 12 SSD; having 33% more “drives” in the case of HAF explains some
of the HAF advantage with deeper loads.
Spinning disk, while performing “as designed”, performs bad when compared to Flash, “as designed”.

Confidential property of Optum. Do not distribute or reproduce without express permission from Optum. 9
HAF and VSP VSD CPU Scalability.
Port IOPS: 4 ports all evenly busy doing ~80,000 IOPS each.
This array has 70-05-05 Flash Acceleration (FA) code enabled. (The FA feature is detailed
in another paper HDS_VSP_FlashAccelerationTest_FA_MarkWeber_v3.pptx).
Confidential property of Optum. Do not distribute or reproduce without express permission from Optum. 10
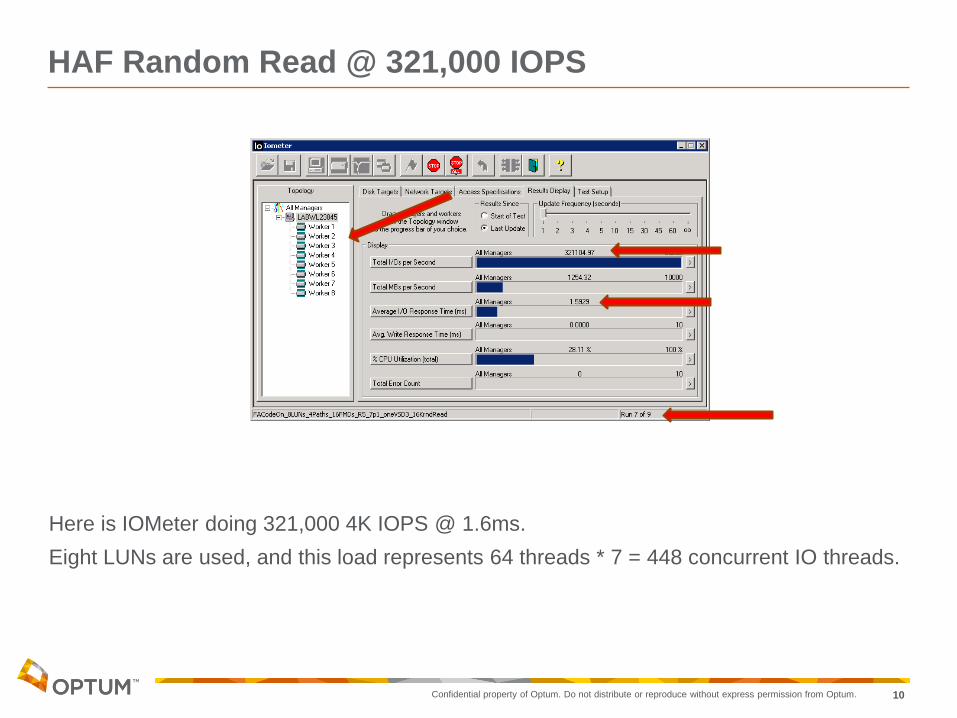
HAF Random Read @ 321,000 IOPS
When all you have is a hammer
Everything looks like a nail.
Here is IOMeter doing 321,000 4K IOPS @ 1.6ms.
Eight LUNs are used, and this load represents 64 threads * 7 = 448 concurrent IO threads.
And when you have the Iometer,
Every LUN looks like something to test!
Confidential property of Optum. Do not distribute or reproduce without express permission from Optum. 11
VMWARE/Citrix Write Intensive Load 1 of 2
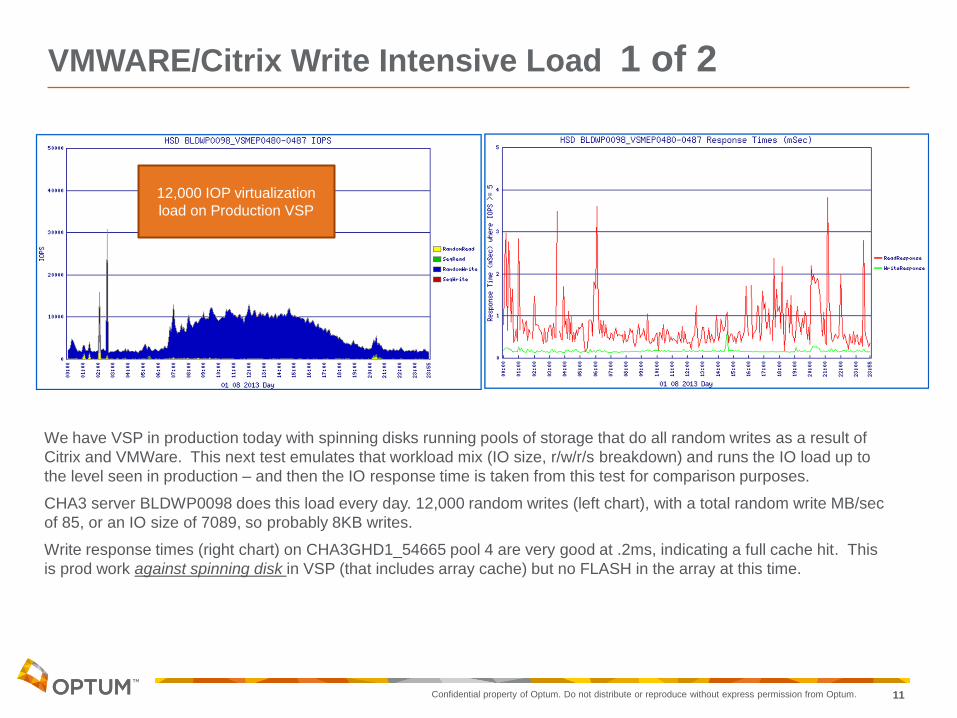
We have VSP in production today with spinning disks running pools of storage that do all random writes as a result of
Citrix and VMWare. This next test emulates that workload mix (IO size, r/w/r/s breakdown) and runs the IO load up to
the level seen in production – and then the IO response time is taken from this test for comparison purposes.
CHA3 server BLDWP0098 does this load every day. 12,000 random writes (left chart), with a total random write MB/sec
of 85, or an IO size of 7089, so probably 8KB writes.
Write response times (right chart) on CHA3GHD1_54665 pool 4 are very good at .2ms, indicating a full cache hit. This
is prod work against spinning disk in VSP (that includes array cache) but no FLASH in the array at this time.
12,000 IOP virtualization
load on Production VSP
Confidential property of Optum. Do not distribute or reproduce without express permission from Optum. 12
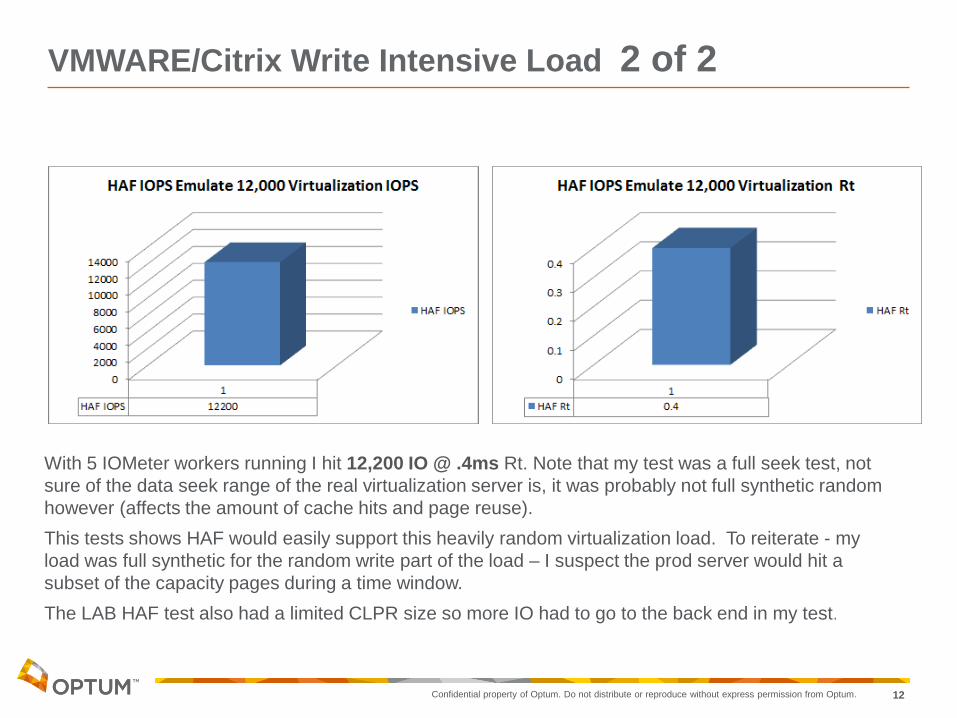
VMWARE/Citrix Write Intensive Load 2 of 2
With 5 IOMeter workers running I hit 12,200 IO @ .4ms Rt. Note that my test was a full seek test, not
sure of the data seek range of the real virtualization server is, it was probably not full synthetic random
however (affects the amount of cache hits and page reuse).
This tests shows HAF would easily support this heavily random virtualization load. To reiterate - my
load was full synthetic for the random write part of the load – I suspect the prod server would hit a
subset of the capacity pages during a time window.
The LAB HAF test also had a limited CLPR size so more IO had to go to the back end in my test.
Confidential property of Optum. Do not distribute or reproduce without express permission from Optum. 13
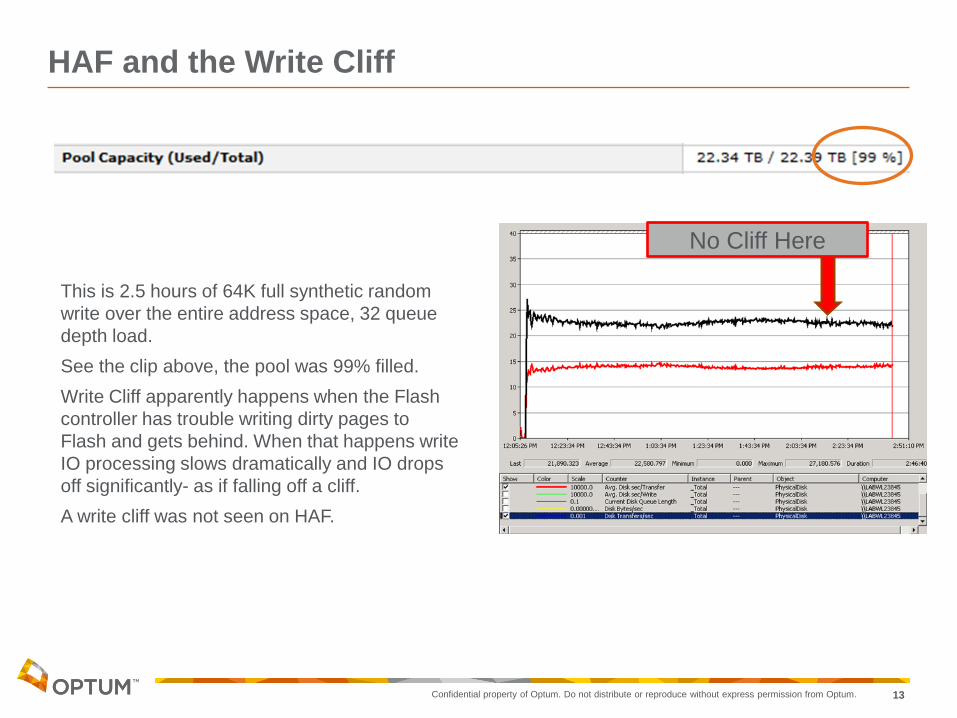
HAF and the Write Cliff
This is 2.5 hours of 64K full synthetic random
write over the entire address space, 32 queue
depth load.
See the clip above, the pool was 99% filled.
Write Cliff apparently happens when the Flash
controller has trouble writing dirty pages to
Flash and gets behind. When that happens write
IO processing slows dramatically and IO drops
off significantly- as if falling off a cliff.
A write cliff was not seen on HAF.
No Cliff Here
Confidential property of Optum. Do not distribute or reproduce without express permission from Optum. 14
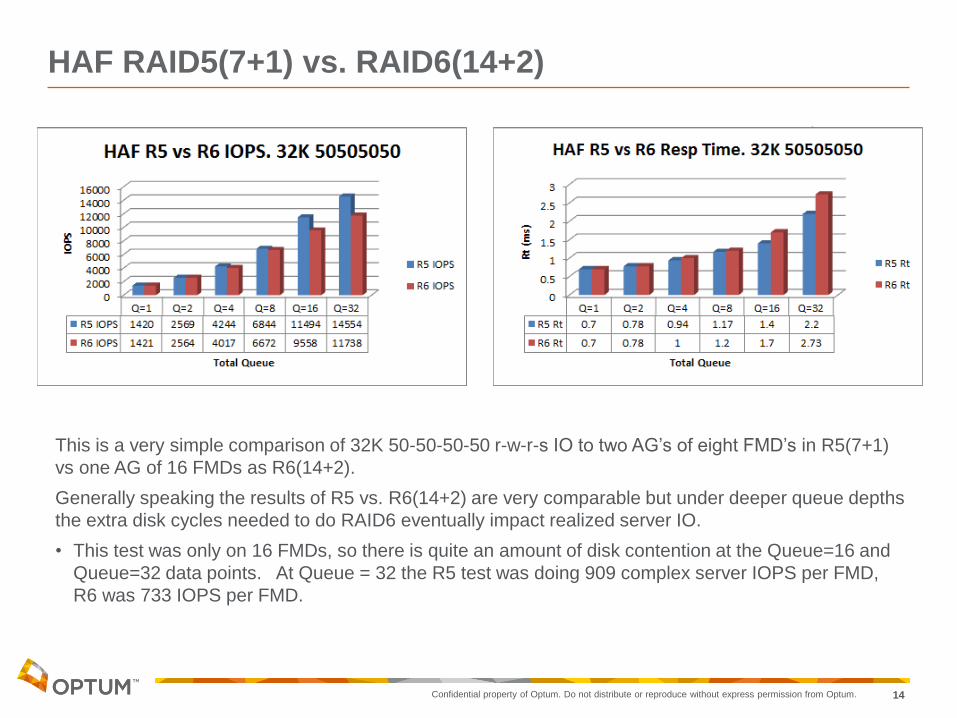
HAF RAID5(7+1) vs. RAID6(14+2)
This is a very simple comparison of 32K 50-50-50-50 r-w-r-s IO to two AG’s of eight FMD’s in R5(7+1)
vs one AG of 16 FMDs as R6(14+2).
Generally speaking the results of R5 vs. R6(14+2) are very comparable but under deeper queue depths
the extra disk cycles needed to do RAID6 eventually impact realized server IO.
• This test was only on 16 FMDs, so there is quite an amount of disk contention at the Queue=16 and
Queue=32 data points. At Queue = 32 the R5 test was doing 909 complex server IOPS per FMD,
R6 was 733 IOPS per FMD.

Confidential property of Optum. Do not distribute or reproduce without express permission from Optum. 15
HAF Drive Rebuild Time Under Load. 1 of 2
This test will run a control load of 70309010_48K (rwrs) at a load level sufficient to cause HAF RT to
be 1ms+.
One HAF will be failed, and the IO and response time levels recorded while running on parity rebuild,
while running on the hot spare, and while running on the failback.
This is complex IO load running @ ~ 1ms. Control load before the drive failure. AG’s running
in the 45% busy range.
45% busy
before failure
Failure here

Confidential property of Optum. Do not distribute or reproduce without express permission from Optum. 16
HAF Drive Rebuild Time Under Load. 2 of 2
The impact of failing a drive
on running server IO was
minimal as seen in this
Windows Perfmon data take
from the server.
This sparing finished 5h after
it was started, the whole time
the AG’s remained under
46% load.
This rebuild time was
impressive, since the rebuild
time under idle IO conditions
(100% touched) was also 5
hours.
Confidential property of Optum. Do not distribute or reproduce without express permission from Optum. 17
HAF and Hitachi Flash Acceleration (FA)
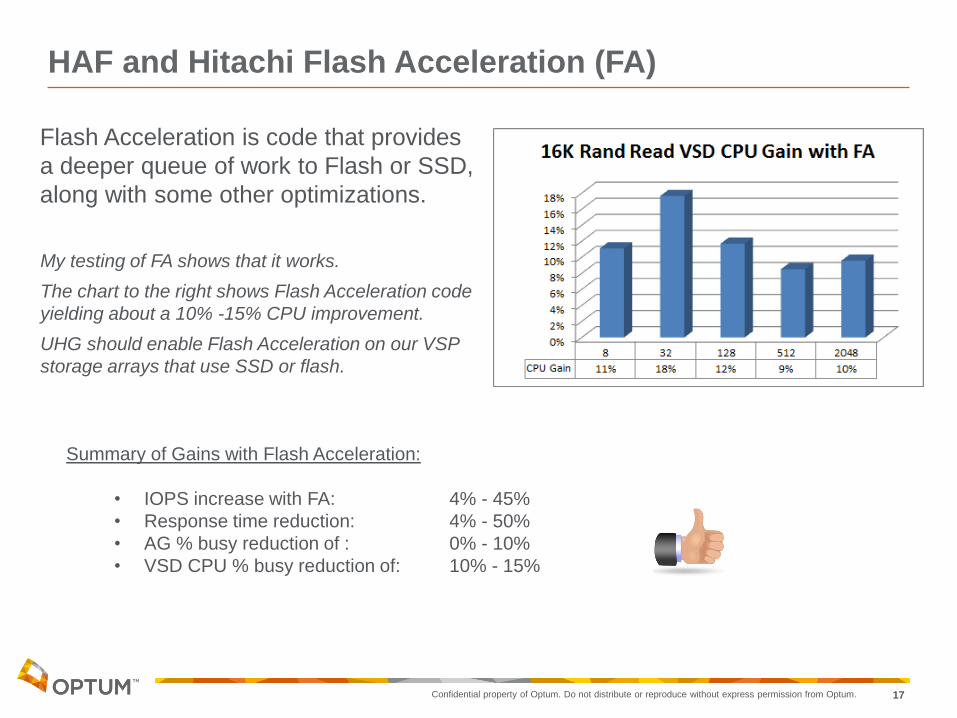
My testing of FA shows that it works.
The chart to the right shows Flash Acceleration code
yielding about a 10% -15% CPU improvement.
UHG should enable Flash Acceleration on our VSP
storage arrays that use SSD or flash.
Summary of Gains with Flash Acceleration:
• IOPS increase with FA: 4% - 45%
• Response time reduction: 4% - 50%
• AG % busy reduction of : 0% - 10%
• VSD CPU % busy reduction of: 10% - 15%
Flash Acceleration is code that provides
a deeper queue of work to Flash or SSD,
along with some other optimizations.
Confidential property of Optum. Do not distribute or reproduce without express permission from Optum. 18
HAF Integrated Into VSP Day to Day Function
HAF works just like you would expect it to in the VSP array. It is like any other disk.
• Add to pool, shrink from pool.
• Create LDEV, delete LDEV.
• Storage Navigator LUN management, add paths, rename LUNs.
• Add / change CLPR (cache logical partition).
• Assign to / move HAF LUNs to different VSD CPU cards.
• Works as expected in TnM for performance reporting & alerting.
• Supports encryption.
• Array group naming/numbering/conventions are as typical with VSP.
• Physical ordering/naming of AGs is in FBX box is from left to right, wherein DKU
orders and names disks from right to left. This fact has zero impact on usability.
• Full support for all RAID levels at GA. (we have tested two – R5(7+1) and R6(14+2)
Confidential property of Optum. Do not distribute or reproduce without express permission from Optum. 19
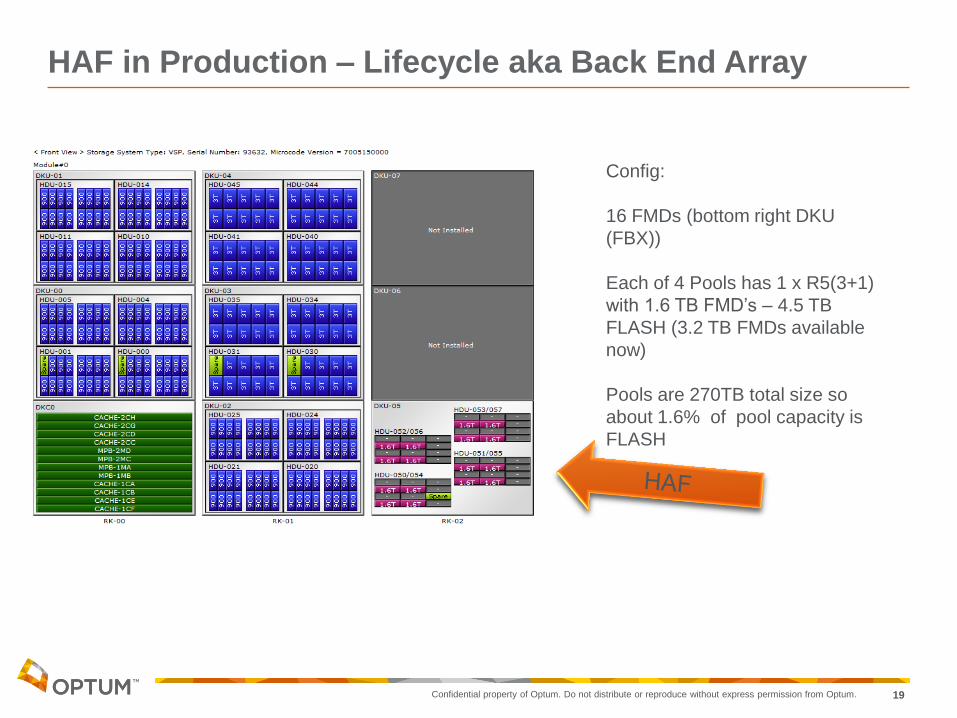
HAF in Production – Lifecycle aka Back End Array
Config:
16 FMDs (bottom right DKU
(FBX))
Each of 4 Pools has 1 x R5(3+1)
with 1.6 TB FMD’s – 4.5 TB
FLASH (3.2 TB FMDs available
now)
Pools are 270TB total size so
about 1.6% of pool capacity is
FLASH
Confidential property of Optum. Do not distribute or reproduce without express permission from Optum. 20
HAF @ 3.2TB?
Just a thought:
3.2TB FMD’s are the same processors with double
the capacity.
If our 1.6TB HAF FMD cards are 98% full now and
70% AG busy – what happens when FMD’s double
in size to 3.2TB?
Confidential property of Optum. Do not distribute or reproduce without express permission from Optum. 21
FLASH in Production
More context: • These are general purpose Managed Services arrays.
• We don’t manage at the server level, only if we get threshold alerts.
• Three FTE equivalents manage array performance across 60+ arrays.
• +80,000 hard drives in our Hitachi arrays
• 40,000 servers in our environment. 3,500 Unix, 11,500 windows, 3,000 Linux, 22,000 VMs
• Strive for high-enough performance at a reasonable cost.
• Capacity – Performance – Cost. Pick 3.
• IO has gone from 25ms to 10ms to 3ms over our careers, someday to be 1ms then
sub-millisecond.
• New frontiers are commercialization, white box, object space. The world is flipping,
the world wants this stuff now.
• Vendor sprawl: in the last year or two the number of products to support has grown
from 2 or 2 to 5 or 6. Acquisitions, politics.
There might be some things in these charts is not pristine and perfect. Something is
always boiling over somewhere….

Confidential property of Optum. Do not distribute or reproduce without express permission from Optum. 22
FLASH: The Problem We are Solving For
This access pattern is
somewhat universal in
our environment.
Random Reads in the
blocks highlighted in
the picture win big
Not all data is created
equal
Confidential property of Optum. Do not distribute or reproduce without express permission from Optum. 23
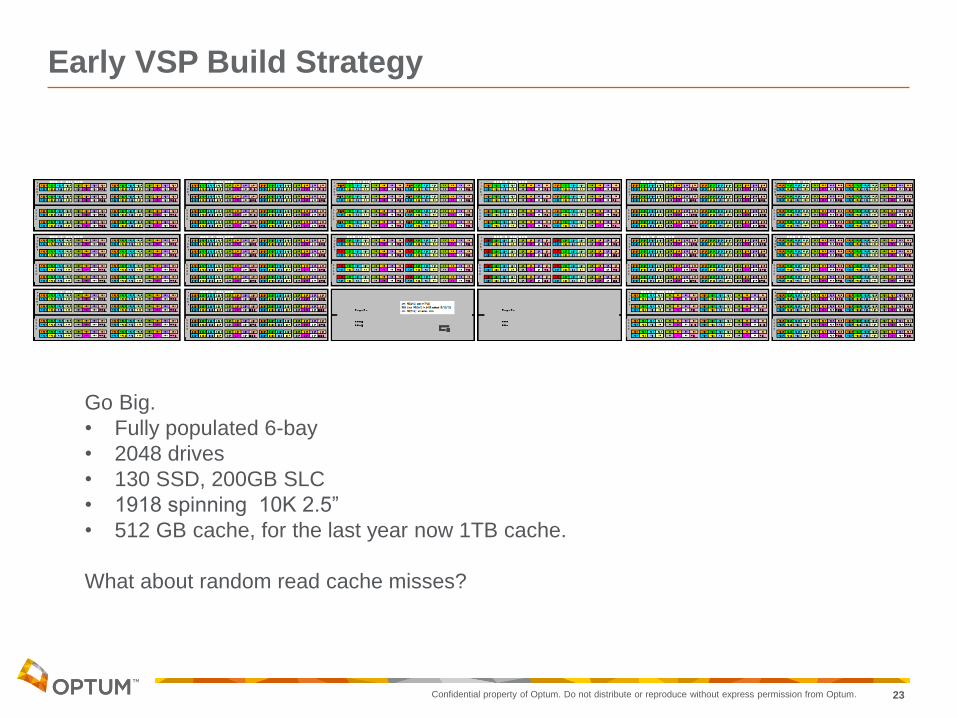
Early VSP Build Strategy
Go Big.
• Fully populated 6-bay
• 2048 drives
• 130 SSD, 200GB SLC
• 1918 spinning 10K 2.5”
• 512 GB cache, for the last year now 1TB cache.
What about random read cache misses?
Confidential property of Optum. Do not distribute or reproduce without express permission from Optum. 24
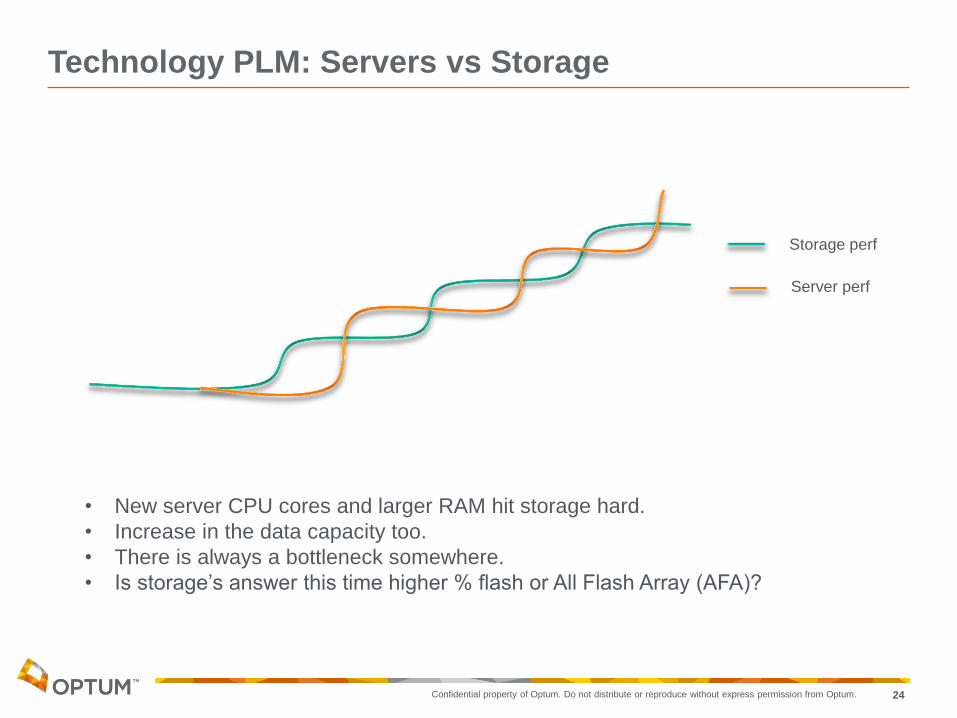
Technology PLM: Servers vs Storage
• New server CPU cores and larger RAM hit storage hard.
• Increase in the data capacity too.
• There is always a bottleneck somewhere.
• Is storage’s answer this time higher % flash or All Flash Array (AFA)?
Storage perf
Server perf
Confidential property of Optum. Do not distribute or reproduce without express permission from Optum. 25
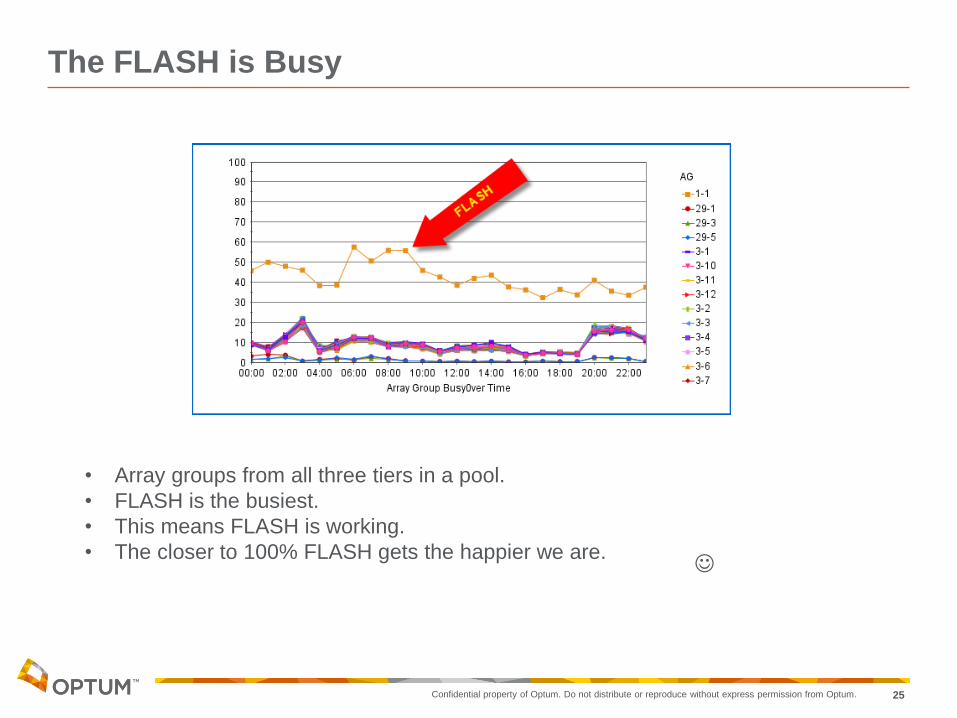
The FLASH is Busy
• Array groups from all three tiers in a pool.
• FLASH is the busiest.
• This means FLASH is working.
• The closer to 100% FLASH gets the happier we are.
Confidential property of Optum. Do not distribute or reproduce without express permission from Optum. 26
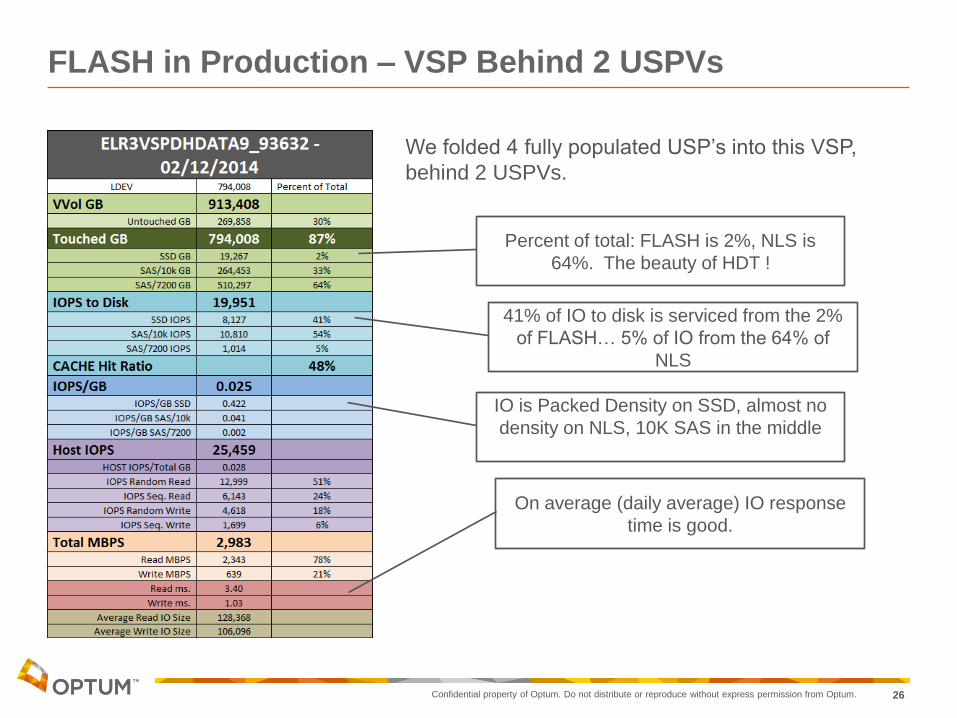
FLASH in Production – VSP Behind 2 USPVs
Percent of total: FLASH is 2%, NLS is
64%. The beauty of HDT !
41% of IO to disk is serviced from the 2%
of FLASH… 5% of IO from the 64% of
NLS
IO is Packed Density on SSD, almost no
density on NLS, 10K SAS in the middle
On average (daily average) IO response
time is good.
We folded 4 fully populated USP’s into this VSP,
behind 2 USPVs.
Confidential property of Optum. Do not distribute or reproduce without express permission from Optum. 27
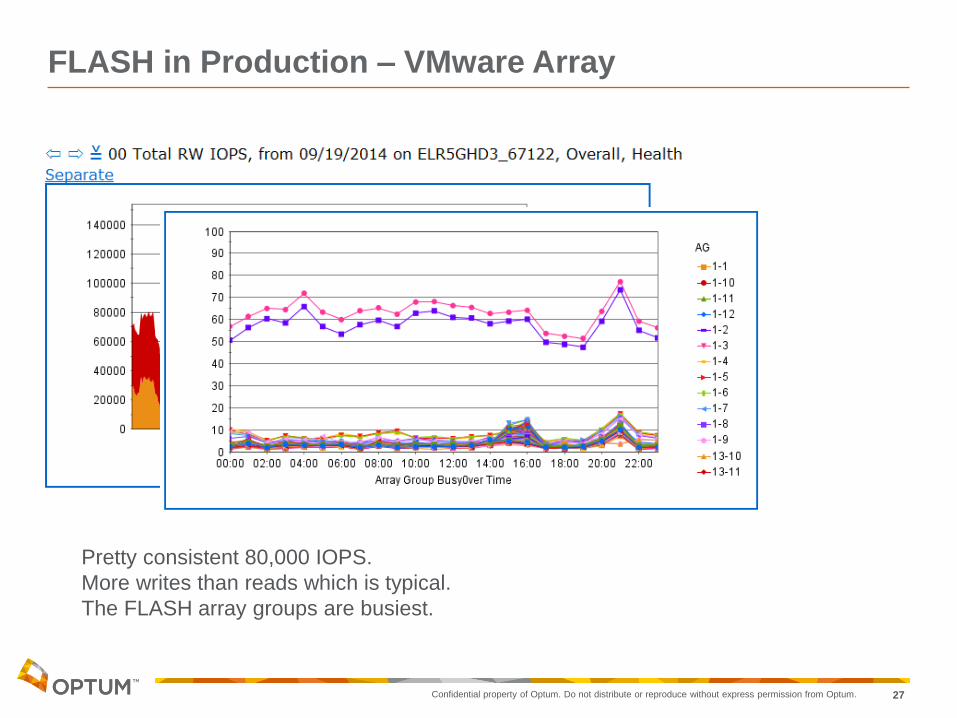
FLASH in Production – VMware Array
Pretty consistent 80,000 IOPS.
More writes than reads which is typical.
The FLASH array groups are busiest.
Confidential property of Optum. Do not distribute or reproduce without express permission from Optum. 28
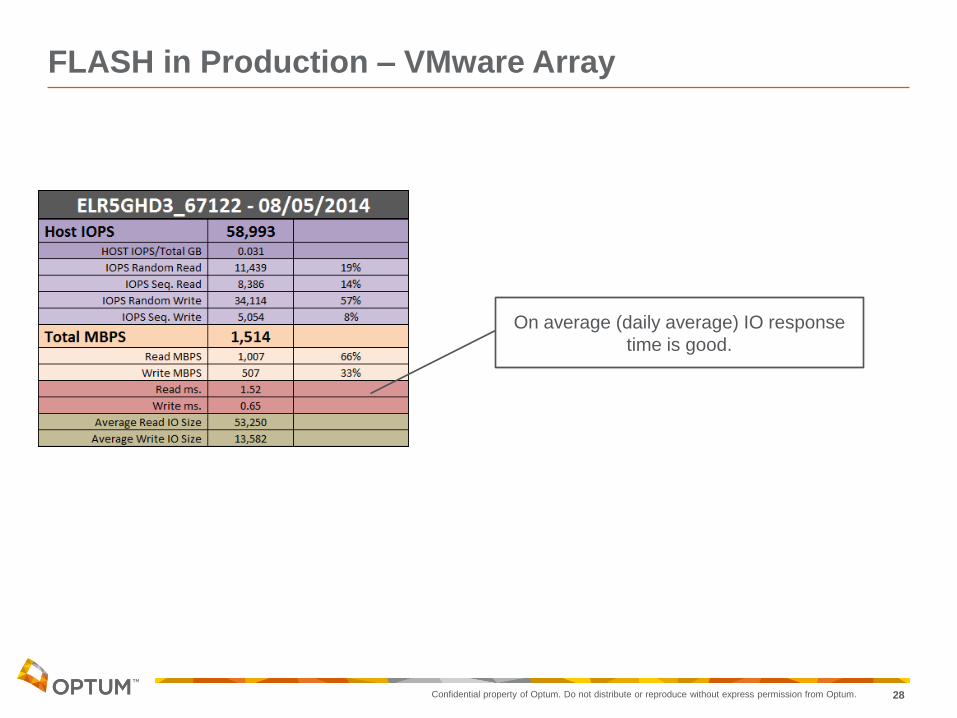
FLASH in Production – VMware Array
On average (daily average) IO response
time is good.
Confidential property of Optum. Do not distribute or reproduce without express permission from Optum. 29
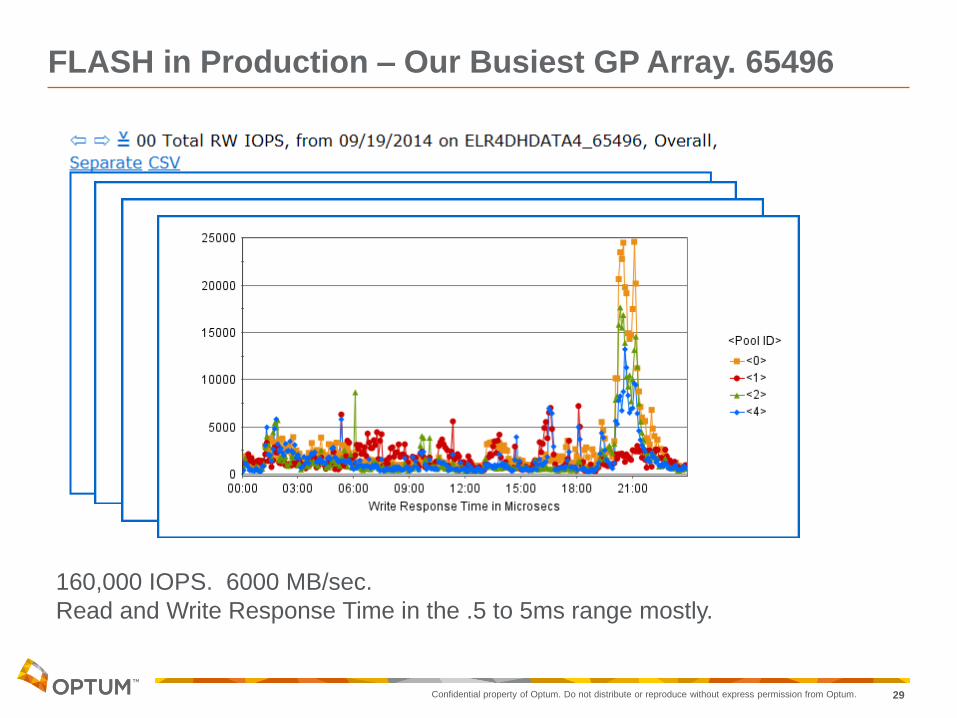
FLASH in Production – Our Busiest GP Array. 65496
160,000 IOPS. 6000 MB/sec.
Read and Write Response Time in the .5 to 5ms range mostly.

Confidential property of Optum. Do not distribute or reproduce without express permission from Optum. 30
FLASH in Production – Busiest GP Array. 65496
200GB SSD’s in this array.
1% of the capacity does 43% of the IOPS
on the backend - That will work.
Response in this case are skewed by
those 21:00 response time events in the
previous chart
Confidential property of Optum. Do not distribute or reproduce without express permission from Optum. 31
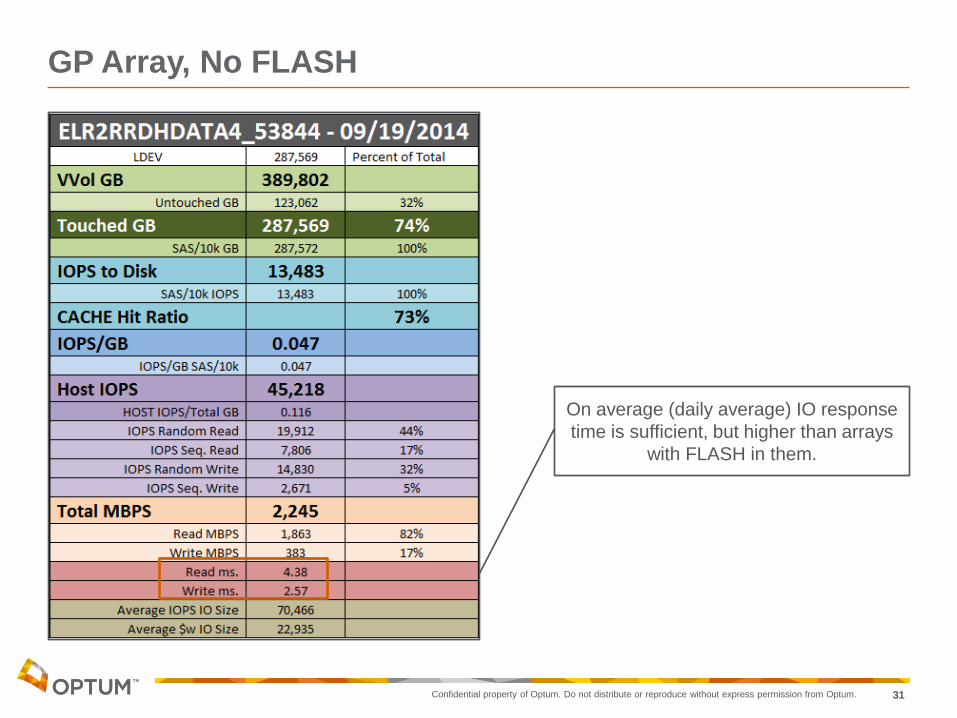
GP Array, No FLASH
On average (daily average) IO response
time is sufficient, but higher than arrays
with FLASH in them.
Confidential property of Optum. Do not distribute or reproduce without express permission from Optum. 32
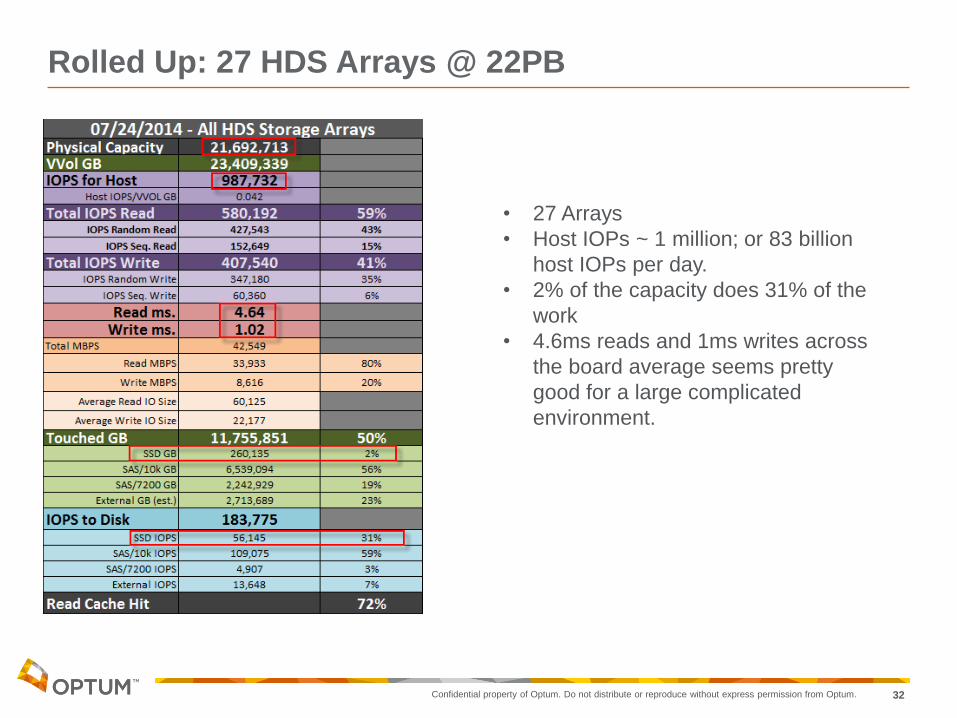
Rolled Up: 27 HDS Arrays @ 22PB
• 27 Arrays
• Host IOPs ~ 1 million; or 83 billion
host IOPs per day.
• 2% of the capacity does 31% of the
work
• 4.6ms reads and 1ms writes across
the board average seems pretty
good for a large complicated
environment.
Confidential property of Optum. Do not distribute or reproduce without express permission from Optum. 33
Summary Comments
• We are pleased with the contribution of FLASH to our performance
environment.
• A lot of IO is moved from spinning disk to FLASH which lightens the load for
the IO remaining on those spinning disks. Everybody is better.
• In the end all that matters is response time. FLASH helps here.
• We have upped oversubscription with a new touched goal of 80% or 90%
which puts more IO on the arrays. Flash has helped us scale to other array
performance limits.