Embed Size (px)
Citation preview
History of pronghorn population monitoring, research, and management in Yellowstone National Park
Final report submitted in fulfillment of: NPS Agreement #1443-IA-1248-01-006
USGS Agreement # 1-3303-IA05
Kim A. Keating USGS Northern Rocky Mountain Science Center
AJM Johnson Hall Montana State University Bozeman, Montana 59717
(406) 994-7333 [email protected]
26 March 2002
CONTENTS
INTRODUCTION 1
DISTRIBUTION AND HABITAT USE 2 General Patterns 2 Winter Distribution and Habitat Use 6 DEMOGRAPHICS AND MANAGEMENT 17 Overview 17 1872–1885 18 1886–1917 19 1918–1945 23 1946–1967 26 1968–2001 28 Population Viability 33 GENETICS 37 DISEASE 38 ACKNOWLEDGEMENTS 41 LITERATURE CITED 41 APPENDIX A. Summary of pronghorn maximum counts, estimates, and removals on the northern Yellowstone winter range, 1872–2001. 57 APPENDIX B. Average coyote pelt prices for Montana, 1972–1998. 69 APPENDIX C. Average coyote pelt prices, 1974–1975 to 1977–1978, for the region of the United States that includes Idaho, Montana, and Wyoming. 70
INTRODUCTION
Pronghorn antelope in Yellowstone National Park (YNP) persist in a small population
that historically has experienced recurrent, sometimes dramatic declines. They apparently
are isolated from other pronghorns, depend partly on private lands for winter range,
experience heavy predation of fawns, and concentrate during winter in a relatively small
area, thereby increasing their vulnerability to factors like disease or locally extreme weather.
Overall, the situation raises serious concerns about the long-term viability of this population.
Although such concerns are not new, evidence of a dramatic population decline since 1991
and continued poor recruitment has created a renewed sense of urgency.
Recent efforts to revitalize pronghorn research in YNP began with fawn recruitment
and habitat use studies, initiated in 1999 and 2000. With those studies drawing to a close,
YNP is reviewing the status and direction of its pronghorn program. The Yellowstone
Pronghorn Conservation Assessment Workshop was convened in YNP in January, 2002, to
appraise the current state of knowledge about this pronghorn population and make
recommendations about future management and research needs. A review of pronghorn
population change, management, and research in YNP was commissioned in May, 2001, to
provide historical background for workshop participants. Following is a written summary of
that review.
The process of locating materials for this review was limited to 3 months. Not all
relevant materials were discovered or reviewed in that time. In particular, it was not possible
to find and review all original sources of information. Also, except for occasional anecdotal
accounts, weather records were not reviewed, leaving a potentially serious gap in our
understanding of the forces driving changes in pronghorn population counts and estimates
2
over time. Despite these deficiencies, considerable information was reviewed, earlier
summaries of population classification and count data were updated, and previously uncited
sources of information were identified that challenge important aspects of previous
interpretations of the history of pronghorns and pronghorn management in YNP.
Information is grouped into 4 major subject areas: distribution and habitat use, demographics
and management, genetics, and disease.
DISTRIBUTION AND HABITAT USE
General Patterns
Pronghorns were once widely distributed in the upper Yellowstone drainage, likely
migrating large distances to low-elevation winter ranges. In a description reminiscent of the
100- to 170-mile pronghorn migrations that occur today between Grand Teton National Park
and winter ranges in southwestern Wyoming (Sawyer and Lindzey 2000), Grinnell (1918)
observed that in YNP,
"The antelope never wintered in the Park, but went down the Yellowstone River
toward the lower country. T. E. Hofer has spoken of seeing their trails where
Livingston now stands, where at first he thought that bands of several thousand
sheep had passed along."
Hofer himself wrote that pronghorns did not winter in YNP (Hofer 1887a), but “used to go to
a less snowy region to pass the winter months” (Hofer 1890). Quoting Gamekeeper Young
from 1881, Skinner (1922a:93) wrote that “very few of the deer or antelope wintered
anywhere in the park.” Based on his review of the historical record, Houston (1982:24) also
believed that “pronghorn wintered historically in the Paradise Valley…and further down the
3
Yellowstone River.”
Following settlement, the situation changed dramatically. Skinner (1922a:93) painted
an especially bleak picture when he stated that “migration now to the plains would be
slaughter, for if an antelope gets out of the park, it is gone as if swallowed up.” Contributing
factors are reviewed below (see Demographics and Management). The net impact, however,
was that the pronghorn migration north from YNP was effectively eliminated during
settlement (Houston 1982:24), although the exact timing is unclear. Barmore (1981, citing
Skinner 1922a, Nelson 1925, and Beer 1944) concluded only that extirpation occurred
“sometime before 1920.” An article in Forest and Stream (Anonymous 1905b) suggests that
it may have occurred by 1905, as it quotes YNP’s Acting Superintendent as stating that “[t]he
valley of the Yellowstone north of the park is now completely taken up by ranchers, and their
wire fences running in every direction have completely shut off the old winter range of the
antelope.” Whatever the timing, migrations that historically funneled “thousands of
antelope” (Skinner 1922a:92) to spring and summer ranges in YNP ended with settlement of
the Paradise Valley. Pronghorn sightings between YNP and Livingston remain sparse today
(Scott and Geisser 1994), and the population is presumed to be demographically and,
perhaps, genetically closed.
Within YNP, historical accounts of seasonal distributions paint a picture that broadly
accords with most of what is known about pronghorn distributions today. Rangeland habitats
along the Yellowstone and Lamar Rivers, and on the Blacktail Deer Plateau have long been
recognized as preferred pronghorn habitat (Scott and Geisser 1994, citing Norris 1878).
Hofer (1887b; 1889b; 1890; 1891a,b; 1905a) reported pronghorns wintering on Mt. Everts
and along the northern boundary near Gardiner; and spring and summer sightings near
4
Yancey’s and Junction Butte, on the hillsides between Hellroaring and Slough Creek, and on
the Blacktail Deer Plateau and Specimen Ridge. Skinner (1922a:92) reported that “the
[pronghorn] range is restricted to the great open section in the north, comprising the Gardiner
Valley, Mount Everts, Blacktail Deer Valley, the slopes on both sides of Hellroaring Creek,
Junction Valley, the lower slopes of Mount Washburn on the north, the lower and upper
valleys of the Lamar River, and Specimen Ridge.” Murie (1940:89) observed that, in
summer, pronghorns were “distributed from the Game Ranch all the way to Tower Falls and
to the high grassy ridges bordering Cache Creek on the east,” and that “[t]hey are commonly
found on top of Specimen Ridge."
Various accounts suggest that at least 3 important changes have occurred in summer
distributions. First, pronghorn use of the Hayden Valley apparently has declined. Scattered
reports confirm that, historically, at least small numbers of pronghorns regularly summered
in the Hayden Valley (Anonymous 1885, Wilson 1885, Hofer 1887c). However, Skinner
(1922a:92) stated that pronghorns no longer used the Hayden at the time of his study, while
Murie (1940:89), Scott (1993a), and Scott and Geisser (1994) regarded sightings there as
“unusual.” Declining use of the Hayden Valley may have significance beyond the simple
fact of a reduced pronghorn distribution. Scott and Geisser (1994:16–17) speculated that the
Hayden might have been an historical “mixing site for pronghorns from the Yellowstone and
Madison Valleys,” with pronghorns from the Madison area migrating into the Hayden Valley
via the Madison-Firehole-Nez Perce Creek route used today by bison. Sporadic sightings of
pronghorns in the Lower Geyser Basin and along the Madison and Gibbon Rivers (Scott and
Geisser 1994) are consistent with this hypothesis.
5
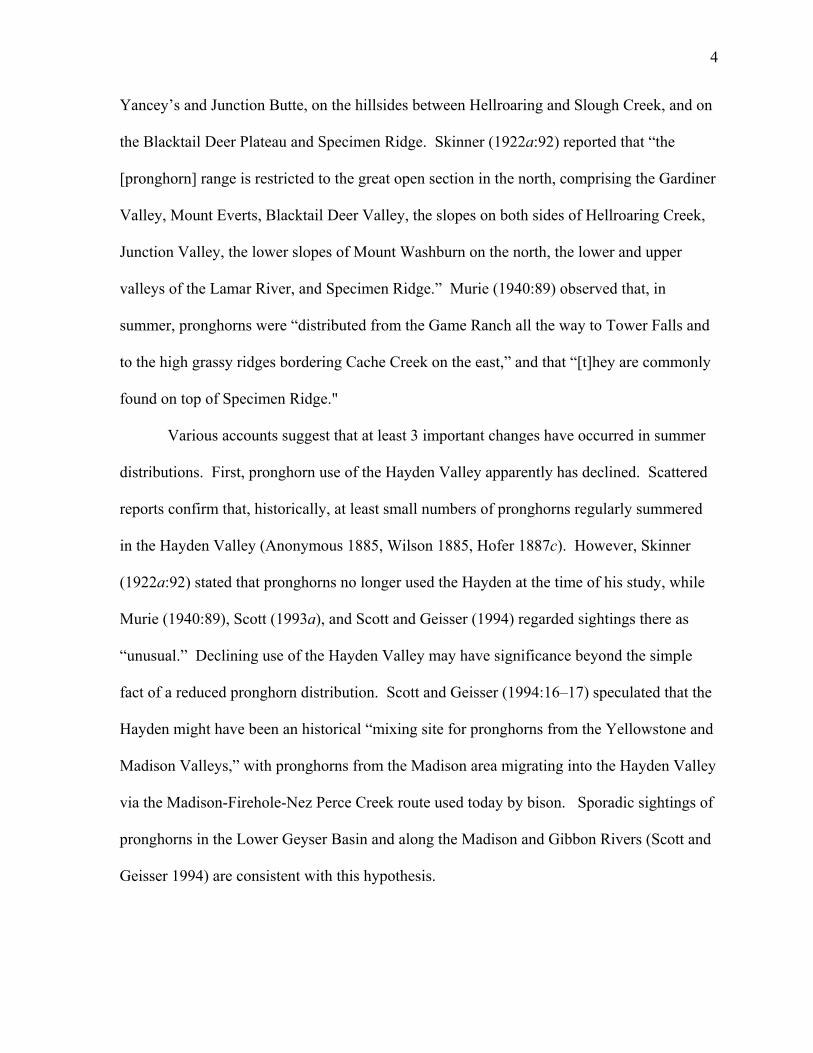
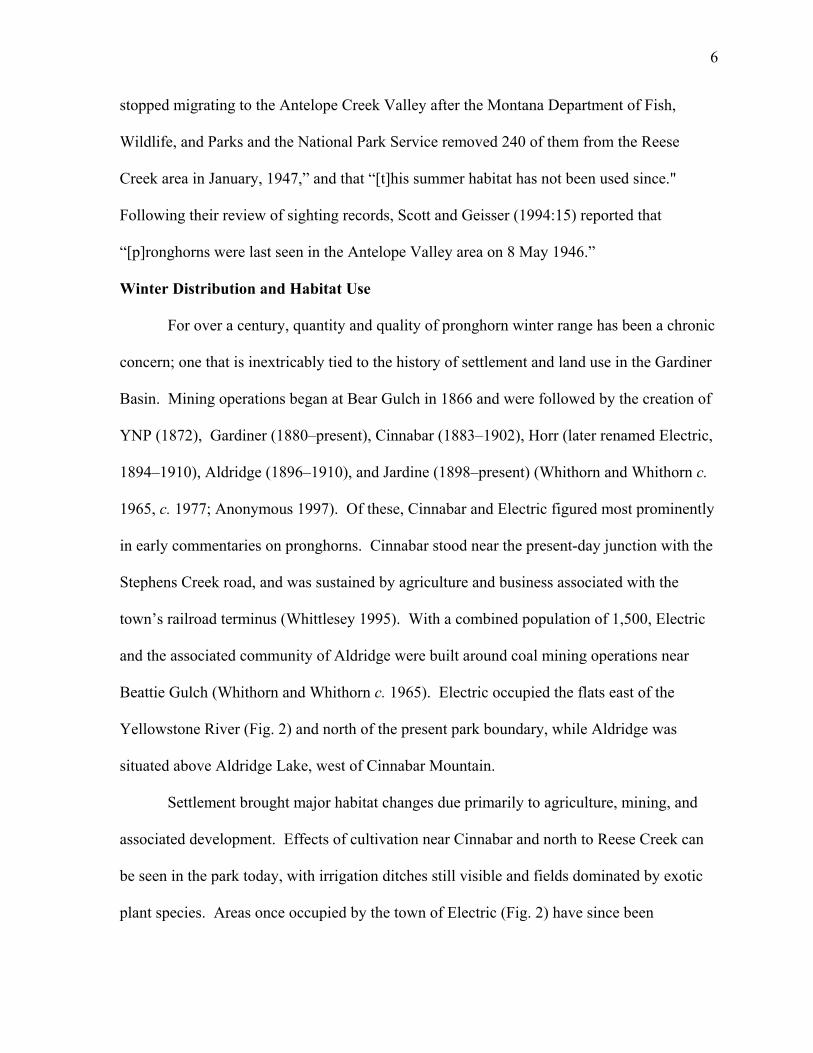
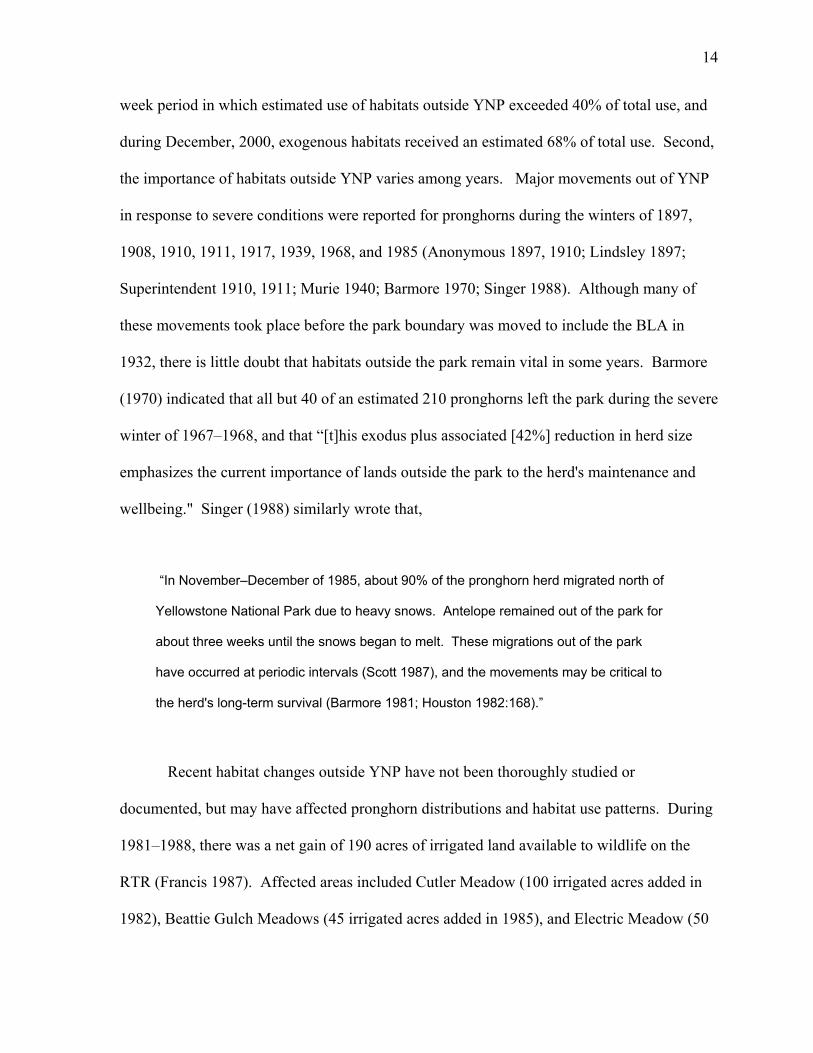
Fig. 1. Seasonal distribution of pronghorn antelope in Yellowstone National Park, as mapped by Skinner (1922). Summer range is indicated by the heavy outline, winter range by cross-hatching.
Second, there is some suggestion that pronghorn use in Gardners Hole has declined.
Skinner (1922a:91) stated that “[f]orty years ago, limited numbers [of pronghorns] ranged
the Swan Lake and Hayden Valleys, but such is no longer the case.” Although pronghorns
have been sighted in Gardners Hole area in recent times (J. Mack, National Park Service,
pers. commun.), it is believed that use has been sporadic.
Finally, pronghorns may have been extirpated from the Antelope Creek summer
range. Pronghorns undoubtedly once used this area, as Skinner (1922a:92) included “the
lower slopes of Mount Washburn on the north” in his description of pronghorn range. Also,
the Antelope Creek area is clearly contained within his mapped “Distribution of Prong-horn
Antelope in Yellowstone Park” (Skinner 1922a:91) (Fig. 1). Greer (c. 1930–1931:3)
similarly noted pronghorns in this area. Scott (1991:4) reported, however, that “pronghorns
6
stopped migrating to the Antelope Creek Valley after the Montana Department of Fish,
Wildlife, and Parks and the National Park Service removed 240 of them from the Reese
Creek area in January, 1947,” and that “[t]his summer habitat has not been used since."
Following their review of sighting records, Scott and Geisser (1994:15) reported that
“[p]ronghorns were last seen in the Antelope Valley area on 8 May 1946.”
Winter Distribution and Habitat Use
For over a century, quantity and quality of pronghorn winter range has been a chronic
concern; one that is inextricably tied to the history of settlement and land use in the Gardiner
Basin. Mining operations began at Bear Gulch in 1866 and were followed by the creation of
YNP (1872), Gardiner (1880–present), Cinnabar (1883–1902), Horr (later renamed Electric,
1894–1910), Aldridge (1896–1910), and Jardine (1898–present) (Whithorn and Whithorn c.
1965, c. 1977; Anonymous 1997). Of these, Cinnabar and Electric figured most prominently
in early commentaries on pronghorns. Cinnabar stood near the present-day junction with the
Stephens Creek road, and was sustained by agriculture and business associated with the
town’s railroad terminus (Whittlesey 1995). With a combined population of 1,500, Electric
and the associated community of Aldridge were built around coal mining operations near
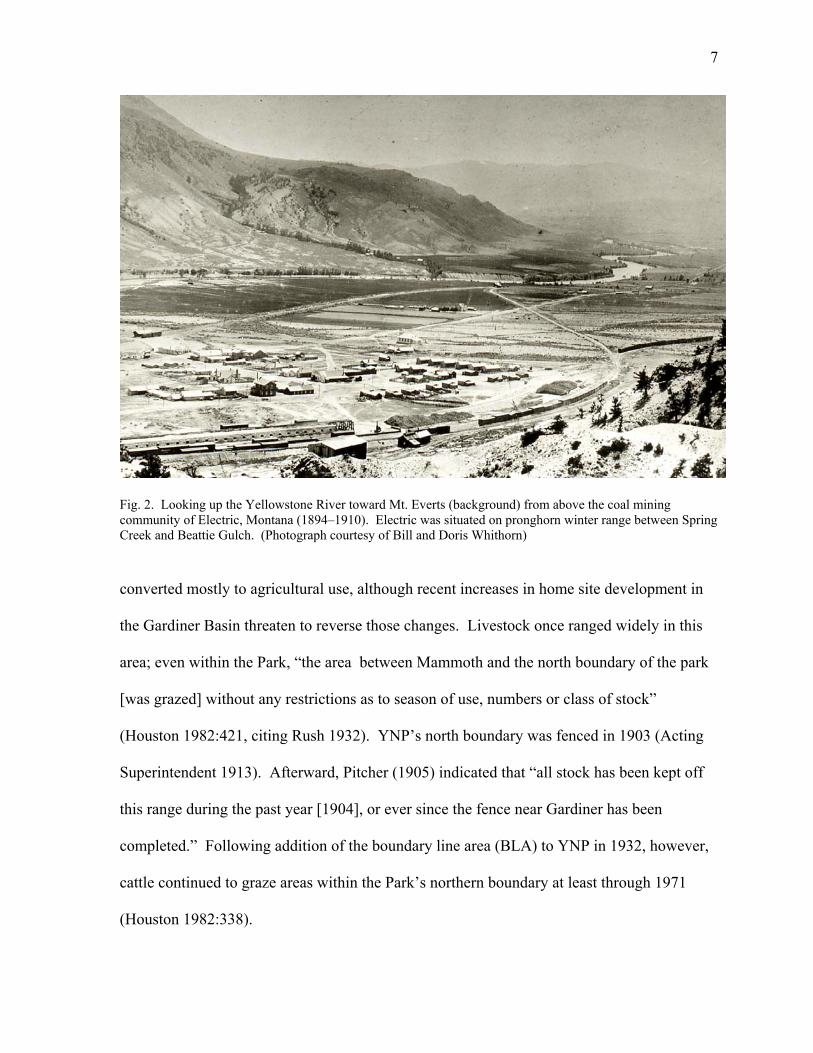
Beattie Gulch (Whithorn and Whithorn c. 1965). Electric occupied the flats east of the
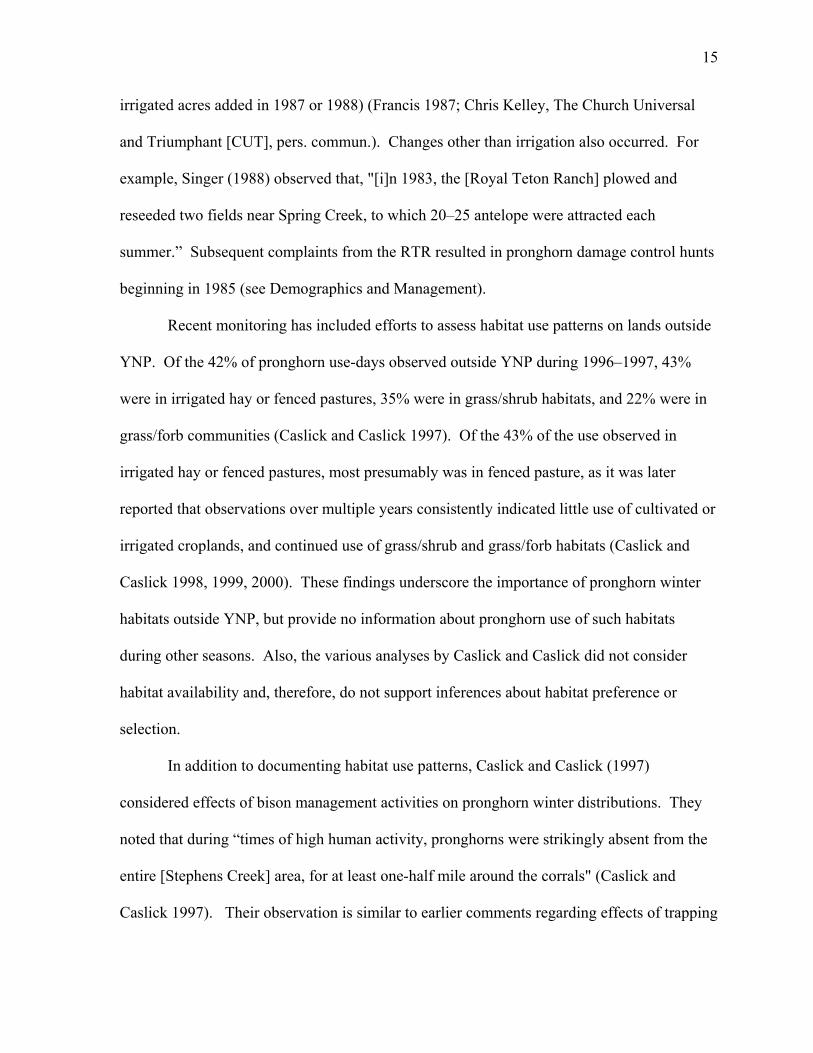
Yellowstone River (Fig. 2) and north of the present park boundary, while Aldridge was
situated above Aldridge Lake, west of Cinnabar Mountain.
Settlement brought major habitat changes due primarily to agriculture, mining, and
associated development. Effects of cultivation near Cinnabar and north to Reese Creek can
be seen in the park today, with irrigation ditches still visible and fields dominated by exotic
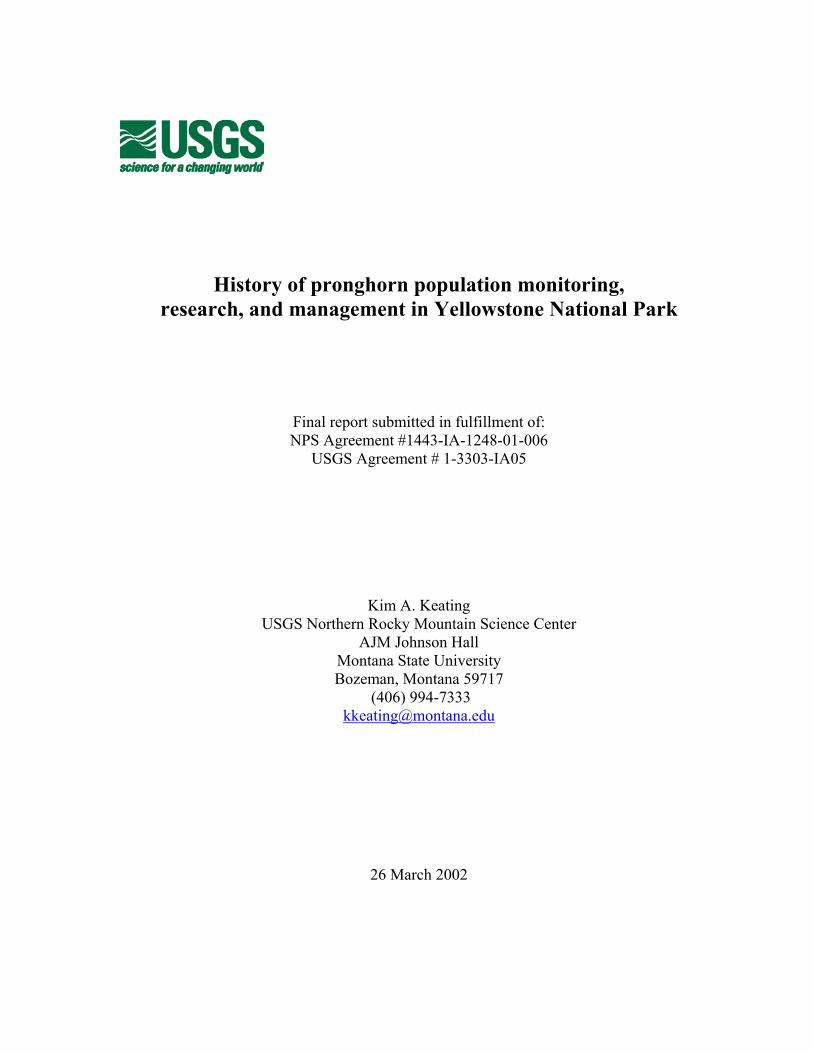
plant species. Areas once occupied by the town of Electric (Fig. 2) have since been
7
Fig. 2. Looking up the Yellowstone River toward Mt. Everts (background) from above the coal mining community of Electric, Montana (1894–1910). Electric was situated on pronghorn winter range between Spring Creek and Beattie Gulch. (Photograph courtesy of Bill and Doris Whithorn)
converted mostly to agricultural use, although recent increases in home site development in
the Gardiner Basin threaten to reverse those changes. Livestock once ranged widely in this
area; even within the Park, “the area between Mammoth and the north boundary of the park
[was grazed] without any restrictions as to season of use, numbers or class of stock”
(Houston 1982:421, citing Rush 1932). YNP’s north boundary was fenced in 1903 (Acting
Superintendent 1913). Afterward, Pitcher (1905) indicated that “all stock has been kept off
this range during the past year [1904], or ever since the fence near Gardiner has been
completed.” Following addition of the boundary line area (BLA) to YNP in 1932, however,
cattle continued to graze areas within the Park’s northern boundary at least through 1971
(Houston 1982:338).
8
Using comparative photography, Houston (1982) documented vegetation changes in
the BLA and north to Dome Mountain, among other areas. Changes in the amount of big
sagebrush (Artemesia tridentata) were evident (Houston 1982:292–293 and 338–351), but
generalizations about the nature and causes of the changes remain problematic. For example,
Houston (1982:338) characterized areas of high sage densities in parts of the current
pronghorn winter range as a disclimax induced by a combination of livestock overgrazing
and fire suppression. Photos from 1871 (Houston 1982:346–351) suggest, however, that
sagebrush during pre-settlement times was denser than occurs today on many parts of the
pronghorn winter range within YNP. Murie (1940:88) pointed to overgrazing by native
ungulates as a cause of the decline of sage within the Park, but other factors also may have
been important. For example, Bauer (1938, quoted in Houston 1982:425) stated, “the drouth
which persisted more or less from 1933 to 1936 had a definite adverse effect on [sagebrush],”
killing off “large areas” of sage. More recent studies in the northern Rocky Mountain region
also implicated drought as a major factor in the decline of sagebrush (Anderson and Inouye
2001).
Other habitat changes affected pronghorns in ways that were more calculated than
those induced by settlement. Feeding of ungulates, including pronghorns, began in YNP as
early as 1902 (Hofer 1902, Anonymous 1905b). In 1904, the Park began cultivating and
irrigating alfalfa on the flats near Gardiner, providing an estimated 100–200 tons of alfalfa
hay annually during winter (Pitcher 1905, Anonymous 1906a). This program affected the
pronghorn population in at least 2 ways. First, pronghorn numbers increased dramatically
(for details see Demographics and Management). Second, the presence of irrigated alfalfa
apparently caused some animals to remain on the winter range year around, likely creating
9
the non-migratory subpopulation that exists today. Evidence that migratory habits changed is
found in a series of Forest and Stream articles. Explaining the benefits of Superintendent
Pitcher’s new alfalfa cultivation program, one article (Anonymous 1904) stated that the flats
containing the alfalfa field were “used by the antelope only in winter” (my italics). Within a
year, that had changed (Hofer 1905b):
"In the spring almost all the antelope left their winter range in front of Gardiner and the
alfalfa patch; but about twenty concluded it was a favorable place to show themselves,
and every evening came down from the nearby hills. They are quite tame for antelope,
and thousands have seen them, where if they had returned to their old range for the
summer not one tourist would have known what the animal looked like."
Hofer’s (1908b) account suggests that mule deer summer distributions were similarly
affected and that the number of pronghorns remaining on the winter range during
summer continued to increase:
"In front of town [Gardiner] every evening we can see from forty to fifty antelope and
thirty to forty mule deer feeding on the alfalfa field…About twenty-five antelope used
the field every evening all last summer, and there is a prospect that more will camp
there this summer with the addition of the mule deer. I do not remember that any deer
summered here last year."
Overall, the record suggests that YNP’s alfalfa field induced unforeseen, long-term
consequences for distributions and habitat use patterns of pronghorns and mule deer.
Other management activities also likely influenced pronghorn winter distributions
10
and habitat use. A policy of containing pronghorns within YNP began soon after the U.S.
Army assumed responsibility for the Park in 1886, with “soldiers acting as herders” to drive
pronghorns back into the Park (Anonymous 1887a). This practice continued at least through
the winter of 1911–1912 (Anonymous 1911a,b; Acting Superintendent 1912). By 1900, the
Superintendent was lobbying for a boundary fence, with the express purpose of protecting
pronghorns and excluding livestock (Anonymous 1901, citing Superintendent’s Annual
Report 1900). Four miles of wire fence were completed by the U.S. Engineer Department in
1903 (Anonymous 1905b, quoting the Acting Superintendent; Acting Superintendent 1913).
The fence apparently succeeded in limiting livestock use of winter range in the Park (Pitcher
1905) and in preventing pronghorns “to some extent from moving out of the park" (Murie
1940:88). However, repeated references to fence repair and escaping animals (e.g.,
Anonymous 1907; Superintendent 1910, 1911; Anonymous 1911a,b; Acting Superintendent
1913; Bailey 1930:30, as quoted by Murie 1940:101) indicate that fencing was not fully
effective. Fencing also produced unintended impacts, as some pronghorns were trapped
against fence lines and killed by predators (Heller 1925:466, Anonymous 1934) — a strategy
still seen today (McEneaney 1997).
Although the old boundary fence was removed shortly after the BLA was added to
the Park (Anonymous 1934, 1936), fences erected by private landowners are still a concern.
In 1987 and 1988, for example, the Royal Teton Ranch (RTR) constructed over 2 miles of
buck-and-pole fence along the park boundary near Reese Creek (Barbee 1990). Scott (1992)
found that the fence inhibited trans-boundary movements by pronghorn. Subsequent
increases in annual counts (see Demographics and Management, Fig. 7) and continued
depredation hunts to control pronghorn numbers on the RTR suggest, however, that the fence
11
had little affect on the distribution or dynamics of the population.
In 1919, the National Park Service (NPS) issued the Graves Nelson Report, which
“recommended the acquisition by the federal government of a great many small tracts of
private land in the territory between Gardiner and Yankee Jim Canyon." (Whittlesey
1995:53). With that report, the focus of YNP’s pronghorn policy expanded beyond feeding
and predator control efforts to include acquisition of additional range, for by then it was
believed that more winter range was needed to assure the herd’s future. But how much
winter range was enough? Superintendent Albright argued that "… if we could get the
Hoppe Ranch, which immediately adjoins the Park on the north, we would have no more
trouble with the [pronghorn] herd" (Albright 1922). Skinner (c. 1924:2) apparently
envisioned a larger herd, for he reaffirmed that about 5,000 additional acres were needed for
the herd that existed at that time, but argued for acquiring a much larger area, writing that
“[i]f we had the entire valley from Gardiner to the Canyon below Electric, the continuation of
our herd and the preservation of the species would be assured.” Skinner’s vision, apparently,
was never pursued. In 1922, Thomas Cochran and George D. Pratt founded the Game
Preservation Company, which eventually purchased and donated thousands of acres to YNP
and the Gallatin National Forest (Whittlesey 1995:54). The Game Preservation Company
purchased the Hoppe ranch in 1925 and other parcels in the BLA in the years thereafter, but
the federal government could not accept title until 1931 and the 7,609-acre area was not
formally appended to YNP until October 20, 1932 (Whittlesey 1995:57, 71). During the
interim, the land was placed at the disposal of YNP “for the care of elk, deer and antelope in
winter” (Whittlesey 1995:57). YNP operated the former Hoppe Ranch (by then known as the
Game Preservation Ranch) for the feeding of native ungulates and government horses;
12
plowing, seeding, and irrigating large areas into hay almost as soon as it was acquired
(Whittlesey 1995:57). The operation yielded 144 tons of hay the first year, and by 1931 the
Park was cultivating 300 acres (Whittlesey 1995:57). Following addition of the BLA,
“razing of fences and old buildings on the antelope winter range…added considerable area to
the available range” (Anonymous 1936). By this time, pronghorns could move freely beyond
the former boundary fence and onto the lands that had once been occupied by the town of
Cinnabar.
The expanded feeding program enabled by acquisition of the BLA was short-lived.
During the winter of 1931–1932, 1200 pounds of cottonseed cake and 118 tons of hay were
fed at the Game Ranch (Anonymous 1933), but only 36 tons of hay were fed the following
winter, and by the winter of 1933–1934 the feeding program in the BLA ended (Anonymous
1933, 1934). One year later (1934–1935) YNP’s predator control program also ended (Murie
1940:16). Discontinuation of both feeding and predator control terminated a management
strategy that in various guises over a 50-year period (1886–1935) had sought to preserve
YNP’s pronghorn herd by simultaneously increasing the food supply and limiting predation.
Within 10 years after feeding and predator control ended, management objectives
were emphasizing habitat rather than herd protection. In summer 1946, a plan was approved
to reduce the pronghorn herd to 400 animals (Barmore 1981:Table 105, citing Anonymous
1946). In 1950, a target population of 200 animals was recommended (Barmore 1981:Table
105, citing Anonymous 1950a). By 1953, the Park’s management plan called for limiting the
herd to 100–125 pronghorns (Hamilton 1953, Rogers 1956). The target population
apparently remained in this range until the herd reduction program ended in 1967
(McLaughlin 1965). This dramatic shift in management philosophy almost certainly affected
13
pronghorn distributions and habitat use patterns, particularly on the winter range where
feeding and predator control efforts had previously been concentrated.
Studying seasonal habitat selection by pronghorns in the area between Mammoth Hot
Springs and Reese Creek, Barmore (1981) found that 79% of feeding was in xeric grasslands,
the only habitat type that was preferred throughout the October–May study period. Old
fields, mesic grasslands, and especially sagebrush grasslands generally were avoided,
although old fields were preferred during October–December and mesic grasslands were
preferred in May (Barmore 1981:236, 240, Fig. 28). Pronghorns strongly preferred level to
gentle slopes throughout the study period, and also showed some preference for moderate
west-facing slopes and ridge tops (Barmore 1981:241, 244, Fig. 29). No pronghorn were
observed feeding in snow >15 cm deep, and most foraged in <8 cm of snow (Barmore
1981:241, 245, Fig. 30). Significant variation in habitat selection was observed within and
between years, a fact that Barmore (1981:241, 246) attributed to (1) varying environmental
conditions, and (2) disproportionately high mortality during 1967–1968 among pronghorns
wintering west of the Gardiner River, where “essentially all the areas of old fields and
considerable sagebrush grassland occurred.”
More recently, pronghorn habitat use also has been monitored on areas outside YNP.
During the winters of 1996–1997 through 2000–2001, pronghorn activity outside the park
accounted for an estimated 13–51% of total habitat use during mid-November to mid-March
(Caslick and Caslick 1997, 1998, 1999, 2000, 2001). However, such figures may
underestimate the importance of these habitats for 2 reasons. First, the importance of habitats
outside the park was not constant throughout the 4-month monitoring period. For every year
monitored, Caslick and Caslick (1997, 1998, 1999, 2000, 2001) documented at least one 4-
14
week period in which estimated use of habitats outside YNP exceeded 40% of total use, and
during December, 2000, exogenous habitats received an estimated 68% of total use. Second,
the importance of habitats outside YNP varies among years. Major movements out of YNP
in response to severe conditions were reported for pronghorns during the winters of 1897,
1908, 1910, 1911, 1917, 1939, 1968, and 1985 (Anonymous 1897, 1910; Lindsley 1897;
Superintendent 1910, 1911; Murie 1940; Barmore 1970; Singer 1988). Although many of
these movements took place before the park boundary was moved to include the BLA in
1932, there is little doubt that habitats outside the park remain vital in some years. Barmore
(1970) indicated that all but 40 of an estimated 210 pronghorns left the park during the severe
winter of 1967–1968, and that “[t]his exodus plus associated [42%] reduction in herd size
emphasizes the current importance of lands outside the park to the herd's maintenance and
wellbeing." Singer (1988) similarly wrote that,
“In November–December of 1985, about 90% of the pronghorn herd migrated north of
Yellowstone National Park due to heavy snows. Antelope remained out of the park for
about three weeks until the snows began to melt. These migrations out of the park
have occurred at periodic intervals (Scott 1987), and the movements may be critical to
the herd's long-term survival (Barmore 1981; Houston 1982:168).”
Recent habitat changes outside YNP have not been thoroughly studied or
documented, but may have affected pronghorn distributions and habitat use patterns. During
1981–1988, there was a net gain of 190 acres of irrigated land available to wildlife on the
RTR (Francis 1987). Affected areas included Cutler Meadow (100 irrigated acres added in
1982), Beattie Gulch Meadows (45 irrigated acres added in 1985), and Electric Meadow (50
15
irrigated acres added in 1987 or 1988) (Francis 1987; Chris Kelley, The Church Universal
and Triumphant [CUT], pers. commun.). Changes other than irrigation also occurred. For
example, Singer (1988) observed that, "[i]n 1983, the [Royal Teton Ranch] plowed and
reseeded two fields near Spring Creek, to which 20–25 antelope were attracted each
summer.” Subsequent complaints from the RTR resulted in pronghorn damage control hunts
beginning in 1985 (see Demographics and Management).
Recent monitoring has included efforts to assess habitat use patterns on lands outside
YNP. Of the 42% of pronghorn use-days observed outside YNP during 1996–1997, 43%
were in irrigated hay or fenced pastures, 35% were in grass/shrub habitats, and 22% were in
grass/forb communities (Caslick and Caslick 1997). Of the 43% of the use observed in
irrigated hay or fenced pastures, most presumably was in fenced pasture, as it was later
reported that observations over multiple years consistently indicated little use of cultivated or
irrigated croplands, and continued use of grass/shrub and grass/forb habitats (Caslick and
Caslick 1998, 1999, 2000). These findings underscore the importance of pronghorn winter
habitats outside YNP, but provide no information about pronghorn use of such habitats
during other seasons. Also, the various analyses by Caslick and Caslick did not consider
habitat availability and, therefore, do not support inferences about habitat preference or
selection.
In addition to documenting habitat use patterns, Caslick and Caslick (1997)
considered effects of bison management activities on pronghorn winter distributions. They
noted that during “times of high human activity, pronghorns were strikingly absent from the
entire [Stephens Creek] area, for at least one-half mile around the corrals" (Caslick and
Caslick 1997). Their observation is similar to earlier comments regarding effects of trapping
16
on pronghorn distributions. Following trapping during the fall of 1946, for example, “many
of the pronghorns moved to other range sectors where they remained for several weeks,” and
some “were reported to be in an area several miles north of the usual range” (Anonymous
1946). An important difference, however, is that trapping in 1946 was directed at reducing
pronghorns, not bison. Caslick and Caslick (2000, 2001) further suggested that increased use
of Beattie Gulch by hunters, following public acquisition of that area, might have displaced
pronghorns from sage habitats west of the park boundary at Reese Creek.
Observations also suggest that pronghorn distributions on winter ranges in or near
YNP may have shifted over time. Caslick and Caslick (2000) reported that, for six
consecutive winters and in contrast to reported distributions during the 1960s, pronghorns
were not observed on Target Flats or the northern slopes of McMinn Bench before mid-
March. Barmore (1981:Table 105) confirmed that this general area was used regularly by
wintering pronghorns for over a century. Caslick and Caslick (1999:6) also commented on
the lack of recent pronghorn sightings north of the Yellowstone River, noting that “in the
1960s a few were seen outside Yellowstone in the vicinity of Gardiner airport and west of
Bear Creek.” Murie (1940:87) similarly reported pronghorn sightings “on the bench lands
outside the park north of the Yellowstone River in the vicinity of Bear Creek,” but noted that
“[i]t was unusual for this species to be found here even though the range is better than within
the park." It is unclear, therefore, whether pronghorn distributions in the Bear Creek area
have changed appreciably.
In 1989 an advisory committee was convened to advise YNP on pronghorn research
and management. The committee recommended 2 major lines of research regarding habitat
use (Anonymous 1990): (1) determine the quantity and quality of food and cover needed by
17
pronghorns, and (2) measure the quantity and quality of food and cover available to
pronghorns. Results are pending from a study of pronghorn winter habitat use begun in
2000 under the direction of Dr. R. A. Garrott, Montana State University. Other research
proposed by the committee generally has not been pursued, including recommended studies
of yearlong food preferences and availability, interspecific dietary overlap, interannual
differences in food habits, nutritive values of major forage species, distributions of critical
cover (e.g., fawning areas), yearlong habitat use and selection, habitat classification and
mapping, long-term trends in vegetation cover and production, and effects of humans and
other species on pronghorn habitat use patterns (Anonymous 1990).
DEMOGRAPHICS AND MANAGEMENT
Overview
Information regarding pronghorn counts, population estimates, and artificial removals
during 1877–2001 is summarized in Appendix A. In developing this summary I relied
heavily on Barmore’s (1981:Table 105) compilation, with some corrections and additions.
Dr. M. D. Scott also updated Barmore’s (1981) compilation, apparently reexamining many of
the original sources and locating additional information. But details of Scott’s work are
known only from a digital spreadsheet (Scott 1994) that contains no written summary and
does not reference sources, making it difficult to judge the quality of Scott’s (1994)
information. Apparent population trends were broadly comparable, regardless of who
compiled the data. However, differences in details affect the amount of “noise” around those
trends, a fact that has important implications for viability analyses (see Population Viability,
below).
Counts, estimates, and removal data are summarized in the following sections. These
18
should be interpreted cautiously. For example, I uncovered “counts” for 1889 and 1890, and
evidence of artificial removals in 1949–1950 that were not included in the compilations of
Barmore (1981) or Scott (1994), and I expect that further work would yield additional
information. Also, none of the estimates or counts can be regarded as unbiased or
statistically rigorous. In many cases they are not even strictly comparable, either spatially or
temporally. Some counts were conducted during the fall, while many others were conducted
during late-winter or early-spring; some counts included areas outside the park, while others
did not; and some counts were made under poor conditions, causing them to be highly
incomplete (Barmore 1981).
Despite their limitations, I believe the data presented in this section give a useful
indication of long-term pronghorn trends in YNP. Following are detailed discussions of
pronghorn counts and estimates in YNP, interwoven with a timeline of events deemed
important in interpreting the history of this population. I have divided the discussion into 5
time periods that reflect major shifts in park management. I conclude this section with a
discussion of Goodman’s (1996) viability analysis, which has greatly influenced recent
perceptions about the long-term risks faced by this population.
1872–1885
Congress established YNP in 1872. No counts or estimates of pronghorn numbers are
available for this early period, but reports indicate that the park’s population initially
numbered in the thousands (Skinner 1922a, c. 1924). Unfortunately, thousands also were
slaughtered. Angler (1883) wrote that “antelope of the Yellowstone Valley have been nearly
exterminated” and provided figures indicating that over 12,000 pronghorn skins were shipped
from Bozeman in 1874 alone. Focusing on pronghorns in YNP, Skinner (c. 1924:7) wrote
19
that “[f]rom 1872 to 1883 it is reported that antelopes were killed each year in the park ‘by
the thousands.’” By 1883, the slaughter of antelope had abated, “but this [was] the result
more of the scarcity of the game than of any respect felt by the skin hunters” (Anonymous
1883b). By order of the Secretary of the Interior, hunting in the park was prohibited in 1883
(Anonymous 1883a), “but considerable market hunting apparently continued until an
ineffective and understaffed civilian administration was replaced by the U.S. Army in the
summer of 1886” (Houston 1982:11). During this same period, both hunting and poisoning
impacted predator populations. “Wolves and coyotes were reported abundant in 1870, but
scarce in 1880 because of poisoning activities” (Murie 1940:11).
1886–1917
Arriving in 1886, the U.S. Army provided the first real protection for wildlife in
YNP. Park policy toward pronghorns during this period was clearly aimed at increasing
population size. Tactics for doing so evolved over time, but focused on limiting predation
and providing supplemental feed.
Efforts to limit predation on pronghorns took various forms. Initially, the Army
focused on enforcing the prohibition against hunting in the park. Also, by 1887, soldiers
were herding pronghorns back into the park to prevent them from being killed in areas north
of the boundary (Anonymous 1887a,b). In addition to limiting predation by humans, the
Army took an increasingly active role in predator control, but attitudes varied greatly among
years. Murie (1940:12) reported that “Supt. Moses Harris in his annual report of 1887 was
not greatly concerned over the depredations of predators.” By 1889, however, “the new
Superintendent, Capt. F. A. Boutelle, recommended control of predators” (Murie 1940:12).
In 1896, Superintendent Anderson ordered some coyotes killed, but apparently limited the
20
scope of that order (Murie 1940:13). In 1899, the annual report (cited in Murie 1940:14)
stated that poisoning “will be tried during the winter,” but the following year (1900)
Superintendent George W. Goode “appeared to be little concerned about coyote predation”
(Murie 1940:14). By 1905, however, a long-term coyote control program was in place that
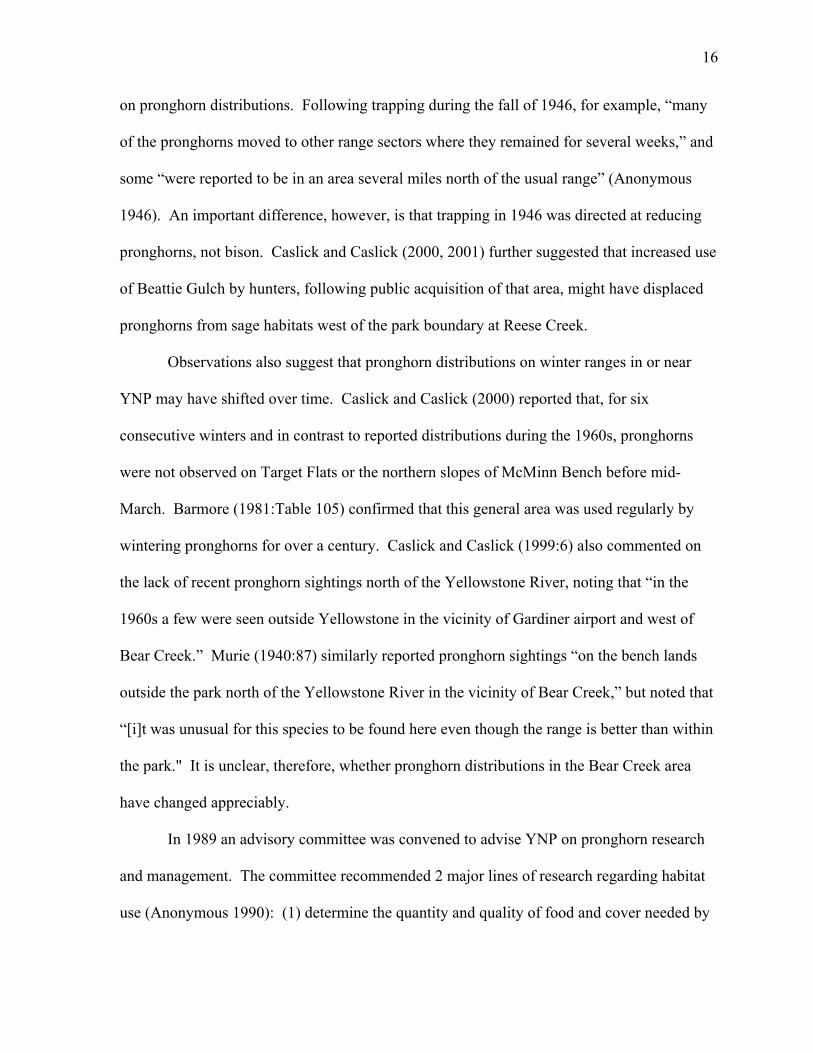
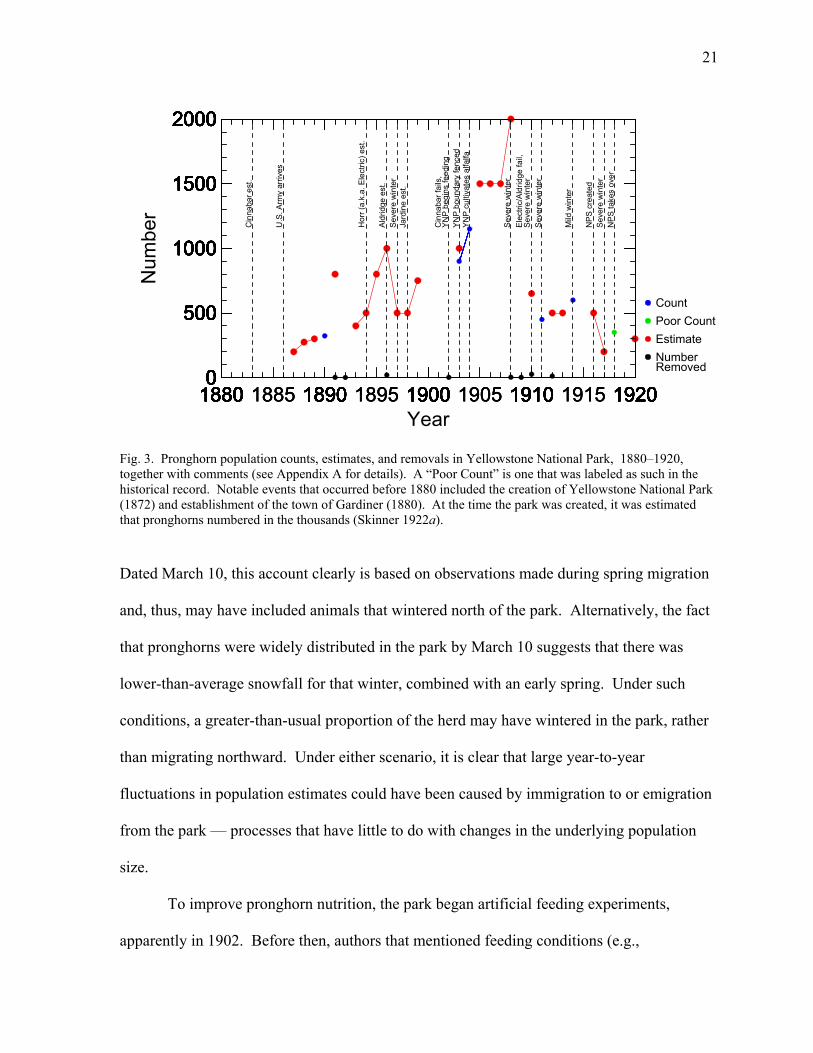
included shooting, trapping, and poisoning (Fig. 3) (Pitcher 1905, Anonymous 1910,
Lindsley 1922, Murie 1940:14–15).
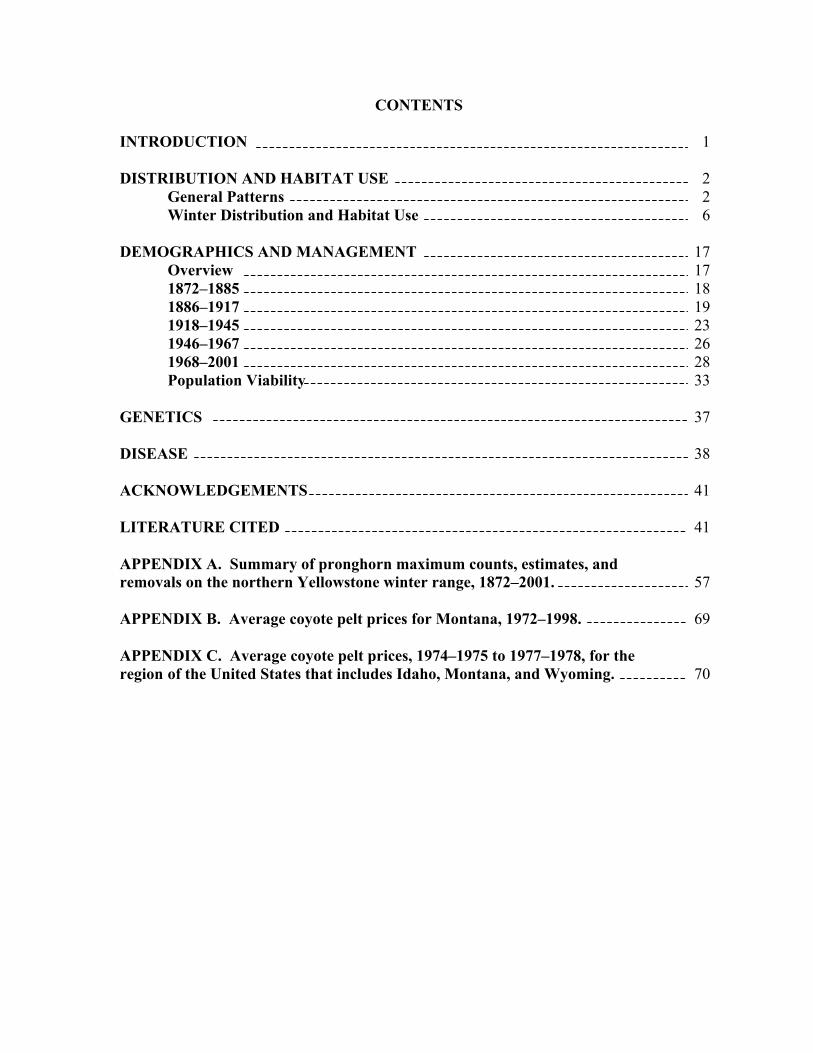
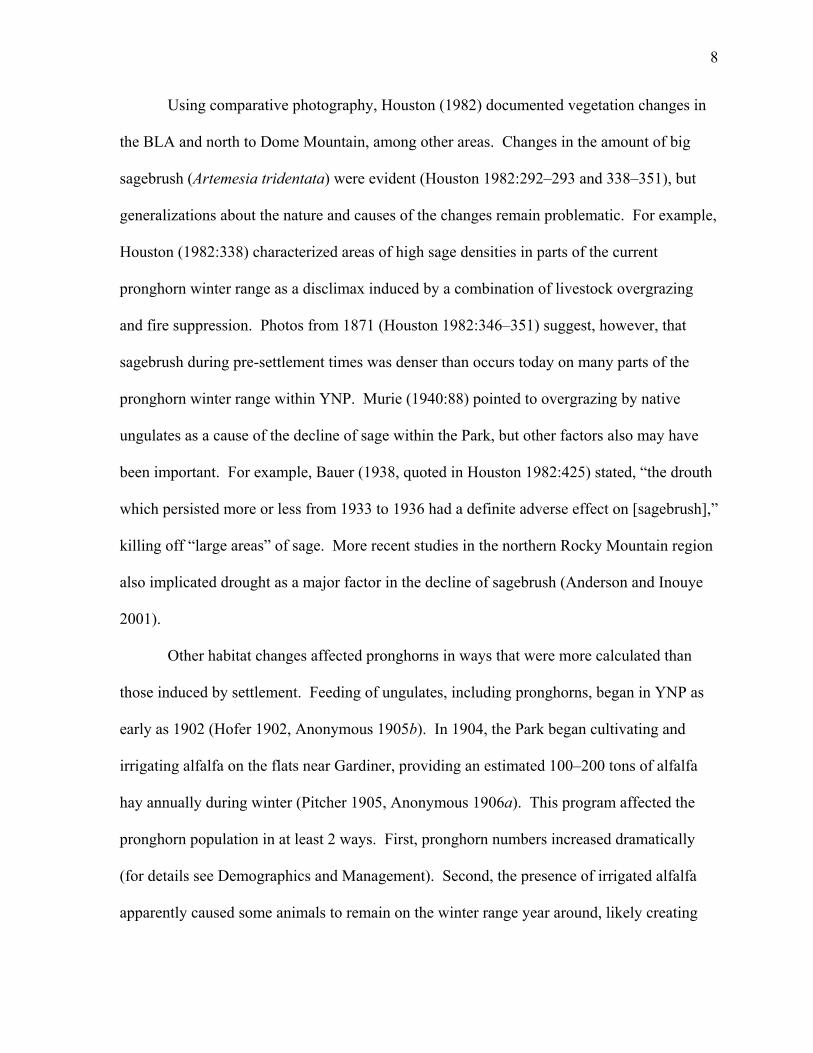
Counts and population estimates from the late 1800s, together with anecdotal
assessments, suggest the pronghorn population increased almost immediately after the Army
began protecting park wildlife in 1886 (Fig. 3) (Appendix A). Records indicate an increase
from an estimated 200 animals in 1887 to a minimum count of 323 in 1890 (Anonymous
1887a; Hofer 1889a, 1890), while Skinner (1922a:92) described the population as
“[n]umerous, and on the increase” by 1891. Thereafter and until 1900, estimates ranged
between about 500 and 1,000 animals, with peaks of 700–1,000 animals in 1891, 1896, and
1899 (Fig. 3, Appendix A).
Although Army protection undoubtedly led to increased pronghorn numbers, a
detailed interpretation of pre-1900 estimates is greatly confounded by lack of population
closure, as historical migration patterns probably had not been eliminated by then. Consider,
for example, the 1891 estimate of ≥800 animals due to Hofer (1891b), who wrote:
"There are about 250 antelope on the flat across Gardiner River from the town.
Several large bands are on the hillsides between Hellroaring and Slough Creek.
Others are about Junction Butte and the Blacktail country. There cannot be less than
800 antelope in the Park."
21
1880 1885 1890 1895 1900 1905 1910 1915 19200
500
1000
1500
2000
1880 1885 1890 1895 1900 1905 1910 1915 1920Year
0
500
1000
1500
2000N
umbe
r
1880 1885 1890 1895 1900 1905 1910 1915 19200
500
1000
1500
2000
1880 1890 1900 1910 19200
500
1000
1500
2000
Cin
naba
r est
.
U.S
. Arm
y ar
rives
1880 1890 1900 1910 19200
500
1000
1500
2000
Hor
r (a.
k .a.
Ele
ctric
) est
.
Aldr
idg e
est
.
1880 1890 1900 1910 19200
500
1000
1500
2000
Seve
re w
inte
rJa
r din
e es
t.1880 1890 1900 1910 19200
500
1000
1500
2000
Cin
naba
r fai
ls,
YNP
beg
ins
feed
ing
YNP
bou
ndar
y fe
nced
1880 1890 1900 1910 19200
500
1000
1500
2000
YNP
cu l
tivat
es a
lfalf a
S eve
re w
inte
r
1880 1890 1900 1910 19200
500
1000
1500
2000
Elec
tric/
Ald
ridg e
fail,
Seve
re w
inte
rSe
v ere
win
ter
1880 1890 1900 1910 19200
500
1000
1500
2000
Mild
wi n
ter
1880 1890 1900 1910 19200
500
1000
1500
2000
NPS
cre
ated
Seve
r e w
inte
r
1880 1890 1900 1910 19200
500
1000
1500
2000
NPS
take
s ov
er
1880 1890 1900 1910 19200
500
1000
1500
2000
CountPoor CountEstimateNumberRemoved
Fig. 3. Pronghorn population counts, estimates, and removals in Yellowstone National Park, 1880–1920, together with comments (see Appendix A for details). A “Poor Count” is one that was labeled as such in the historical record. Notable events that occurred before 1880 included the creation of Yellowstone National Park (1872) and establishment of the town of Gardiner (1880). At the time the park was created, it was estimated that pronghorns numbered in the thousands (Skinner 1922a).
Dated March 10, this account clearly is based on observations made during spring migration
and, thus, may have included animals that wintered north of the park. Alternatively, the fact
that pronghorns were widely distributed in the park by March 10 suggests that there was
lower-than-average snowfall for that winter, combined with an early spring. Under such
conditions, a greater-than-usual proportion of the herd may have wintered in the park, rather
than migrating northward. Under either scenario, it is clear that large year-to-year
fluctuations in population estimates could have been caused by immigration to or emigration
from the park — processes that have little to do with changes in the underlying population
size.
To improve pronghorn nutrition, the park began artificial feeding experiments,
apparently in 1902. Before then, authors that mentioned feeding conditions (e.g.,
22
Anonymous 1887a, Hofer 1887b, Anonymous 1901) consistently failed to mention artificial
feeding. In 1902, however, “[a]s a matter of experiment...a few bales of alfalfa hay were
scattered about the parade ground" (Anonymous 1905b), and a Field and Stream article
stated that “Major Pitcher will feed the antelope when they require it” (Hofer 1902). This
program expanded quickly. In the summer of 1904, YNP planted and irrigated 50 acres of
alfalfa inside the park near Gardiner, and soon was harvesting about 100 tons/year (Pitcher
1905, Anonymous 1906a). With the additional resources provided by the feeding program,
and in combination with predator control, pronghorn population estimates doubled from
1,000 in 1903 to 2,000 in 1908 (Fig. 3). Barmore (1981:88) wrote that "[e]stimates of 1,000–
2,000 [pronghorn] between 1903 and 1908 probably refer to summer rather than winter
populations, which were apparently half or less as large." His interpretation is contradicted,
however, by first-hand accounts clearly indicating that these were the numbers of animals
that wintered in the park, and that access to traditional wintering areas down the Yellowstone
Valley had, by this time, been largely cut off (see Anonymous 1904, 1905a, 1905b, 1906a,
1906b; Pitcher 1905).
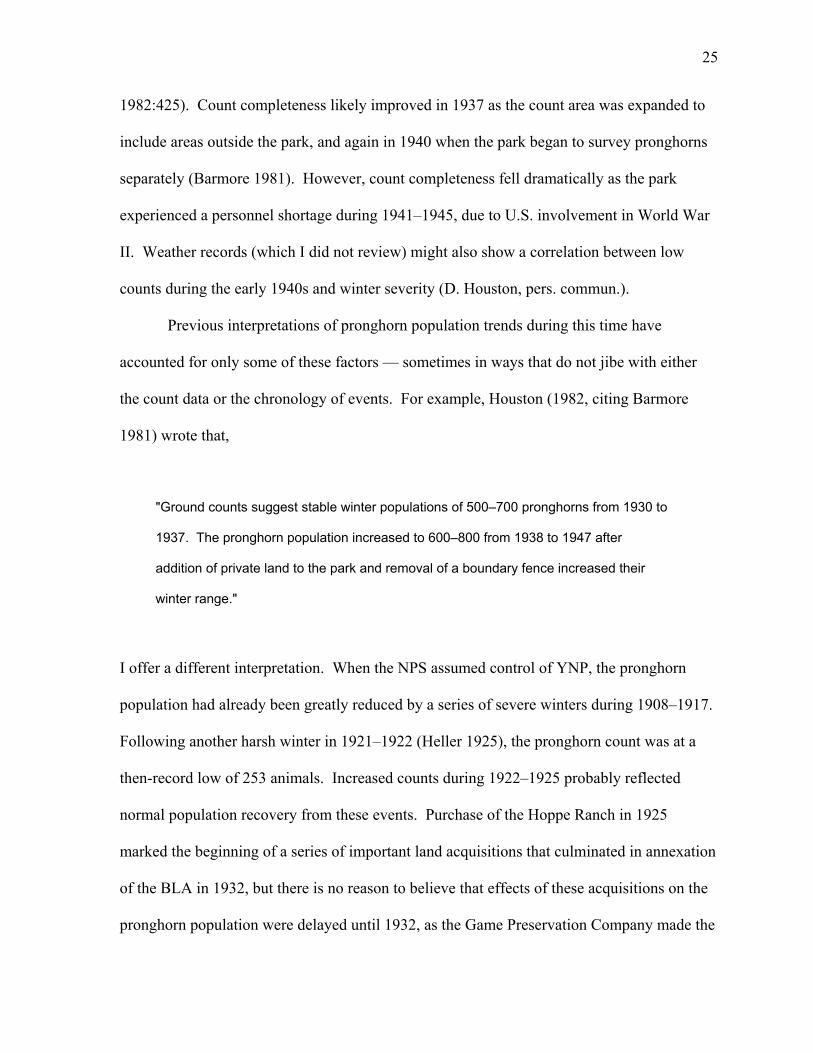
The alfalfa-fed increase in the pronghorn population ended abruptly with a series of
harsh winters (Nelson 1925). Because of ambiguities in some accounts, I found it difficult
to be entirely certain of dates and recommend a detailed review of the weather record.
However, severe winters appear to have occurred during 1907–1908, 1909–1910, 1910–
1911, and 1916–1917 (Hofer 1908a; Superintendent 1910, 1911; Anonymous 1910, 1913;
Murie 1940:101, quoting Bailey 1930:30; Barmore 1981:Table 105). As expected,
population counts and estimates tended to decline for these years. For 1907–1908, no decline
was seen. However, the estimate of 2,000 animals apparently was obtained early in the
23
winter and the decline occurred later when “all but 25 escaped through the park fence below
Gardiner and went down to the lower valleys, where at that time they were unprotected, and
many never returned" (Murie 1940:101, quoting Bailey 1930:30).
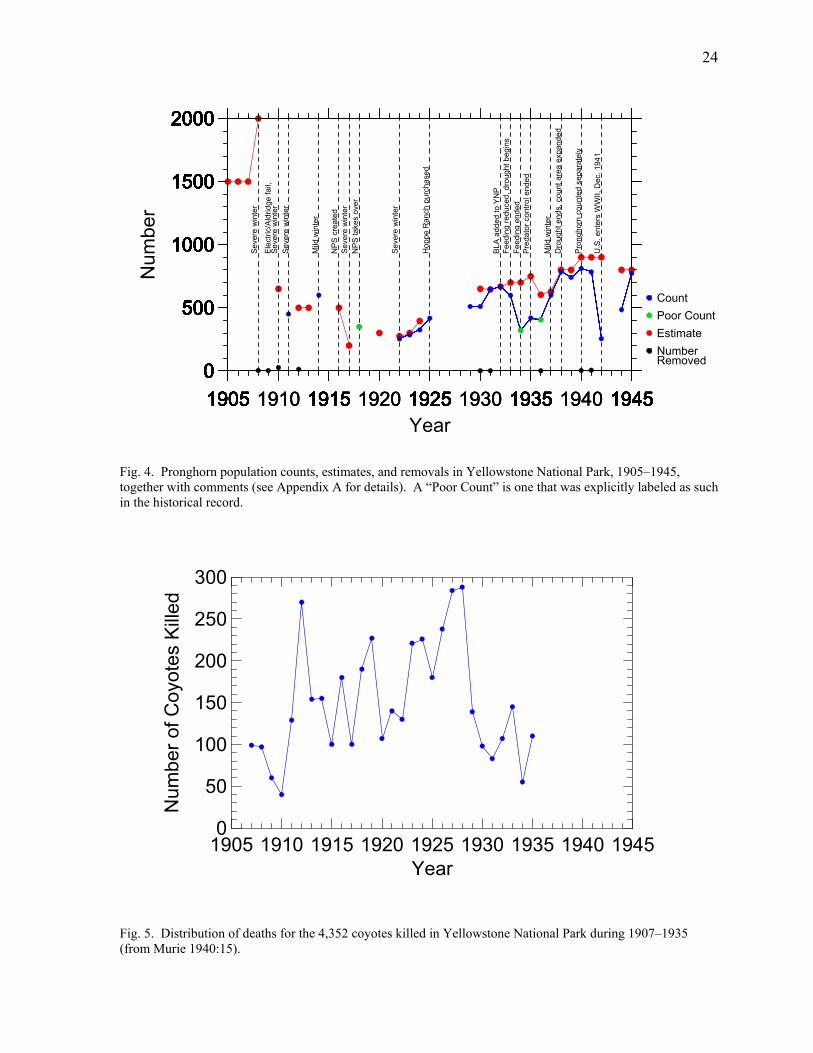
1918–1945
The National Park Service (NPS), newly created in 1916, took control of YNP in
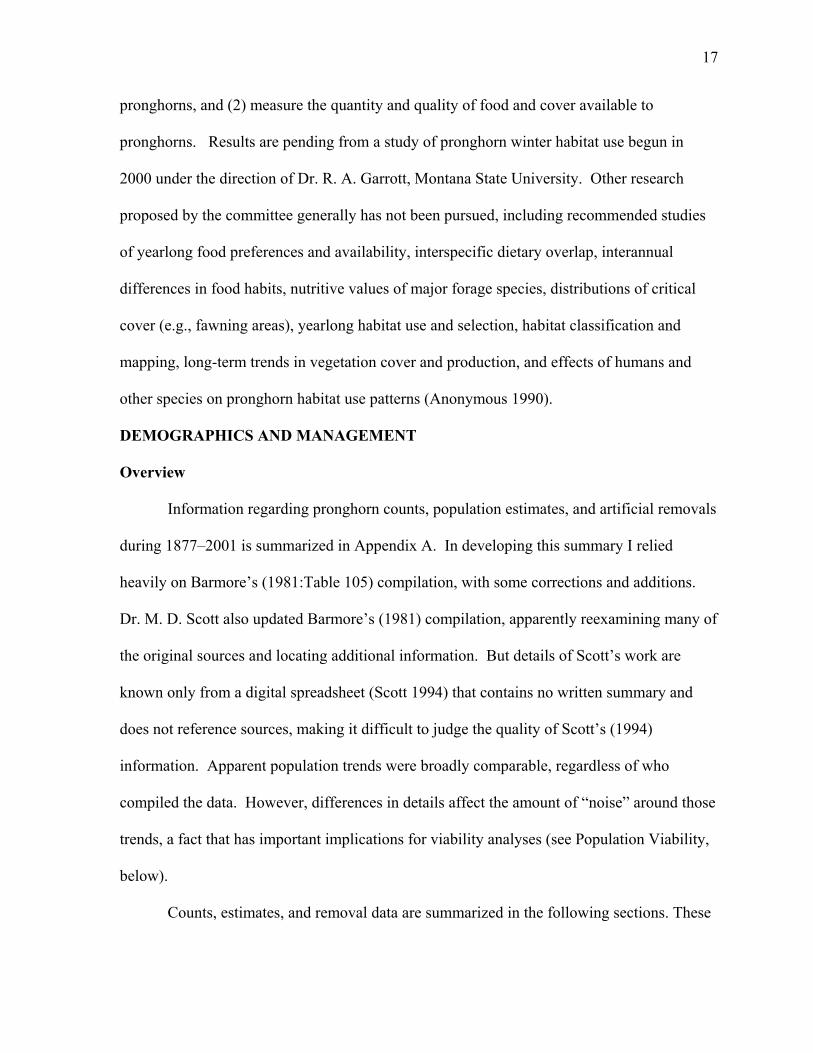
1918 (Anonymous 1997). Pronghorn counts and population estimates remained relatively
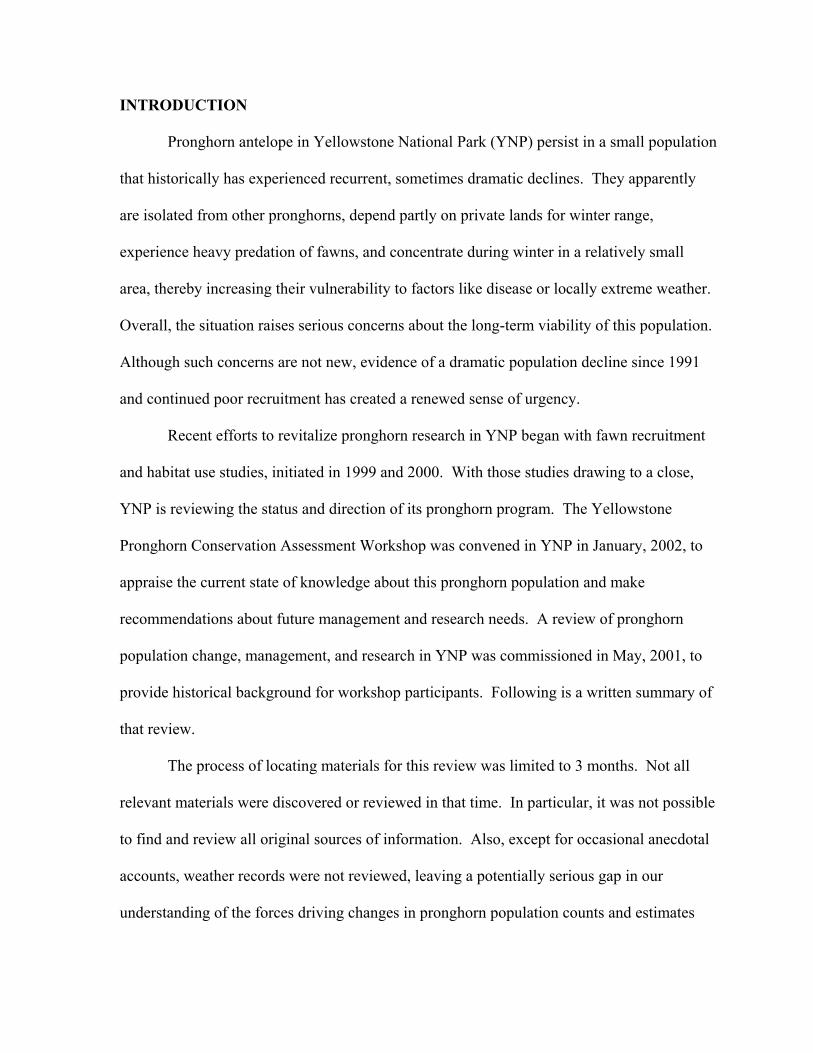
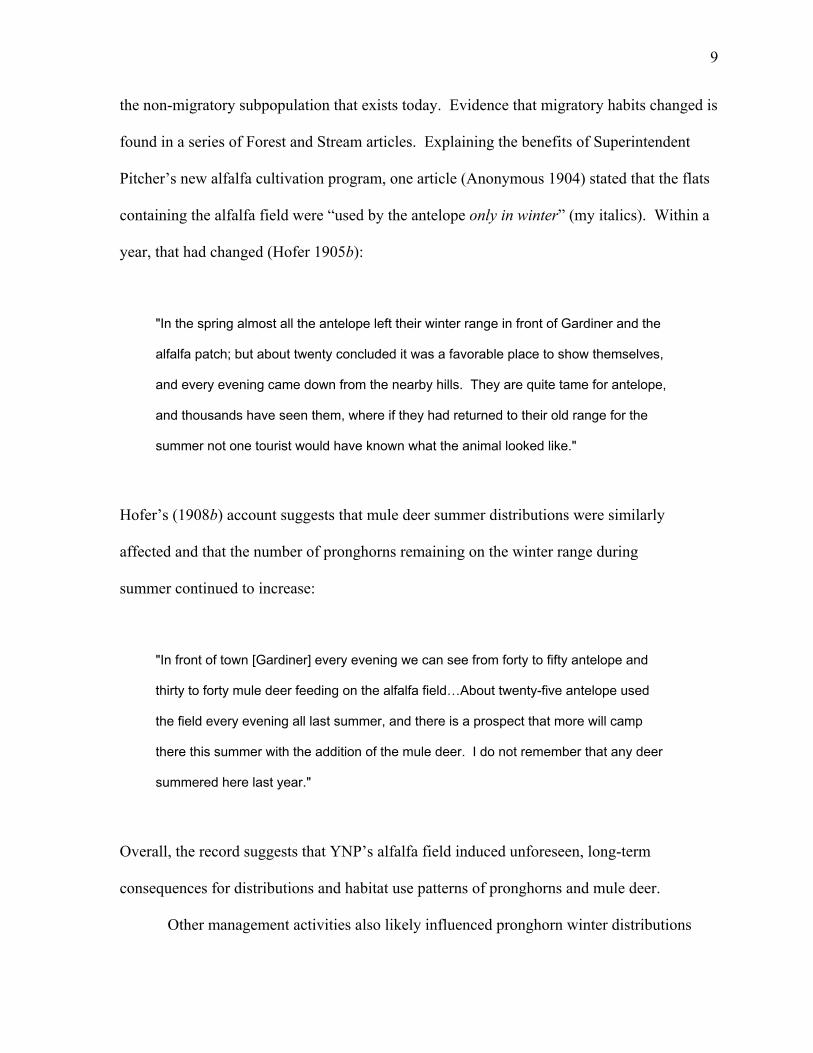
low (<400 animals) for several years thereafter. There was, however, evidence of an increase
during 1922–1925, as counts steadily climbed from 253 to 417 animals (Fig. 4, Appendix A).
Interpretations are confounded by the lack of count data for 1926–1928, but counts increased
from 510 animals in 1929 to 668 in 1932 (Fig. 4, Appendix A), suggesting an overall
increasing trend for the decade 1922–1932. Counts declined during 1934–1936, and
estimates declined during 1936–1937. Counts also were notably low in 1942 and 1944,
although estimates for those same years showed little change.
Interpretations of counts and estimates for this period are confounded by the many
changes, both natural and man-caused, that occurred during this time. The NPS initially
continued the predator control and, presumably, feeding programs begun by the Army (Murie
1940, Fig. 5). Feeding was expanded as important winter ranges were acquired from private
landowners and cultivated starting in 1925 (Whittlesey 1995). These same areas were
annexed to the park as the BLA in 1932 (Whittlesey 1995). In 1933, however, the park
began to phase out artificial feeding, and in 1934 the program was terminated. Predator
control ended in 1935 (Fig. 5). Prolonged drought during the early- to mid-1930s
dramatically affected range condition (Grimm 1937, as quoted by Houston 1982:424–425)
and may have contributed to a decline in big sagebrush (Bauer 1938, as quoted by Houston
24
1905 1910 1915 1920 1925 1930 1935 1940 19450
500
1000
1500
2000
1905 1910 1915 1920 1925 1930 1935 1940 1945Year
0
500
1000
1500
2000N
umbe
r
1905 1910 1915 1920 1925 1930 1935 1940 19450
500
1000
1500
2000
1905 1915 1925 1935 19450
500
1000
1500
2000
Seve
re w
inte
r
Elec
tric/
Ald
ridge
fail,
Seve
re w
inte
r
1905 1915 1925 1935 19450
500
1000
1500
2000
Seve
re w
inte
r
Mild
win
ter
1905 1915 1925 1935 19450
500
1000
1500
2000
NP
S c r
eate
dSe
vere
win
ter
1905 1915 1925 1935 19450
500
1000
1500
2000
NP
S ta
kes
over
Seve
re w
inte
r1905 1915 1925 1935 19450
500
1000
1500
2000
Hop
pe R
anch
pur
chas
ed
1905 1915 1925 1935 19450
500
1000
1500
2000
BLA
add
ed to
YN
PFe
edin
g re
duce
d, d
roug
ht b
egi n
s
1905 1915 1925 1935 19450
500
1000
1500
2000
Feed
ing
e nde
dPr
edat
or c
ontro
l end
ed
1905 1915 1925 1935 19450
500
1000
1500
2000
Mild
win
t er
Dro
ught
end
s , c
ount
are
a e x
pand
ed
1905 1915 1925 1935 19450
500
1000
1500
2000
Pron
ghor
n co
u nte
d se
para
tely
U.S
. ent
ers
WW
II, D
ec. 1
941
1905 1915 1925 1935 19450
500
1000
1500
2000
CountPoor CountEstimateNumberRemoved
Fig. 4. Pronghorn population counts, estimates, and removals in Yellowstone National Park, 1905–1945, together with comments (see Appendix A for details). A “Poor Count” is one that was explicitly labeled as such in the historical record.
1905 1910 1915 1920 1925 1930 1935 1940 1945Year
0
50
100
150
200
250
300
Num
ber o
f Coy
ote s
Kil l
ed
Fig. 5. Distribution of deaths for the 4,352 coyotes killed in Yellowstone National Park during 1907–1935 (from Murie 1940:15).
25
1982:425). Count completeness likely improved in 1937 as the count area was expanded to
include areas outside the park, and again in 1940 when the park began to survey pronghorns
separately (Barmore 1981). However, count completeness fell dramatically as the park
experienced a personnel shortage during 1941–1945, due to U.S. involvement in World War
II. Weather records (which I did not review) might also show a correlation between low
counts during the early 1940s and winter severity (D. Houston, pers. commun.).
Previous interpretations of pronghorn population trends during this time have
accounted for only some of these factors — sometimes in ways that do not jibe with either
the count data or the chronology of events. For example, Houston (1982, citing Barmore
1981) wrote that,
"Ground counts suggest stable winter populations of 500–700 pronghorns from 1930 to
1937. The pronghorn population increased to 600–800 from 1938 to 1947 after
addition of private land to the park and removal of a boundary fence increased their
winter range."
I offer a different interpretation. When the NPS assumed control of YNP, the pronghorn
population had already been greatly reduced by a series of severe winters during 1908–1917.
Following another harsh winter in 1921–1922 (Heller 1925), the pronghorn count was at a
then-record low of 253 animals. Increased counts during 1922–1925 probably reflected
normal population recovery from these events. Purchase of the Hoppe Ranch in 1925
marked the beginning of a series of important land acquisitions that culminated in annexation
of the BLA in 1932, but there is no reason to believe that effects of these acquisitions on the
pronghorn population were delayed until 1932, as the Game Preservation Company made the
26
lands available for park use immediately after purchase (Whittlesey 1995). Pronghorn
carrying capacity may have increased somewhat in 1933 as fences and buildings in the BLA
were razed (Anonymous 1934, 1936), but many of the benefits of annexing the BLA likely
accrued during 1925–1932 as the lands were purchased. Overall, I suggest that increased
pronghorn counts during 1925–1932 were fueled, at least in part, by: (1) continued
population recovery from the series of harsh winters, (2) increased winter range availability,
and (3) continued feeding and predator control programs. Weather records during this period
should be reviewed for additional explanatory variables. Pronghorn counts and estimates
dipped during 1933–1937 (Fig. 4). Although counts in 1934 and 1936 were considered poor,
I note that this was a period of severe drought on the northern Yellowstone winter range
(Grimm 1937, as quoted by Houston 1982:424–425). Given negative effects of drought on
big sagebrush (Anderson and Inouye 2001) and the importance of sage to wintering
pronghorns, it is reasonable to suggest that the drought negatively affected pronghorn
numbers. Interpretations regarding the post-drought population are confounded by changes
in counting protocols (Fig. 4, Appendix A), but it seems likely that, during 1938–1945, the
population was relatively stable at a size equal to or, perhaps, somewhat greater than its pre-
drought level. The observed decline in pronghorn counts during World War II was likely due
to reduced observer effort rather than a real decline in the underlying pronghorn population,
although a detailed review of the weather record might alter this interpretation somewhat.
1946–1967
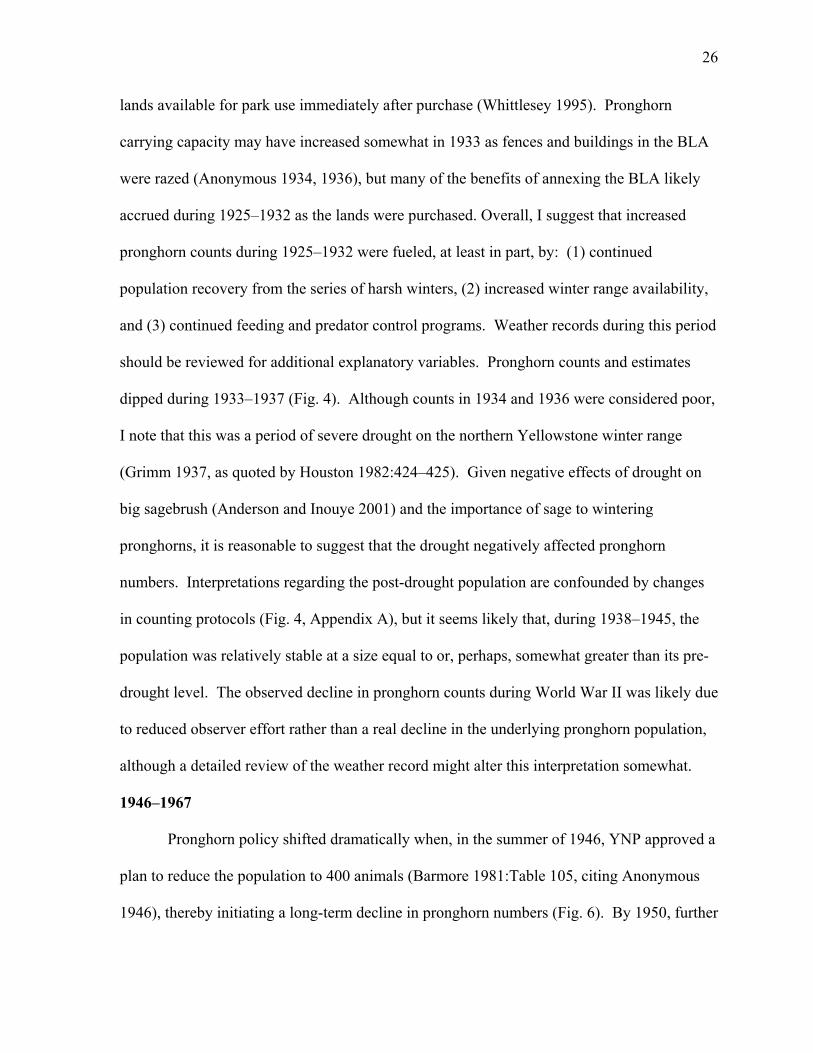
Pronghorn policy shifted dramatically when, in the summer of 1946, YNP approved a
plan to reduce the population to 400 animals (Barmore 1981:Table 105, citing Anonymous
1946), thereby initiating a long-term decline in pronghorn numbers (Fig. 6). By 1950, further
27
1935 1940 1945 1950 1955 1960 1965 1970 19750
500
1000
1500
2000
1935 1940 1945 1950 1955 1960 1965 1970 1975Year
0
500
1000
1500
2000N
umbe
r
1935 1940 1945 1950 1955 1960 1965 1970 19750
500
1000
1500
2000
1935 1945 1955 1965 19750
500
1000
1500
2000
Mild
win
ter
Dro
ught
end
s, c
oun t
are
a ex
pand
ed
1935 1945 1955 1965 19750
500
1000
1500
2000
Pron
ghor
n co
unte
d se
para
tely
1935 1945 1955 1965 19750
500
1000
1500
2000
U.S
. ent
ers
WW
II, D
ec. 1
941
WW
II en
ds
1935 1945 1955 1965 19750
500
1000
1500
2000
Red
uct io
n to
400
ap p
rove
d
Red
uctio
n to
200
reco
mm
ende
d
1935 1945 1955 1965 19750
500
1000
1500
2000
Red
uctio
ns e
nded
(fal
l 196
7),
Seve
re w
inte
r
CountPoor CountEstimateNumberRemoved
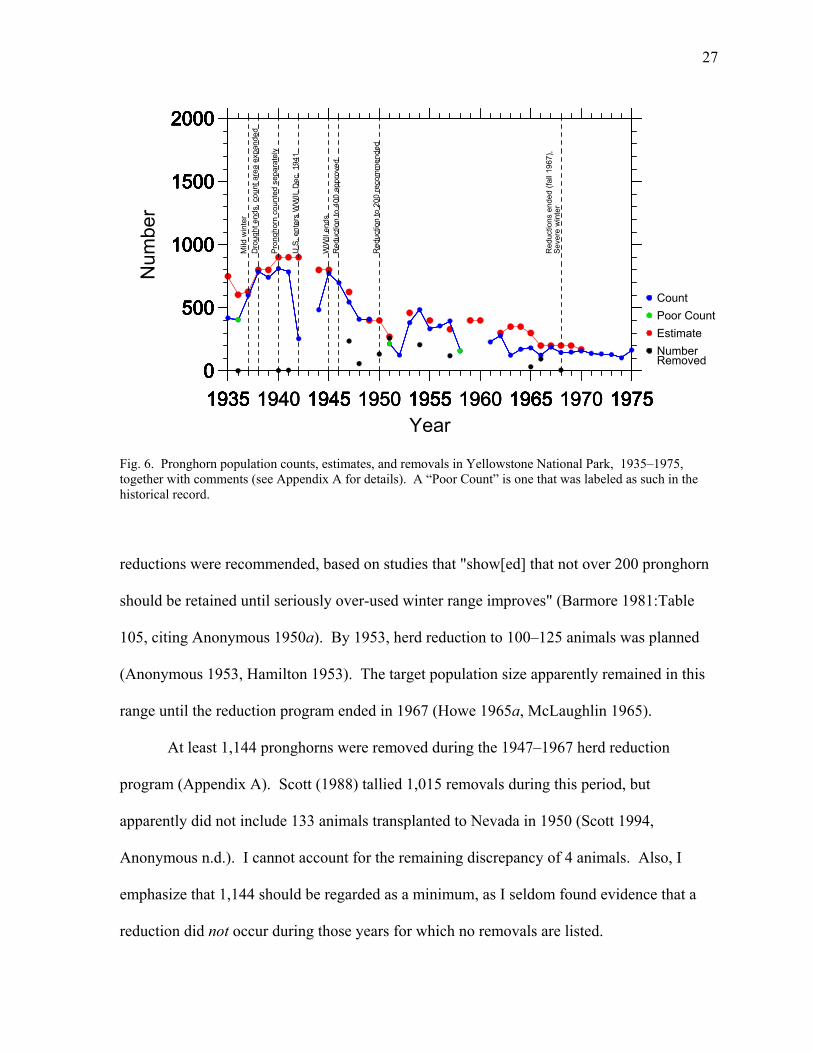
Fig. 6. Pronghorn population counts, estimates, and removals in Yellowstone National Park, 1935–1975, together with comments (see Appendix A for details). A “Poor Count” is one that was labeled as such in the historical record.
reductions were recommended, based on studies that "show[ed] that not over 200 pronghorn
should be retained until seriously over-used winter range improves" (Barmore 1981:Table
105, citing Anonymous 1950a). By 1953, herd reduction to 100–125 animals was planned
(Anonymous 1953, Hamilton 1953). The target population size apparently remained in this
range until the reduction program ended in 1967 (Howe 1965a, McLaughlin 1965).
At least 1,144 pronghorns were removed during the 1947–1967 herd reduction
program (Appendix A). Scott (1988) tallied 1,015 removals during this period, but
apparently did not include 133 animals transplanted to Nevada in 1950 (Scott 1994,
Anonymous n.d.). I cannot account for the remaining discrepancy of 4 animals. Also, I
emphasize that 1,144 should be regarded as a minimum, as I seldom found evidence that a
reduction did not occur during those years for which no removals are listed.
28
1968–2001
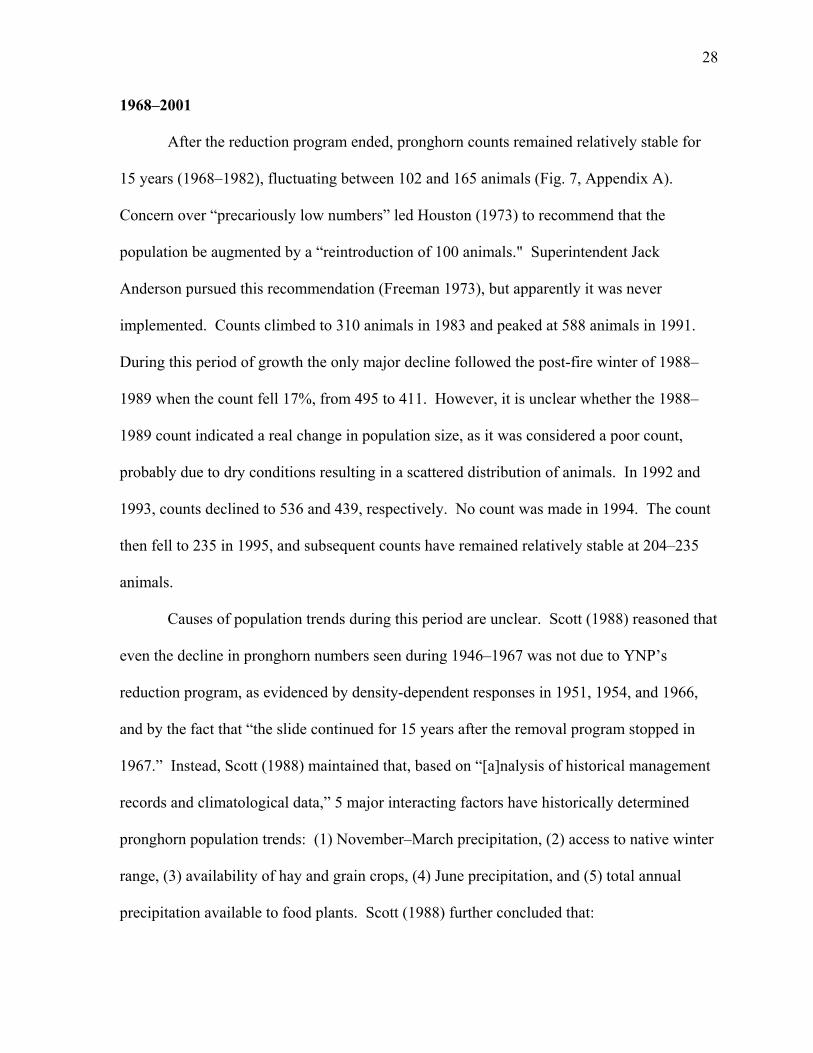
After the reduction program ended, pronghorn counts remained relatively stable for
15 years (1968–1982), fluctuating between 102 and 165 animals (Fig. 7, Appendix A).
Concern over “precariously low numbers” led Houston (1973) to recommend that the
population be augmented by a “reintroduction of 100 animals." Superintendent Jack
Anderson pursued this recommendation (Freeman 1973), but apparently it was never
implemented. Counts climbed to 310 animals in 1983 and peaked at 588 animals in 1991.
During this period of growth the only major decline followed the post-fire winter of 1988–
1989 when the count fell 17%, from 495 to 411. However, it is unclear whether the 1988–
1989 count indicated a real change in population size, as it was considered a poor count,
probably due to dry conditions resulting in a scattered distribution of animals. In 1992 and
1993, counts declined to 536 and 439, respectively. No count was made in 1994. The count
then fell to 235 in 1995, and subsequent counts have remained relatively stable at 204–235
animals.
Causes of population trends during this period are unclear. Scott (1988) reasoned that
even the decline in pronghorn numbers seen during 1946–1967 was not due to YNP’s
reduction program, as evidenced by density-dependent responses in 1951, 1954, and 1966,
and by the fact that “the slide continued for 15 years after the removal program stopped in
1967.” Instead, Scott (1988) maintained that, based on “[a]nalysis of historical management
records and climatological data,” 5 major interacting factors have historically determined
pronghorn population trends: (1) November–March precipitation, (2) access to native winter
range, (3) availability of hay and grain crops, (4) June precipitation, and (5) total annual
precipitation available to food plants. Scott (1988) further concluded that:
29
1965 1970 1975 1980 1985 1990 1995 2000 20050
500
1000
1500
2000
1965 1970 1975 1980 1985 1990 1995 2000 2005Year
0
500
1000
1500
2000N
umbe
r
1965 1970 1975 1980 1985 1990 1995 2000 20050
500
1000
1500
2000
1965 1975 1985 1995 20050
500
1000
1500
2000
Mild
win
ter
1965 1975 1985 1995 20050
500
1000
1500
2000
Red
uctio
ns e
nded
(fal
l 196
7),
Seve
re w
inte
r
RTR
bo u
ght b
y C
UT ,
fall
1981
; sh e
ep a
nd10
0 irr
igat
ed a
cres
add
ed, C
utle
r Mea
dow
1965 1975 1985 1995 20050
500
1000
1500
2000
Sprin
g C
r. fie
lds
res e
eded
RTR
irr ig
atio
n, B
eatt i
e G
ulch
Mea
dow
, 45
acre
s
1965 1975 1985 1995 20050
500
1000
1500
2000
RTR
buc
k-an
d-po
le fe
nce;
dam
age
h unt
s be
gin
RTR
irrig
a tio
n, E
lect
ric M
eado
w, 5
0 a c
res
1965 1975 1985 1995 20050
500
1000
1500
2000
Seve
re, p
ost-f
i re w
inte
r
H.D
. 313
cre
ated
, fal
l 199
1, 2
5 pe
rmits
/yr
1965 1975 1985 1995 20050
500
1000
1500
2000
Wol
ves
rein
trodu
ced
H. D
. 313
mod
ifed,
fall
1995
, 5 p
erm
its/y
r
1965 1975 1985 1995 20050
500
1000
1500
2000
Land
sw
ap w
ith R
TR
CountPoor CountEstimateNumberRemoved
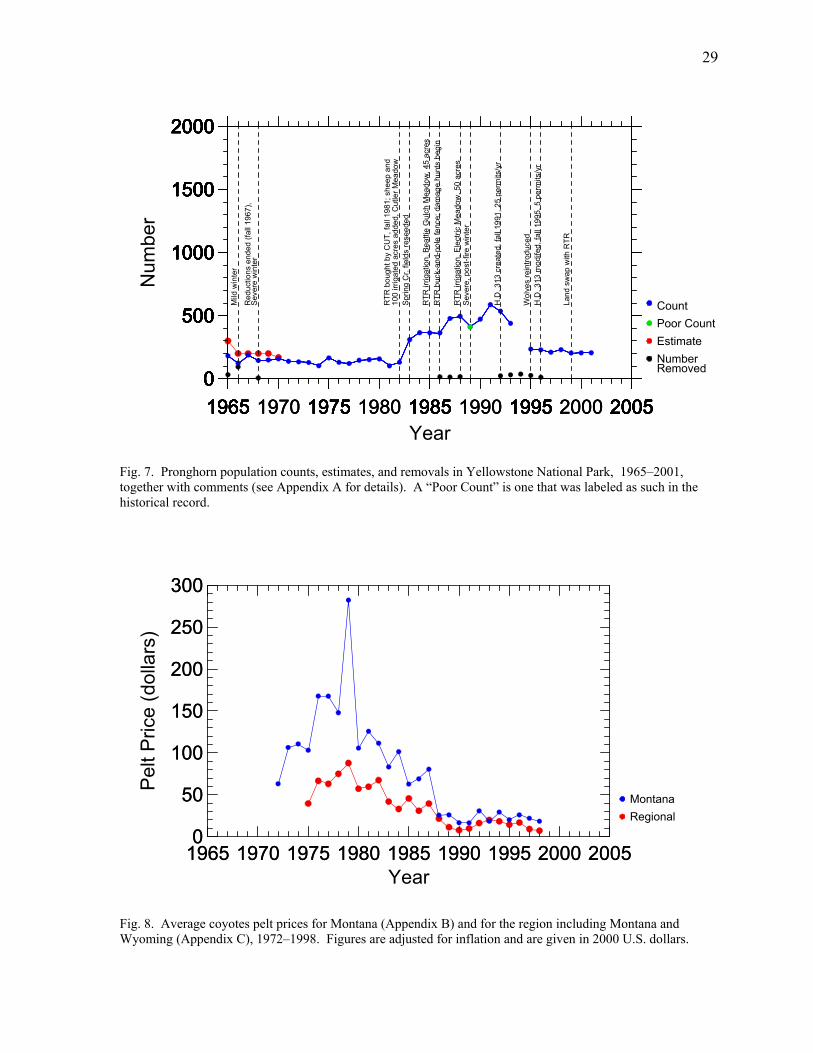
Fig. 7. Pronghorn population counts, estimates, and removals in Yellowstone National Park, 1965–2001, together with comments (see Appendix A for details). A “Poor Count” is one that was labeled as such in the historical record.
1965 1970 1975 1980 1985 1990 1995 2000 20050
50
100
150
200
250
300
1965 1970 1975 1980 1985 1990 1995 2000 2005Year
0
50
100
150
200
250
300
Pel
t Pric
e (d
olla
rs)
MontanaRegional
Fig. 8. Average coyotes pelt prices for Montana (Appendix B) and for the region including Montana and Wyoming (Appendix C), 1972–1998. Figures are adjusted for inflation and are given in 2000 U.S. dollars.
30
“When three or more of these five factors were favorable for a number of consecutive
years, the herd increased or maintained a high population level. When three or more
factors were neutral or unfavorable, the herd declined or maintained a low population
level. During any given time period, only one limiting factor may have been most
decisive.”
Unfortunately, Scott’s (1988) results are known only from a 1-page abstract; thus, his data
and methods, as well as details of his reasoning are beyond meaningful review. Because an
analysis of weather data was beyond the scope of this review, I did not attempt to
independently test Scott’s conclusions, but do recommend further study of possible
relationships between population trend and weather.
Another hypothesis regarding population trend is that numbers began to increase in
1983 due to increased predator control near the park boundary, prompted by high pelt prices
(J. Mack, NPS, pers. commun.). According to this hypothesis, pronghorn counts should be
positively correlated with coyote pelt prices, perhaps with some reasonable time lag.
However, pelt prices began to climb by at least 1973 and peaked in 1979 (Fig. 7), 4–l0 years
before pronghorn counts began to increase. Visual comparison of Figs. 7 and 8 suggests that,
although trends in pelt prices and pronghorn counts share a similar overall shape, the
chronology of pelt prices is roughly 10 years ahead of the chronology of pronghorn counts.
Given the reproductive potential of both coyotes and pronghorns, it is difficult to imagine a
biological explanation for such a time lag. However, it is possible that prolonged control
may have been necessary before an effect was evident. Also, the RTR ran domestic sheep
from 1982 until the early- to mid-1990s, and with the sheep came opportunistic control of
31
coyotes (C. Kelley, CUT, pers. commun.). Thus, RTR activities may have influenced coyote
densities near the park boundary, independently of pelt prices.
Land-use changes during 1981–1991 may have increased pronghorn carrying
capacity. The RTR borders YNP north of Reese Creek and contains areas used by a large
part of the pronghorn population at various times of the year (see Distribution and Habitat
Use). The RTR was purchased by CUT in 1981. By 1987, “[t]he total amount of irrigated
fields on the [RTR] available for wildlife winter range use near the Park [was] increased a
total of at least 190 acres” (Francis 1987). Increased irrigation included 100 acres at Cutler
Meadow (added in 1982), 45 acres at Beattie Gulch Meadows (added in 1985), and 50 acres
at Electric Meadow (added c. 1987/1988) (Francis 1987; C. Kelley, CUT, pers. commun.).
In addition, fields near Spring Creek were plowed and reseeded in 1983 (Singer 1988).
Complaints from the RTR resulted in damage control hunts beginning in the fall of 1985, and
suggest that pronghorn use of these habitats may have been substantial. Under this
hypothesis, irrigation of Cutler Meadow is the necessary explanation for increased pronghorn
numbers in 1983 because irrigation had not been expanded to the other areas at that time.
The explanation does not appear to be a viable one, however. Singer (1988:10) reported that
“[i]n the winter of 1985–86 and 1986–87 a small group of 13–15 antelope colonized winter
range on private land near Cutler Lake.” However, I found no record of earlier use and it is
not clear that pronghorn use of Cutler Meadow was substantial enough to account for a large
increase in numbers, as anecdotal accounts have consistently placed most pronghorn use
south of Cinnabar Mtn.
Other events have been suggested, implicitly or explicitly, as possible contributing
factors in the post-1991 decline in pronghorn numbers. These include: (1) wolf
32
reintroduction, (2) fencing of the park’s northern boundary, (3) disturbance associated with
bison management activities, and (4) pronghorn hunting outside the park. The fact that
wolves were not reintroduced to YNP until 1995 (Anonymous 1997) — after pronghorn
numbers had already crashed — clearly absolves wolves of responsibility for the pronghorn
decline. The RTR constructed a buck-and-pole fence along the park boundary in 1986 and
Scott (1992) reported that the fence partially inhibited trans-boundary movements by
pronghorns. However, population counts continued to mostly increase during the 5 years
after the fence was built; thus, there is no prima facie evidence that the fence affected
pronghorn numbers. Caslick and Caslick (1997) indicated that pronghorns avoided
disturbances associated with bison management activities, which suggests the hypothesis that
recent pronghorn trends might be tied to bison-related disturbances in the BLA. However,
pronghorn numbers crashed before intensive bison management began. Also, bison
management activities along the park’s northern border have been minimal since the severe
winter of 1996–1997, yet pronghorn counts have not increased (Fig. 7). Hunting pressure
apparently increased when antelope hunting district 313 was created in the fall of 1991 and
the number of permits increased from 5 to 25. Given the reproductive potential of
pronghorns, this level of hunting pressure, by itself, is insufficient to have limited the
population (then estimated at over 500 animals). While it might be argued that hunting-
related disturbance could have excluded animals from important habitats, it seems unlikely
that a fall hunt would have excluded them during a critical period.
An additional hypothesis that emerged from discussions at the Yellowstone
Pronghorn Conservation Assessment Workshop is that during recent decades pronghorn
trends in YNP have been driven by regional rather than local factors. Count data for Grand
33
Teton National Park, Wyoming, and Hart Mountain National Antelope Refuge, Oregon, were
cited as support for this hypothesis. Numbers of pronghorns recorded in these areas
increased during the 1980s, peaked during the early 1990s, then declined precipitously — a
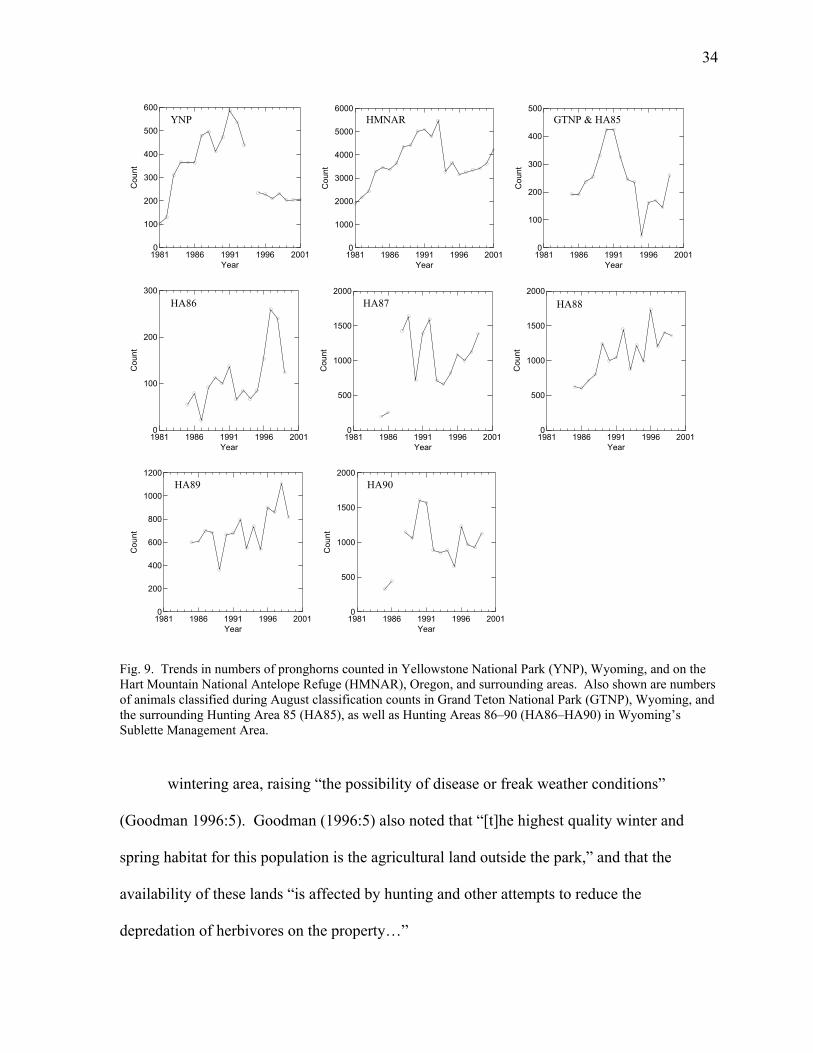
pattern quite similar to trends in YNP pronghorn counts (Fig. 9). Although these data
provide tentative support for the hypothesis that pronghorn population trends are driven by
regional factors, they should be interpreted cautiously. Observations in and near Grand
Teton National Park apparently were conducted for the purpose of herd classification
(McWhirter 1999). It is not clear that they provide a legitimate measure of population trend.
Moreover, associated counts from Hunting Areas 86–90 in Wyoming’s Sublette Management
Area indicate that the general pattern observed in YNP, Grand Teton National Park, and the
Hart Mountain Refuge was not universal. For example, some areas showed relatively steady
increases in numbers of animals observed during 1984–1999 (Fig. 9). Overall, no definitive
conclusion is possible from these data, but this hypothesis clearly merits further study.
Population Viability
Using Scott’s (1994) compilation of historical counts and artificial removals,
Goodman (1996) assessed population viability both qualitatively and quantitatively for the
YNP pronghorn herd. Details of this work (and the database it relied upon) merit careful
consideration, as this assessment has greatly influenced perceptions about the seriousness of
risks facing this population.
Goodman’s (1996:5) qualitative assessment of population status was that “[t]his
antelope population is extremely vulnerable to wide swings in numbers, and the risk of
extinction is high.” Factors believed to contribute to the high risk of extinction included
heavy coyote predation of young, crowding on the winter range, and concentration in one
34
1981 1986 1991 1996 2001Year
0
100
200
300
400
500
600
Cou
nt
1980
1000
2000
3000
4000
5000
6000
Cou
nt
500
1981 1986 1991 1996 2001Year
0
100
200
300
Cou
nt
1980
500
1000
1500
2000
Cou
nt
1981 1986 1991 1996 2001Year
0
200
400
600
800
1000
1200
Cou
nt
1980
500
1000
1500
2000
Cou
nt
Fig. 9. Trends in numbers of pronghorns couHart Mountain National Antelope Refuge (Hof animals classified during August classificathe surrounding Hunting Area 85 (HA85), asSublette Management Area.
wintering area, raising “the po
(Goodman 1996:5). Goodman (1996:
spring habitat for this population is th
availability of these lands “is affected
depredation of herbivores on the prop
HMNAR
1 1986 1991 1996 2001Year
1981 1986 1991 1996 2001Year
0
100
200
300
400
Cou
nt
2000
HA86 HA871 1986 1991 1996 2001Year
1981 1986 1991 1996 2001Year
0
500
1000
1500
Cou
nt
HA89
M
HA90
1 1986 1991 1996 2001Year
nted in Yellowstone National Park NAR), Oregon, and surrounding a
tion counts in Grand Teton Nationawell as Hunting Areas 86–90 (HA8
ssibility of disease or freak w
5) also noted that “[t]he highe
e agricultural land outside the
by hunting and other attempt
erty…”
HA88
GTNP & HA85
YNP(YNP), Wyoming, and on the reas. Also shown are numbers l Park (GTNP), Wyoming, and 6–HA90) in Wyoming’s
eather conditions”
st quality winter and
park,” and that the
s to reduce the
35
In his quantitative assessment of population viability (Goodman 1996:5) used a
random walk process, in which annual multiplicative factors of population increase were
drawn randomly and independently from a distribution formed from the observed factors of
increase for 1887–1993. Observed values were corrected for recorded removals and were
adjusted to achieve a geometric mean of 1.0 so that the model population would not be
predisposed to either increase or decrease. Goodman’s (1996) analysis yielded a mean time
to extinction of 343 years, an 18% probability of extinction within 100 years, and a 41%
probability of extinction within 200 years. Assumptions important to Goodman’s (1996)
findings include:
• No future artificial removals.
• No errors in the compiled census or removal data.
• No density dependence.
• A future distribution of dynamic variation like the historic variation corrected for
effects of removals.
• A single, closed population, demographically regulated together.
• A population ceiling of 2000 animals.
• No additional demographic stochasticity at population numbers smaller than those in
the historical record.
Now that the State of Montana has proposed to close antelope hunting district 313 in 2002
(MDFWP 2001), it appears that the first assumption will soon be met. However, the
remaining assumptions are violated, sometimes seriously. For example:
• As detailed above, known and sometimes significant errors exist in Scott’s (1994)
census and removal data.
36
• Relative stability of the population in the face of environmental variation during
1968–1982, and failure to decline from already low numbers in response to harsh
winters (e.g., the winters of 1921–1922 and 1996–1997) suggests density dependence.
• To a large degree, annual factors of increase historically were driven by management
actions that are no longer operative (e.g., feeding, predator control, and acquisition of
habitats in the BLA).
• Early counts and estimates may reflect inter-annual differences in pronghorn
distribution rather than population size, as they were based on observations of an
open population at the upper elevational limit of that population’s winter range.
• The present day herd apparently is composed of migratory and non-migratory sub-
populations that exhibit different dynamics (J. Mack, National Park Service, pers.
commun.).
• A ceiling of 2000 animals is unrealistically high, being based on figures from 1908
when the population was either open or only recently closed, and numbers were
inflated by artificial feeding, predator control, and the practice of containing
migratory animals within the park via fencing and/or hazing.
Overall, I believe the assumptions of Goodman’s (1996) analysis are violated in a way
that exaggerates the true variance in the distribution of factors of annual increase. This
would lead to underestimating population persistence time and overestimating extinction
risk. It is not clear that legitimate alternative approaches to viability analysis exist using
available data. To the extent that a rigorous viability analysis is required, data needs should
be identified and sampling protocols implemented to gather the necessary data.
37
GENETICS
Genetic concerns regarding YNP pronghorns have been raised only recently. In
1989, an outside advisory committee recommended research to “determine genetic
relationships between Yellowstone pronghorns and herds outside the park” (Anonymous
1990:8). This item ranked sixth among the committee’s recommendations and stemmed
from concerns over preserving the genetic purity of Yellowstone’s pronghorns, minimizing
the risk of inbreeding, and understanding the degree of genetic interchange with and
relatedness to adjacent pronghorn populations (Anonymous 1990). There have been 2
attempts to address this recommendation.
Lee et al. (1994) assessed allozyme and mitochondrial DNA (mtDNA) variation
among 29 North American pronghorn populations, including the YNP herd. Examining
tissues from 11 YNP animals, they reported that mean heterozygosity = 0.006, mean number
of alleles per locus = 1.10, and 9.1% of loci were polymorphic (Lee et al. 1994:309, Table 1).
These values were less than mean values based on all 29 populations, suggesting that
allozyme variation in YNP pronghorns is relatively low. In contrast, YNP animals exhibited
the highest mtDNA variation of any population sampled, with 4 haplotypes reported from 7
animals (Lee et al. 1994:313, Table 4). Of those, haplotype J was found only in a single
animal from YNP, leading Scott and Geisser (1994:1) to label YNP pronghorns as
“genetically-unique.” The claim of genetic uniqueness is contradicted, however, by Reat et
al. (1999), who observed haplotype J in 16 of 389 pronghorns sampled in Arizona.
Following the study by Lee et al. (1994), Dr. Douglas Scott (YNP) initiated a project
with Dr. Ernest Vyse (Montana State University) to address five questions (Scott c. 1993):
•Is there less heterozygosity in the Yellowstone herd as compared to the nearest herds
38
outside the Park?
•Are there significant genetic differences between Yellowstone pronghorns and the
nearest other herds that are not descendents of Yellowstone transplants?
•Are there significant genetic differences between migratory and nonmigratory
pronghorns in Yellowstone?
•Which, if any, of the herds surrounding the park is the Yellowstone herd most closely
related to?
•Is there evidence that animals from outside herds have immigrated to the Yellowstone
herd in recent decades?
In correspondence with Dr. Vyse, Scott (1993b) indicated he had acquired 132 liver samples
for this work. Of these, 116 were provided earlier to Lee et al. (1994), but only 30 were used
— leaving 102 samples that were never analyzed. A freezer failure at Montana State
University ultimately caused the loss of all samples, and the proposed work with Dr. Vyse
was never completed (P. Gogan, USGS Northern Rocky Mountain Science Center, pers.
commun.). Ultimately, definitive answers to the major genetic questions posed by the 1989
advisory committee are still lacking.
DISEASE
Numerous diseases and parasites have been documented in pronghorns from YNP.
Skinner (c. 1922b) emphasized concerns about actinomycosis (lumpy jaw), stomach worm,
tapeworm, wood tick and scab mite. Rush (1932:105) reported that, of 13 carcasses
examined, “[s]ix showed necrotic ulcers in mouth (foxtail mouth); all showed decayed teeth
to a greater or lesser degree; four were infested with lung worms Dictyocaulus sp., two with
intestinal worms Ostertagia sp. and Nematodirus antilocaprae, one with tape worms
39
Moniezia sp., all of them with wood ticks." Examining 48 fecal samples from pronghorns
shot during YNP’s herd reduction program, Todd and Hammond (1967) reported that 21%
were infected with Eimeria antelopcaprae. Necropsy of a single male pronghorn (Cornish
2000) revealed lung nematodes (“probably Protostrongylus sp.”) and the respiratory
pathogen Pasteurella hemolytica, as well as bacterial kidney and spleen infections. Benson
(1909) provided the only suggestion that disease may have significantly affected pronghorn
population dynamics:
"…one or two antelope die each week, from what cause is not known, though they do
not die violent deaths. The outpost in that vicinity have on one or two occasions seen
them stagger and fall and have immediately gone to them and found them unable to
arise, dying some two or three hours later. I inspected one of these immediately after
death and found a large ulcer on the side of the face, but in two other cases no sore or
injury of any kind could be discovered."
In the largest analysis to date, samples from 32 YNP pronghorns were examined for a
variety of health parameters. The copy of the report I examined failed to indicate the author
or organization responsible for the analysis, but other correspondence leads me to believe
that the Wyoming State Veterinary Laboratory might have performed the tests. Trace
mineral analyses were normal and gave no evidence of exposure to significant levels of
arsenic or lead. Tests revealed that 75% (n = 24 animals) had been exposed to the bacterium
Chlamydia psitacci, 59% (n = 19) to parainfluenza virus type 3, 9% (n = 3) to bovine viral
diarrhea virus, and 3% (n = 1) to bovine respiratory syncytial virus. Tests revealed no
evidence of exposure to Brucella abortus, bluetongue virus, epizootic hemorrhagic disease,
40
Mycobacterium avium paratuberculosis, or Leptospira interrogans. Only low parasite loads
were found. Overall, the report concluded that “there are no obvious health problems
detectable by antemortem sampling in this pronghorn herd,” but that the high incidence of
Chlamydia exposure warrants further study.
No clear evidence of management response to pronghorn disease concerns was found
in the materials I reviewed. Skinner (c. 1922b) recommended preventive measures to deal
with diseases and parasites, including control of certain exotic grasses, limiting contact
between pronghorns and domestic livestock, fencing and fall plowing of irrigated fields
within the Park, burning infected pronghorn carcasses, predator control for all native canid
species and strict control of domestic dogs, and fencing or burning areas where animals
congregate, particularly feeding grounds. Many of his views were later repeated and
expanded (Skinner c. 1924), but it is unclear as to which recommendations, if any, were
actually implemented. Predator control was already underway before 1922. Domestic cattle
were removed from YNP, but no indication of the timing of and reasons for removals was
uncovered.
As part of an overall research strategy, the outside pronghorn advisory committee,
convened by YNP in 1989, recommended limited monitoring for diseases like brucellosis
and leptospirosis, as insurance against possible claims that pronghorns might transmit these
diseases (Anonymous 1990). They cautioned, however, that such monitoring should not be a
major research item (Anonymous 1990). Subsequent analyses generally support their
recommendation, as no evidence exists of a population-level health problem and serological
tests yielded no evidence of exposure to brucellosis or leptospirosis. An exception is the
previously cited analysis, which makes a case for studying effects of Chlamydia.
41
ACKNOWLEDGEMENTS
This work was supported by the NPS Cooperative Ecosystem Study Unit and the
USGS Northern Rocky Mountain Science Center. I am indebted to Kathy Tonnesson and
Dick Jachowski for making that support possible; Maureen Hartmann for her efforts in
locating and organizing the information reviewed for this report; the many individuals at
Yellowstone National Park who helped in innumerable ways, particularly John Mack, Glenn
Plumb, Lee Whittlesey, and Jim Caslick; Tom Segerstrom for help in locating materials and
for sharing his insights into pronghorn ecology; Brian Giddings (Montana Department of
Fish, Wildlife and Parks) and Larry Handegard (USDA APHIS Wildlife Services), who
provided coyote pelt price data; and Mike Dunbar and Kim Berger for sharing data on
pronghorn population trends at Hart Mountain National Antelope Refuge and Grand Teton
National Park, respectively.
LITERATURE CITED
Acting Superintendent. 1912. Letter to Mr. E. W. Henshaw, Chief, Biological Survey,
Washington, D. C., January 3, 1912. Park archives, Yellowstone National Park,
Wyoming, USA.
______. 1913. Letter to the Secretary of the Interior, October 31, 1913. Park archives,
Yellowstone National Park, Wyoming, USA.
Albright, H. M. 1922. Letter to Dr. Grinnell from Superintendent Horace M. Albright, dated
May 20, 1922. Park archives, box N-16, Yellowstone National Park, Wyoming,
USA.
Anderson, J. E., and R. S. Inouye. 2001. Landscape-scale changes in plant species
abundance and biodiversity of a sagebrush steppe over 45 years. Ecological
42
Monographs 71:531–556.
Angler. 1883. The big game and the park. Forest and Stream 20(4):68.
Anonymous. n.d. Second page only, from a report that apparently details the history of
pronghorn transplants from YNP. Yellowstone Center for Resources, Yellowstone
National Park, Wyoming, USA.
______. 1883a. An important Park order. Forest and Stream 19(25):481.
______. 1883b. Game slaughtered in the west. Forest and Stream 20(21):401.
______. 1885. Spring in the National Park. Forest and Stream 24(20): 285.
______. 1887a. Winter game notes from the park. Forest and Stream 28(3):46.
______. 1887b. The national park. Forest and Stream 29(11):206.
______. 1893. National park news. Forest and Stream 40(4):71.
______. 1895. The Yellowstone Park. Forest and Stream 45(21):492–493.
______. 1897. Yellowstone Park affairs. Forest and Stream 48(1).
______. 1898. Letters from the Acting Superintendent, May 31, 1898. Park archives,
Letters Sent Vol. VII, Yellowstone National Park, Wyoming, USA.
______. 1901. The National Park. Forest and Stream. 56(2):26.
______. 1902. Annual report to the Department of the Interior, October 14, 1902. Park
archives, Letters Sent Vol. XII, Yellowstone National Park, Wyoming, USA.
______. 1903. Annual report to the Department of Interior, October 14, 1903. Park
archives, Letters Sent Vol. XIII, Yellowstone National Park, Wyoming, USA.
______. 1904. Yellowstone Park big game. Forest and Stream 63:441.
______. 1905a. The national park antelope. Forest and Stream 64(20):389.
______. 1905b. Game in the Yellowstone. Forest and Stream 65(25):491–492.
43
______. 1906a. Yellowstone Park game. Forest and Stream 66:912.
______. 1906b. Yellowstone National Park. Forest and Stream 67(20):770–771.
______. 1907. Notes of the Yellowstone Park. Forest and Stream 69(26):1020.
______. 1908. Reports on national parks. Forest and Stream 71(25):975.
______. 1910. Yellowstone Park spring notes. Forest and Stream 74(15):572.
______. 1911a. Letter to Mr. George Bird Grinnell, apparently from the Superintendent.
Park archives, Yellowstone National Park, Wyoming, USA.
______. 1911b. Letter to Dr. T. S. Palmer, Biological Survey, Washington, D. C.,
apparently from the Superintendent. Park archives, box MSC-34, Yellowstone
National Park, Wyoming, USA.
______. 1913. Antelope in Wyoming. Forest and Stream 80:140–141.
______. 1914. Game conditions in Yellowstone National Park. Forest and Stream 82:686.
______. 1931. Brief of protection department activities under the supervision of chief range
during the calendar years 1922 to 1931, inclusive. Park archives, box N-15,
Yellowstone National Park, Wyoming, USA.
______. 1933. Annual game report, June 7 1933. Park archives, box N-15, Yellowstone
National Park, Wyoming, USA.
______. 1934. Annual game report, June 21, 1934. Park archives, box N-15, Yellowstone
National Park, Wyoming, USA.
______. 1936. Annual game census report, January, 21, 1936. Park archives, box N-15,
Yellowstone National Park, Wyoming, USA.
______. 1944. Annual wildlife census report, Yellowstone National Park, 1944.
Yellowstone National Park, Wyoming, USA.
44
______. 1945a. Annual wildlife census report, Yellowstone National Park, 1945.
Yellowstone National Park, Wyoming, USA.
______. 1945b. Yellowstone National Park and Absaroka National Forest pronghorn
census, 1945. Yellowstone National Park, Wyoming, USA.
______. 1946. Yellowstone National Park report on census of bighorn, deer, and pronghorn.
Park archives, box N-15, Yellowstone National Park, Wyoming, USA.
______. 1949. Yellowstone National Park annual wildlife census report, 1949. Park
archives, box N-15, Yellowstone National Park, Wyoming, USA.
______. 1950a. Yellowstone National Park annual wildlife census report, 1950.
Yellowstone National Park, Wyoming, USA.
______. 1950b. Annual district animal census report, Mammoth District. Park archives,
box N-15, Yellowstone National Park, Wyoming, USA.
______. 1951. Annual district animal census report, Mammoth District. Park archives, box
N-15, Yellowstone National Park, Wyoming, USA.
______. 1953. Annual wildlife report for Yellowstone National Park, 1953. Park archives,
box N-15, Yellowstone National Park, Wyoming, USA.
______. 1955. Annual wildlife report for Yellowstone National Park, 1955. Yellowstone
National Park, Wyoming, USA.
______. 1990. Summary of final recommendations made by the outside advisory committee
on pronghorn antelope research and management in Yellowstone National Park.
Yellowstone Center for Resources, Yellowstone National Park, Wyoming, USA.
______. 1997. Yellowstone’s northern range: complexity & change in a wildland
ecosystem. National Park Service, Mammoth Hot Springs, Wyoming, USA.
45
Baggley, G. F. n.d. Memorandum of wild animal counts and estimates taken during the
winter of 1929–30. Yellowstone National Park, Wyoming, USA.
______. 1931. Annual game report (winter of 1930–31). Yellowstone National Park,
Wyoming, USA.
Baggley, H. A. 1932. A few facts and figures with which we should be familiar. Park
archives, box N-15, Yellowstone National Park, Wyoming, USA.
Bailey, V. 1930. Animal life of Yellowstone National Park. C. Thomas and Co.,
Springfield, Illinois, USA.
Barbee, R. D. 1990. Letter to Edward Francis concerning effects of the jackleg fence on
wildlife migration, September 1990. Yellowstone Center for Resources, Yellowstone
National Park, Wyoming, USA.
Barmore, W. J. 1965. Monthly report for January. Yellowstone National Park, Wyoming,
USA.
______. 1966. Annual wildlife report, Yellowstone National Park. Yellowstone National
Park, Wyoming, USA.
______. 1967a. Aerial check of elk distribution on the northern Yellowstone winter range,
January 12 and 18, 1967. Yellowstone National Park, Wyoming, USA.
______. 1967b. Aerial wildlife census, Yellowstone National Park, March 1967.
Yellowstone National Park, Wyoming, USA.
______. 1968a. Annual wildlife report, Yellowstone National Park. Yellowstone National
Park, Wyoming, USA.
______. 1968b. Antelope census, northern Yellowstone winter range, March 5, 1968.
Yellowstone National Park, Wyoming, USA.
46
______. 1970. The ecology of elk, associated ungulates, and their habitat in the northern
part of Yellowstone National Park. Park archives, box W-101, Yellowstone National
Park, Wyoming, USA.
______. 1981. Population characteristics, distribution and habitat relationships of six
ungulates in northern Yellowstone Park. Ph.D. dissertation, Utah State University,
Logan, Utah, USA.
Barrows, M. 1937. Report of antelope, bighorn sheep and deer census. Yellowstone
National Park, Wyoming, USA.
______. 1938. Report of antelope, bighorn sheep and deer census. Yellowstone National
Park, Wyoming, USA.
______. 1939. Report of antelope, bighorn sheep and deer census. Park archives box N-15,
Yellowstone National Park, Wyoming, USA.
Bauer, C. M. 1938. Climate and range. Yellowstone Nature Notes 15:49–50.
Beer, J. 1944. Distribution and status of pronghorn antelope in Montana. Journal of
Mammalogy 25:43–46.
Benson, H. C. 1909. Dangers to Yellowstone antelope. Forest and Stream 72(11):417.
Bucknall, E. 1970. Annual wildlife report, May 1, 1969 to April 30, 1970. Park archives
box W-101, Yellowstone National Park, Wyoming, USA.
Caslick, J., and E. Caslick. 1996. Pronghorn distribution in winter 1995–1996. Yellowstone
National Park, Wyoming, USA.
______, and ______. 1997. Pronghorn distribution in winter 1996–1997. Yellowstone
National Park, Wyoming, USA.
______, and ______. 1998. Pronghorn distribution in winter 1997–1998. Yellowstone
47
National Park, Wyoming, USA.
______, and ______. 1999. Pronghorn distribution in winter 1998–1999. Yellowstone
National Park, Wyoming, USA.
______, and ______. 2000. Pronghorn distribution in winter 1999–2000. Yellowstone
National Park, Wyoming, USA.
______, and ______. 2001. Pronghorn distribution in winter 2000–2001. Yellowstone
National Park, Wyoming, USA.
Chapman, W. S. 1953. Antelope count, December 15, 1953. Yellowstone National Park,
Wyoming, USA.
______. 1960. Annual census report for Yellowstone National Park, 1958–59. Yellowstone
National Park, Wyoming, USA.
Clark, W. 1997a. Supplement to cooperative annual spring total pronghorn count for the
Cooperative Northern Range Wildlife Working Group. Yellowstone Center for
Resources, Yellowstone National Park, Wyoming, USA.
______. 1997b. Memorandum regarding 1997 fall aerial pronghorn count on November 22,
1997. Yellowstone Center for Resources, Yellowstone National Park, Wyoming,
USA.
______. 1998. Cooperative annual spring total pronghorn count for the Cooperative
Northern Range Wildlife Working Group. Yellowstone Center for Resources,
Yellowstone National Park, Wyoming, USA.
______. 1999. Cooperative annual spring total pronghorn count for the Cooperative
Northern Range Wildlife Working Group. Yellowstone Center for Resources,
Yellowstone National Park, Wyoming, USA.
48
Cornish, T. 2000. Pathology report. Wyoming State Veterinary Laboratory, Accession No.
00W-1956, March 22, 2000. Yellowstone Center for Resources, Yellowstone
National Park, Wyoming, USA.
Evans, W. L. 1951. Animal census report, Yellowstone National Park, 1951. Yellowstone
National Park, Wyoming, USA.
Francis, E. L. 1987. Letter to Jim Flynn from the Royal Teton Ranch regarding antelope
depredation hunt, January 16, 1987. Yellowstone Center for Resources, Yellowstone
National Park, Wyoming, USA.
Freeman, W. G. 1973. Letter to Superintendent Jack Anderson, January 7, 1973.
Yellowstone Center for Resources, Yellowstone National Park, Wyoming, USA.
Goodman, D. 1996. Viability analysis of the antelope population wintering near Gardiner,
Montana. Unpublished report, Yellowstone Center for Resources, Yellowstone
National Park, Wyoming, USA.
Greer, J. L. c. 1930–1931. An ecological study of wild game animals in Yellowstone
National Park. Unpublished report, Yellowstone National Park, Wyoming, USA.
Grimm, R. L. 1937. Yellowstone Park range studies. Yellowstone National Park,
Wyoming, USA.
______. 1948. Antelope count, January 6, 1948. Yellowstone National Park, Wyoming,
USA.
Grinnell, G. B. 1918. What about the Yellowstone elk? Forest and Stream 88(6):336–337.
Halloran, A. F., and B. P. Glass. 1959. The carnivores and ungulates of the Wichita
Mountains Wildlife Refuge, Oklahoma. Journal of Mammalogy 40:360–370.
Hamilton, W. F. 1953. Letter to Regional Director, Region Two regarding antelope
49
management, December 28, 1953. Park archives box N-16, Yellowstone National
Park, Wyoming, USA.
Heller, E. 1925. The big game animals of Yellowstone National Park. Roosevelt Wildlife
Bulletin 2(4), pages 405–468 in Syracuse Wildlife Bulletin 24(23).
Hofer, T. E. 1887a. Winter in wonderland. Forest and Stream 28(15):318–319.
______. 1887b. The national park. Forest and Stream 28(15):321.
______. 1887c. Game in the Park. Forest and Stream 29:88.
______. 1889a. The Yellowstone National Park. Forest and Stream 31:478.
______. 1889b. Notes on the Yellowstone Park. Forest and Stream 32(14):275.
______. 1890. Lots of big game. Forest and Stream 34(5):84.
______. 1891a. Winter in the national park. Forest and Stream 36(5):83.
______. 1891b. Game in the national park. Forest and Stream 36(9):170.
______. 1901. In the Yellowstone Park. Forest and Stream 56(26):502.
______. 1902. In the Yellowstone Park. Forest and Stream 59:467.
______. 1905a. National park game. Forest and Stream 64(19):373–374.
______. 1905b. Animal Life in Yellowstone. Forest and Stream 65:248.
______. 1908a. Yellowstone Park Notes. Forest and Stream 70(13):491.
______. 1908b. Yellowstone Park News. Forest and Stream 70(20):772.
Houston, D. B. 1973. Letter to the Superintendent regarding, “Status of Pronghorn in
Yellowstone National Park,” January 24, 1973. Park archives box 119, Yellowstone
National Park, Wyoming, USA.
______. 1982. The northern Yellowstone elk, ecology and management. Macmillan
Publishing, New York, New York, USA.
50
Howe, R. E. 1961. Census of the northern Yellowstone elk herd, 1961. Yellowstone
National Park Information Memo. Yellowstone National Park, Wyoming, USA.
______. 1962a. Annual wildlife report for Yellowstone National Park. Yellowstone
National Park, Wyoming, USA.
______. 1962b. 1962 helicopter census, northern Yellowstone winter range. Yellowstone
National Park, Wyoming, USA.
______. 1963. Annual wildlife report for Yellowstone National Park. Yellowstone National
Park, Wyoming, USA.
______. 1964. Annual wildlife report for Yellowstone National Park. Yellowstone National
Park, Wyoming, USA.
______. 1965a. 1963–64 wildlife management report Yellowstone National Park. Park
archives box W-103, Yellowstone National Park, Wyoming, USA.
______. 1965b. Annual wildlife report, Yellowstone National Park. Yellowstone National
Park, Wyoming, USA.
Joffe, J. 1949. Memorandum to Regional Director, Region Two, National Park Service,
February 2, 1949. Yellowstone National Park, Wyoming, USA.
Johnston, F. T. 1951. Memorandum to the Regional Director, Region Two, National Park
Service, February 27, 1951. Yellowstone National Park, Wyoming, USA.
Kittams, W. H. 1947. Annual wildlife census report. Park archives box N-15, Yellowstone
National Park, Wyoming, USA.
______. 1956. 1956 count of northern Yellowstone elk herd by helicopter. Yellowstone
National Park, Wyoming, USA.
______. 1958. Memorandum to Superintendent regarding antelope census. February 26,
51
1958. Park archives box N-16, Yellowstone National Park, Wyoming, USA.
La Noue, F. D. 1948. Memorandum to the Regional Director, Region Two, National Park
Service, January 23, 1948. Yellowstone National Park, Wyoming, USA.
Lee, T. E., Jr., J. W. Bickman, and M. D. Scott. 1994. Mitochondrial DNA and allozyme
analysis of North American pronghorn populations. Journal of Wildlife Management
58:307–318.
Lindsley, C. A. 1922. Letter to Superintendent Horace Albright, February 8, 1922. Park
archives box N-16, Yellowstone National Park, Wyoming, USA.
Lindsley, E. 1897. Yellowstone Park fish and game. Forest and Stream. 49:484.
Mack, J. 1996. Cooperative annual spring total pronghorn count for the Cooperative
Northern Range Wildlife Working Group. Yellowstone Center for Resources,
Yellowstone National Park, Wyoming, USA.
______. 2000. Composition count for Yellowstone pronghorn population, August 12, 2000.
Yellowstone Center for Resources, Yellowstone National Park, Wyoming, USA.
______. 2001. Spring count for Yellowstone pronghorn population, April 3, 2001.
Yellowstone Center for Resources, Yellowstone National Park, Wyoming, USA.
McEneaney, T. 1997. Handwritten account of attempted predation by coyotes on antelope,
December 21, 1997. Yellowstone Center for Resources, Yellowstone National Park,
Wyoming, USA.
McLaughlin, J. S. 1965. 1965–66 Pronghorn (antelope) and habitat management plan for
Yellowstone National Park. Park archives box 156, Yellowstone National Park,
Wyoming, USA.
McWhirter, D. 1999. Memo regarding 1999 pre-season antelope classification assignments,
52
August 2, 999. Wyoming Game & Fish Department.
Montana Department of Fish Wildlife and Parks. 1999. Hunting season/quota change
supporting information. Yellowstone Center for Resources, Yellowstone National
Park, Wyoming, USA.
______. 2001. Montana Fish, Wildlife & Parks hunting season/quota change supporting
information, antelope hunting district 313. Unpublished.
Murie, A. 1940. Ecology of the coyote in the Yellowstone. Fauna of the National Parks of
the United States, Bulletin No. 4. U.S. Department of the Interior, National Park
Service, Washington, D.C., USA.
Nelson, E. W. 1925. Status of the pronghorned antelope, 1922–24. U.S. Department of
Agriculture, Departmental Bulletin No. 1346.
Norris, P. W. 1878. Report upon the Yellowstone National Park to the Secretary of the
Interior by P. W. Norris, Superintendent, for the year 1877. U.S. Government
Printing Office, Washington D. C., USA.
Pitcher, J. 1905. National park game. Forest and Stream 64(4):69.
Reat, E. P., O. E. Rhodes, Jr., J. R. Heffelfinger, and J. C. deVos, Jr. 1999. Regional genetic
differentiation in Arizona pronghorn. Proceedings of the Biennial Pronghorn
Antelope Workshop 18:25–31.
Rogers, E. B. 1948. Annual report on antelope, deer, and bighorn. Memorandum from
Superintendent, Yellowstone National Park to Regional Director, Region Two,
National Park Service. Yellowstone National Park, Wyoming, USA.
53
______. 1956. Letter to the Regional Director, Region Two, October 31, 1956, regarding
antelope management. Park archives box N-16, Yellowstone National Park,
Wyoming, USA.
Rush, W. M. 1932. Northern Yellowstone elk study. Montana Fish and Game Commission,
Helena, Montana, USA.
Sawyer, H., and F. Lindzey. 2000. Jackson Hole pronghorn study. Wyoming Cooperative
Fish & Wildlife Research Unit, University of Wyoming, Laramie, Wyoming, USA.
Scott, M. D. 1987. Pronghorn antelope in Yellowstone: life history and management issues.
Yellowstone Center for Resources, Yellowstone National Park, Wyoming, USA.
______. 1988. Historical review of pronghorn populations and management in Yellowstone
National Park. Page 22 in First Annual Meeting of Research and Monitoring on
Yellowstone Northern Range, January 28–29, 1988. Yellowstone National Park,
Wyoming, USA.
______. 1991. Summary of background information on Yellowstone pronghorns in relation
to their use of land outside the Park, July 26, 1991. Yellowstone Center for
Resources, Yellowstone National Park, Wyoming, USA.
______. 1992. Buck-and-pole fence crossings by 4 ungulate species. Wildlife Society
Bulletin 20:204–210.
______. 1993a. Five-year effects of the 1988 Yellowstone fires on pronghorn migration and
habitat use. Yellowstone Center for Resources, Yellowstone National Park,
Wyoming, USA.
54
______. 1993b. Letter to Dr. Ernest R. Vyse regarding details of tissue samples available
for genetic study of pronghorns in Yellowstone National Park, April 12, 1993.
Yellowstone Center for Resources, Yellowstone National Park, Wyoming, USA.
______. c. 1993. Letter to Dr. Ernest R. Vyse detailing a proposed study of pronghorn
genetics in Yellowstone National Park (undated, but a related and later letter was
dated April 12, 1993). Yellowstone Center for Resources, Yellowstone National
Park, Wyoming, USA.
______. 1994. Yellowstone pronghorn counts, 1877–1994. Printout from digital file,
Yellowstone Center for Resources, Yellowstone National Park, Wyoming, USA.
______, and H. Geisser. 1994. Pronghorn migration and habitat use following the 1988
Yellowstone fires, January 10, 1994. Yellowstone Center for Resources, Yellowstone
National Park, Wyoming, USA.
Singer, F. J. 1986. Northern Yellowstone antelope count, February 28, 1986. Park archives
box N-76, Yellowstone Center for Resources, Yellowstone National Park, Wyoming,
USA.
______. 1987. Memo to Yellowstone National Park Research Administrator regarding
pronghorn antelope study, February 19, 1987. Yellowstone Center for Resources,
Yellowstone National Park, Wyoming, USA.
______. 1988. Ungulate prey base for large predators in Yellowstone National Park.
Research/Resources Management Report No. 1. National Park Service, Yellowstone
National Park, Wyoming, USA.
Skinner, C. K. 1936. Report of deer and antelope census. Park archives box N-15,
Yellowstone National Park, Wyoming, USA.
55
______. 1941. Report of bighorn, deer and pronghorn census, 1941. Park archives box N-
15, Yellowstone National Park, Wyoming, USA.
Skinner, M. P. 1922a. The pronghorn. Journal of Mammalogy 3(2):82–105.
______. 1922b. Diseases of prong-horn. Unpublished report, Park archives box N-16,
Yellowstone National Park, Wyoming, USA.
______. 1922c. Letter to Dr. George Bird Grinnell, May 19, 1922. Park archives box N-16,
Yellowstone National Park, Wyoming, USA.
______. c. 1924. Handling the prong-horn question in Yellowstone National Park. Park
archives box N-16, Yellowstone National Park, Wyoming, USA.
Superintendent. 1910. Letter from Superintendent to Secretary of the Interior, Washington,
D.C., February 26, 1910. Park archives box 48, Yellowstone National Park,
Wyoming, USA.
______. 1911. Letter from Superintendent to Dr. T. S. Palmer, Assistant Chief, Biological
Survey, Washington, D.C. Park archives box 48, Yellowstone National Park,
Wyoming, USA.
______. 1922. Letter to Dr. Grinnell from Superintendent Horace M. Albright, May 20,
1922. Park archives box N-16, Yellowstone National Park, Wyoming, USA.
Superintendent’s Annual Report. 1912. Yellowstone National Park, Wyoming, USA, USA.
______. 1918. Yellowstone National Park, Wyoming, USA.
______. 1920. Yellowstone National Park, Wyoming, USA.
______. 1923. Yellowstone National Park, Wyoming, USA.
______. 1925. Yellowstone National Park, Wyoming, USA.
______. 1942. Yellowstone National Park, Wyoming, USA.
56
______. 1943. Yellowstone National Park, Wyoming, USA.
Tell, R. W. 1932. Letter to Mr. Hall McAllister, May 11, 1932. Park archives box N-15,
Yellowstone National Park, Wyoming, USA.
Todd, K. S., Jr., and D. M. Hammond. 1967. Redescription and incidence of Eimeria
antelocaprae Huizinga 1942 in the pronghorn antelope, Antilocapra americana (Ord,
1815). Bulletin of the Wildlife Disease Association 3:71–73.
Whithorn, W., and D. Whithorn. c. 1965. A photo history of Aldridge; coal camp that died
a-boomin’. Acme Printing and Stationary, Minneapolis, Minnesota, USA.
______. c. 1977. The Harvats and their woolies. Park County News, Livingston, Montana,
USA.
Whittlesey, L. H. 1995. “They’re going to build a railroad!”: Cinnabar, Stephens Creek, and
the Game Ranch addition to Yellowstone National Park. Yellowstone National Park,
Wyoming, USA.
Wilson, E. 1885. Game in the park. Forest and Stream 25(21):407.
Woodring, S. T. 1924. Memorandum to H. M. Albright, November 27, 1924. Yellowstone
National Park, Wyoming, USA.
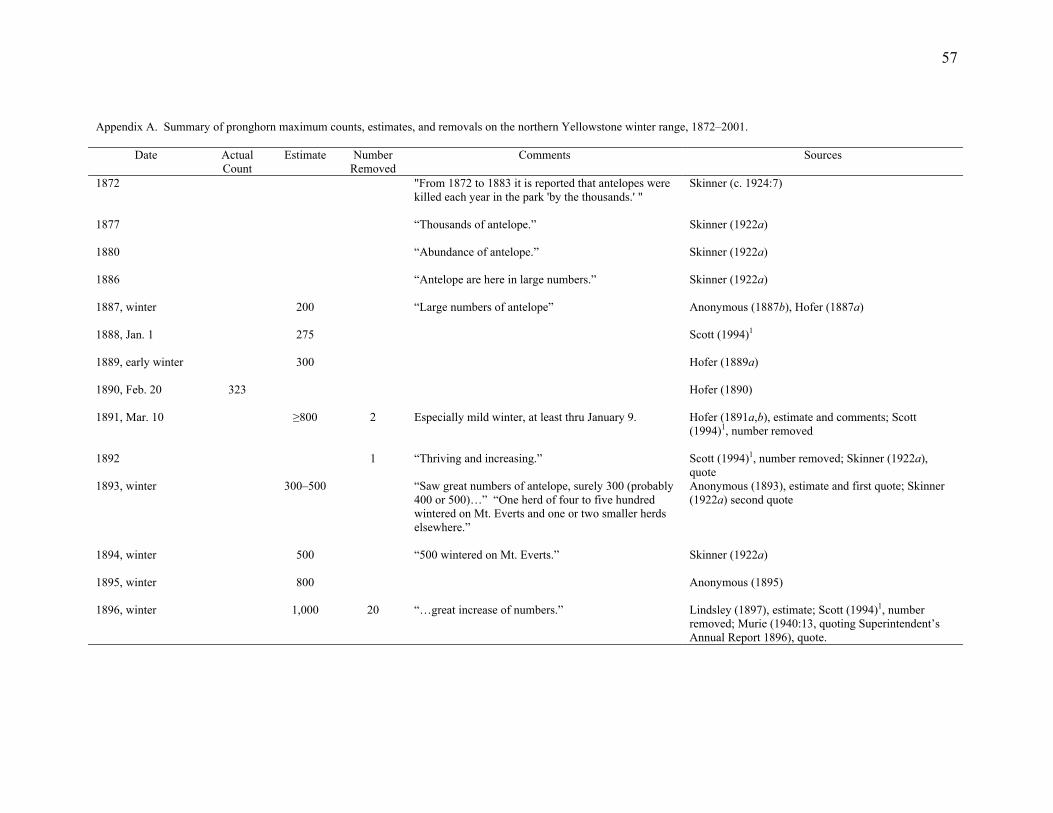
57
Appendix A. Summary of pronghorn maximum counts, estimates, and removals on the northern Yellowstone winter range, 1872–2001.
Date ActualCount
Estimate NumberRemoved
Comments Sources
1872
"From 1872 to 1883 it is reported that antelopes were killed each year in the park 'by the thousands.' "
Skinner (c. 1924:7)
1877
“Thousands of antelope.” Skinner (1922a)
1880
“Abundance of antelope.” Skinner (1922a)
1886
“Antelope are here in large numbers.” Skinner (1922a)
1887, winter
200 “Large numbers of antelope” Anonymous (1887b), Hofer (1887a)
1888, Jan. 1
275 Scott (1994)1
1889, early winter
300 Hofer (1889a)
1890, Feb. 20
323 Hofer (1890)
1891, Mar. 10
≥800 2 Especially mild winter, at least thru January 9. Hofer (1891a,b), estimate and comments; Scott (1994)1, number removed
1892
1 “Thriving and increasing.” Scott (1994)1, number removed; Skinner (1922a), quote
1893, winter
300–500 “Saw great numbers of antelope, surely 300 (probably 400 or 500)…” “One herd of four to five hundred wintered on Mt. Everts and one or two smaller herds elsewhere.”
Anonymous (1893), estimate and first quote; Skinner (1922a) second quote
1894, winter
500 “500 wintered on Mt. Everts.” Skinner (1922a)
1895, winter
800 Anonymous (1895)
1896, winter
1,000 20 “…great increase of numbers.” Lindsley (1897), estimate; Scott (1994)1, number removed; Murie (1940:13, quoting Superintendent’s Annual Report 1896), quote.
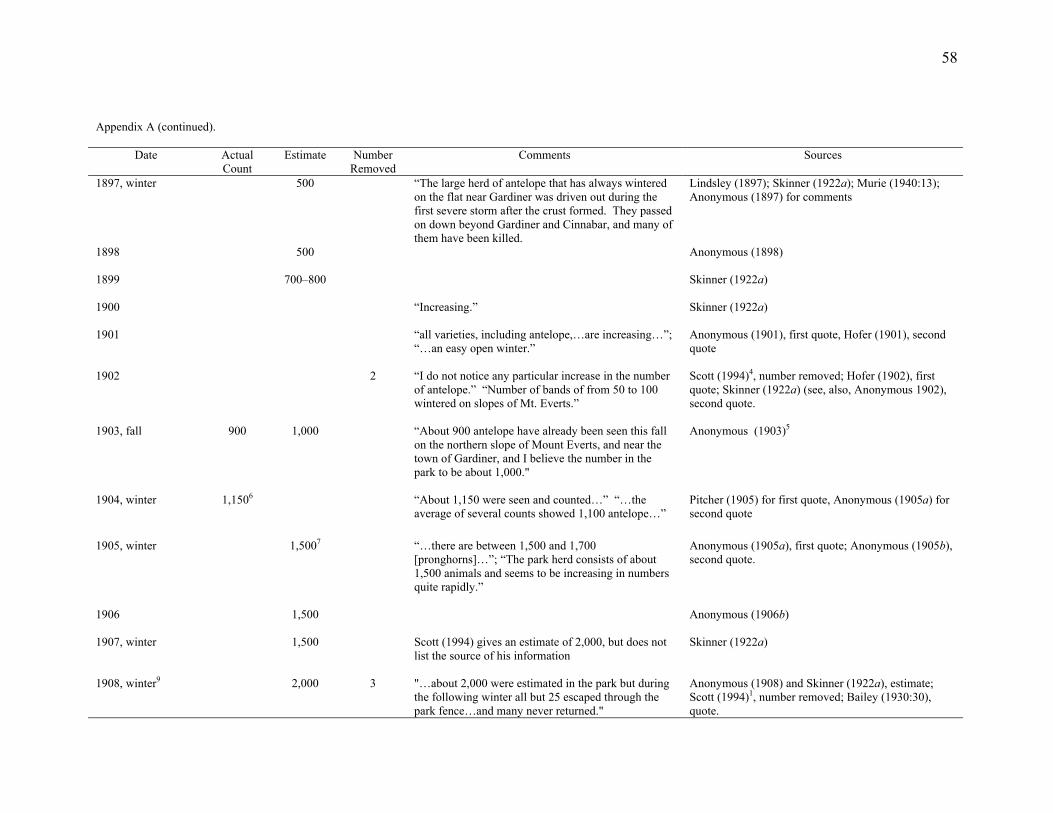
58
Appendix A (continued).
Date ActualCount
Estimate NumberRemoved
Comments Sources
1897, winter
500 “The large herd of antelope that has always wintered on the flat near Gardiner was driven out during the first severe storm after the crust formed. They passed on down beyond Gardiner and Cinnabar, and many of them have been killed.
Lindsley (1897); Skinner (1922a); Murie (1940:13); Anonymous (1897) for comments
1898
500 Anonymous (1898)
1899
700–800 Skinner (1922a)
1900
“Increasing.” Skinner (1922a)
1901
“all varieties, including antelope,…are increasing…”;“…an easy open winter.”
Anonymous (1901), first quote, Hofer (1901), second quote
1902
2 “I do not notice any particular increase in the number of antelope.” “Number of bands of from 50 to 100 wintered on slopes of Mt. Everts.”
Scott (1994)4, number removed; Hofer (1902), first quote; Skinner (1922a) (see, also, Anonymous 1902), second quote.
1903, fall
900 1,000 “About 900 antelope have already been seen this fall on the northern slope of Mount Everts, and near the town of Gardiner, and I believe the number in the park to be about 1,000."
Anonymous (1903)5
1904, winter
1,1506 “About 1,150 were seen and counted…” “…the average of several counts showed 1,100 antelope…”
Pitcher (1905) for first quote, Anonymous (1905a) for second quote
1905, winter
1,5007 “…there are between 1,500 and 1,700 [pronghorns]…”; “The park herd consists of about 1,500 animals and seems to be increasing in numbers quite rapidly.”
Anonymous (1905a), first quote; Anonymous (1905b), second quote.
1906
1,500 Anonymous (1906b)
1907, winter
1,500 Scott (1994) gives an estimate of 2,000, but does not list the source of his information
Skinner (1922a)
1908, winter9
2,000 3 "…about 2,000 were estimated in the park but during the following winter all but 25 escaped through the park fence…and many never returned."
Anonymous (1908) and Skinner (1922a), estimate; Scott (1994)1, number removed; Bailey (1930:30), quote.
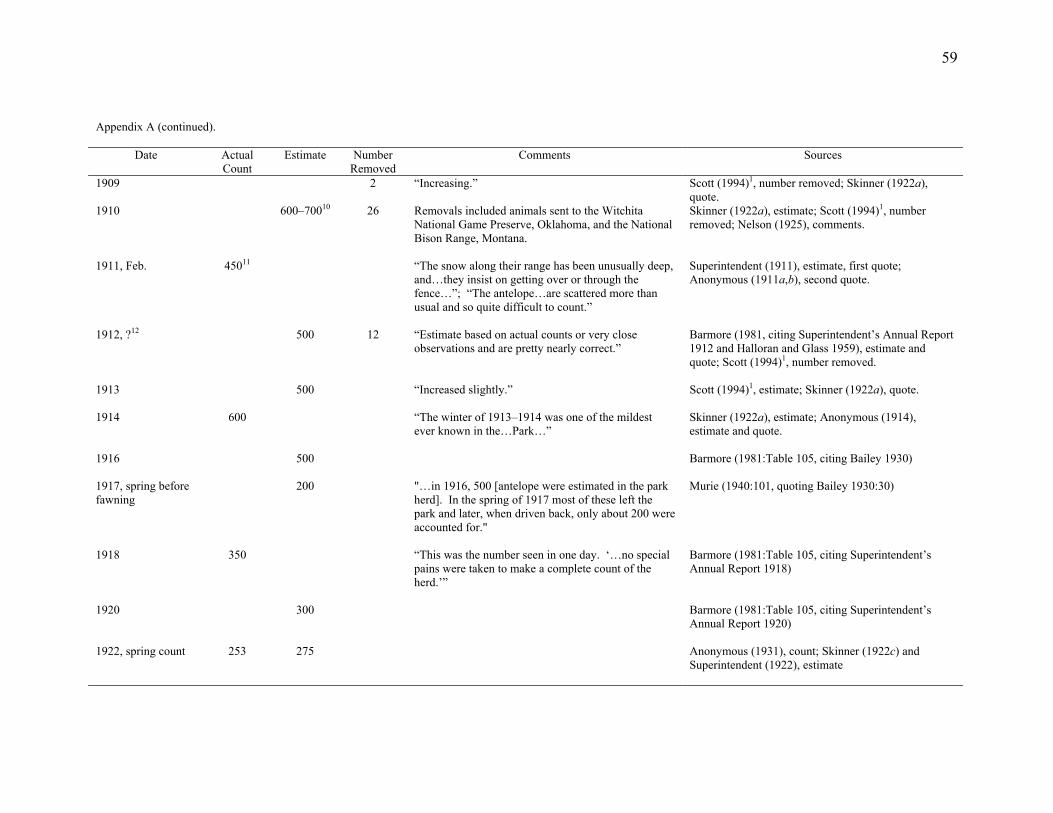
59
Appendix A (continued).
Date ActualCount
Estimate NumberRemoved
Comments Sources
1909
2 “Increasing.” Scott (1994)1, number removed; Skinner (1922a), quote.
1910
600–70010 26 Removals included animals sent to the Witchita National Game Preserve, Oklahoma, and the National Bison Range, Montana.
Skinner (1922a), estimate; Scott (1994)1, number removed; Nelson (1925), comments.
1911, Feb.
45011 “The snow along their range has been unusually deep, and…they insist on getting over or through the fence…”; “The antelope…are scattered more than usual and so quite difficult to count.”
Superintendent (1911), estimate, first quote; Anonymous (1911a,b), second quote.
1912, ?12
500 12 “Estimate based on actual counts or very close observations and are pretty nearly correct.”
Barmore (1981, citing Superintendent’s Annual Report 1912 and Halloran and Glass 1959), estimate and quote; Scott (1994)1, number removed.
1913
500 “Increased slightly.” Scott (1994)1, estimate; Skinner (1922a), quote.
1914
600 “The winter of 1913–1914 was one of the mildest ever known in the…Park…”
Skinner (1922a), estimate; Anonymous (1914), estimate and quote.
1916
500 Barmore (1981:Table 105, citing Bailey 1930)
1917, spring before fawning
200 "…in 1916, 500 [antelope were estimated in the park herd]. In the spring of 1917 most of these left the park and later, when driven back, only about 200 were accounted for."
Murie (1940:101, quoting Bailey 1930:30)
1918
350 “This was the number seen in one day. ‘…no special pains were taken to make a complete count of the herd.’”
Barmore (1981:Table 105, citing Superintendent’s Annual Report 1918)
1920
300 Barmore (1981:Table 105, citing Superintendent’s Annual Report 1920)
1922, spring count
253 275 Anonymous (1931), count; Skinner (1922c) and Superintendent (1922), estimate
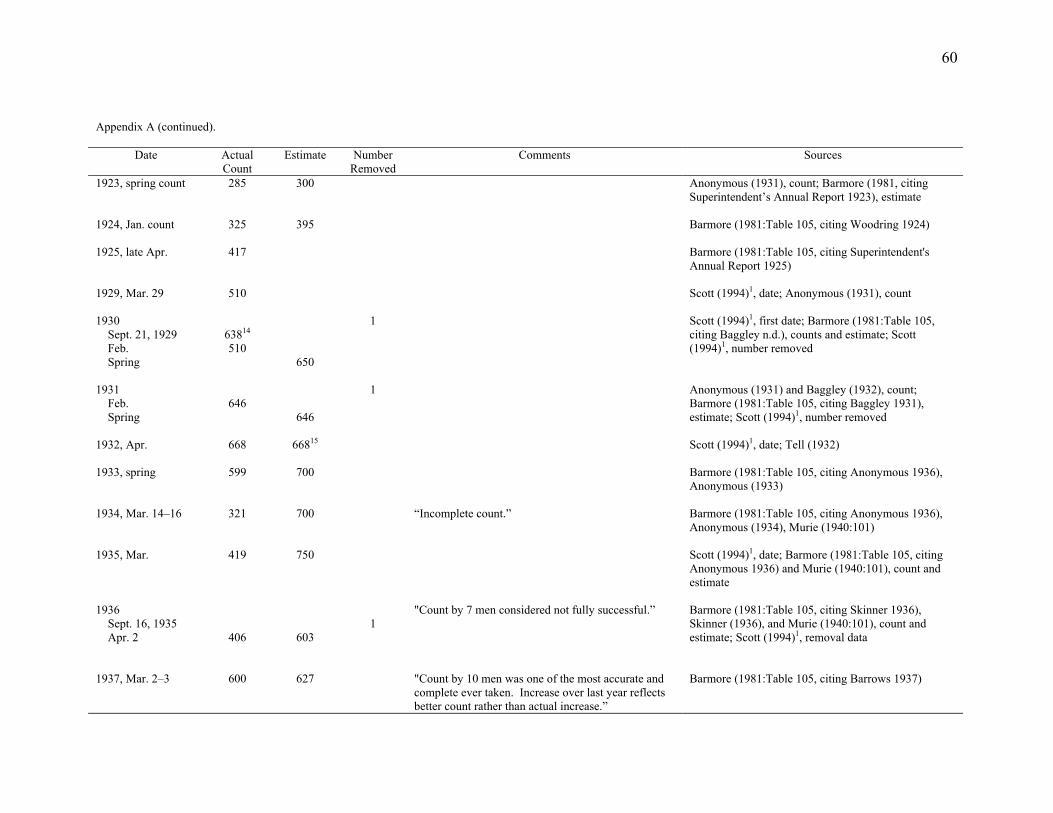
60
Appendix A (continued).
Date ActualCount
Estimate NumberRemoved
Comments Sources
1923, spring count
285 300 Anonymous (1931), count; Barmore (1981, citing Superintendent’s Annual Report 1923), estimate
1924, Jan. count
325 395 Barmore (1981:Table 105, citing Woodring 1924)
1925, late Apr.
417 Barmore (1981:Table 105, citing Superintendent's Annual Report 1925)
1929, Mar. 29
510
Scott (1994)1, date; Anonymous (1931), count
1930 Sept. 21, 1929 Feb. Spring
63814 510
650
1 Scott (1994)1, first date; Barmore (1981:Table 105, citing Baggley n.d.), counts and estimate; Scott (1994)1, number removed
1931 Feb. Spring
646
646
1 Anonymous (1931) and Baggley (1932), count; Barmore (1981:Table 105, citing Baggley 1931), estimate; Scott (1994)1, number removed
1932, Apr.
668 66815 Scott (1994)1, date; Tell (1932)
1933, spring
599 700 Barmore (1981:Table 105, citing Anonymous 1936), Anonymous (1933)
1934, Mar. 14–16
321 700 “Incomplete count.” Barmore (1981:Table 105, citing Anonymous 1936), Anonymous (1934), Murie (1940:101)
1935, Mar.
419 750 Scott (1994)1, date; Barmore (1981:Table 105, citing Anonymous 1936) and Murie (1940:101), count and estimate
1936 Sept. 16, 1935 Apr. 2
406
603
1
"Count by 7 men considered not fully successful.”
Barmore (1981:Table 105, citing Skinner 1936), Skinner (1936), and Murie (1940:101), count and estimate; Scott (1994)1, removal data
1937, Mar. 2–3
600 627 "Count by 10 men was one of the most accurate and complete ever taken. Increase over last year reflects better count rather than actual increase.”
Barmore (1981:Table 105, citing Barrows 1937)
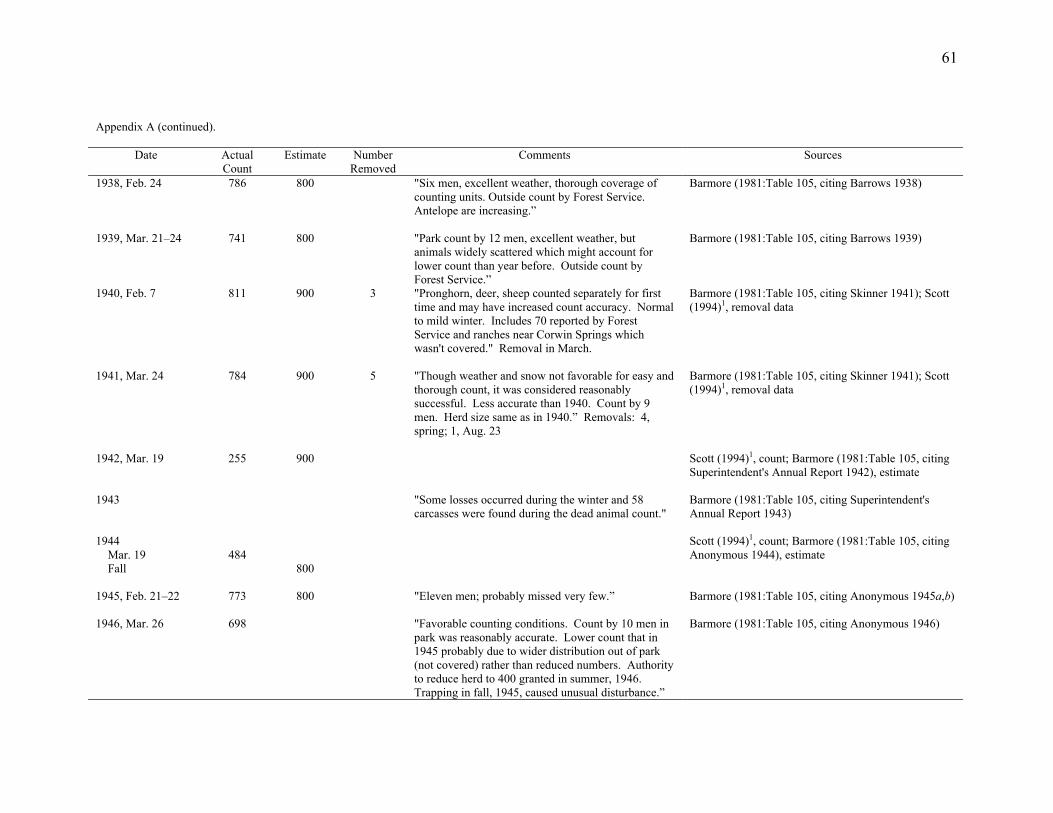
61
Appendix A (continued).
Date ActualCount
Estimate NumberRemoved
Comments Sources
1938, Feb. 24
786 800 "Six men, excellent weather, thorough coverage of counting units. Outside count by Forest Service. Antelope are increasing.”
Barmore (1981:Table 105, citing Barrows 1938)
1939, Mar. 21–24
741 800 "Park count by 12 men, excellent weather, but animals widely scattered which might account for lower count than year before. Outside count by Forest Service.”
Barmore (1981:Table 105, citing Barrows 1939)
1940, Feb. 7
811 900 3 "Pronghorn, deer, sheep counted separately for first time and may have increased count accuracy. Normal to mild winter. Includes 70 reported by Forest Service and ranches near Corwin Springs which wasn't covered." Removal in March.
Barmore (1981:Table 105, citing Skinner 1941); Scott (1994)1, removal data
1941, Mar. 24
784 900 5 "Though weather and snow not favorable for easy and thorough count, it was considered reasonably successful. Less accurate than 1940. Count by 9 men. Herd size same as in 1940.” Removals: 4, spring; 1, Aug. 23
Barmore (1981:Table 105, citing Skinner 1941); Scott (1994)1, removal data
1942, Mar. 19
255
900 Scott (1994)1, count; Barmore (1981:Table 105, citing Superintendent's Annual Report 1942), estimate
1943
"Some losses occurred during the winter and 58 carcasses were found during the dead animal count."
Barmore (1981:Table 105, citing Superintendent's Annual Report 1943)
1944 Mar. 19 Fall
484
800
Scott (1994)1, count; Barmore (1981:Table 105, citing Anonymous 1944), estimate
1945, Feb. 21–22
773 800 "Eleven men; probably missed very few.” Barmore (1981:Table 105, citing Anonymous 1945a,b)
1946, Mar. 26 698 "Favorable counting conditions. Count by 10 men in park was reasonably accurate. Lower count that in 1945 probably due to wider distribution out of park (not covered) rather than reduced numbers. Authority to reduce herd to 400 granted in summer, 1946. Trapping in fall, 1945, caused unusual disturbance.”
Barmore (1981:Table 105, citing Anonymous 1946)
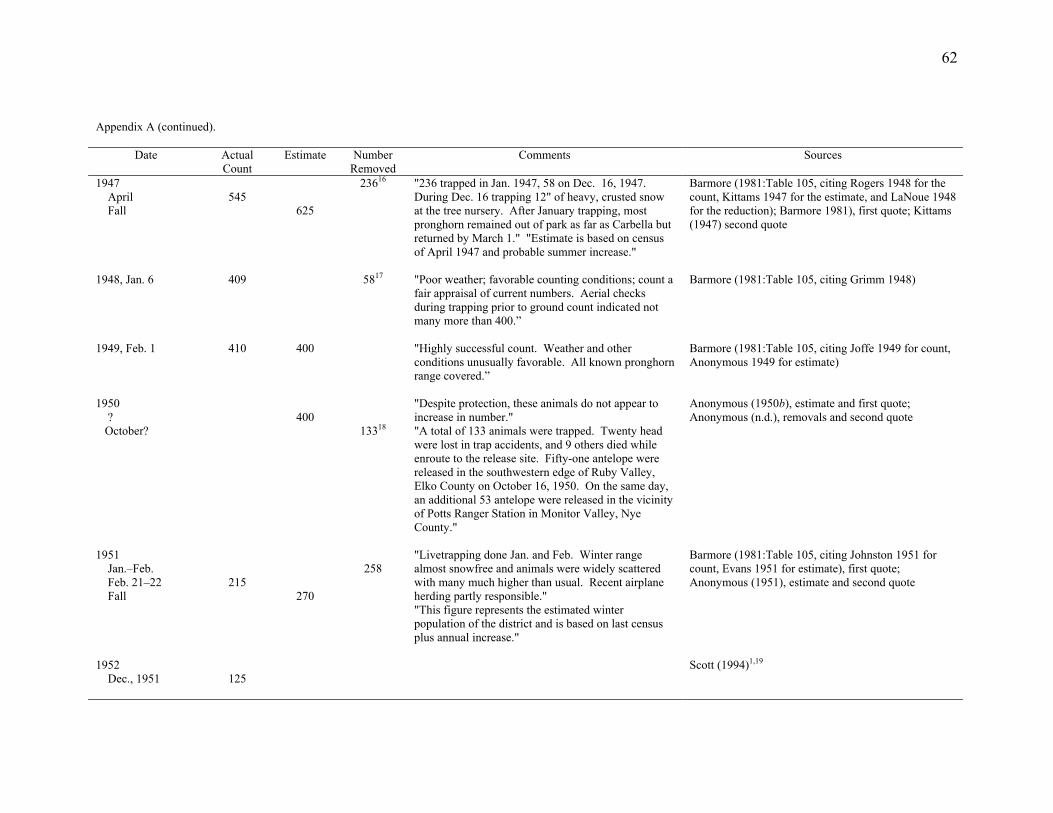
62
Appendix A (continued).
Date ActualCount
Estimate NumberRemoved
Comments Sources
1947 April Fall
545
625
23616 "236 trapped in Jan. 1947, 58 on Dec. 16, 1947. During Dec. 16 trapping 12" of heavy, crusted snow at the tree nursery. After January trapping, most pronghorn remained out of park as far as Carbella but returned by March 1." "Estimate is based on census of April 1947 and probable summer increase."
Barmore (1981:Table 105, citing Rogers 1948 for the count, Kittams 1947 for the estimate, and LaNoue 1948 for the reduction); Barmore 1981), first quote; Kittams (1947) second quote
1948, Jan. 6
409
5817 "Poor weather; favorable counting conditions; count a fair appraisal of current numbers. Aerial checks during trapping prior to ground count indicated not many more than 400.”
Barmore (1981:Table 105, citing Grimm 1948)
1949, Feb. 1
410 400 "Highly successful count. Weather and other conditions unusually favorable. All known pronghorn range covered.”
Barmore (1981:Table 105, citing Joffe 1949 for count, Anonymous 1949 for estimate)
1950 ? October?
400
13318
"Despite protection, these animals do not appear to increase in number." "A total of 133 animals were trapped. Twenty head were lost in trap accidents, and 9 others died while enroute to the release site. Fifty-one antelope were released in the southwestern edge of Ruby Valley, Elko County on October 16, 1950. On the same day, an additional 53 antelope were released in the vicinity of Potts Ranger Station in Monitor Valley, Nye County."
Anonymous (1950b), estimate and first quote; Anonymous (n.d.), removals and second quote
1951 Jan.–Feb. Feb. 21–22 Fall
215
270
258
"Livetrapping done Jan. and Feb. Winter range almost snowfree and animals were widely scattered with many much higher than usual. Recent airplane herding partly responsible." "This figure represents the estimated winter population of the district and is based on last census plus annual increase."
Barmore (1981:Table 105, citing Johnston 1951 for count, Evans 1951 for estimate), first quote; Anonymous (1951), estimate and second quote
1952 Dec., 1951
125
Scott (1994)1,19
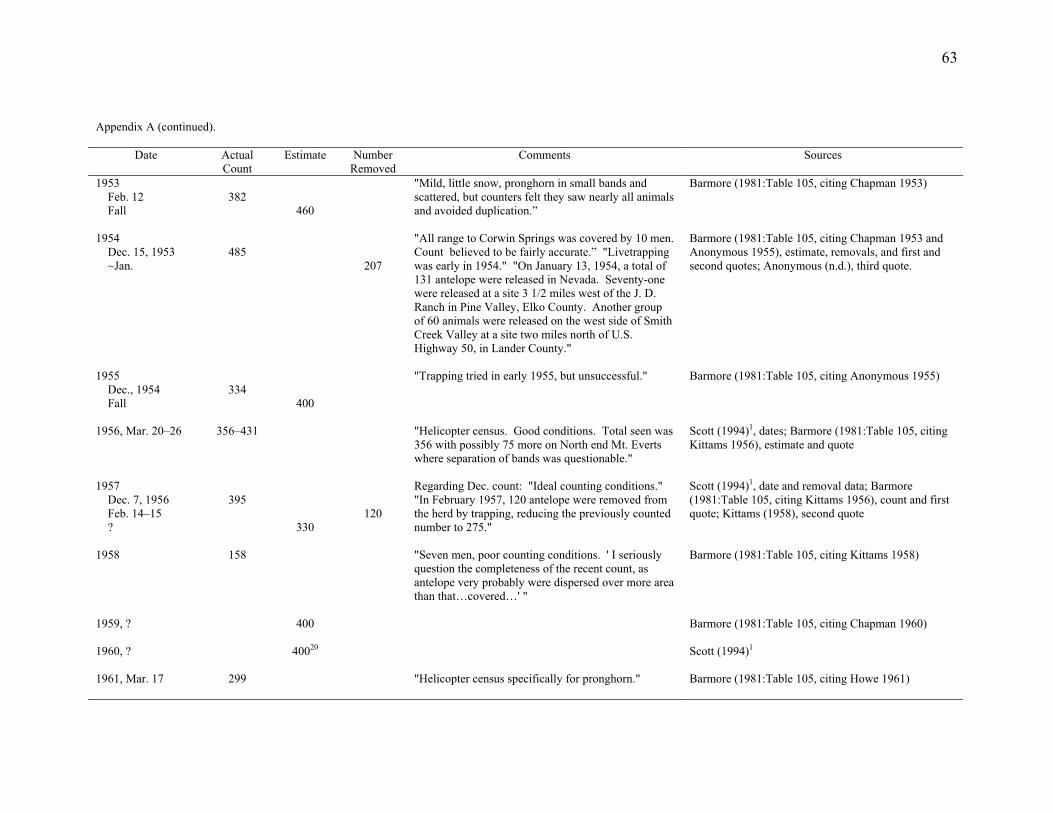
63
Appendix A (continued).
Date ActualCount
Estimate NumberRemoved
Comments Sources
1953 Feb. 12 Fall
382
460
"Mild, little snow, pronghorn in small bands and scattered, but counters felt they saw nearly all animals and avoided duplication.”
Barmore (1981:Table 105, citing Chapman 1953)
1954 Dec. 15, 1953 ~Jan.
485
207
"All range to Corwin Springs was covered by 10 men. Count believed to be fairly accurate.” "Livetrapping was early in 1954." "On January 13, 1954, a total of 131 antelope were released in Nevada. Seventy-one were released at a site 3 1/2 miles west of the J. D. Ranch in Pine Valley, Elko County. Another group of 60 animals were released on the west side of Smith Creek Valley at a site two miles north of U.S. Highway 50, in Lander County."
Barmore (1981:Table 105, citing Chapman 1953 and Anonymous 1955), estimate, removals, and first and second quotes; Anonymous (n.d.), third quote.
1955 Dec., 1954 Fall
334
400
"Trapping tried in early 1955, but unsuccessful." Barmore (1981:Table 105, citing Anonymous 1955)
1956, Mar. 20–26
356–431 "Helicopter census. Good conditions. Total seen was 356 with possibly 75 more on North end Mt. Everts where separation of bands was questionable."
Scott (1994)1, dates; Barmore (1981:Table 105, citing Kittams 1956), estimate and quote
1957 Dec. 7, 1956 Feb. 14–15 ?
395
330
120
Regarding Dec. count: "Ideal counting conditions." "In February 1957, 120 antelope were removed from the herd by trapping, reducing the previously counted number to 275."
Scott (1994)1, date and removal data; Barmore (1981:Table 105, citing Kittams 1956), count and first quote; Kittams (1958), second quote
1958
158 "Seven men, poor counting conditions. ' I seriously question the completeness of the recent count, as antelope very probably were dispersed over more area than that…covered…' "
Barmore (1981:Table 105, citing Kittams 1958)
1959, ?
400 Barmore (1981:Table 105, citing Chapman 1960)
1960, ?
40020 Scott (1994)1
1961, Mar. 17
299 "Helicopter census specifically for pronghorn." Barmore (1981:Table 105, citing Howe 1961)
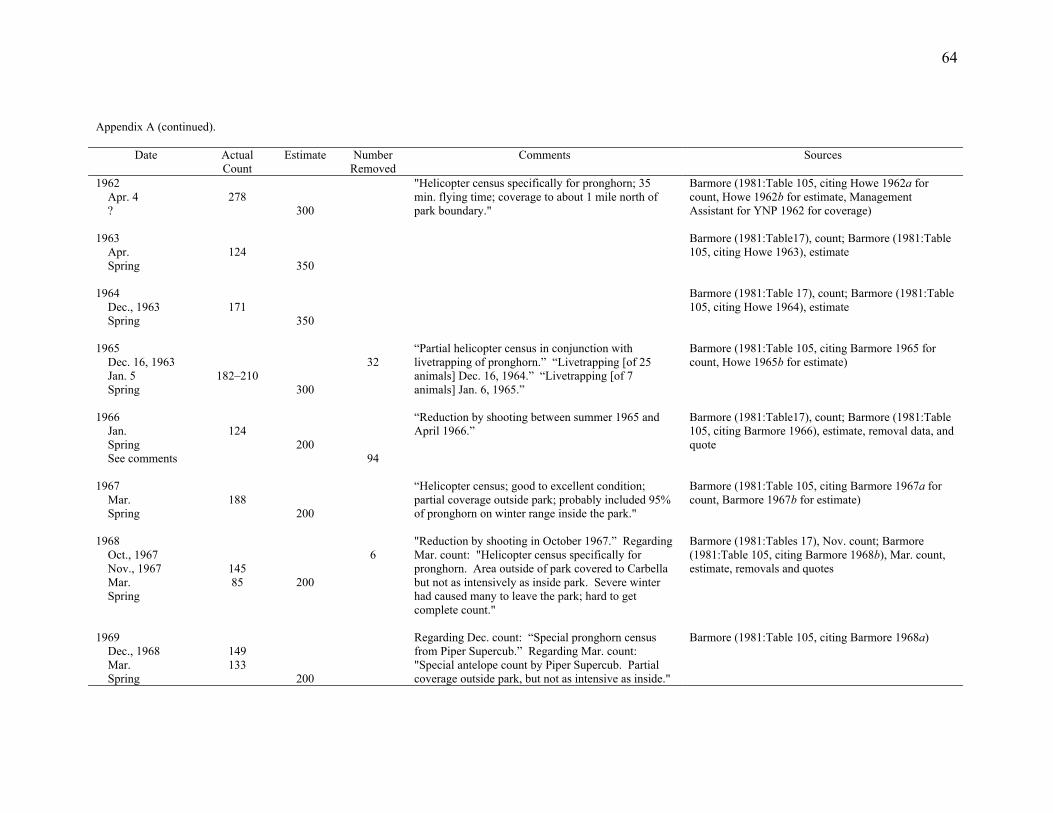
64
Appendix A (continued).
Date ActualCount
Estimate NumberRemoved
Comments Sources
1962 Apr. 4 ?
278
300
"Helicopter census specifically for pronghorn; 35 min. flying time; coverage to about 1 mile north of park boundary."
Barmore (1981:Table 105, citing Howe 1962a for count, Howe 1962b for estimate, Management Assistant for YNP 1962 for coverage)
1963 Apr. Spring
124
350
Barmore (1981:Table17), count; Barmore (1981:Table 105, citing Howe 1963), estimate
1964 Dec., 1963 Spring
171
350
Barmore (1981:Table 17), count; Barmore (1981:Table 105, citing Howe 1964), estimate
1965 Dec. 16, 1963 Jan. 5 Spring
182–210
300
32
“Partial helicopter census in conjunction with livetrapping of pronghorn.” “Livetrapping [of 25 animals] Dec. 16, 1964.” “Livetrapping [of 7 animals] Jan. 6, 1965.”
Barmore (1981:Table 105, citing Barmore 1965 for count, Howe 1965b for estimate)
1966 Jan. Spring See comments
124
200
94
“Reduction by shooting between summer 1965 and April 1966.”
Barmore (1981:Table17), count; Barmore (1981:Table 105, citing Barmore 1966), estimate, removal data, and quote
1967 Mar. Spring
188
200
“Helicopter census; good to excellent condition; partial coverage outside park; probably included 95% of pronghorn on winter range inside the park."
Barmore (1981:Table 105, citing Barmore 1967a for count, Barmore 1967b for estimate)
1968 Oct., 1967 Nov., 1967 Mar. Spring
145 85
200
6
"Reduction by shooting in October 1967.” Regarding Mar. count: "Helicopter census specifically for pronghorn. Area outside of park covered to Carbella but not as intensively as inside park. Severe winter had caused many to leave the park; hard to get complete count."
Barmore (1981:Tables 17), Nov. count; Barmore (1981:Table 105, citing Barmore 1968b), Mar. count, estimate, removals and quotes
1969 Dec., 1968 Mar. Spring
149 133
200
Regarding Dec. count: “Special pronghorn census from Piper Supercub.” Regarding Mar. count: "Special antelope count by Piper Supercub. Partial coverage outside park, but not as intensive as inside."
Barmore (1981:Table 105, citing Barmore 1968a)
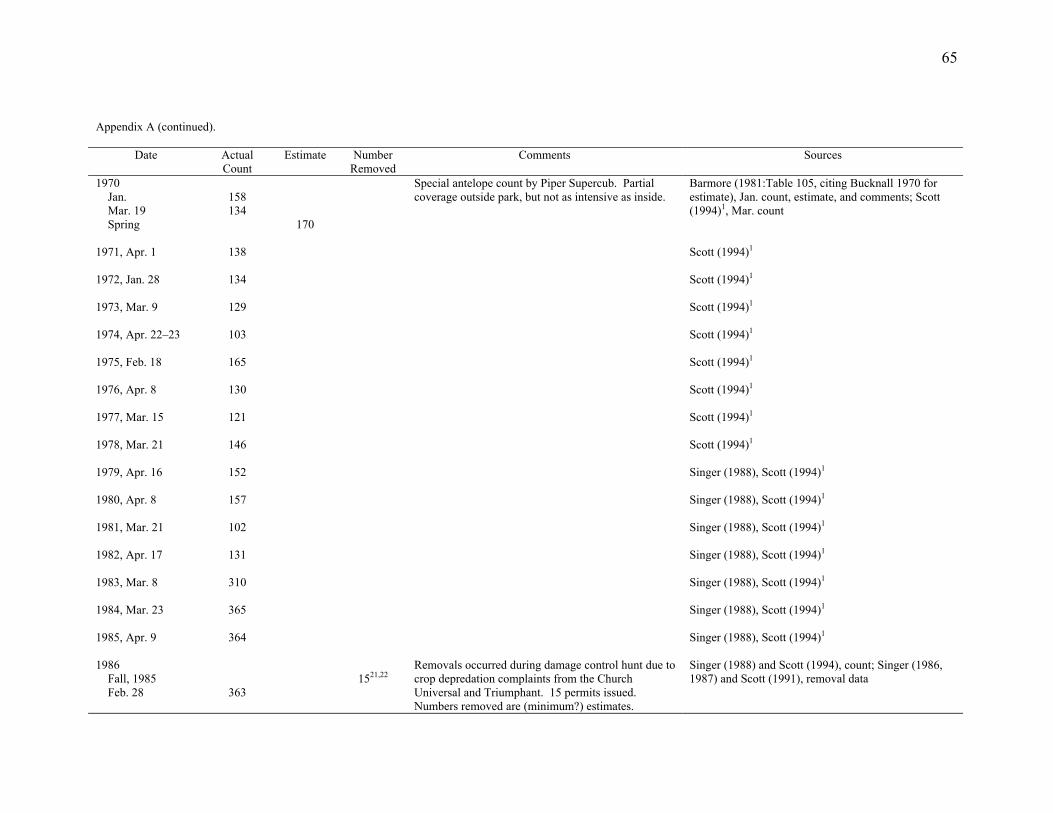
65
Appendix A (continued).
Date ActualCount
Estimate NumberRemoved
Comments Sources
1970 Jan. Mar. 19 Spring
158 134
170
Special antelope count by Piper Supercub. Partial coverage outside park, but not as intensive as inside.
Barmore (1981:Table 105, citing Bucknall 1970 for estimate), Jan. count, estimate, and comments; Scott (1994)1, Mar. count
1971, Apr. 1
138
Scott (1994)1
1972, Jan. 28
134 Scott (1994)1
1973, Mar. 9
129 Scott (1994)1
1974, Apr. 22–23
103 Scott (1994)1
1975, Feb. 18
165 Scott (1994)1
1976, Apr. 8
130 Scott (1994)1
1977, Mar. 15
121 Scott (1994)1
1978, Mar. 21
146 Scott (1994)1
1979, Apr. 16
152 Singer (1988), Scott (1994)1
1980, Apr. 8
157 Singer (1988), Scott (1994)1
1981, Mar. 21
102 Singer (1988), Scott (1994)1
1982, Apr. 17
131 Singer (1988), Scott (1994)1
1983, Mar. 8
310 Singer (1988), Scott (1994)1
1984, Mar. 23
365 Singer (1988), Scott (1994)1
1985, Apr. 9
364 Singer (1988), Scott (1994)1
1986 Fall, 1985 Feb. 28
363 1521,22
Removals occurred during damage control hunt due to crop depredation complaints from the Church Universal and Triumphant. 15 permits issued. Numbers removed are (minimum?) estimates.
Singer (1988) and Scott (1994), count; Singer (1986, 1987) and Scott (1991), removal data
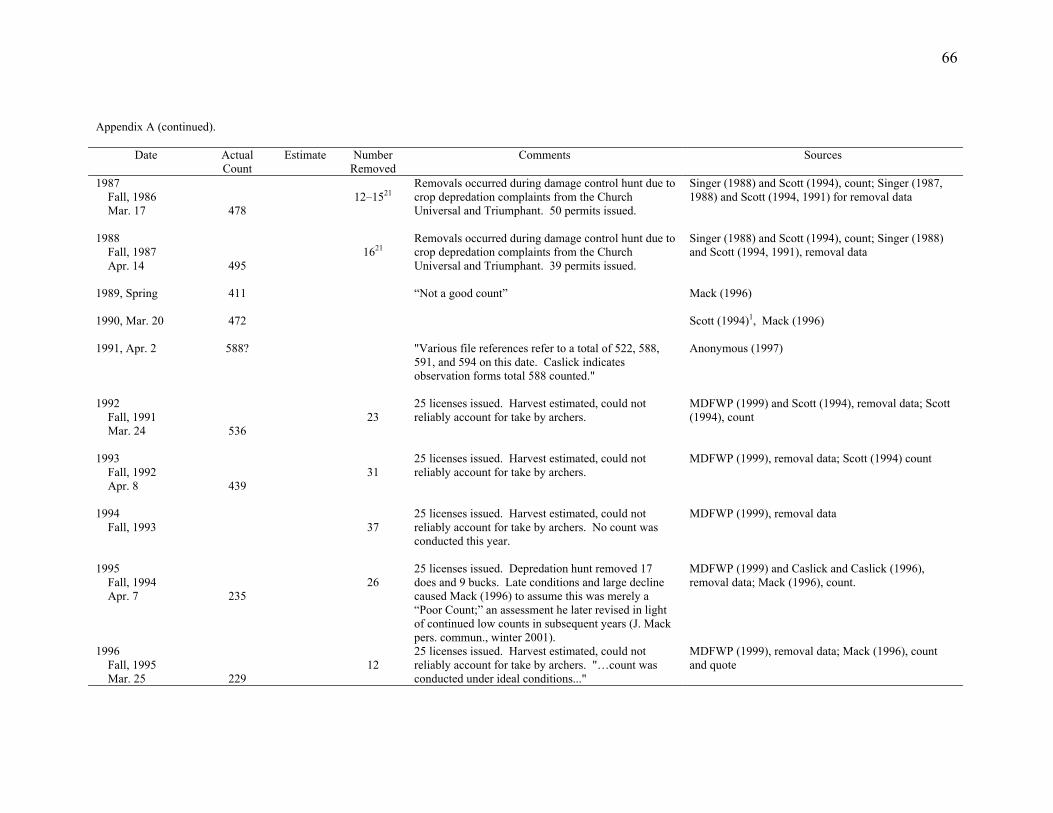
66
Appendix A (continued).
Date ActualCount
Estimate NumberRemoved
Comments Sources
1987 Fall, 1986 Mar. 17
478
12–1521
Removals occurred during damage control hunt due to crop depredation complaints from the Church Universal and Triumphant. 50 permits issued.
Singer (1988) and Scott (1994), count; Singer (1987, 1988) and Scott (1994, 1991) for removal data
1988 Fall, 1987 Apr. 14
495
1621 Removals occurred during damage control hunt due to crop depredation complaints from the Church Universal and Triumphant. 39 permits issued.
Singer (1988) and Scott (1994), count; Singer (1988) and Scott (1994, 1991), removal data
1989, Spring
411 “Not a good count” Mack (1996)
1990, Mar. 20
472 Scott (1994)1, Mack (1996)
1991, Apr. 2
588? "Various file references refer to a total of 522, 588, 591, and 594 on this date. Caslick indicates observation forms total 588 counted."
Anonymous (1997)
1992 Fall, 1991 Mar. 24
536 23
25 licenses issued. Harvest estimated, could not reliably account for take by archers.
MDFWP (1999) and Scott (1994), removal data; Scott (1994), count
1993 Fall, 1992 Apr. 8
439 31
25 licenses issued. Harvest estimated, could not reliably account for take by archers.
MDFWP (1999), removal data; Scott (1994) count
1994 Fall, 1993
37 25 licenses issued. Harvest estimated, could not reliably account for take by archers. No count was conducted this year.
MDFWP (1999), removal data
1995 Fall, 1994 Apr. 7
235 26
25 licenses issued. Depredation hunt removed 17 does and 9 bucks. Late conditions and large decline caused Mack (1996) to assume this was merely a “Poor Count;” an assessment he later revised in light of continued low counts in subsequent years (J. Mack pers. commun., winter 2001).
MDFWP (1999) and Caslick and Caslick (1996), removal data; Mack (1996), count.
1996 Fall, 1995 Mar. 25
229 12
25 licenses issued. Harvest estimated, could not reliably account for take by archers. "…count was conducted under ideal conditions..."
MDFWP (1999), removal data; Mack (1996), count and quote
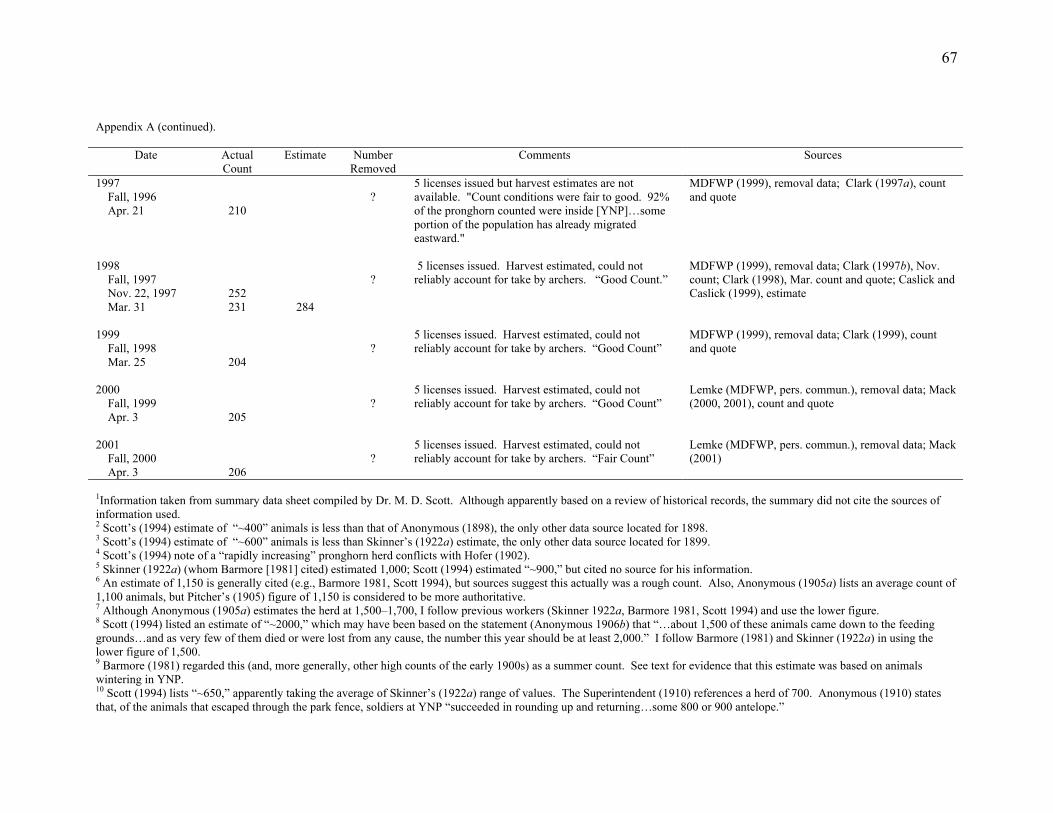
67
Appendix A (continued).
Date ActualCount
Estimate NumberRemoved
Comments Sources
1997 Fall, 1996 Apr. 21
210
?
5 licenses issued but harvest estimates are not available. "Count conditions were fair to good. 92% of the pronghorn counted were inside [YNP]…some portion of the population has already migrated eastward."
MDFWP (1999), removal data; Clark (1997a), count and quote
1998 Fall, 1997 Nov. 22, 1997 Mar. 31
252 231
284
?
5 licenses issued. Harvest estimated, could not reliably account for take by archers. “Good Count.”
MDFWP (1999), removal data; Clark (1997b), Nov. count; Clark (1998), Mar. count and quote; Caslick and Caslick (1999), estimate
1999 Fall, 1998 Mar. 25
204
? 5 licenses issued. Harvest estimated, could not reliably account for take by archers. “Good Count”
MDFWP (1999), removal data; Clark (1999), count and quote
2000 Fall, 1999 Apr. 3
205 ?
5 licenses issued. Harvest estimated, could not reliably account for take by archers. “Good Count”
Lemke (MDFWP, pers. commun.), removal data; Mack (2000, 2001), count and quote
2001 Fall, 2000 Apr. 3
206
? 5 licenses issued. Harvest estimated, could not reliably account for take by archers. “Fair Count”
Lemke (MDFWP, pers. commun.), removal data; Mack (2001)
1Information taken from summary data sheet compiled by Dr. M. D. Scott. Although apparently based on a review of historical records, the summary did not cite the sources of information used. 2 Scott’s (1994) estimate of “~400” animals is less than that of Anonymous (1898), the only other data source located for 1898. 3 Scott’s (1994) estimate of “~600” animals is less than Skinner’s (1922a) estimate, the only other data source located for 1899. 4 Scott’s (1994) note of a “rapidly increasing” pronghorn herd conflicts with Hofer (1902). 5 Skinner (1922a) (whom Barmore [1981] cited) estimated 1,000; Scott (1994) estimated “~900,” but cited no source for his information. 6 An estimate of 1,150 is generally cited (e.g., Barmore 1981, Scott 1994), but sources suggest this actually was a rough count. Also, Anonymous (1905a) lists an average count of 1,100 animals, but Pitcher’s (1905) figure of 1,150 is considered to be more authoritative. 7 Although Anonymous (1905a) estimates the herd at 1,500–1,700, I follow previous workers (Skinner 1922a, Barmore 1981, Scott 1994) and use the lower figure. 8 Scott (1994) listed an estimate of “~2000,” which may have been based on the statement (Anonymous 1906b) that “…about 1,500 of these animals came down to the feeding grounds…and as very few of them died or were lost from any cause, the number this year should be at least 2,000.” I follow Barmore (1981) and Skinner (1922a) in using the lower figure of 1,500. 9 Barmore (1981) regarded this (and, more generally, other high counts of the early 1900s) as a summer count. See text for evidence that this estimate was based on animals wintering in YNP. 10 Scott (1994) lists “~650,” apparently taking the average of Skinner’s (1922a) range of values. The Superintendent (1910) references a herd of 700. Anonymous (1910) states that, of the animals that escaped through the park fence, soldiers at YNP “succeeded in rounding up and returning…some 800 or 900 antelope.”
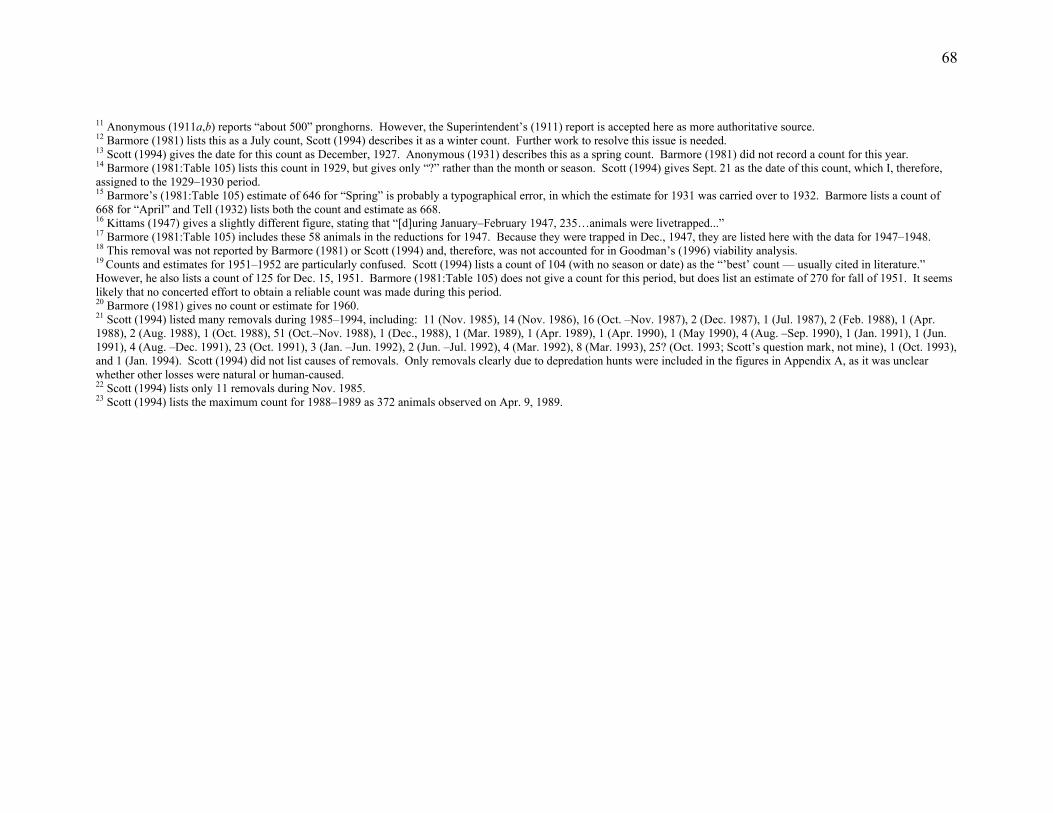
68
11 Anonymous (1911a,b) reports “about 500” pronghorns. However, the Superintendent’s (1911) report is accepted here as more authoritative source. 12 Barmore (1981) lists this as a July count, Scott (1994) describes it as a winter count. Further work to resolve this issue is needed. 13 Scott (1994) gives the date for this count as December, 1927. Anonymous (1931) describes this as a spring count. Barmore (1981) did not record a count for this year. 14 Barmore (1981:Table 105) lists this count in 1929, but gives only “?” rather than the month or season. Scott (1994) gives Sept. 21 as the date of this count, which I, therefore, assigned to the 1929–1930 period. 15 Barmore’s (1981:Table 105) estimate of 646 for “Spring” is probably a typographical error, in which the estimate for 1931 was carried over to 1932. Barmore lists a count of 668 for “April” and Tell (1932) lists both the count and estimate as 668. 16 Kittams (1947) gives a slightly different figure, stating that “[d]uring January–February 1947, 235…animals were livetrapped...” 17 Barmore (1981:Table 105) includes these 58 animals in the reductions for 1947. Because they were trapped in Dec., 1947, they are listed here with the data for 1947–1948. 18 This removal was not reported by Barmore (1981) or Scott (1994) and, therefore, was not accounted for in Goodman’s (1996) viability analysis. 19 Counts and estimates for 1951–1952 are particularly confused. Scott (1994) lists a count of 104 (with no season or date) as the “’best’ count — usually cited in literature.” However, he also lists a count of 125 for Dec. 15, 1951. Barmore (1981:Table 105) does not give a count for this period, but does list an estimate of 270 for fall of 1951. It seems likely that no concerted effort to obtain a reliable count was made during this period. 20 Barmore (1981) gives no count or estimate for 1960. 21 Scott (1994) listed many removals during 1985–1994, including: 11 (Nov. 1985), 14 (Nov. 1986), 16 (Oct. –Nov. 1987), 2 (Dec. 1987), 1 (Jul. 1987), 2 (Feb. 1988), 1 (Apr. 1988), 2 (Aug. 1988), 1 (Oct. 1988), 51 (Oct.–Nov. 1988), 1 (Dec., 1988), 1 (Mar. 1989), 1 (Apr. 1989), 1 (Apr. 1990), 1 (May 1990), 4 (Aug. –Sep. 1990), 1 (Jan. 1991), 1 (Jun. 1991), 4 (Aug. –Dec. 1991), 23 (Oct. 1991), 3 (Jan. –Jun. 1992), 2 (Jun. –Jul. 1992), 4 (Mar. 1992), 8 (Mar. 1993), 25? (Oct. 1993; Scott’s question mark, not mine), 1 (Oct. 1993), and 1 (Jan. 1994). Scott (1994) did not list causes of removals. Only removals clearly due to depredation hunts were included in the figures in Appendix A, as it was unclear whether other losses were natural or human-caused. 22 Scott (1994) lists only 11 removals during Nov. 1985. 23 Scott (1994) lists the maximum count for 1988–1989 as 372 animals observed on Apr. 9, 1989.
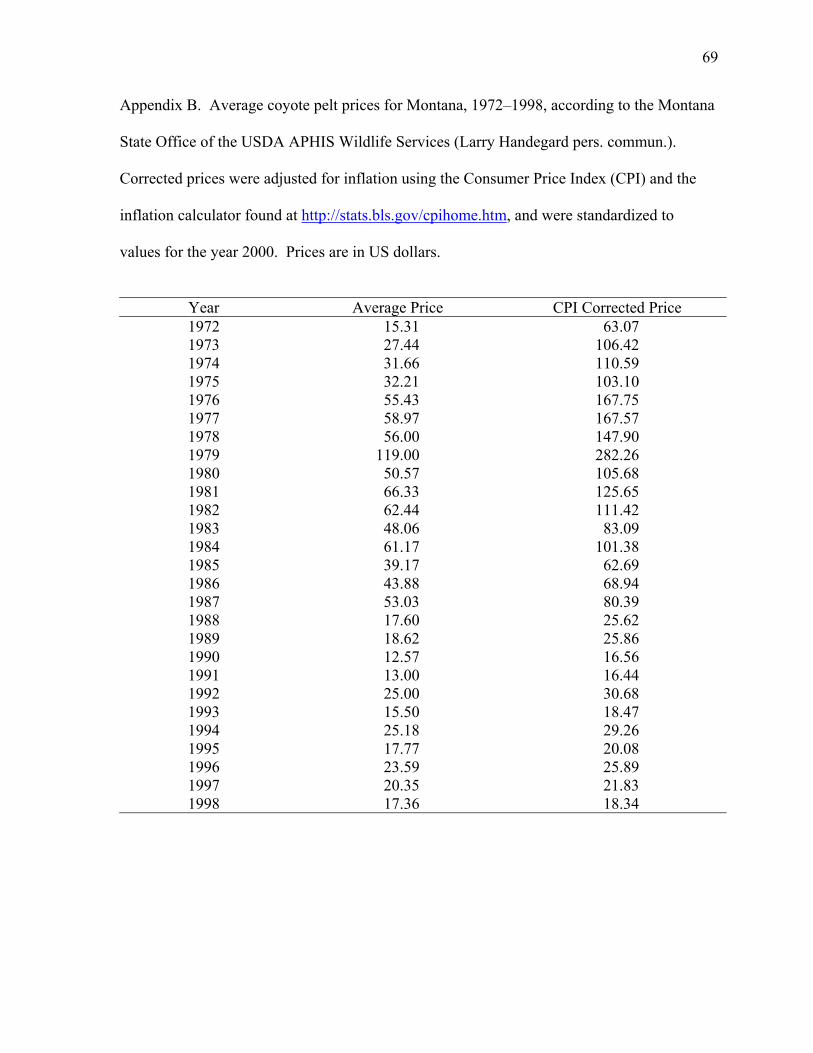
69
Appendix B. Average coyote pelt prices for Montana, 1972–1998, according to the Montana
State Office of the USDA APHIS Wildlife Services (Larry Handegard pers. commun.).
Corrected prices were adjusted for inflation using the Consumer Price Index (CPI) and the
inflation calculator found at http://stats.bls.gov/cpihome.htm, and were standardized to
values for the year 2000. Prices are in US dollars.
Year Average Price CPI Corrected Price 1972 15.31 63.07 1973 27.44 106.42 1974 31.66 110.59 1975 32.21 103.10 1976 55.43 167.75 1977 58.97 167.57 1978 56.00 147.90 1979 119.00 282.26 1980 50.57 105.68 1981 66.33 125.65 1982 62.44 111.42 1983 48.06 83.09 1984 61.17 101.38 1985 39.17 62.69 1986 43.88 68.94 1987 53.03 80.39 1988 17.60 25.62 1989 18.62 25.86 1990 12.57 16.56 1991 13.00 16.44 1992 25.00 30.68 1993 15.50 18.47 1994 25.18 29.26 1995 17.77 20.08 1996 23.59 25.89 1997 20.35 21.83 1998 17.36 18.34
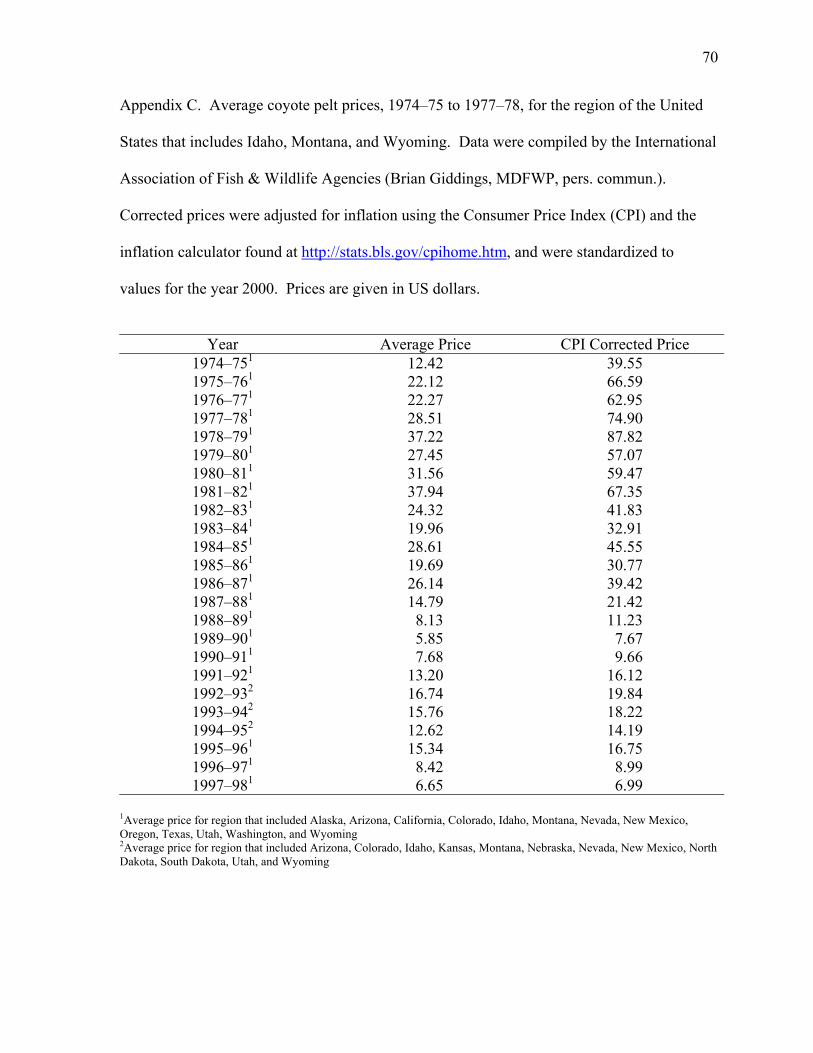
70
Appendix C. Average coyote pelt prices, 1974–75 to 1977–78, for the region of the United
States that includes Idaho, Montana, and Wyoming. Data were compiled by the International
Association of Fish & Wildlife Agencies (Brian Giddings, MDFWP, pers. commun.).
Corrected prices were adjusted for inflation using the Consumer Price Index (CPI) and the
inflation calculator found at http://stats.bls.gov/cpihome.htm, and were standardized to
values for the year 2000. Prices are given in US dollars.
Year Average Price CPI Corrected Price
1974–751 12.42 39.55 1975–761 22.12 66.59 1976–771 22.27 62.95 1977–781 28.51 74.90 1978–791 37.22 87.82 1979–801 27.45 57.07 1980–811 31.56 59.47 1981–821 37.94 67.35 1982–831 24.32 41.83 1983–841 19.96 32.91 1984–851 28.61 45.55 1985–861 19.69 30.77 1986–871 26.14 39.42 1987–881 14.79 21.42 1988–891 8.13 11.23 1989–901 5.85 7.67 1990–911 7.68 9.66 1991–921 13.20 16.12 1992–932 16.74 19.84 1993–942 15.76 18.22 1994–952 12.62 14.19 1995–961 15.34 16.75 1996–971 8.42 8.99 1997–981 6.65 6.99
1Average price for region that included Alaska, Arizona, California, Colorado, Idaho, Montana, Nevada, New Mexico, Oregon, Texas, Utah, Washington, and Wyoming 2Average price for region that included Arizona, Colorado, Idaho, Kansas, Montana, Nebraska, Nevada, New Mexico, North Dakota, South Dakota, Utah, and Wyoming