Embed Size (px)
Citation preview

SHAMEMA AKTEREconomist, ACE Consultant Ltd.a subsidiary of SMEC International Pty LtdHigh Quality Consulting and Development Solutions
Mobile: 01823472936Email: [email protected] ; www.linkedin.com
History of Economic Development of Bangladesh

Page | iShamema Akter, Economist, ACE Consultant [email protected]
Table of Contents0.0 Abstract:.............................................................................................................................................. v
1.0 Background ......................................................................................................................................... 1
1.1 Demographic Feature .......................................................................................................................1
1.2 Population ....................................................................................................................................... 1
1.3 Occupation ...................................................................................................................................... 2
1.4 Unemployment:................................................................................................................................2
2.0 General Economic Situating ..................................................................................................................5
2.1 Gross Domestic Product (GDP) ......................................................................................................... 5
2.2 Per Capita Income ...........................................................................................................................7
2.3 Bangladesh Regional Context ........................................................................................................... 7
2.4 Price Level ....................................................................................................................................10
2.5 Exchange Rate ..............................................................................................................................13
2.6 Poverty .........................................................................................................................................14
2.7 Agriculture .....................................................................................................................................15
2.8 Fruit Production .............................................................................................................................15
2.9 Fishery and Livestock’s...................................................................................................................16
2.10 Forestry ........................................................................................................................................17
2.11 Industry .........................................................................................................................................17
2.12 Foreign Trade ................................................................................................................................19
2.13 Infrastructure .................................................................................................................................21
2.14 Conclusion ....................................................................................................................................25

Page | iiShamema Akter, Economist, ACE Consultant [email protected]
Abbreviations and Glossaries
ACE Associated Consulting Engineers Ltd.ADB Asian Development BankAman Crop season, usually August to DecemberAus Crop season, usually April to JulyBB Bangladesh BankBBS Bangladesh Bureau of StatisticBCIC Bangladesh Chemical Industries CorporationBDT Bangladeshi TakaBLPA Bangladesh Land Port AuthorityBoro Crop season, usually January to April/MayBR Bangladesh RailwayBRDB Bangladesh RailwayBRTA Bangladesh Road Transport AuthorityBSBK Bangladesh Sthala Bandar KartripakshaBTCL Bangladesh Telecommunications Company LimitedBTMC) Bangladesh Textiles Mills CorporationCPI Consumer Price and InflationDoF Department of FisheriesE ExportERD Economic Relations Division (of the Ministry of Finance)FY YearGDP Gross Domestic ProductGNI Gross National ProductGoB Government of BangladeshHH HouseholdKhas land Public land, land owned by the governmentLGED Local Government Engineering DepartmentM ImportMT Metric Ton,NBR National Board of RevenueNNI Net National ProductPCI Per Capita IncomeRHD Roads and Highways DepartmentRly RailwaysSMEC Snowy Mountain Engineering CorporationTK Bangladesh TakaWB World Bank$ US dollar

Page | iiiShamema Akter, Economist, ACE Consultant [email protected]
List of Tables
Table:01. Level of Unemployment in Bangladesh
Table-02 . GDP, Bangladesh-2012-14
Table -03. Economic growth forecast
Figure-4a. Per capita income in US Dollar -2004-2013
Table-04b. GDP % growth, annual, according to WB
Table-5 Bangladesh Regional Context (5a & 5b)
Table-06. Consumer Price Index and Inflation
Table-07: Overseas Employment and Remittances
Table-08: Monthly data of Wage earner's remittance
Table-09: Exchange rates
Table-10: Rate of Inflation
Table- 11 : Poverty headcount ratio at national poverty line (% of population)
Table-12 Food Grain Production-2013-14
Table -13 : Livestock and Poultry farms, year, 2010-2014
Table 14: Size and Growth Rate of Manufacturing Sector
Table-15, Goods production under BCIC-2013-14
Table- 16, Production of Yarn and Fabrics in Public and Private Sectors-2013-14
Table 17 Traffic through Land Port under Bangladesh Land Port Authority, 2007 to 2014
Table: 18. Subscriber Number, Growth and Teledensity of Mobile and Fixed Phone
Table-19,: Various Categories of Roads under LGED’s Roads
Table-20 : Various Categories of Roads under Roads and Highways Department

Page | ivShamema Akter, Economist, ACE Consultant [email protected]
List of Figures:
Figure 01: Population growth in Bangladesh
Figure: 02. Level of Unemployment in Bangladesh
Figure -03. Economic growth forecast
Figure-04. Per capita income in US Dollar -2004-2013
Table-05. GDP % growth, annual, according to WB
Figure-6, Inflation Rate- 2013, according to ADB
Figure-7, Proportion of Population Below the Poverty Line and Poverty
Figure-08. Consumer Price x and Inflation
Figure-09: Overseas Employment and Remittances
Figure-10:The exchange rate of the Bangladeshi Taka against US Dollar
Figure-11 : Livestock and Poultry farms, year, 2010-2014
Figure- 12: Size and Growth Rate of Manufacturing Sector
Fugure-13, Goods production under BCIC-2013-14
Figure 14: Production and Consumption of Natural Gas by Sector -2012/123 and 2013-14
Figure-15. Subscriber Number, Growth and Tele density of Mobile and Fixed Phone
Figure -16, : Various Categories of Roads under LGED’s Roads
Figure -17 : Various Categories of Roads under Roads and Highways Department

Page | vShamema Akter, Economist, ACE Consultant [email protected]
0.0 Abstract:Bangladesh has made significant progresses in its economic sector performance since independence in1971. Even though, the economy has developed enormously in the 1990s, Bangladesh still suffers in thearea of foreign trade in South Asian region. Bangladesh is a least development country. It has totalpopulation 156.6 million (WB-2013). GDP Growth rate 6 % which was 6.2% in 2012. GNI per capita US $900 (2013) which US$ 830 in 2012. Inflation rate 7.5%. In 2013-14, growth in agriculture, industry andservice sector has been estimated to 3.35%, 8.39%and 5.83% respectively which was 2.46%, 9.64% and5.51% in 2012-13 respectively. In FY 2013-14, GDP and GNI per capita raised at US$ 1190 and US$1115 which were US$ 1054 and US$ 976 respectively in the last fiscal year. The export earnings ofBangladesh stood at US $ 24,654.39 million in FY 2013-14. On the other hand, the total import paymentsstood at US $29773.70 million during FY 2013-14, which was 17.48% (percent) higher than precedingyear. In FY2014. Workers’ remittances declined slightly due to the impact of global recession.Bangladesh earned remittances of US$ 10494.73 million in FY 2013-14 (July- march) which was 5.63%lower than the previous year. People living below national poverty line 31.5% in 2010 which was 40% in2005. Fruit, bolder/stones, pulses, Rice, wheat, sugar, fruit, stone, fertilizer chemicals and ash aregenerally imported whereas exports are ship, textiles, leather goods, fish and seafood, footwear,engineering products fruit juice,tea,medicine, garments, and Jamdani saris. A variety of fruits andagriculture foods are produced in the country. The farmers are changing the cropping pattern in favor offruits production in order to earn more money. On the other hand, fishery is a traditional occupation in thepeople of Bangladesh, which plays a major role in employment generation, poverty alleviation, supply ofanimal protein and foreign exchange earnings. This sector contributes more than 3% to the nationalGDP.The demand for telecommunication system for domestic and overseas is increasing in Bangladesh.Still this sector is growing, it is considerably cover behind. The Roads and Highways Department (RHD)were established the size of the main road network in Bangladesh has developed from 2,500 km to thepresent network of 21,589.65. The Roads categorizes as National, Regional and Feeder Road in thecountry come under the RHD’S authority. These roads are of the main highway system and provide ahigher –level of service in the country. Bangladesh Railway is one of the principal modes of transportationin the country and passenger and freight train has been facing tough competition with other modes oftransport for the high rated traffic, which provide more. The total length of railroad is 2,877.10 km. andregarding air transport facilities as well as mechanized water transport facilities are contribution oneconomic development of Bangladesh.
Key Words: GDP, GNI per capita, remittances, Inflation, Exchange rate

1
1.0 Background
The Peoples of Republic Bangladesh lies in the northeastern part of South Asia and is bounded by Indiaon the west the north and the northwest and Myanmar on the southeast and Bay of Bengal on the south.The country occupies an area of 147,600 km2, 156.6 million people (WB, 2013)*, forming populationdensity as 1067 persons/ km2, GDP US$129.9 billion, GDP growth rate 6%, inflation rate 7.5%.Proportion of population below poverty line 31.5% (ADB, 2012).The country is divided into 6 (six)divisions, and subdivided into 64 districts and 496 police stations (upazilla/ sub districts) for administrativeand development purpose. River: A network of revers of which the Padma, the Jamuna, the Theeesta,the Brahmoputra, the Surma, the Meghna, the Karnophuli are important. Land: The country consist s oflow, flat and fertile land and expect the hilly regions in the northeast and southeast and some areas ofhigh lands in the northwestern part.
1.1 Demographic Feature1.2 Population
Bangladesh is one of the most densely populated countries of the world. The population density has beenrecorded as 1067 persons/km2 in the national census shown 2012, as per the 2013 approximations morethan 156.6 million people live in the country.
Figure 01: Population growth in Bangladesh
Data Source: World Development Indicators
The figure-01 shows that the Population of the country is also analyzed to higher concentration ofpopulation can be seen in the year of 2013 (156.6 million). According to WB, in 2012, the population was154.7 million. Regarding to the World Bank population in Bangladesh increased from 2004 to 2013 with15.4 million. Bangladesh has the highest population density among large countries,. 1066.7 persons persquare kilometer,( below mention table-5a)
Page | 2Shamema Akter, Economist, ACE Consultant [email protected]
0
2
4
6
8
2004 2005 2006 2007 2008 2009 2010 2011 2012Unemploymentrate(%)
Data Source: World Development Indicators
Unemployment ( Percentage of total labor force)
Unemployment, female (national estimate) Unemployment, female, ILO estimate)
1.3 Occupation
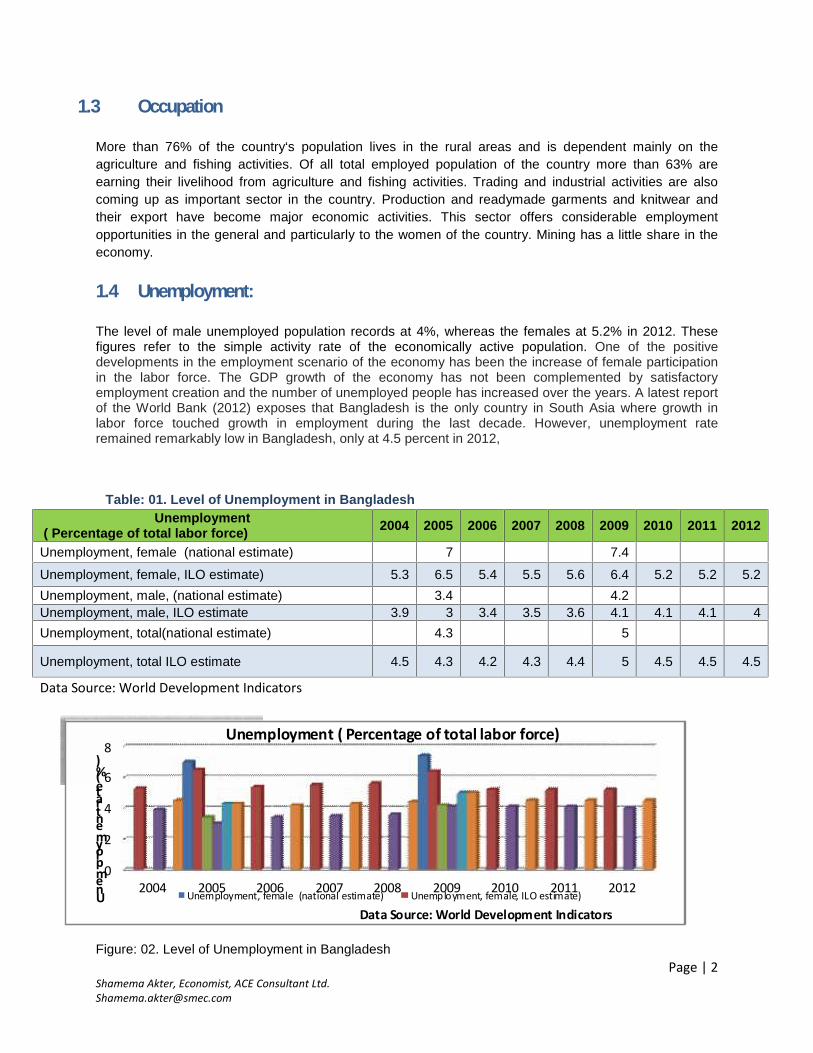
More than 76% of the country‘s population lives in the rural areas and is dependent mainly on theagriculture and fishing activities. Of all total employed population of the country more than 63% areearning their livelihood from agriculture and fishing activities. Trading and industrial activities are alsocoming up as important sector in the country. Production and readymade garments and knitwear andtheir export have become major economic activities. This sector offers considerable employmentopportunities in the general and particularly to the women of the country. Mining has a little share in theeconomy.
1.4 Unemployment:
The level of male unemployed population records at 4%, whereas the females at 5.2% in 2012. Thesefigures refer to the simple activity rate of the economically active population. One of the positivedevelopments in the employment scenario of the economy has been the increase of female participationin the labor force. The GDP growth of the economy has not been complemented by satisfactoryemployment creation and the number of unemployed people has increased over the years. A latest reportof the World Bank (2012) exposes that Bangladesh is the only country in South Asia where growth inlabor force touched growth in employment during the last decade. However, unemployment rateremained remarkably low in Bangladesh, only at 4.5 percent in 2012,
Table: 01. Level of Unemployment in BangladeshUnemployment
( Percentage of total labor force) 2004 2005 2006 2007 2008 2009 2010 2011 2012
Unemployment, female (national estimate) 7 7.4
Unemployment, female, ILO estimate) 5.3 6.5 5.4 5.5 5.6 6.4 5.2 5.2 5.2Unemployment, male, (national estimate) 3.4 4.2Unemployment, male, ILO estimate 3.9 3 3.4 3.5 3.6 4.1 4.1 4.1 4Unemployment, total(national estimate) 4.3 5
Unemployment, total ILO estimate 4.5 4.3 4.2 4.3 4.4 5 4.5 4.5 4.5
Data Source: World Development Indicators
Figure: 02. Level of Unemployment in Bangladesh

Page | 3Shamema Akter, Economist, ACE Consultant [email protected]

Page | 5Shamema Akter, Economist, ACE Consultant [email protected]
2.0 General Economic Situating
2.1 Gross Domestic Product (GDP)
The value of country’s GDP has been estimated at 7745385 million tk (Base year (2005-06), which ismore than 6.12% of the last year.in 2013-14,GNI 14409370 million TK which was12953523 in 2012-13 ithas increased by 11.24% pa. at constant prices. However, the GDP has grown at 5.6% pa during year.The growth rates of GDP 6.0% (Table-04) in 2013e, in 2014f, 4%which was in 6.0%. In 2013-14, GDPgrowth in agriculture, industry and service sector has been estimated to 3.35%, 8.39%and 5.83%respectively.
Table-02 . GDP, Bangladesh-2012-14
Items 2013-2014* 2012-2013Changes over previous year
absolute percentage
GDP at current prices, inmillion Taka 13509204 11989232 1519972 12.68%
GNI at current prices, inmillion Taka 14409370 12953523 1455847 11.24%
NNI at current prices, inmillion Taka 13242572 11916816 1325756 11.13%
GDP at constant prices(base 2005-06), 7745385 7298965 446420 6.12%in million TakaGNI at constant prices(base 2005-06), 8261487 7886019 375468 4.76%in million TakaPer Capita GDP atcurrent prices, in Taka 86731 78009 8722 11.18%
Per Capita GDP atconstant prices (base2005-06), 49714 47488 2226 4.69%
in TakaPer Capita GNI atcurrent prices, in Taka 92510 84283 8227 9.76%
Per Capita GNI atconstant prices (base2005-06), 53040 51311 1729 3.37%
in TakaSource : BBS ( Bangladesh Bureau of Statistics ), * := Provisional, and Bangladesh Bank (BB)

Page | 6Shamema Akter, Economist, ACE Consultant [email protected]
Previous Revised Previous Revised
2014 2015
5.6% 6.1% 6.2% 6.4%7.5% 7.4%
6.5% 6.5%
Economic growth forecast -2014-2015GDP Growth forecast Annual Inflation forecast
Table -03. Economic growth forecast2014 2015
Previous Revised Previous RevisedGDP Growthforecast 5.6% 6.1% 6.2% 6.4%AnnualInflationforecast 7.5% 7.4% 6.5% 6.5%Source: The Daily Star Business Report ,Dated 26, 2014 ,"ADB lifts economic growth forecast for Bangladesh"
From above Table 03 and figure-03 are demonstration, The Asian Development Bank, which announcesannual growth figures a month before the country’s financial year ends in June, also revised its figuresfor 2014 growth upwards to 6.1% (percent) from a provisional estimate of 5.6%.The ADB had forecast in2015 , 6.4 percent growth rate for Bangladesh. ADB has revised economic Annual inflation rate in 2014revised 7.4 % from 7.5 % (previous).and forecast in 2015, 6.4% which lower than year of 2014. This isvery positive on Bangladesh's growth prospect.
Figure -03. Economic growth forecast
Page | 7Shamema Akter, Economist, ACE Consultant [email protected]
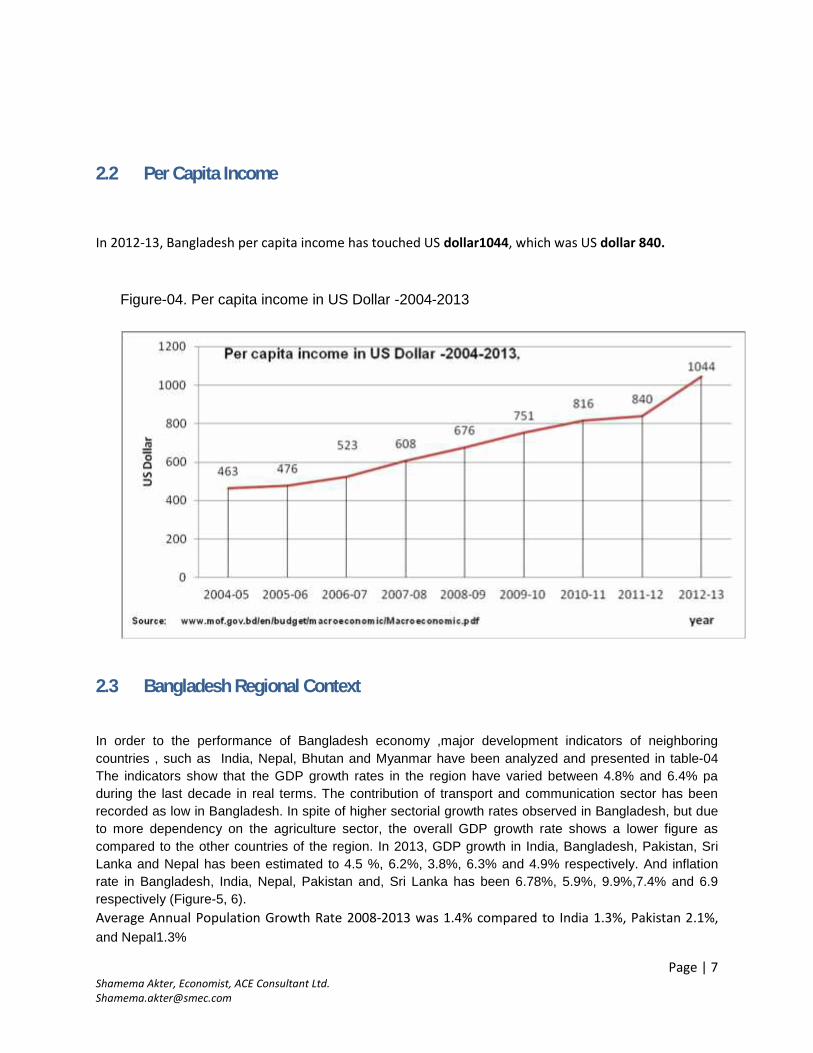
2.2 Per Capita Income
In 2012-13, Bangladesh per capita income has touched US dollar1044, which was US dollar 840.
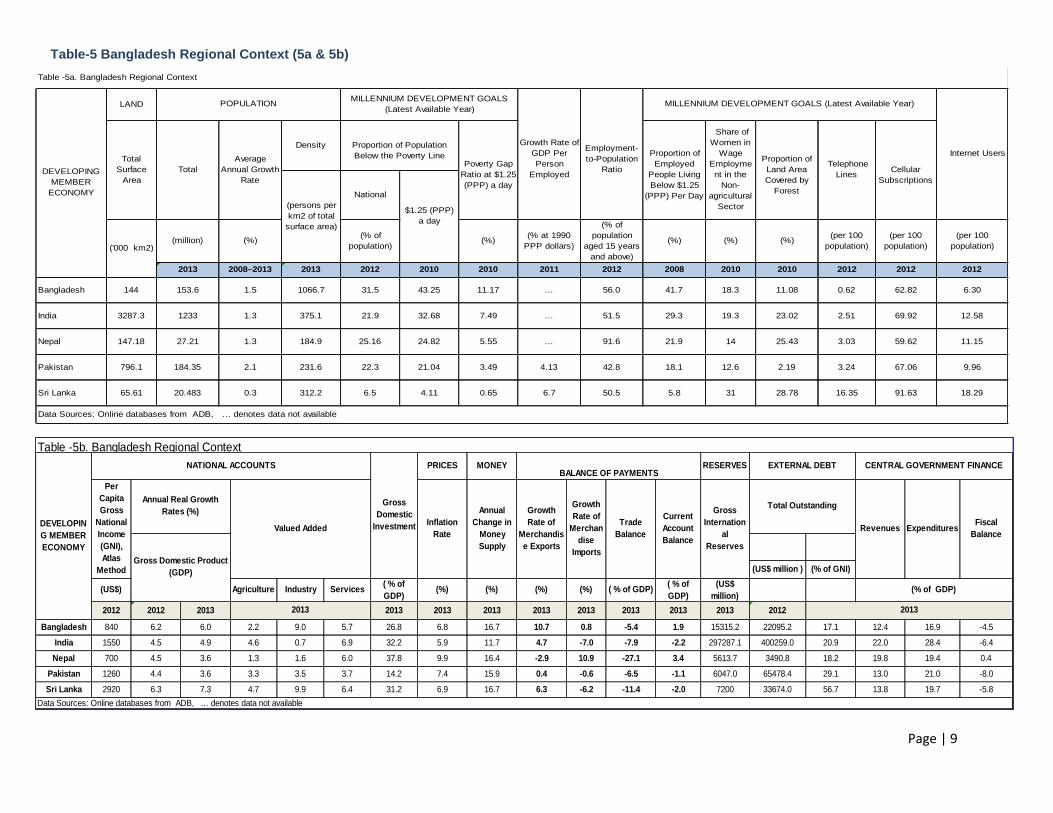
2.3 Bangladesh Regional Context
In order to the performance of Bangladesh economy ,major development indicators of neighboringcountries , such as India, Nepal, Bhutan and Myanmar have been analyzed and presented in table-04The indicators show that the GDP growth rates in the region have varied between 4.8% and 6.4% paduring the last decade in real terms. The contribution of transport and communication sector has beenrecorded as low in Bangladesh. In spite of higher sectorial growth rates observed in Bangladesh, but dueto more dependency on the agriculture sector, the overall GDP growth rate shows a lower figure ascompared to the other countries of the region. In 2013, GDP growth in India, Bangladesh, Pakistan, SriLanka and Nepal has been estimated to 4.5 %, 6.2%, 3.8%, 6.3% and 4.9% respectively. And inflationrate in Bangladesh, India, Nepal, Pakistan and, Sri Lanka has been 6.78%, 5.9%, 9.9%,7.4% and 6.9respectively (Figure-5, 6).Average Annual Population Growth Rate 2008-2013 was 1.4% compared to India 1.3%, Pakistan 2.1%,and Nepal1.3%
Figure-04. Per capita income in US Dollar -2004-2013

Page | 8Shamema Akter, Economist, ACE Consultant [email protected]
Table-04. GDP % growth, annual, according to WBCountry GDP % growth, annual
2012 2013 e 2014f 2015f 2016f
India 4.5 4.7 5.5 6.3 6.6
Bangladesh 6.2 6.0 5.4 5.9 6.2
Pakistan 3.8 3.7 3.7 3.9 4.0
Sri Lanka 6.3 7.8 7.2 6.9 6.7
Nepal 4.9 3.6 4.5 4.3 4.3
Source: World Bank,Notes: e = estimate; f = forecast
Page | 9
LAND
Density
(million) (%) (% ofpopulation)
(%) (% at 1990PPP dollars)
(% ofpopulation
aged 15 yearsand above)
(%) (%) (%) (per 100population)
(per 100population)
(per 100population)
2013 2008–2013 2013 2012 2010 2010 2011 2012 2008 2010 2010 2012 2012 2012
Bangladesh 144 153.6 1.5 1066.7 31.5 43.25 11.17 … 56.0 41.7 18.3 11.08 0.62 62.82 6.30
India 3287.3 1233 1.3 375.1 21.9 32.68 7.49 … 51.5 29.3 19.3 23.02 2.51 69.92 12.58
Nepal 147.18 27.21 1.3 184.9 25.16 24.82 5.55 … 91.6 21.9 14 25.43 3.03 59.62 11.15
Pakistan 796.1 184.35 2.1 231.6 22.3 21.04 3.49 4.13 42.8 18.1 12.6 2.19 3.24 67.06 9.96
Sri Lanka 65.61 20.483 0.3 312.2 6.5 4.11 0.65 6.7 50.5 5.8 31 28.78 16.35 91.63 18.29
('000 km2)
Table -5a. Bangladesh Regional Context
Proportion ofLand AreaCovered by
Forest
TelephoneLines Cellular
Subscriptions
Internet Users
Data Sources: Online databases from ADB, … denotes data not available
DEVELOPINGMEMBER
ECONOMY
TotalSurface
AreaTotal
AverageAnnual Growth
Rate
(persons perkm2 of total
surface area)
National
Proportion of PopulationBelow the Poverty Line
MILLENNIUM DEVELOPMENT GOALS(Latest Available Year)
POPULATION
Proportion ofEmployed
People LivingBelow $1.25
(PPP) Per Day
MILLENNIUM DEVELOPMENT GOALS (Latest Available Year)
Employment-to-Population
Ratio
Growth Rate ofGDP PerPerson
EmployedPoverty Gap
Ratio at $1.25(PPP) a day
$1.25 (PPP)a day
Share ofWomen in
WageEmployment in the
Non-agricultural
Sector
PRICES MONEY RESERVES
(US$ million ) (% of GNI)
(US$) Agriculture Industry Services ( % ofGDP)
(%) (%) (%) (%) ( % of GDP) ( % ofGDP)
(US$million)
2012 2012 2013 2013 2013 2013 2013 2013 2013 2013 2013 2012
Bangladesh 840 6.2 6.0 2.2 9.0 5.7 26.8 6.8 16.7 10.7 0.8 -5.4 1.9 15315.2 22095.2 17.1 12.4 16.9 -4.5
India 1550 4.5 4.9 4.6 0.7 6.9 32.2 5.9 11.7 4.7 -7.0 -7.9 -2.2 297287.1 400259.0 20.9 22.0 28.4 -6.4
Nepal 700 4.5 3.6 1.3 1.6 6.0 37.8 9.9 16.4 -2.9 10.9 -27.1 3.4 5613.7 3490.8 18.2 19.8 19.4 0.4
Pakistan 1260 4.4 3.6 3.3 3.5 3.7 14.2 7.4 15.9 0.4 -0.6 -6.5 -1.1 6047.0 65478.4 29.1 13.0 21.0 -8.0
Sri Lanka 2920 6.3 7.3 4.7 9.9 6.4 31.2 6.9 16.7 6.3 -6.2 -11.4 -2.0 7200 33674.0 56.7 13.8 19.7 -5.8
Table -5b. Bangladesh Regional Context
GrossInternation
alReserves
Total Outstanding
Data Sources: Online databases from ADB, … denotes data not available
EXTERNAL DEBT CENTRAL GOVERNMENT FINANCE
2013
(% of GDP)
Revenues Expenditures FiscalBalance
InflationRate
AnnualChange in
MoneySupply
GrowthRate of
Merchandise Exports
GrowthRate of
Merchandise
Imports
TradeBalance
BALANCE OF PAYMENTS
CurrentAccountBalance
Annual Real GrowthRates (%)
Gross Domestic Product(GDP)
2013
Valued Added
GrossDomestic
InvestmentDEVELOPING MEMBERECONOMY
NATIONAL ACCOUNTS
PerCapitaGross
NationalIncome(GNI),Atlas
Method
Table-5 Bangladesh Regional Context (5a & 5b)

Page | [email protected]
2.4 Price Level
Unlike Several developing countries, Bangladesh has been observing a moderate level of price rise. Thiscan be observed in the Consumer’s Price index (CPI). In FY 2012-13, CPI has different among 6.78%and 5.22% and 9.17% respectively.
Table-06. Consumer Price Index and Inflation(Base year 2005-2006=100)
Year General (%change) Food (% change) Non-food (% change)2006-07 109.39 9.39 111.63 11.63 106.51 6.51
2007-08 122.84 12.3 130.3 16.72 113.27 6.35
2008-09 132.17 7.6 140.61 7.91 127.36 7.14
2009-10 141.18 6.82 149.4 6.25 130.66 7.66
2010-11 156.59 10.91 170.48 14.11 138.77 6.21
2011-12 170.19 8.69 183.65 7.72 152.94 10.21
2012-13 181.73 6.78 193.24 5.22 166.97 9.17
Source Bangladesh Economic Review 2013-14, Page- ,CHAPTER 3,page-26,
Figure-08. Consumer Price x and Inflation
020406080
100120140160180200
2006-07 2007-08 2008-09 2009-10 2010-11 2011-12 2012-13
ConsumerPrice
year
Consumer Price Index (CPI) and Inflation General
Food
Non-food

Page | [email protected]
Overseas Employment creates important contribution towards accelerating economic development ofthe country. During the last decade Employment of the people of Bangladesh has grown manifold indifferent activities. As per 2013-14 estimates, more than 2000000 people have gone abroad for jobs andsent remittance up to us$ 104 billion, which is a significant contribution to the national economy, i.e. morethan 3.5% of GDP.
Table-07: Overseas Employment and RemittancesRemittance Inflow
Year
Amount of remittance Remittance as Percent of GDP andExport Earnings
No ofemploymentabroad(000)
In millionUS$
Percentagechange (%)
Tk. InCrore
Percentagechange (%) as percent of GDP as percent of
Export
2002-03 251 3061.97 22.42 17719.58 23.31 5.9 46.762003-04 277 3371.97 10.12 19872.39 12.15 5.97 44.352004-05 250 3848.29 14.13 23646.97 18.99 6.37 44.462005-06 291 4801.88 24.78 32274.6 36.49 6.89 45.622006-07 564 5978.47 24.5 41298.5 27.96 8.74 49.092007-08 981 7914.78 32.39 54293.24 31.47 10.02 56.092008-09 650 9689.16 22.42 66674.87 22.81 10.84 62.252009-10 427 10987.4 13.4 76109.6 14.15 11.77 63.482010-11 439 11650.32 6.03 82992.89 9.04 10.43 50.822011-12 691 12843.4 10.24 101882.78 22.76 11.11 52.92
Source: Bureau of Manpower, Employment & Training and Bangladesh Bank

Page | 12Shamema Akter, Economist, ACE Consultant [email protected]
Figure-09: Overseas Employment and Remittances
From above figure-09 and table-07 shown that the manpower has been increasing in the recent years.Bangladesh earned remittances of US$ 12,843 million in 2011-12 which was 10.24% higher than theremittance earned to the tune of US$ 11,650 million in 2010-11. In FY 2011-12, 11.11% remittances ofGDP and 52.92% of total export earnings.
Table-08: Monthly data of Wage earner's remittance
Year/MonthRemittances
In million USdollar In million Taka
2014-2015August 1174.37 90961.8July 1491.36 115715.7
2013-2014June 1286.69 99885.9May 1215.83 94399.07April 1230.57 95570.1March 1288.62 100140.3February 1173.13 91213.4January 1260.66 98017December 1210.21 94095November 1061.45 82528.7October 1230.68 95686.1September 1025.69 79747.9

Page | 13Shamema Akter, Economist, ACE Consultant [email protected]
August 1005.77 78202.3July 1238.96 96337.86
2012-2013June 1058.24 82283.42May 1087.19 84629.58April 1194.4 93199.16March 1229.36 96605.19February 1163.18 91904.24January 1326.99 105559.9
Source : Foreign Exchange Policy Department, Bangladesh Bank, *:= Provisional
2.5 Exchange Rate
The exchange rate of the Bangladeshi Taka against US Dollar is approx. 77.41 which was Tk. 68.68 /US$ in 2007. The US Dollar has been rising by 4.4% pa against Taka in fact during the last eight years; theTaka has depreciated faster than early 2001s.
Table-09: Exchange rates
Year 2007 2008 2009 2010 2011 2012 2013 2014
Tk/US$ 68.68 68.65 69.15 70.8 76.2 81.26 77.75 77.41Source: Bangladesh Bank, (October), http://www.bangladesh-bank
Figure-10:The exchange rate of the Bangladeshi Taka against US Dollar
Page | 14Shamema Akter, Economist, ACE Consultant [email protected]
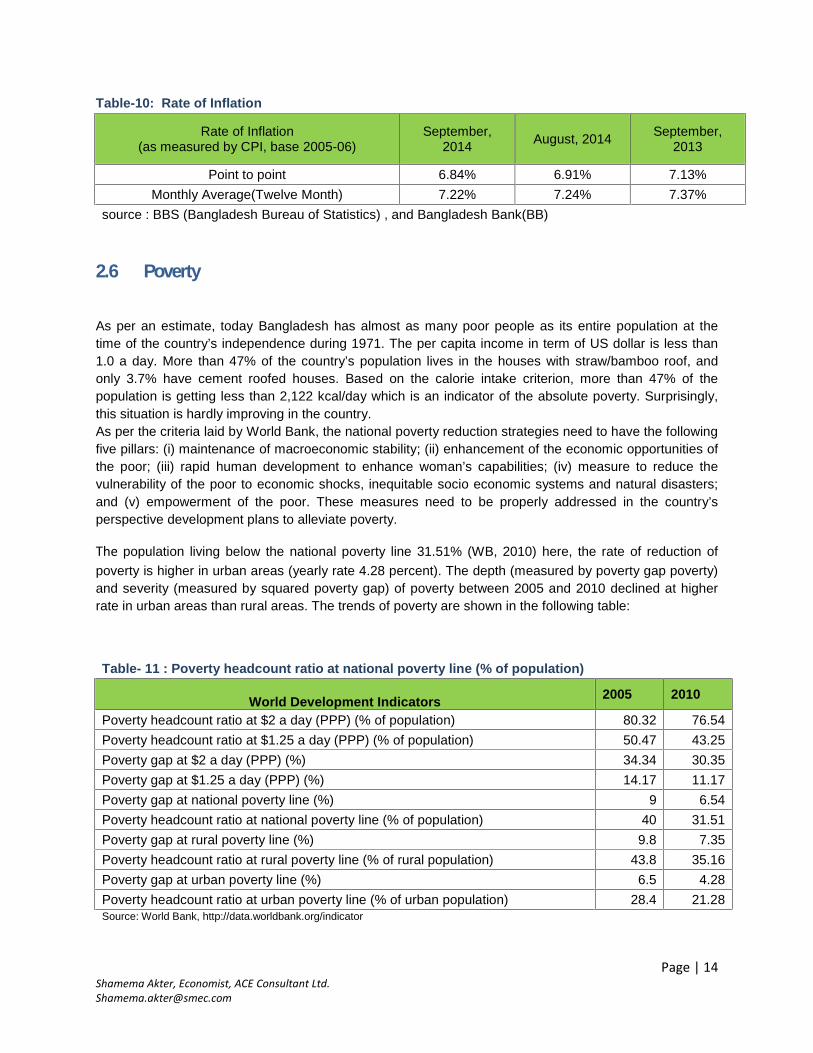
Table-10: Rate of Inflation
Rate of Inflation(as measured by CPI, base 2005-06)
September,2014 August, 2014 September,
2013
Point to point 6.84% 6.91% 7.13%Monthly Average(Twelve Month) 7.22% 7.24% 7.37%
source : BBS (Bangladesh Bureau of Statistics) , and Bangladesh Bank(BB)
2.6 Poverty
As per an estimate, today Bangladesh has almost as many poor people as its entire population at thetime of the country’s independence during 1971. The per capita income in term of US dollar is less than1.0 a day. More than 47% of the country’s population lives in the houses with straw/bamboo roof, andonly 3.7% have cement roofed houses. Based on the calorie intake criterion, more than 47% of thepopulation is getting less than 2,122 kcal/day which is an indicator of the absolute poverty. Surprisingly,this situation is hardly improving in the country.As per the criteria laid by World Bank, the national poverty reduction strategies need to have the followingfive pillars: (i) maintenance of macroeconomic stability; (ii) enhancement of the economic opportunities ofthe poor; (iii) rapid human development to enhance woman’s capabilities; (iv) measure to reduce thevulnerability of the poor to economic shocks, inequitable socio economic systems and natural disasters;and (v) empowerment of the poor. These measures need to be properly addressed in the country’sperspective development plans to alleviate poverty.
The population living below the national poverty line 31.51% (WB, 2010) here, the rate of reduction ofpoverty is higher in urban areas (yearly rate 4.28 percent). The depth (measured by poverty gap poverty)and severity (measured by squared poverty gap) of poverty between 2005 and 2010 declined at higherrate in urban areas than rural areas. The trends of poverty are shown in the following table:
Table- 11 : Poverty headcount ratio at national poverty line (% of population)
World Development Indicators 2005 2010
Poverty headcount ratio at $2 a day (PPP) (% of population) 80.32 76.54Poverty headcount ratio at $1.25 a day (PPP) (% of population) 50.47 43.25Poverty gap at $2 a day (PPP) (%) 34.34 30.35Poverty gap at $1.25 a day (PPP) (%) 14.17 11.17Poverty gap at national poverty line (%) 9 6.54Poverty headcount ratio at national poverty line (% of population) 40 31.51Poverty gap at rural poverty line (%) 9.8 7.35Poverty headcount ratio at rural poverty line (% of rural population) 43.8 35.16Poverty gap at urban poverty line (%) 6.5 4.28Poverty headcount ratio at urban poverty line (% of urban population) 28.4 21.28Source: World Bank, http://data.worldbank.org/indicator

Page | 15Shamema Akter, Economist, ACE Consultant [email protected]
Table 7.1: Food Grains Production
Aus Aman Boro Totalrice
Wheat Maize TotalCereal
2012-13 21.58 128.97 187.78 338.33 12.55 21.78 34.33 372.66 90.8 %Rice, 9.2 % Cereals
Percentage (%) 6.38 38.12 55.50 100.00 36.56 63.44 100
2013-14 23.26 130.23 189.16 342.65 12.81 22.36 35.17 377.82 90.7 %Rice, 9.31 % Cereals
Percentage (%) 6.8 38.0 55.2 100.0 36.42 63.58 100
Production in lakh MT)
Cereals GrandTotal
RiceTotal Food Grains Production %
Source: Source: Bangladesh Bureau of Statistics (BBS),
2.7 Agriculture
Agriculture is the main occupation of the country. Paddy, wheat, jute sugarcane and potato are the mainagriculture products. However, tobacco, barley, pulses, oilseed, fruits, vegetables and spices are widelyproduced in Bangladesh. During the last decade, the increase in agriculture products has been noticedonly in paddy wheat, potato and spices. Yield rates in terms of production (tones/acre), are graduallyincreasing in agriculture sector, and expected to grow further due to usage of the HYV seed, machined,fertilizers, etc. In 2013-14, growth in agriculture has been estimated to 3.35%, and which was 2.46%, in2012-13. Table-12 Food Grain Production-2013-14
Table-09 above shows, rendering to the BBS, the preponderance of food grains production in 2013-14has been 377.82 lakh MT in which 23.26 lakh MT, 130.23 lakh MT, 189.16 lakh MT, 36.42 lakh MT,63.58 lakh MT Aus, Amon , Boro , wheat and maize respectively. On the other hand, in 2012-13,the foodgrains production was about 372.66 lakh MT in which Aus 21.58 lakh MT, Aman 128.97 lakh MT, Boro187.78 lakh MT and wheat 12.55 lakh MT and maize 21.78 lakh MT.
Though rice and jute are the main crops, wheat is pretentious more significance. Tea is grown in thenortheast. Due to Bangladesh’s fertile soil and normally sufficient water supply, rice can be grown andharvested three times a year in many areas. As a result of a number of reasons, Bangladesh’s labor-intensive agriculture has achieved steady increases in food grain production despite the often unfavorableweather conditions.
2.8 Fruit Production
A variety of fruits are produced in the country. The farmers are changing the cropping pattern in favor offruits production in order to earn more money. However, due to the lack of Proper post-harvest logisticssupport, such as waste management, storage, transportation, marketing, processing etc. this sector is notin position to utilize its potential. Mango, black berry, jackfruit, banana, papaya, litchi, coconut and guavaare the main fruits of this district. The greatest production in terms of tonnage is banana, Jackfruit, Litchi,mango, Pineapple and papaya. Major Fruits producing areas of Bangladesh are Barisal, MymensinghNarshindhi, Dhaka, Chittagong, Rajshahi, Sylhet, Rangpur, Dinajpur and Natore. Mainly two categorisfruits are producing such as periodical and seasonal. Fruits are important as food because they havesufficient amount of vitamin and mineral. We should eat 115 grams fruit every day. Fruits increase our

Page | 16Shamema Akter, Economist, ACE Consultant [email protected]
digestive power. Fruits are commercially cultivated in Bangladesh. Moreover, fruits bring more moneythan field crops.
2.9 Fishery and Livestock’s
Bangladesh is an agricultural country of which livestock sector is the prominent sector. The contribution oflivestock sector to overcome malnutrition and poverty in developing countries is widely recognized.Fishery is a traditional occupation in the people of Bangladesh, which plays a major role in employmentgeneration, poverty alleviation, supply of animal protein and foreign exchange earnings. This sectorcontributes more than 4.43% to the national GDP. Per capita Annual Fish Intake 18.94 kg, annual totalfish needed 20.44 lakh mt. contribution in animal protein supply 60% (App.) (2010-11,www.fisheries.gov.bd/node/143). There are 162 fish plant in Bangladesh. Frozen shrimp and other fishand fisheries products are exporting to European countries , USA, UK, Japan, France, Hong Kong,Singapore, Saudi Arab, Sudan and other countries. Remaining fish is exported to the countries in SouthAsia and Middles. In 2013-14, earned Tk. 3080.15 crore by exporting 0.48 lakh MT of fish and fishproducts which was in 2012-13, 4159 crore by exporting 0.85 lakh MT (source: Bangladesh EconomicReview, 2014, page-103).
Livestock has been an important activity in the socio economic life of Bangladesh. This sub sector alsoaccounts for more than 1.78 %. of the GDP in 2013-14 which was 1.84% in 2012-13 (as base year 2005-06) .As per an estimate; about 20% of the population is associated with the activity on full time basis and50% on part time basis, as a source of their livelihood.
Table -13 : Livestock and Poultry farms, year, 2010-2014 Number in Lakh
Year Cow buffalo Goat Sheep Hen andcock Duck Total
2010-11 231.21 13.94 241.49 30.02 2346.86 441.2 3304.72
2011-12 231.95 14.43 251.16 30.82 2428.66 457 3414.02
2012-13 233.41 14.5 252.76 31.43 2490 472.53 3494.63
2013-14 234.39 14.54 256.11 31.56 2594.18 480.5 3611.28Source: Source: Source: Bangladesh Bureau of Statistics (BBS), and Economic review -2014, page-104.
Figure-11 : Livestock and Poultry farms, year, 2010-2014

Page | 17Shamema Akter, Economist, ACE Consultant [email protected]
2.10 Forestry
More than 11.1% (14368sq km) of the country’s area is covered by forest, but only 45% have treecoverage. Forestry shares more than 2% in the GDP. The development of forest has taken measuresto implement the policies focusing on expansion of forest in depleted hills and government khas land,widespread tree plantation in rural acres through people’s participation, afforestation program alongroads, railways, and all types of embankments.
2.11 Industry
Industrial activities are growing in the country. In 2013-14, growth in, industry sector has beenestimated to 8.39% which was 9.64% in 2012-13 and share the share is gradually increasing. Thelevels of traditional industrial products of the country such as jute, paper, cloths, and sugar have beendecreasing. However, the commodities of cement, readymade garments, tea, soap, detergent, leatherproducts are increasing.
Table 14: Size and Growth Rate of Manufacturing Sector(At constant prices of 2005-06) (Taka in crore)
Type ofIndustry 2008-09 2010-11 2011-12 2012-13 2013-14
(Provisional)
Small &Cottage 20039 21176 22569.1 24557.9 26179.4
Growth Rate(%) 8.17 5.67 6.58 8.89 6.6
Medium-Large 79631.4 88475.3 97998.3 108436.2 118364
Growth Rate(%) 6.3 11.11 10.8 10.7 9.2
Total 99670.4 109651.3 120567.4 132994.1 144543.4Growth Rate
(%) 6.65 10.01 9.96 10.53 8.68
Source: Bangladesh Bureau of Statistics, chapter 8,Industry, page-108

Page | 18Shamema Akter, Economist, ACE Consultant [email protected]
Figure- 12: Size and Growth Rate of Manufacturing Sector
From above table and figure is shown the growth rate of the manufacturing sector is 8.68% in2013-14 (provisional) which was 10.53% in 2012-13 and in 2013-14, 1.85% less than year of2012-13.
Table-15, Goods production under BCIC-2013-14
Items production ( in metric tonnes) Percentage (%)
urea fertilizer 559303 82.69TSP 53520 7.91DAP 19773 2.92paper 6646 0.98cement, 35315 5.22sanitary ware 681 0.10insulator 1170 0.17Total= 676408 100Source: Bangladesh Bureau of Statistics, Chapter 8,Industry, page-116

Page | 19Shamema Akter, Economist, ACE Consultant [email protected]
Fugure-13, Goods production under BCIC-2013-14
In 2013-14, under BCIC produced 933686 MT (82.7%) Urea, 65047 MT (7.9%) TSP, 48130 MT(2.92%) DAP, 20765 MT (0.98%) paper, 94899 MT (5.22%) cement, 1530 MT (0.10%) sanitaryware and 1103 MT (0.17%) insulator. On the other hand, 14.42 lakh sqm of glass sheet, and 2.64lakh. sft of hard board.
Table- 16, Production of Yarn and Fabrics in Public and Private Sectors-2013-14
Yarn production (million kg.) Fabric production (million metre)
Public sector Privatesector Total Public
sectorPrivatesector Total
1.32 800 801.32 0.00 3550.00 3550.00
Percentage(%) 0.16 99.84 100.00 0.00 100.00 100.00
Source: Ministry of Textiles and Jute and BBS
In 2013-14, total yarn production of 801.32 million kg which share of public sector 1.32 millionkg. and private sector 800 million kg. On the other hand, in the same year, total fabricproduction 3550.00 million metre.
2.12 Foreign Trade
Land ports are located border at key points for import and export. A land port houses the customs andborder protection, and other inspection agencies responsible for Erode contort.
Land ports in Bangladesh are located at land and inland water (river) boundaries with India, andMyanmar, which have varying needs and requirements based on their location. Bangladesh has 2400 kmland border, 92% of which is with India and 8% is with Myanmar, Bangladesh border trade is looked afterby 181 land customs stations, National Board of Revenue (NBR) controls items to be traded and fixes

Page | [email protected]
tariff for these stations. Presently, there are 16 land ports in Bangladesh. Benapole land port came operation under BSBK (Bangladesh SthalaBandar Kartripaksha) management from February 2002. Previously it was under management of the Mongla Port Authority.
Table 17a, Traffic through Land Port under Bangladesh Land Port Authority, 2007 to 2014.
The above table- show that in the year 2013/14, total export-import through the nine ports. Total import of the last five (2008, 2009, 2010,2011and2012) years is 18,506,976 MT and export is 5,359,256The trend is thus very dynamic and importance to the Bangladesh economy.
S.L Port Import Export Total Import Export Total Import Export Total Import Export Total Import Export Total Import Export Total Import Export TotalTrade
balance(E-M)
1 Benapole LandPort 1,422,762 234,472 1,657,234 872,819 470,332 1,343,151 1,148,468 286,700 1,435,168 1,147,972 371,798 1,519,770 1,221,470 464,040 1,685,510 1124126 562,616 1,686,742 1252250 300274 1,552,524 -951976
2 SonamosjidLand Port 982,956 0 982,956 820,645 0 820,645 876,295 0 876,295 1,401,586 0 1,401,586 1,401,922 0 1,401,922 1,563,717 - 1,563,717 1746993 1,746,993 -1746993
3 Hilli Land Port289,977 15,473 305,450 385,600 12,705 398,305 410,391 11,940 422,331 400,833 43,296 444,129 603,204 10,721 613,925 853,380 18,691 872,071 851759 23870 875,629 -827889
4 Burimari LandPort 313,423 85,027 398,450 281,671 40,309 321,980 299,222 146,831 446,053 396,333 73,210 469,543 357,539 0 357,539 227,219 - 227,219 935141 935,141 -935141
5 Akhaura LandPort 12 298,700 298,712 680 322,800 323,480 557 442,965 443,522 335 546,523 546,858 172 575,550 575,722 60 372,381 372,441 251 278377 278,628 278126
6 BibirbazarLand Port 109 56,764 56,873 39 61,323 61,362 31 48,236 48,267 15 88,200 88,215 0 125,431 125,431 - 124,689 124,689 24 63,596 63,620 63572
7 BanglabandhaLand Port 0 0 0 0 0 0 0 0 0 99,639 12,442 112,081 168,728 4,553 173,281 214,268 40,790 255,058 515700 14513 530,213 -501187
8 Teknaf LandPort 146,712 8,175 154,887 149,968 7,170 157,138 99,039 11,731 110,770 92,538 8,810 101,348 85,519 633 86,152 66,352 8,391 74,743 105,755 6,504 112,259 -99251
9 Bhomra LandPort 792,849 8,320 801,169 941,775 35,129 976,904 1458413 44299 1,502,712 -1414114
Total3,155,951 698,611 3,854,562 2,511,422 914,639 3,426,061 2,834,003 948,403 3,782,406 3,539,251 1,144,279 4,683,530 4,631,403 1,189,248 5,820,651 4,990,898 1,162,687 6,153,584 6,866,286 731,433 7,597,719 6,134,853
Source:Bangladesh Land Port Authority, September,2014
2013-14M.TExport-Import through Land Port under Bangladesh Land Port Authority
2007-08 2008-09 2009-10 2010-11 2011-12 2012-13

Page | [email protected]
Table 17b, Traffic through Land Port under Bangladesh Land Port Authority, 2007 to 2014.
From table17b shown, in 2009 trade growth rate negative. But years of 2010, 2011 and 2012,growth rate of trade is 14.74%, 29.35% and 33.13%.
2.13 Infrastructure
a) Power
Bangladesh economic activities depend on power, gas and oil. The segment of gas,hydro, coal and oil based energy generation was 79.15 percent, 2.21 percent, 2.52percent and 16.12 percent respectively. (2012, BPDB).The installed power generating capacity in the country in 2013-12, 10341 MW which was9151 MW. However, the power generating plants are very poor and economic life of thesame of the units being over.
Figure 14: Production and Consumption of Natural Gas by Sector -2012/123 and 2013-14
Source: Petro Bangla, Energy and Mineral Resources Division, December
Import (MT) 2,833,686 2,672,712 3,136,807 3,554,719 3,669,825
Export (M.T) 806,625 931,521 1,040,120 1,154,106 1,176,375
Total (MT) 3,640,311 3,604,233 4,176,927 4,708,825 4,846,200
Growth rate(%) Baseyear 2008 -0.99 14.74 29.35 33.13
Source:Bangladesh Land Port Authority
Trade 2008 2009 2010 2011 2012

Page | 22Shamema Akter, Economist, ACE Consultant [email protected]
According to PSMP-2010(Power System Master Plan), the maximum demand in 2015, 2021, and 2030will be 10000, 19000 and 34000 MW respectively. Regarding the existing generation expansionprogrammed, a total of 12900 MW of new generation will be added to the national grid between year2013 to 2017.As of March 2014, maximum actual generation stood 7356 MW.
Natural Gas is an important source of energy’s for commercial of the country. About 73% Natural gas hasbeen use for commercial purpose. As of December 2013, gas has been produced about 11.72 trillioncubic feet and reserved in the country about 15.32 trillion cubic feet.
b) Telecommunications
The demand for telecommunication system for domestic and overseas is increasing in Bangladesh.Though this sector is growing, it is considerably cover behind. BTCL the only public sector telecomservice provider is providing advanced telecommunication services to its subscribers. In 2012, BTCL had747 exchanges in Bangladesh with telephone capacity of 14.3 lakh and connections of 9.4 lakh. 56 KBPSdial up internet service are available to all users.
Table: 18. Subscriber Number, Growth and Teledensity of Mobile and Fixed Phone
Category 2006 2007 2008 2009 2010 2011 2012
Mobile Subscribers(crore) 2.08 3.44 4.37 4.79 6.86 7.97 9.38
Fixed Phone Subscribers (crore) 0.1 0.12 0.13 0.15 0.11 0.11 0.11
Total Subscriber(crore) 2.18 3.56 4.5 4.94 6.97 8.08 9.49
Growth of mobile phone (%) 124.44 65.25 27.11 9.77 43.22 16.18
Growth of Fixed phone(%) 16.97 16.52 9.03 12.92 -36.36 0
Year wise Tele density (%) 15.39 24.71 30 34 47.8 52.54 63.74Internet Subscriber(crore) - - - - - 1.58 2.7Source: BTRC, page-199
Figure15. Subscriber Number, Growth and Tele density of Mobile and Fixed Phone

Page | 23Shamema Akter, Economist, ACE Consultant [email protected]
The above Figure10 and Table11, is show that the number of subscribers, the growth of mobileand fixed phones and the teledensity during the period from 2005-2012. In 2012, the tele-densityaround 63.74%.
c) Transport Sector
The country has about 213330.94 km of earthen roads, 83303.41 km of Pavement roads (Upazila Road37334.86 km, Union Road 44202.03 km, Village Road A 111340.87 km and Village Road B 111501.55km). The total length of railroad is 2,877.10 km, of that, 659.33 km is Broad gauge tracks, 1,842.94 Km ismetre gauge and 374.83 km is dual gauge track, and seasonal waterways. The landscape of Bangladeshis dominated by about 250 rivers providing over 8,000 km of navigable waterways. Mechanized Watertransport is mainly operated by the Bangladesh Inland Water Transport Corporation (BIWTC), whichrun ferry and launch services on the main routes. There are also water transport services run by privatecompanies.
Regarding air transport facilities, Dhaka is connected by air with major city of the world. BimanBangladesh airlines also operates domestic route services. Presently private sector airlines are alsooperating in domestic routes. Chittagong and Mongla are two major seaports of Bangladesh.
Table-19,: Various Categories of Roads under LGED’s Roads
Road Type Earthen (KM) Pavement (KM) Total Length (KM)
Upazila Road : 6585.81 29797.33 37334.86
Union Road : 19981.7 22478.31 44202.03
Village Road A: 100645.49 8736.13 111340.87
Village Road B: 86117.94 22291.64 111501.55

Page | 24Shamema Akter, Economist, ACE Consultant [email protected]
Total Roads: 213330.94 83303.41 304379.31
Source:www.lged.gov.bd
Figure -16, : Various Categories of Roads under LGED’s Roads
Figure -17 : Various Categories of Roads under Roads and Highways Department
0.00
5,000.00
10,000.00
15,000.00
NationalHighway
RegionalHighway
Zilla Road
3,618.894,320.31
13,650.45
Length(km)
Road Type
RHD's Roads
National Highway
Regional Highway
Zilla Road
Page | 25Shamema Akter, Economist, ACE Consultant [email protected]
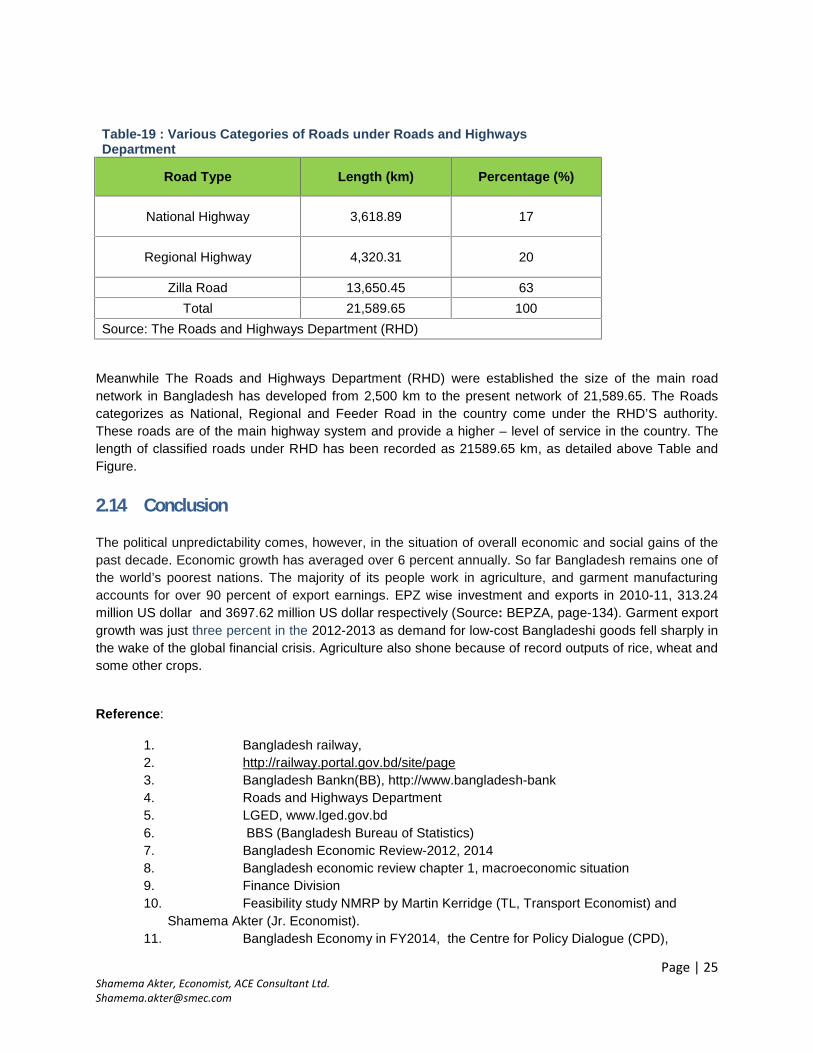
Table-19 : Various Categories of Roads under Roads and HighwaysDepartment
Road Type Length (km) Percentage (%)
National Highway 3,618.89 17
Regional Highway 4,320.31 20
Zilla Road 13,650.45 63Total 21,589.65 100
Source: The Roads and Highways Department (RHD)
Meanwhile The Roads and Highways Department (RHD) were established the size of the main roadnetwork in Bangladesh has developed from 2,500 km to the present network of 21,589.65. The Roadscategorizes as National, Regional and Feeder Road in the country come under the RHD’S authority.These roads are of the main highway system and provide a higher – level of service in the country. Thelength of classified roads under RHD has been recorded as 21589.65 km, as detailed above Table andFigure.
2.14 Conclusion
The political unpredictability comes, however, in the situation of overall economic and social gains of thepast decade. Economic growth has averaged over 6 percent annually. So far Bangladesh remains one ofthe world’s poorest nations. The majority of its people work in agriculture, and garment manufacturingaccounts for over 90 percent of export earnings. EPZ wise investment and exports in 2010-11, 313.24million US dollar and 3697.62 million US dollar respectively (Source: BEPZA, page-134). Garment exportgrowth was just three percent in the 2012-2013 as demand for low-cost Bangladeshi goods fell sharply inthe wake of the global financial crisis. Agriculture also shone because of record outputs of rice, wheat andsome other crops.
Reference:
1. Bangladesh railway,2. http://railway.portal.gov.bd/site/page3. Bangladesh Bankn(BB), http://www.bangladesh-bank4. Roads and Highways Department5. LGED, www.lged.gov.bd6. BBS (Bangladesh Bureau of Statistics)7. Bangladesh Economic Review-2012, 20148. Bangladesh economic review chapter 1, macroeconomic situation9. Finance Division10. Feasibility study NMRP by Martin Kerridge (TL, Transport Economist) and
Shamema Akter (Jr. Economist).11. Bangladesh Economy in FY2014, the Centre for Policy Dialogue (CPD),

Page | 26Shamema Akter, Economist, ACE Consultant [email protected]
12. Bangladesh Economic Update, January 201413. ADB,14. The Daily Star Business Report ,Dated 26, 2014 ,ADB lifts economic growth
forecast for Bangladesh15. Foreign Exchange Policy Department, Bangladesh Bank,16. Bangladesh Economic Review 2013-14, Page- ,CHAPTER 3,page-26,17. Economic Relations Division (of the Ministry of Finance)18. Bangladesh Land Port Authority (Data collection through email)