Embed Size (px)
Citation preview

2
EXECUTIVE SUMMARY
In 1988, the New York State (the State or NYS) Legislature and Governor enacted Vehicle and
Traffic Law §1111-a, which granted New York City (the City or NYC) the authority to
demonstrate the effectiveness of traffic-control signal photo violation-monitoring systems. New
York City used this authorization to launch the nation's first Red Light Camera program in 1994
(the Program). The State Legislature has extended the duration of the New York City's pilot
program seven times, with the current authorization set to expire in December 2019. This report
is submitted to satisfy the requirements of VTL § 1111-a. A few findings of this report include:
The Program has been effective at deterring drivers from running red lights – the average
daily number of red light running violations issued at each camera location has declined
by 75 percent.
The Program has helped prevent crashes which are associated with red light running. A
comparison of the years prior to the launch of the Program to a more recent period shows
that reportable right angle crashes at signalized intersections have declined by 62 percent
citywide, from 7,221 to 2,723 annually. In addition severe injuries from such crashes have
declined by 76 percent, from 633 to 155 annually.
The Program has not led to an increase in rear end crashes. A comparison of the years
prior to the launch of the Program to a more recent period shows that reportable rear end
crashes at signalized intersections have declined by 39 percent citywide, from 7,348
annually to 4,464 annually. In addition severe injuries from such crashes have declined
by 61 percent, from 341 to 134 annually.
The Program has proven to be a valuable tool for deterring law-breaking and protecting New
Yorkers at signalized intersections.
THE DANGER POSED BY RED LIGHT RUNNING
A 2009 analysis of fatal red light running crashes throughout the nation showed that nearly two-
thirds of the people who were killed were people other than the driver who violated the law and
ran the red light, including passengers in the red light running vehicles, occupants of other
vehicles, pedestrians, and bicyclists.1 Red light running is particularly dangerous in American
cities, where drivers who run red lights, stop signs, and other traffic devices are responsible for a
large portion of injury crashes. Crashes caused by motorists who violate traffic signals are highly
associated with fatal and severe injury high speed right angle crashes.
Red light running is very common. While 94 percent of New York State drivers consider it
unacceptable to drive through a traffic light that just turned red when they could have stopped
1 Hu, W.; McCartt, A.T. and Teoh, E.R. 2011. Effects of red light camera enforcement on fatal crashes in large US
cities. Journal of Safety Research 42(4):277-82

3
safely, more than 42 percent of drivers admitted doing so within the previous month.2 A 2015
Hunter College study, which studied driver behavior at thirteen New York City intersections,
found that nine percent of observed New York City drivers violate red lights.3
RED LIGHT RUNNING CAUSES
Motorists who are speeding are much more likely to run red lights, because vehicles which are
travelling faster need more time and take a longer distance to come to a complete stop. The
amber phase is timed to provide drivers who are driving at the prevailing speed the opportunity
to either travel at a consistent speed through the intersection before the light turns red, or to
come to a complete stop before entering the intersection. Speeding drivers are therefore more
likely to find themselves unable to come to complete stop without “stopping short” and risking a
rear end crash.
Drivers who are talking on cell phones, texting or using other electronic devices, or are
otherwise distracted often fail to perceive traffic signals. Estimates indicate that drivers using cell
phones “look but fail to see” up to 50 percent of the information in their environment; even
looking through their windshield, it will take longer to notice and react to a traffic signal change
when using a cell phone.4 In addition, distracted drivers make fewer glances to traffic lights, and
some drivers fail to even look at traffic signals.5
ENHANCING SAFETY AT INTERSECTIONS
In New York City, about half of fatal traffic crashes occur at intersections. The New York City
Department of Transportation (NYC DOT) takes a number of steps to promote safety at
intersections, in addition to the Program.
Right on Red Prohibition
Unlike almost all other U.S. cities, right turns on red are severely restricted in New York City.
Within the five boroughs, this movement is permitted only where posted, and has been most
prevalent in Staten Island, where lower traffic and pedestrian volumes allow for the safe
movement of both vehicles and pedestrians. Studies conducted after an array of states adopted
laws which enabled right-turn-on-red found marked increases in pedestrian and bicyclist
collisions at intersections.6 An analysis of intersection crashes in four states found that right-
2 AAA Foundation for Traffic Safety, 2014 Traffic Safety Culture Index (January 2015) available at
https://www.aaafoundation.org/sites/default/files/2014TSCIreport.pdf 3 Peter Tuckel, William Milczarski, James Rubin For Many New York City Motorists A Red Light Does Not Mean
Stop Hunter College 2015 4 Understanding the Distracted Brain: Why Driving While Using Hands-Free Cell Phones is Risky Behavior.
National Safety Council White Paper 2012 5 Understanding the Distracted Brain: Why Driving While Using Hands-Free Cell Phones is Risky Behavior.
National Safety Council White Paper 2012 6 Preusser, Leaf, DeBartolo, Blomberg The Effect of Right Turn on Red on Pedestrian and Bicyclist Accidents US
Dept of Transportation National Highway Traffic Safety Administration 1981

4
turn-on-red crashes frequently involved pedestrians and bicyclists, and 93 percent of these
crashes resulted in injuries to the pedestrians and bicyclists.
Enhanced Signal Visibility
Signal head visibility can be enhanced by increasing the size of traffic signal lenses from 8 to 12
inches. In order to advance Vision Zero, DOT is upgrading traffic signal lenses on corridors with
a speed limit of 30 MPH or above, or at other appropriate intersections. Studies indicate that
these increased signal lenses may increase compliance, and thereby reduce the frequency of
crashes, particularly right angle crashes.
All-Red Interval
An all-red interval is the portion of a traffic signal cycle where all approaches have a red-signal
display. The purpose of the all-red interval is to allow time for vehicles that entered the
intersection during the amber phase to clear the intersection before the traffic-signal display for
the cross street approaches turns to green. All traffic signals in New York City have an all-red
interval.
HOW RED LIGHT CAMERAS WORK
When a vehicle runs through a red light at a camera-monitored intersection, sensors embedded
in the roadway trigger a digital camera, which is situated approximately fifty to one hundred feet
back from the stop-line. The camera captures a series of photographs showing the vehicle
before and after it enters the intersection, with the traffic signal displaying a red light in each
photo. The resulting photos show the vehicle, the intersection, and the traffic signal all in one
frame.
The photos are inspected for quality and are then delivered to a specially trained team of NYC
DOT Review Technicians who review each and every photograph and determine if the
photographs provide adequate evidence to issue a Notice of Liability (NOL).
An NOL includes three photos: the vehicle before the stop bar when the traffic signal is red, the
same vehicle after the stop bar and crosswalk while the traffic signal is still red, and a clear and
readable enlargement of the vehicle's license plate. In addition, the NOL contains the name and
address of the vehicle owner, the registration number of the vehicle involved in the violation,
the location where the violation took place, the date and time of the violation, and the
identification number of the camera which recorded the violation.
The NOLs are issued to the registered owner of the vehicle. An NOL, much like a parking ticket,
obligates the vehicle owner to pay a fine, but does not cause points to be assessed against the
driver’s license, nor is the violation used for insurance purposes. The red light camera fine is
$50.

5
0
50
100
150
200
250
0
5
10
15
20
25
30
35
1994 1997 2000 2003 2006 2009 2012 2015
Number of Enforced Approaches Average Daily Violations per Camera
RED LIGHT CAMERAS DETER RED LIGHT RUNNING VIOLATIONS
The purpose of the Program is to deter motorists from running red lights. Accordingly, the more
successful the Program is, the fewer red light violations we should observe over time.
In the first year of the Program, the average camera issued 31.8 NOLs on a daily basis. In 2015,
the average camera issued 7.8 NOLs on a daily basis - a 75 percent drop. This data indicates
that the Program has enhanced public safety by serving as an effective deterrent to red light
running. Some of the year to year fluctuation in the number of NOLs issued can be attributed to
years in which the Program was expanded and new sites were installed.
The daily average number of NOLs issued declines as the Legislature allowed the City to protect
more intersections with red light cameras. This is an expected result and confirms that the
consistent, predictable, citywide enforcement provided by red light cameras deters dangerous
red light running.
Change in Daily Average NOL per Camera

6
RED LIGHT CAMERA: DESCRIPTION OF LOCATIONS
Though the precise number may vary on a daily basis due to maintenance, on average, 184 red
light cameras were operating at 150 intersections in New York City in 2015. In addition, as a
further deterrent, several hundred dummy cameras (non-functional shells) have been installed
throughout the City’s five boroughs.
Borough Number of Red Light Camera
Enforced Intersections
Bronx 24
Brooklyn 60
Manhattan 16
Queens 64
Staten Island 20
Locations are selected based upon a review of several factors including crash history of the
intersection, engineering judgment, and community and elected official requests. Red light
cameras generally tend to be sited on or adjacent to major, multi-lane, arterial streets which
carry high volumes of vehicles and high frequency of red light running violations.
The success of red light cameras in enhancing public safety throughout the five boroughs has
led to the City’s continued interest in additional expansion. While the Program has been very
effective in reducing unsafe driving on the City’s streets, the statutory cap of 150 intersections -
which is only about one percent of the City’s 12,700 signalized intersections - prevents a
broader application of this important public safety initiative. The Program is effective at deterring
red light violations because motorists expect consistent enforcement across the City. An
increase in the total number of intersections where red light cameras can be operated by the
City would make this public safety tool even more effective.
RED LIGHT CAMERAS PREVENT SERIOUS RED LIGHT RELATED CRASHES
When identifying crash-prone locations and evaluating a project’s success, NYC DOT focuses
on crashes which result in death or severe injury. Individuals who have been severely injured
typically depart the crash scene in an ambulance and often experience life-changing injuries
(e.g., skull fractures and internal injuries). Many, but not all fatal and serious injury crashes can
be prevented by increasing motorist compliance with traffic signals.
Right Angle Collisions
The goal of the Program is to deter drivers from violating traffic signals, and thereby
prevent serious crashes which are associated with red light running - specifically right angle
7
collisions. Right angle crashes are particularly dangerous because the sides of vehicles
have relatively little space to absorb the force of impact and shield occupants, unlike the
fronts and rears of vehicles, which have substantial crumple zones. In addition, a vehicle
which is involved in this type of crash may spin out of control or roll over, leading to
secondary impacts.
The Program has been effective at preventing right angle crashes. From 1991 through
1993, the three years before the Program began, there were approximately 7,221
reportable right angle crashes at signalized intersections annually in New York City. In the
most recent three year period for which data is available, from 2012 through 2014, there
were 62 percent fewer such crashes citywide, approximately 2,723 annually. In addition
there was a 73 percent decline in severe injuries from right angle crashes at signalized
intersections during these periods (from approximately 633 to 155 annually).
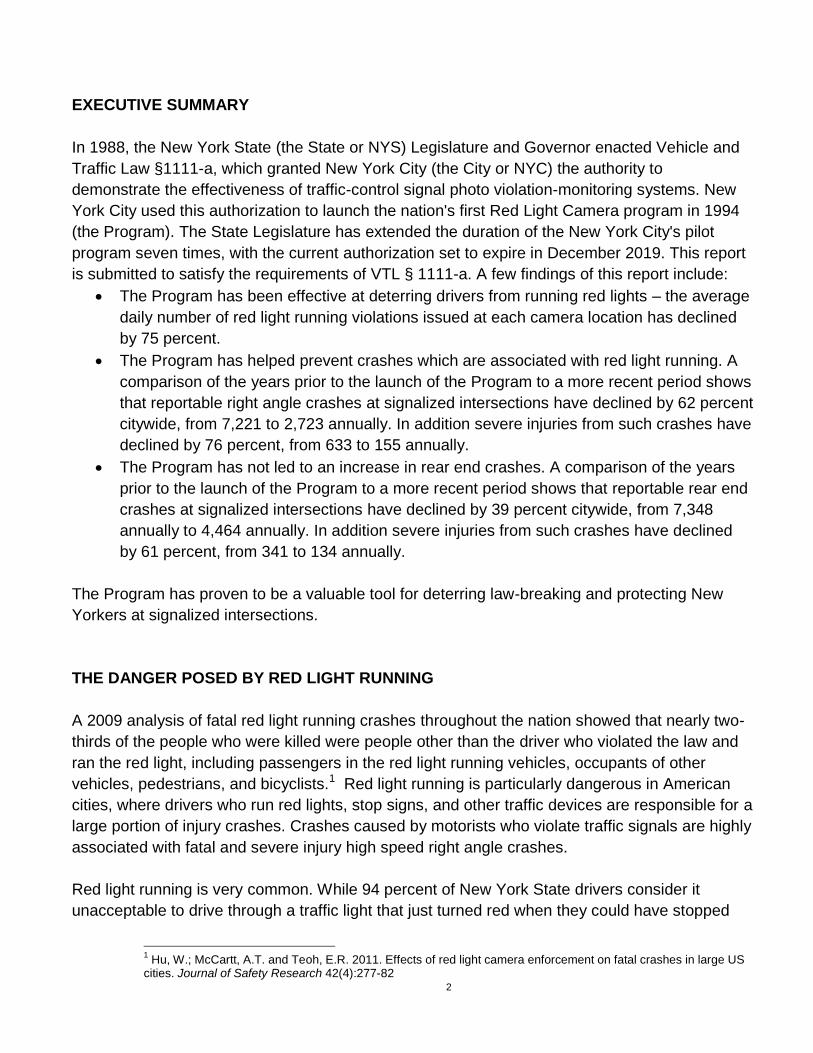
The following chart compares the number of right angle collisions which have occurred at
camera enforced intersections during the year prior to when a red light camera’s
installation, as compared to 2014, the most recent year of data available.
Right Angle Injury Collisions at Intersections with Red Light Camera Enforcement
Bronx Brooklyn Manhattan Queens Staten Island
Citywide Total
Year Prior to RLC Installation at Intersection
42 157 12 127 29 367
2014 27 85 1 66 11 190
Change -15 -72 -11 -61 -18 -177
Rear End Collisions
Drivers who do not expect traffic signals to be enforced are more likely to run red lights, and are
also more likely to collide with a car in front of them which is complying with the law. Some
studies which evaluate the initial period following camera installation find that rear end crashes
may rise even as severe injuries fall, particularly in the weeks and months after camera
enforcement commences at the site.
New York City’s experience does not indicate that red light cameras have led to an increase in
rear end collision crashes. From 1991 through 1993, the three years before the Program began,
there were approximately 7,348 reportable rear end collisions at signalized intersections
annually in New York City. In the most recent three year period, from 2012 through 2014, there
were 39 percent fewer reportable rear end collisions at signalized intersections citywide,
approximately 4,464 annually. Most significantly, there was a 61 percent decrease in severe
injuries during these periods (from approximately 341 to 134 annually).

8
The following table compares the number of rear end collisions which have occurred at
camera enforced intersections during the year prior to each red light camera’s installation,
as compared to 2014, the most recent year for which data is available.
Rear End Collisions at Intersections with Red Light Camera Enforcement
Bronx Brooklyn Manhattan Queens Staten Island
Citywide
Year Prior to RLC Installation at Intersection
56 298 36 249 78 717
2014 56 261 29 202 52 600
Change 0 -37 -7 -47 -26 -117
Severity of Injury Collisions & Injuries to Pedestrians, Bicyclists and Motorists
Red light cameras are not intended to prevent collisions unrelated to the violation of a traffic
signal. Injuries sustained in traffic crashes unrelated to traffic signals, such as injuries sustained
by pedestrians who are struck by turning vehicles, are not affected by red light cameras.
Accordingly, much of the decline in severe injuries at intersections with red light cameras can be
attributed to a reduction in severe injuries caused in right angle crashes.
The following table aggregates by borough the number and severity of injury collisions which
occurred at camera enforced intersections during the year prior to each red light camera’s
installation as compared to 2014, the most recent year for which data is available.
Severity of Collisions at Intersections with Red Light Camera Enforcement
Bronx Brooklyn Manhattan Queens
Staten Island Citywide
Severe Injury7 Year Prior to RLC Installation at Intersection
20 47 8 45 12 132
2014 6 29 13 13 3 64
Change -14 -18 5 -32 -9 -68
Moderate Injury8 Year Prior to RLC Installation at Intersection
15 80 20 57 13 185
2014 7 57 17 62 6 149
Change -8 -23 -3 5 7 -36
7 Injury severity classification is determined by NYS DMV and NYS DOT. Severe injuries include skull fractures, internal
injuries, broken or distorted limbs, unconsciousness, severe lacerations, and unable to leave the scene without assistance. 8 Moderate injuries include visible injuries such as a "lump" on the head, abrasions, and minor lacerations.
9
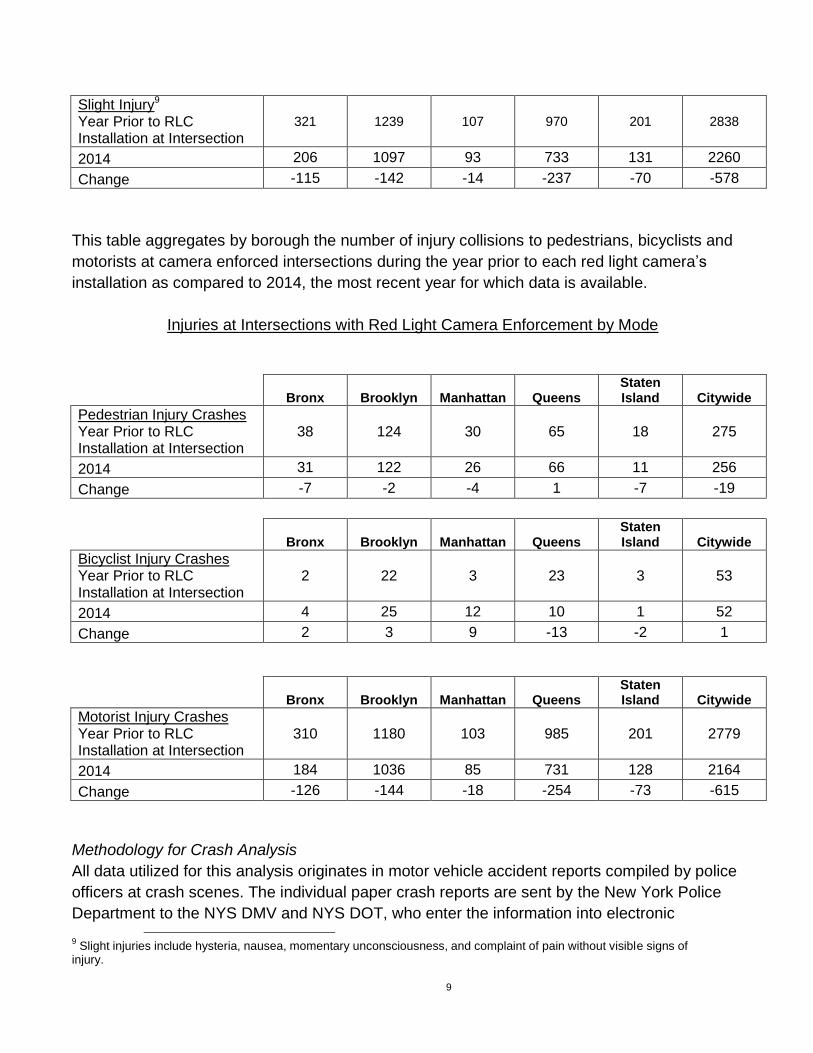
Slight Injury9 Year Prior to RLC Installation at Intersection
321 1239 107 970 201 2838
2014 206 1097 93 733 131 2260
Change -115 -142 -14 -237 -70 -578
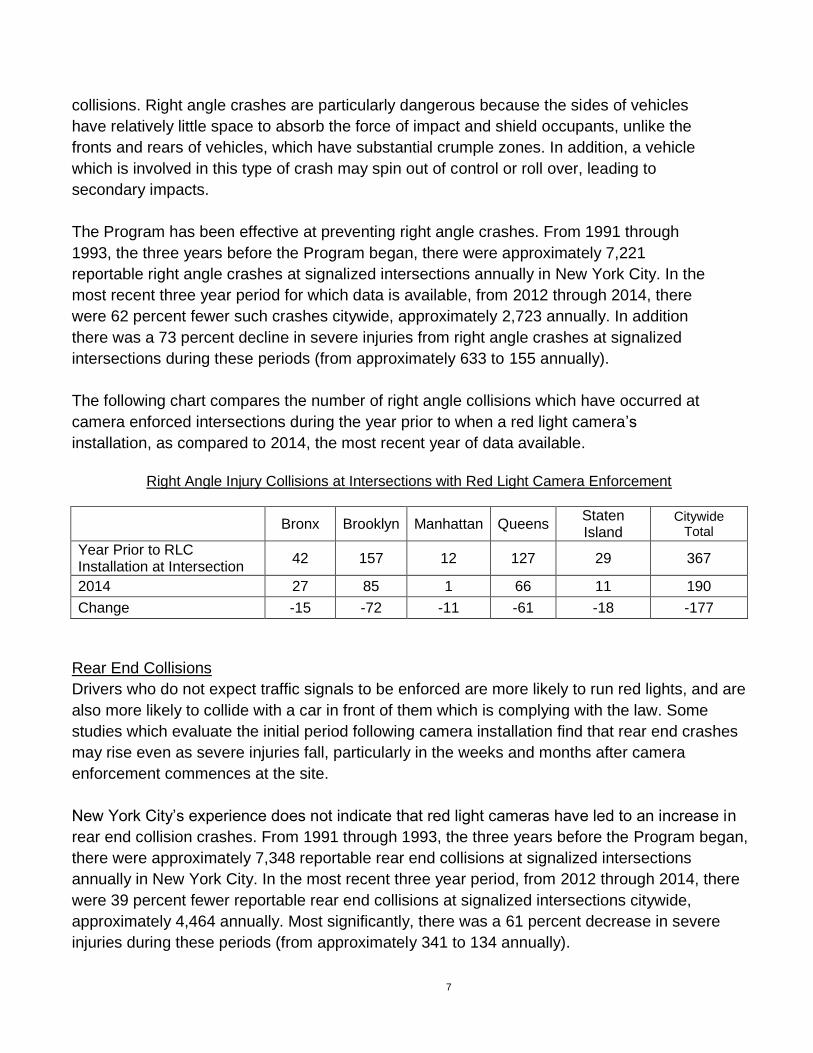
This table aggregates by borough the number of injury collisions to pedestrians, bicyclists and
motorists at camera enforced intersections during the year prior to each red light camera’s
installation as compared to 2014, the most recent year for which data is available.
Injuries at Intersections with Red Light Camera Enforcement by Mode
Bronx Brooklyn Manhattan Queens Staten Island Citywide
Pedestrian Injury Crashes Year Prior to RLC Installation at Intersection
38 124 30 65 18 275
2014 31 122 26 66 11 256
Change -7 -2 -4 1 -7 -19
Bronx Brooklyn Manhattan Queens
Staten Island Citywide
Bicyclist Injury Crashes Year Prior to RLC Installation at Intersection
2 22 3 23 3 53
2014 4 25 12 10 1 52
Change 2 3 9 -13 -2 1
Bronx Brooklyn Manhattan Queens Staten Island Citywide
Motorist Injury Crashes Year Prior to RLC Installation at Intersection
310 1180 103 985 201 2779
2014 184 1036 85 731 128 2164
Change -126 -144 -18 -254 -73 -615
Methodology for Crash Analysis
All data utilized for this analysis originates in motor vehicle accident reports compiled by police
officers at crash scenes. The individual paper crash reports are sent by the New York Police
Department to the NYS DMV and NYS DOT, who enter the information into electronic
9 Slight injuries include hysteria, nausea, momentary unconsciousness, and complaint of pain without visible signs of
injury.

10
databases, attribute locations to the crashes, categorize traffic injuries by severity and identify
errors. This cleaned and categorized data is utilized by the City for planning and analysis
purposes. The crash datasets are periodically reissued by the State as new methods of data
collection and analysis are introduced. For example, the most recent year’s data reflects a
change in how crashes are assigned to intersections.
ADJUDICATION
Each NOL outlines how individuals may request a hearing by mail or in person to contest a
violation they believe was issued in error. The rate of those hearing requests has declined over
the years. For the first five years of the Program, approximately five percent of individuals who
received an NOL requested a hearing to contest the violation. In 2015, less than three percent of
individuals who received an NOL requested a hearing; the other 97 percent of individuals
declined their opportunity for a hearing and agreed to pay the violation after the NOL was issued.
Percentage of individuals who request a hearing
Pursuant to Section 1111-a of the New York State Vehicle and Traffic Law and Section 19-210 of
the New York City Administrative Code, the New York City Department of Finance (NYC DOF) is
authorized to conduct hearings, either by mail or in person, in any of NYC DOF’s five Borough
Business Centers. Once the Administrative Law Judge (ALJ) determines the NOL presents a
prima facie case, the ALJ will conduct a hearing on the merits of any defense presented. The
ALJs review witness statements, as well as other types of documentary evidence, to afford the
vehicle owner the opportunity to refute the prima facie case and establish a meritorious defense.
ALJs are even permitted to consider hearsay evidence, and other evidence which may not be
0.0%
1.0%
2.0%
3.0%
4.0%
5.0%
6.0%
1994 1997 2000 2003 2006 2009 2012 2015

11
admissible in a traditional court of law, in order to provide a vehicle owner with the opportunity to
refute the NOL.
At hearing, approximately 91 percent of contested NOLs are upheld. In other words, in only nine
percent of hearings is an NOL overturned by an ALJ –which represents less than 0.26 percent of
all NOLs issued.
Total
Percent of Total Violations Issued
Red Light Camera Violations Issued in 2015 555,025 100%
Red Light Camera Hearings Requested in 2015
15,346 2.8%
NOL Upheld at Hearing 13,912 2.5%
NOL Overturned at Hearing
1,434 0.26%

12
REVENUE AND EXPENSES
Red Light Camera Program
(Inception-June 2015) Program Costs December 1993 to June 2015 $170,664,537 Capital Costs Inception to June 2015 $30,440,691 DOT Staffing December 1993 to June 2015 $22,812,300 DOF Staffing Inception to June 2015 $7,158,914 Total Expenses Inception to June 2015 $231,076,441 Revenues Inception to June 2015 $482,837,418 Net Revenues Inception to June 2015 $251,760,977

Active
Cameras Observed
Events Events/
Day Events/ Week
Events/ Month
% Change in Events from
previous year
Events / Camera / Day
# NOLs Issued NOLs / Camera
/ Day Hearing
Requests
% of Hearings Guilty or
Guilty with Reduction
1994 15 438,622 1201.7 8435 36552 NA 80.11 168,479 30.8 8,103 86%
1995 18 381,601 1046 7339 31800 -13 58.08 146,812 22.3 7,908 87%
1996 18 319,720 874 6149 26643 -16.22 48.53 140,751 21.4 7,748 89%
1997 18 258,424 708 4970 21535 -19.17 39.33 119,397 19.2 5,968 89%
1998 30* 417,747 1145 8034 34812 61.65 47.69 215,242 19.7 7,799 88%
1999 30 391,693 1073 7533 32641 -6.24 35.77 198,324 18.1 7,832 85%
2000 30 414,030 1131 7962 34503 5.7 37.71 207,260 18.9 6,967 84%
2001 50* 453,005 1241 8712 37750 9.41 42.5 226,642 21.3 6,898 84%
2002 50 492,678 1350 9475 41057 8.76 27.07 338,572 18.59 9,506 84%
2003 50 444,529 1218 8549 37044 -9.77 24.42 292,614 16.08 11,323 85%
2004 50 455,048 1243 8751 37921 2.37 24.93 325,024 17.81 8,739 85%
2005 50 409,489 1122 7875 34124 -10.01 22.58 306,117 16.82 8,690 86%
2006 100 554,846 1520 10670 46237 35.5 29.41 384,993 20.41 8,376 88%
2007 100 1,248,896 3422 24017 104075 125.09 34.53 947,341 26.19 20,813 92%
2008 100 1,094,847 2991 21055 91237 -12.33 29.91 791,734 21.63 22,990 92%
2009 121 1,057,463 2897 20336 88122 -3.41 23.91 745,241 16.85 17,824 92%
2010 169 1,455,540 3988 27991.2 121295 37.64 23.62 1,053,268 17.08 25,414 96%
2011 188 1,167,969 3200 22461 97331 -19.76 17.49 821,483 12.3 27,376 94%
2012 186 908,801 2483 17477 75733 -22.1 13.37 634,088 9.33 11,266 94%
2013 187 839,881 2301 16152 69990 -7.58 12.49 583,778 8.68 15,531 89%
2014 181 802,351 2198 15430 66863 -4.5 12.14 579,308 8.77 16,596 88%
2015 196 678,020 1858 13,039 56,502 -15% 15.2 555,025 7.76 15,346 91%