Embed Size (px)
Citation preview
Historical Mussel Shells Illuminate Legacy Contaminant Patterns Over
the Past 1000 Years
W. Aaron Shoults-‐Wilson, Andrea Fritts, Jason Unrine, Mark Fritts & Andrew Casper
INHS
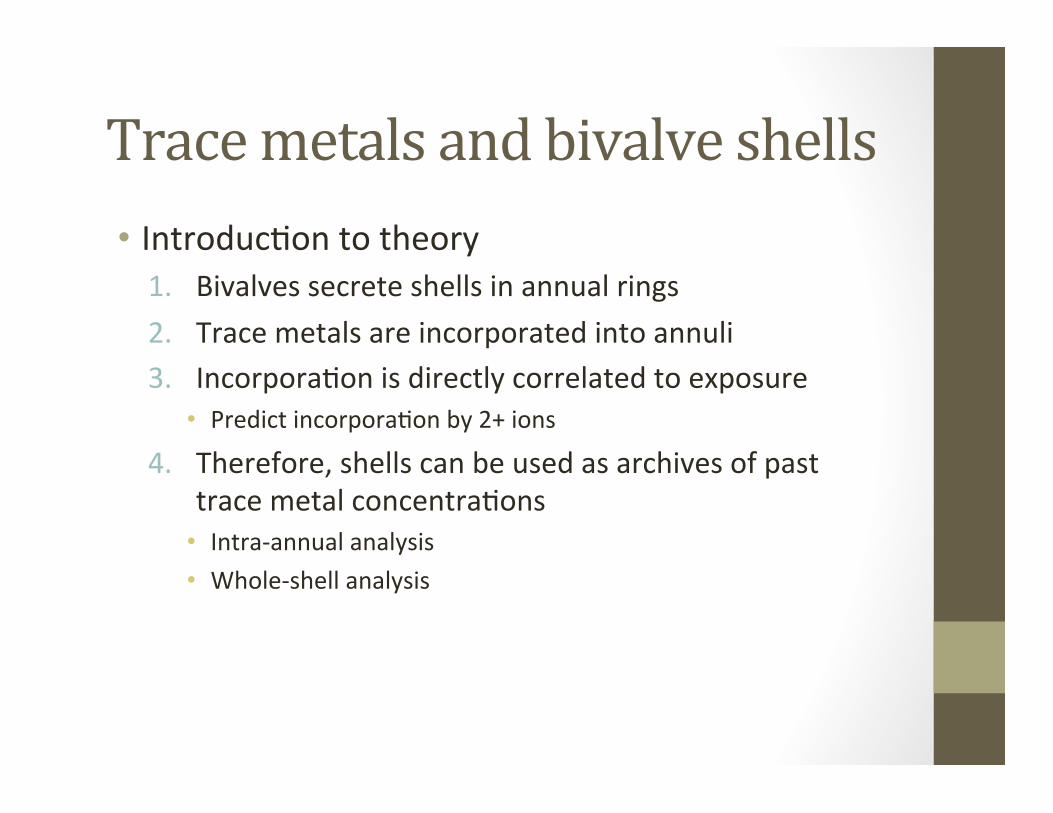
Trace metals and bivalve shells • Introduc)on to theory 1. Bivalves secrete shells in annual rings 2. Trace metals are incorporated into annuli 3. Incorpora)on is directly correlated to exposure
• Predict incorpora)on by 2+ ions 4. Therefore, shells can be used as archives of past
trace metal concentra)ons • Intra-‐annual analysis • Whole-‐shell analysis
Do shell concentrations vary with shell allometry?
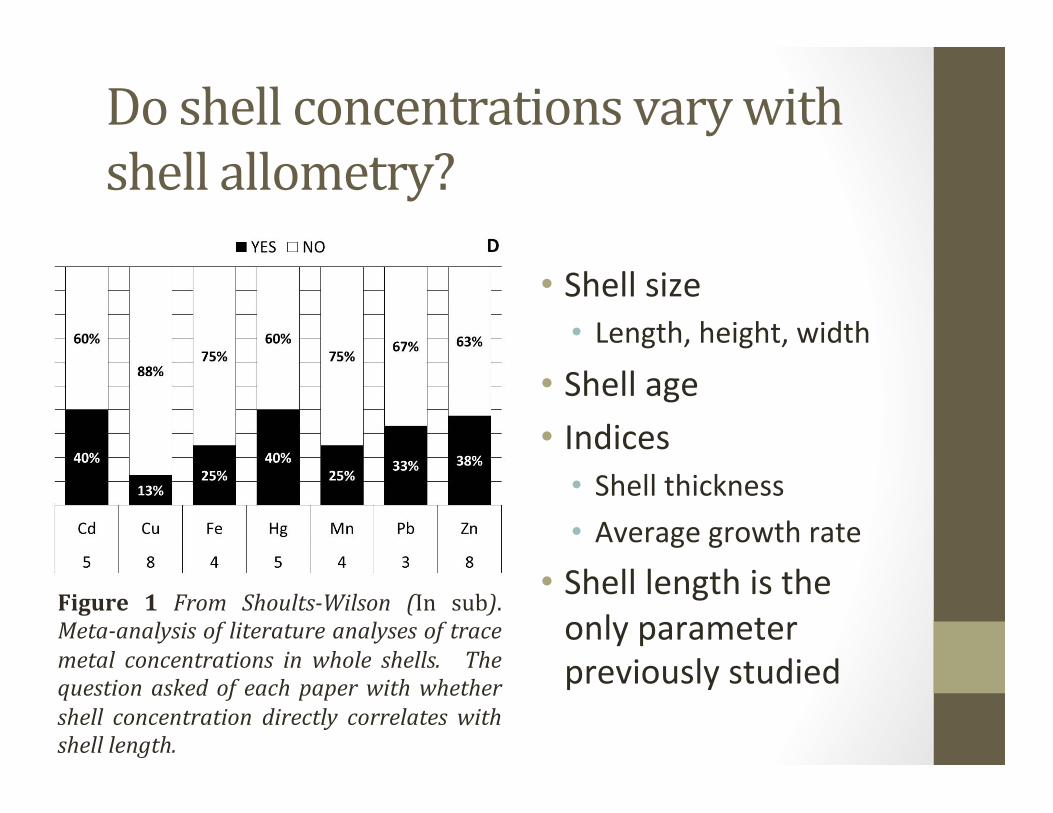
• Shell size • Length, height, width
• Shell age • Indices
• Shell thickness • Average growth rate
• Shell length is the only parameter previously studied
Figure 1 From Shoults-‐Wilson (In sub). Meta-‐analysis of literature analyses of trace metal concentrations in whole shells. The question asked of each paper with whether shell concentration directly correlates with shell length.
Objectives
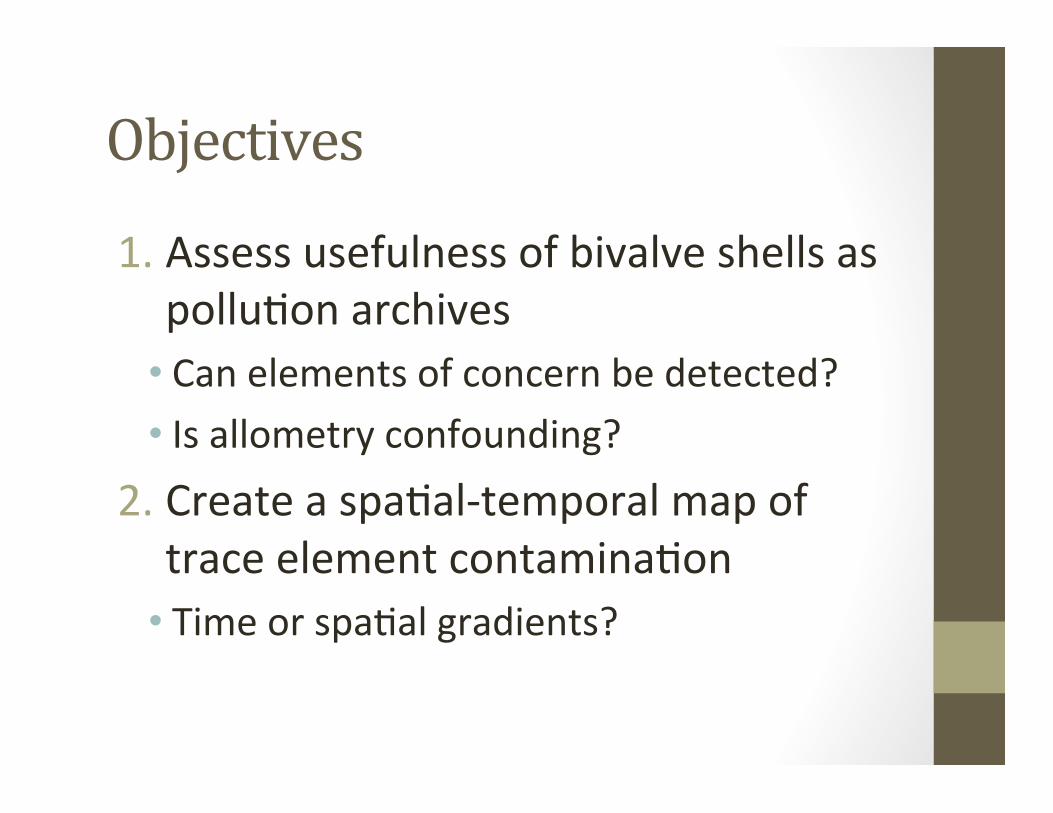
1. Assess usefulness of bivalve shells as pollu)on archives
• Can elements of concern be detected? • Is allometry confounding?
2. Create a spa)al-‐temporal map of trace element contamina)on
• Time or spa)al gradients?
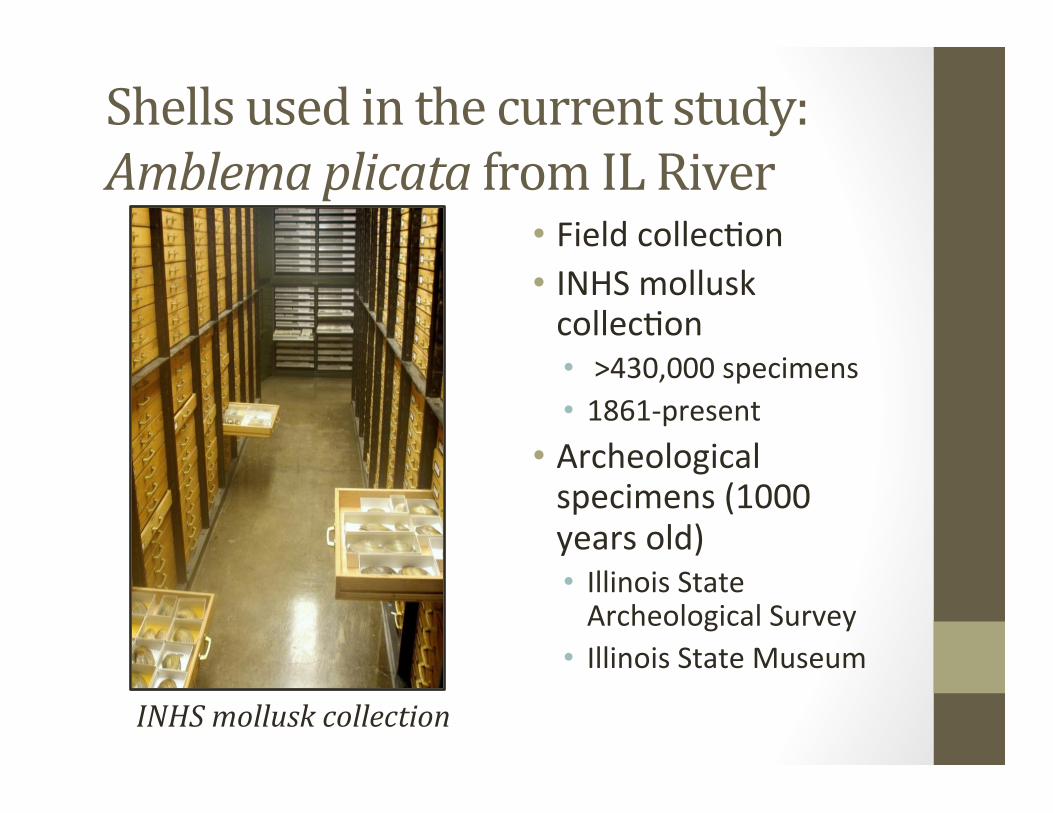
Shells used in the current study: Amblema plicata from IL River
• Field collec)on • INHS mollusk collec)on • >430,000 specimens • 1861-‐present
• Archeological specimens (1000 years old) • Illinois State Archeological Survey
• Illinois State Museum
INHS mollusk collection
Methods
1. Mussel shells sec)oned across all growth lines
2. Shell sec)ons washed • Complete diges)on of organic maWer • US EPA protocol
3. Microwave-‐assisted acid diges)on 4. Analysis using ICP-‐MS
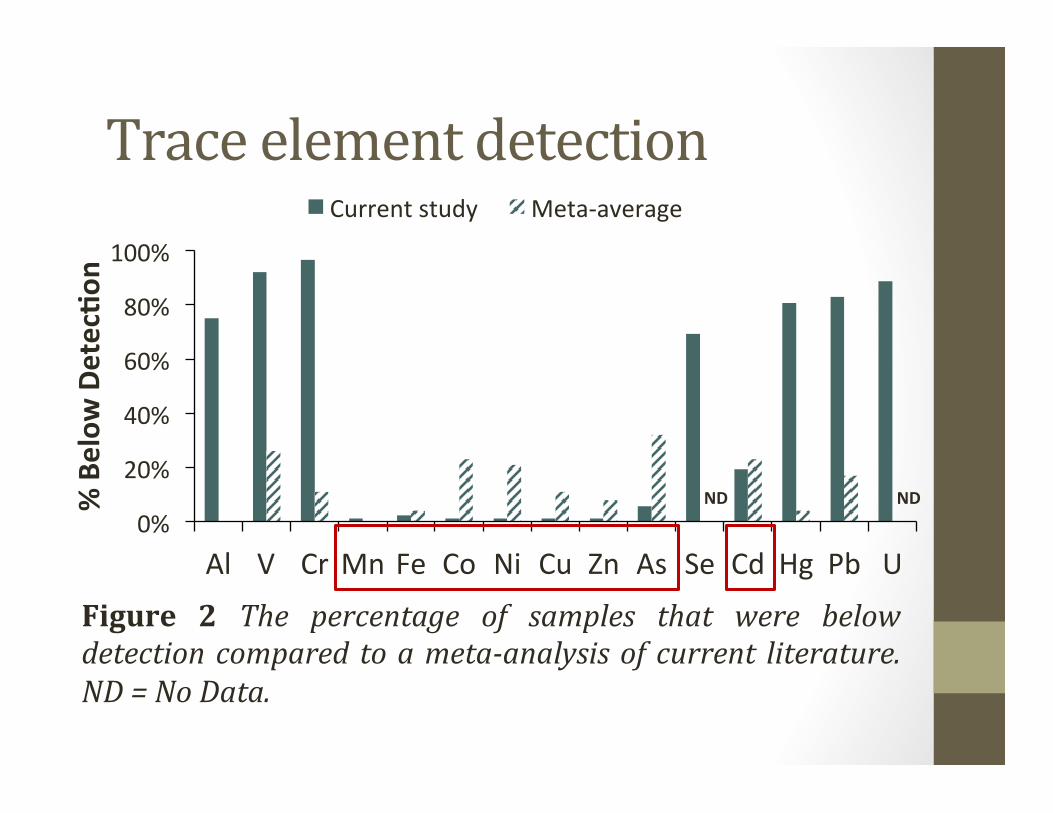
Trace element detection
0%
20%
40%
60%
80%
100%
Al V Cr Mn Fe Co Ni Cu Zn As Se Cd Hg Pb U
% Below
Detec+o
n
Current study Meta-‐average
Figure 2 The percentage of samples that were below detection compared to a meta-‐analysis of current literature. ND = No Data.
ND ND
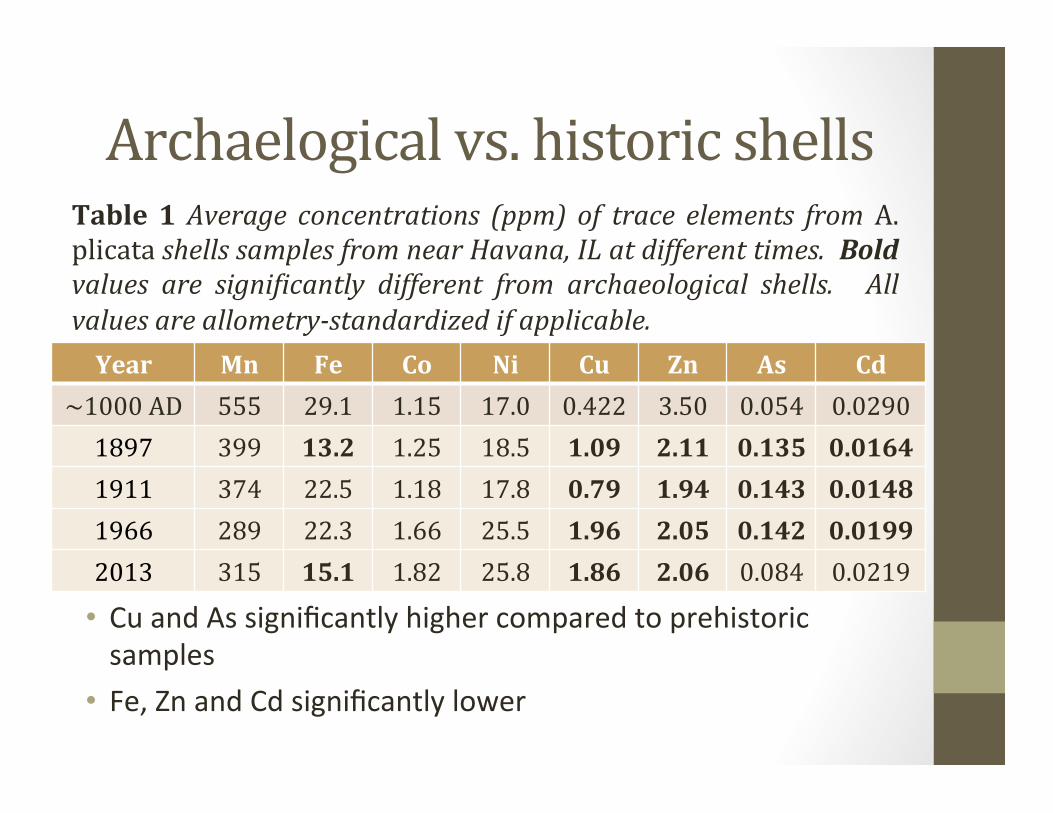
Archaelogical vs. historic shells
Year Mn Fe Co Ni Cu Zn As Cd ~1000 AD 555 29.1 1.15 17.0 0.422 3.50 0.054 0.0290 1897 399 13.2 1.25 18.5 1.09 2.11 0.135 0.0164 1911 374 22.5 1.18 17.8 0.79 1.94 0.143 0.0148 1966 289 22.3 1.66 25.5 1.96 2.05 0.142 0.0199 2013 315 15.1 1.82 25.8 1.86 2.06 0.084 0.0219
Table 1 Average concentrations (ppm) of trace elements from A. plicata shells samples from near Havana, IL at different times. Bold values are signiJicantly different from archaeological shells. All values are allometry-‐standardized if applicable.
• Cu and As significantly higher compared to prehistoric samples
• Fe, Zn and Cd significantly lower
The signiYicance of allometric relationships • Rela)onship with highest significance varied from site to site
• Certain elements more likely to show rela)onship
• Within a species, rela)onships consistently in same direc)on
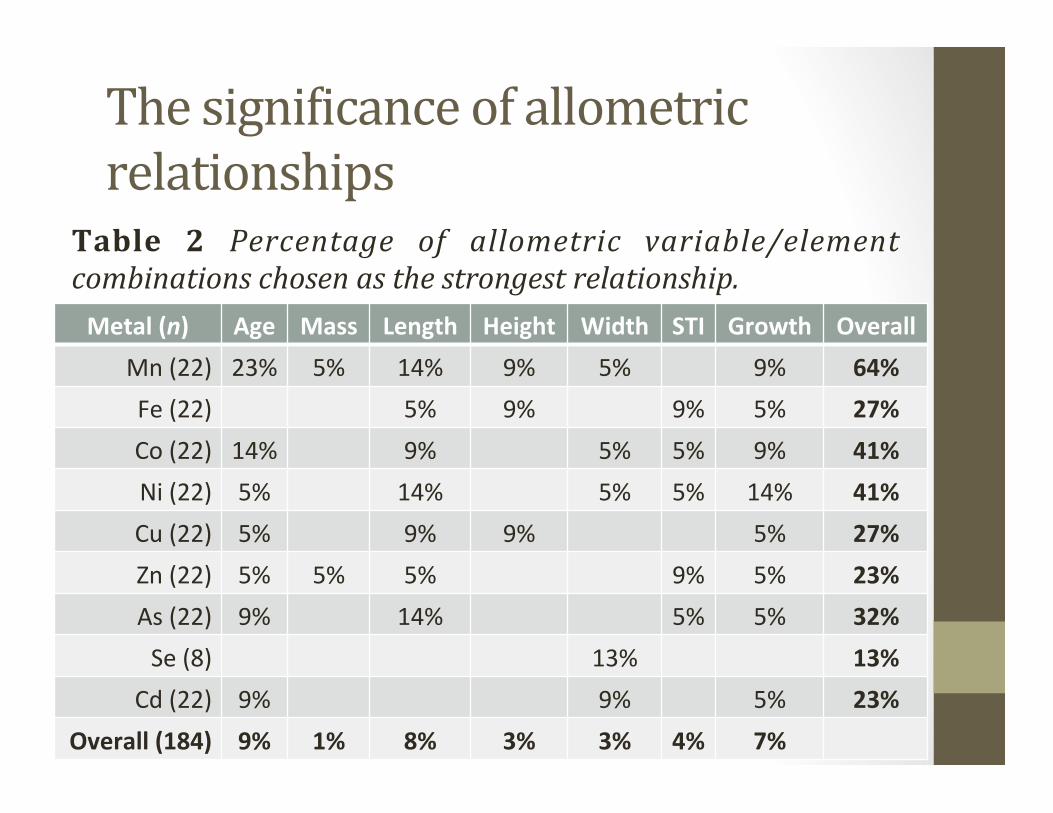
The signiYicance of allometric relationships
Metal (n) Age Mass Length Height Width STI Growth Overall Mn (22) 23% 5% 14% 9% 5% 9% 64% Fe (22) 5% 9% 9% 5% 27% Co (22) 14% 9% 5% 5% 9% 41% Ni (22) 5% 14% 5% 5% 14% 41% Cu (22) 5% 9% 9% 5% 27% Zn (22) 5% 5% 5% 9% 5% 23% As (22) 9% 14% 5% 5% 32% Se (8) 13% 13%
Cd (22) 9% 9% 5% 23% Overall (184) 9% 1% 8% 3% 3% 4% 7%
Table 2 Percentage of allometric variable/element combinations chosen as the strongest relationship.
-‐5 -‐4 -‐3 -‐2 -‐1 0 1 2 3 4
1880 1900 1920 1940 1960 1980 2000 2020
LN[Elemen
t]
Co Ni As Cd Linear (Co) Linear (Ni) Linear (As) Linear (Cd)
+
+
+
-‐
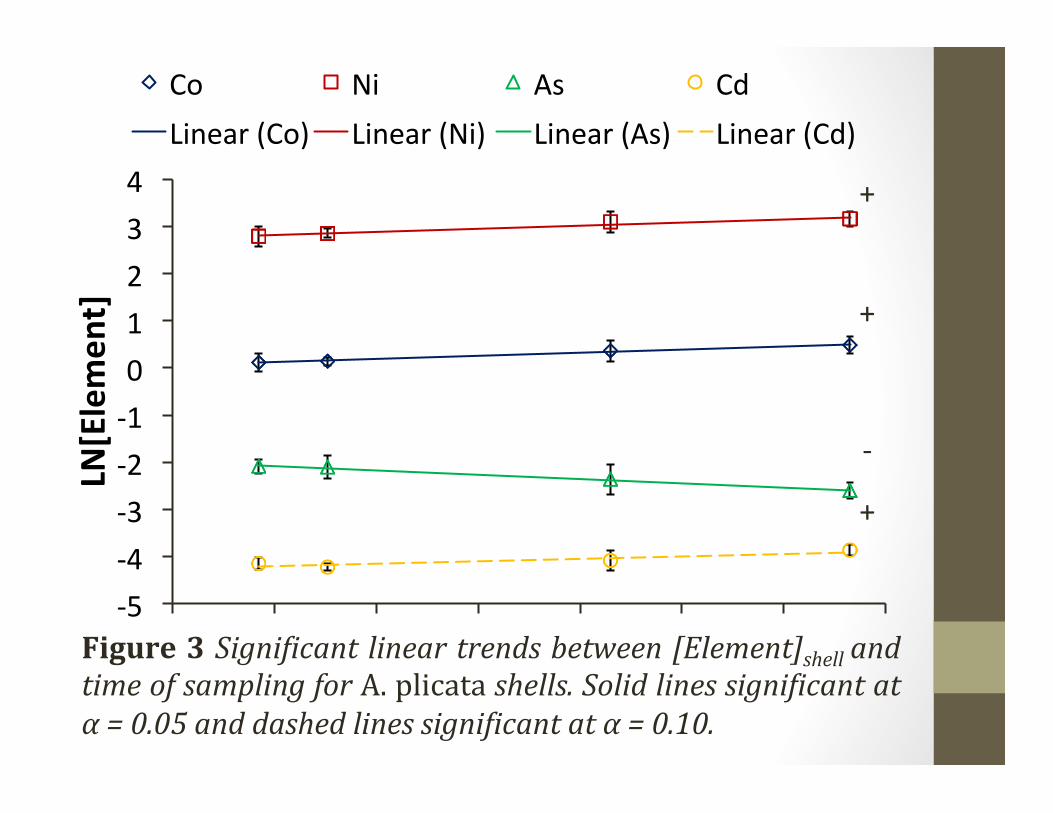
Figure 3 SigniJicant linear trends between [Element]shell and time of sampling for A. plicata shells. Solid lines signiJicant at α = 0.05 and dashed lines signiJicant at α = 0.10.
-‐5 -‐4 -‐3 -‐2 -‐1 0 1 2 3 4
1880 1900 1920 1940 1960 1980 2000 2020
LN[Elemen
t]
Co Ni As Linear (Co) Linear (Ni) Linear (As)
*
*
+
+
-‐
* *
*
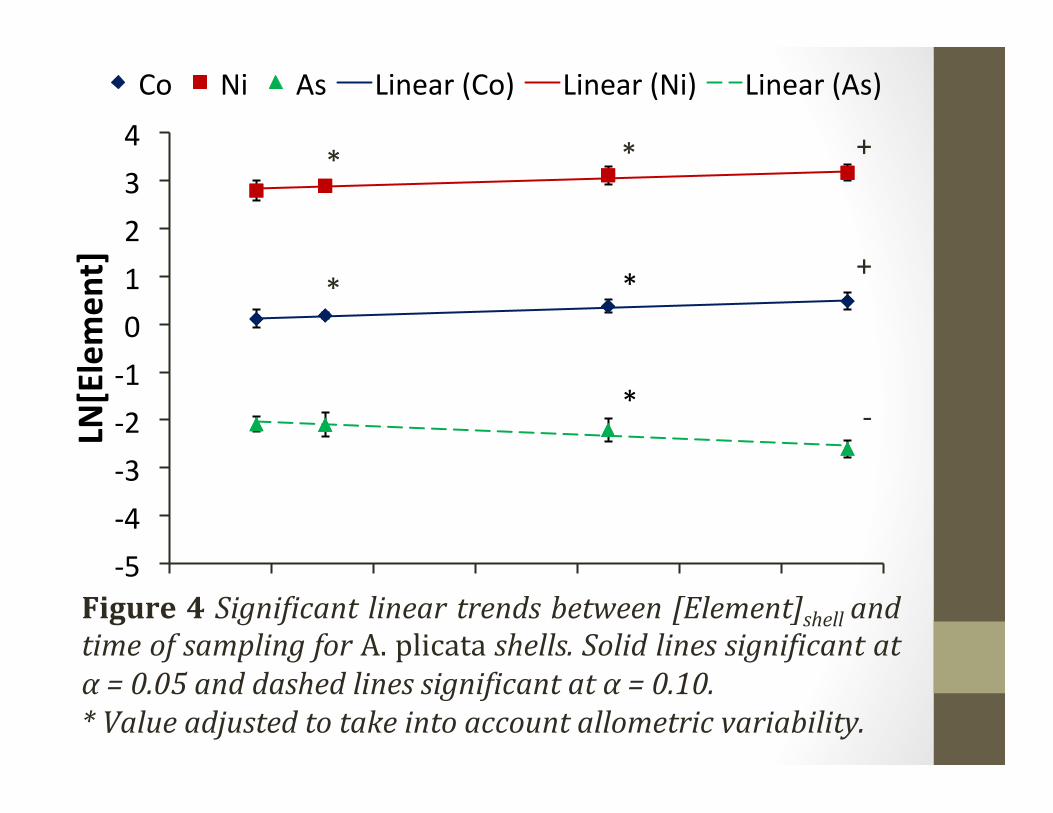
Figure 4 SigniJicant linear trends between [Element]shell and time of sampling for A. plicata shells. Solid lines signiJicant at α = 0.05 and dashed lines signiJicant at α = 0.10. * Value adjusted to take into account allometric variability.
-‐1
0
1
2
3
4
5
6
0 50 100 150 200 250 300
LN[Elemen
t]
River miles upstream from Mississippi confluence
Co Ni Mn Linear (Mn)
-‐
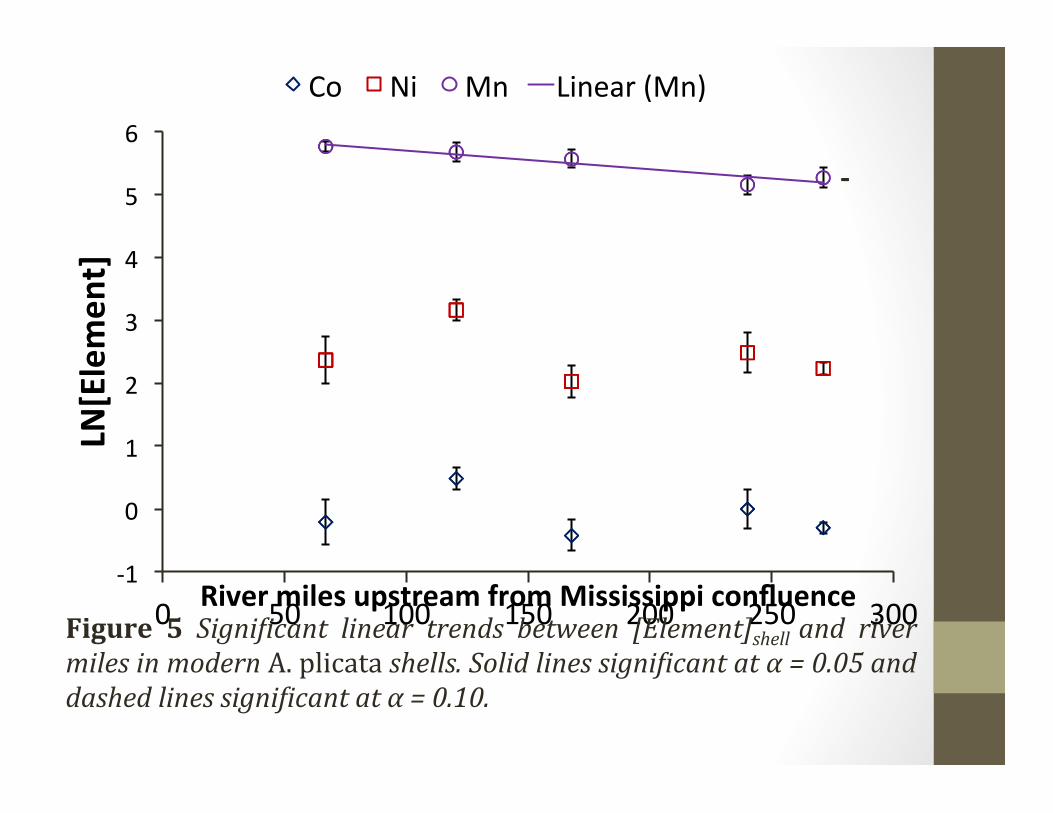
Figure 5 SigniJicant linear trends between [Element]shell and river miles in modern A. plicata shells. Solid lines signiJicant at α = 0.05 and dashed lines signiJicant at α = 0.10.
-‐1
0
1
2
3
4
5
6
0 50 100 150 200 250 300
LN[Elemen
t]
River miles upstream from Mississippi confluence
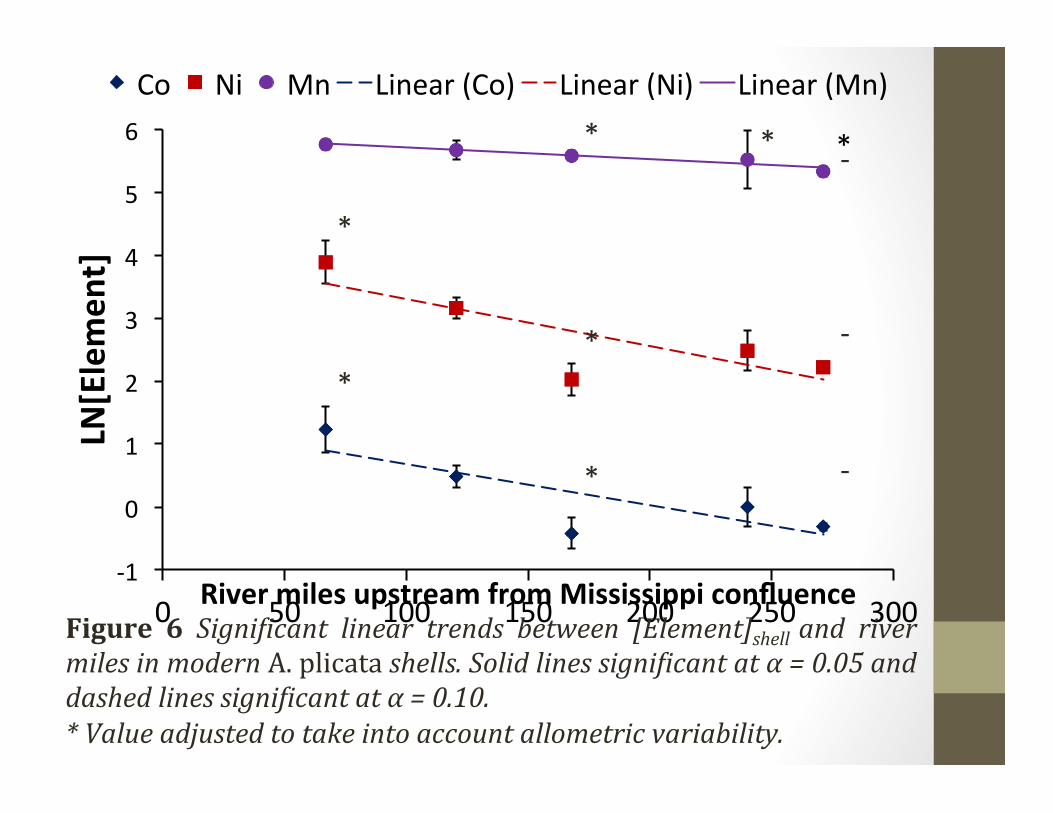
Co Ni Mn Linear (Co) Linear (Ni) Linear (Mn)
* -‐
-‐
-‐
* *
*
*
*
*
Figure 6 SigniJicant linear trends between [Element]shell and river miles in modern A. plicata shells. Solid lines signiJicant at α = 0.05 and dashed lines signiJicant at α = 0.10. * Value adjusted to take into account allometric variability.
Cross-‐species comparisons • Amblema plicata vs. Quadrula quadrula
• 5 sites from the Illinois River • No element consistently significantly different
• Ac1nonaias ligamen1na vs. Quadrula pustulosa • 1 site from the Kankakee River • Cu, Zn, Cd significantly different
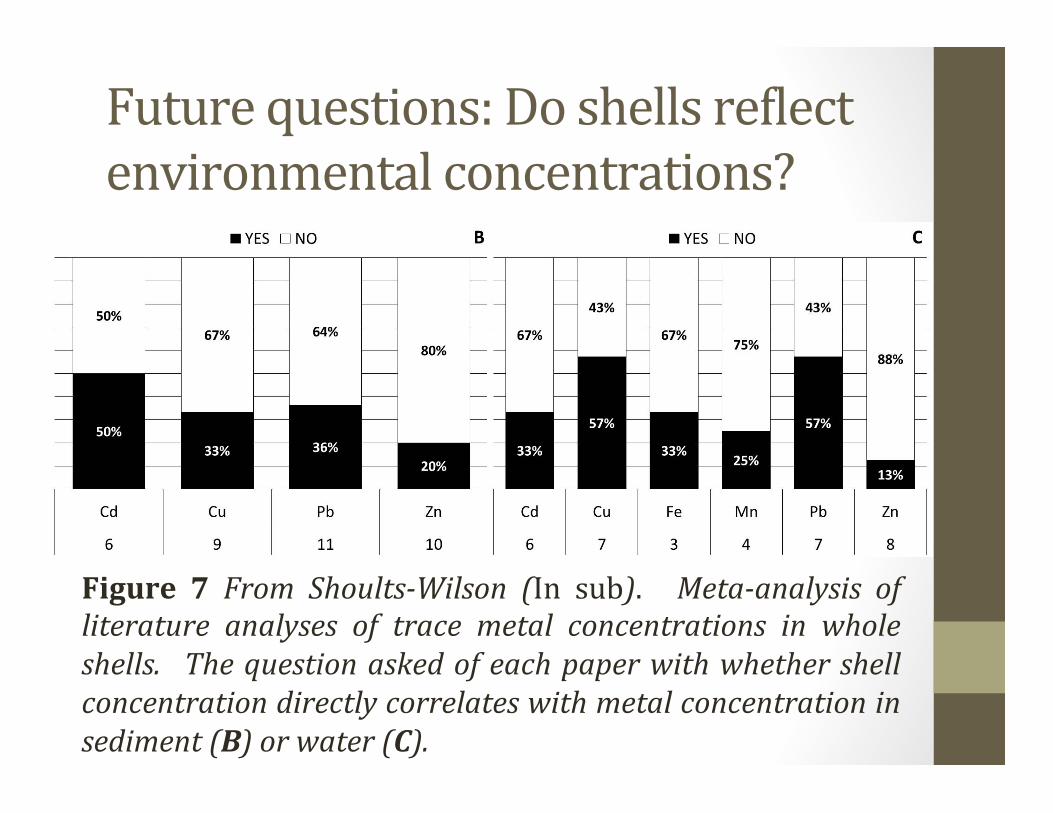
Future questions: Do shells reYlect environmental concentrations?
Figure 7 From Shoults-‐Wilson (In sub). Meta-‐analysis of literature analyses of trace metal concentrations in whole shells. The question asked of each paper with whether shell concentration directly correlates with metal concentration in sediment (B) or water (C).
Other future directions • Tissue/shell comparison
• Correla)on • Limits of detec)on • Within-‐site variability • Seasonality
• Intra-‐annual analysis of growth rings
Questions?
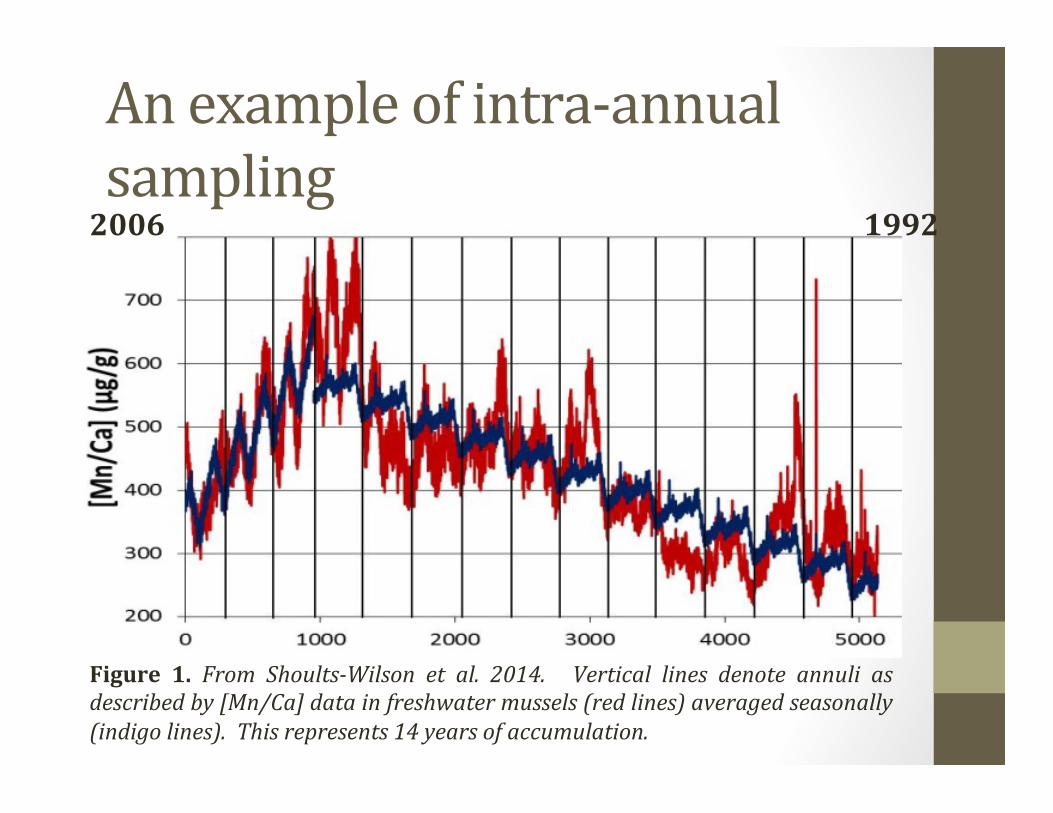
An example of intra-‐annual sampling
Figure 1. From Shoults-‐Wilson et al. 2014. Vertical lines denote annuli as described by [Mn/Ca] data in freshwater mussels (red lines) averaged seasonally (indigo lines). This represents 14 years of accumulation.
2006 1992
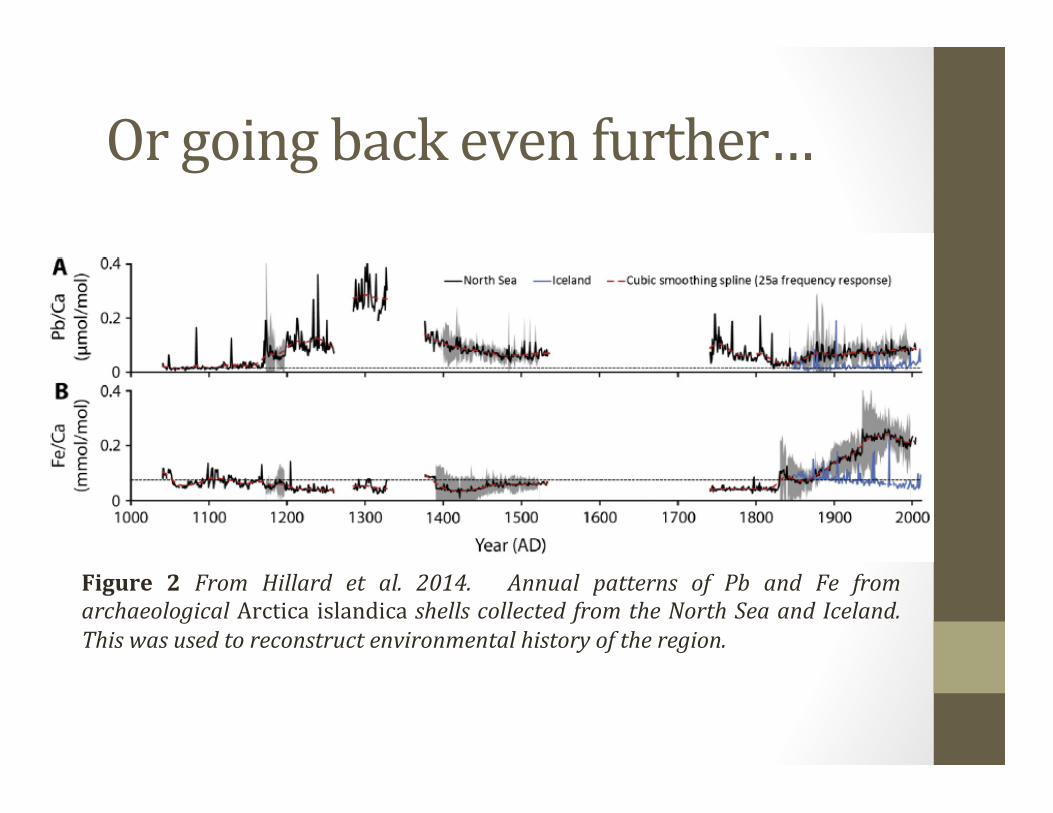
Or going back even further…
Figure 2 From Hillard et al. 2014. Annual patterns of Pb and Fe from archaeological Arctica islandica shells collected from the North Sea and Iceland. This was used to reconstruct environmental history of the region.
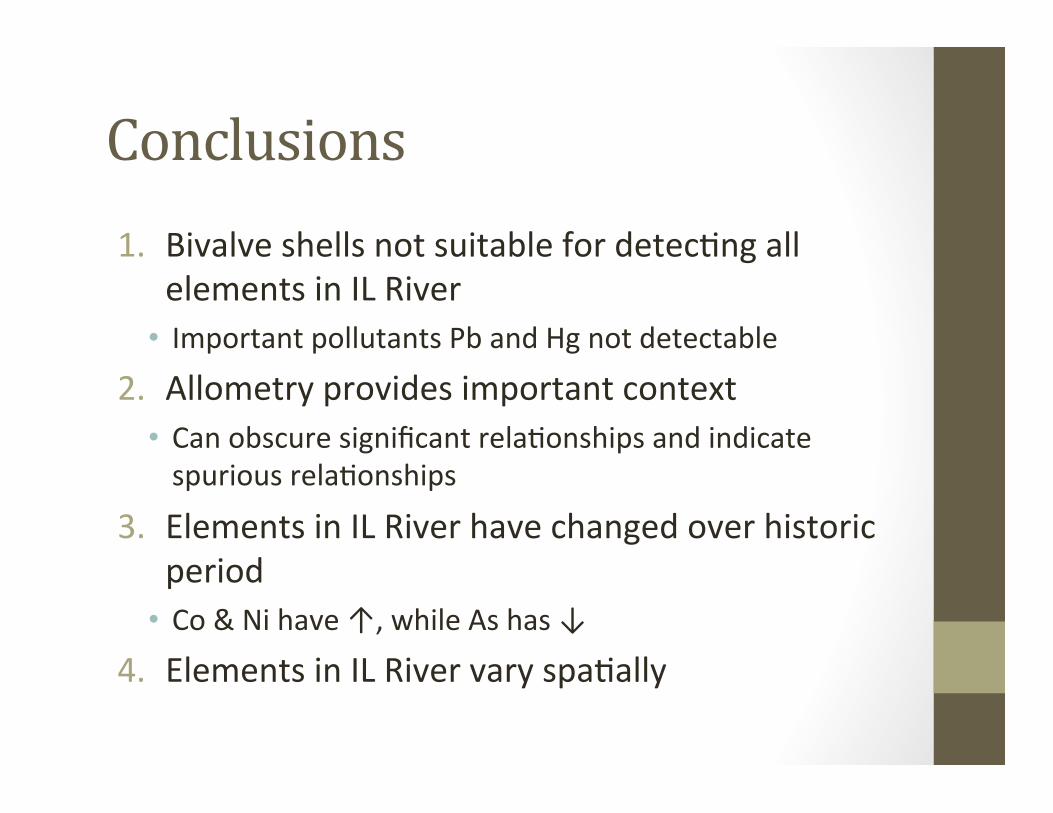
Conclusions 1. Bivalve shells not suitable for detec)ng all
elements in IL River • Important pollutants Pb and Hg not detectable
2. Allometry provides important context • Can obscure significant rela)onships and indicate spurious rela)onships
3. Elements in IL River have changed over historic period
• Co & Ni have ↑, while As has ↓ 4. Elements in IL River vary spa)ally