Embed Size (px)
Citation preview

Historical Climatology: Toledo, Ohio
Provided in collaboration with the Michigan Office of the State Climatologist www.glisa.msu.edu Last updated: 7/19/2013
Map generated with Google Maps
Geography
Toledo sits on the Maumee River at the western end of Lake Erie in Northwest Ohio and borders the State of Michigan. It is the fourth most populous city in Ohio with a 2010 population of 287,208. The surrounding terrain is flat. Land use ranges from urban at the city center to agriculturally dominated in outlying areas. 1981-‐2010 Temperature and Precipitation Summary Mean Annual Temperature (°F) 50.1 Mean Annual Minimum Temperature (°F) 40.4 Mean Annual Maximum Temperature (°F) 59.8 Mean Number of Days per Year that exceed 90°F 13 Mean Number of Days per Year that fall below 32°F 120 Lowest Mean Annual Temperature (°F) 47.9 Highest Mean Annual Temperature (°F) 53.2 Mean Annual Total Precipitation (inches) 34.2 Lowest Mean Total Precipitation (inches) 27.3 Highest Mean Total Precipitation (inches) 45.7 Mean Number of Days/Year with > 0.1" Precip. 70 Mean Number of Days/Year with > 0.25" Precip. 44 Mean Number of Days/Year with > 0.5" Precip. 21 Mean Number of Days/Year with > 1" Precip. 3
Overview
Toledo experiences a humid continental climate, characterized by four distinct seasons. Compared to much of the Great Lakes Basin, both temperature and precipitation vary widely seasonally. Summers are warm and humid while winters are cold and somewhat snowy. Lake Erie does have a mild moderating effect on temperature, especially in late spring and fall, when air and water temperature differences are maximal. Lake effects on temperature are lessened during winter months when Lake Erie freezes over and prevailing winds that are usually westerly. During the summer. southerly and westerly winds combined with warm surface waters of Lake Erie tend to negate the lake's cooling ability on the city, and the lake's presence often increases humidity.
Mean monthly high, average, and low temperatures for the period 1981-‐2010.
Mean monthly total precipitation with the 25th and 75th percentiles for the period 1981-‐2010.
Station ID# 094830 Latitude 41.6N Longitude 83.8W
Historical Climatology: Toledo, Ohio
www.glisa.msu.edu Provided in collaboration with the Michigan Office of the State Climatologist Last updated: 7/19/2013
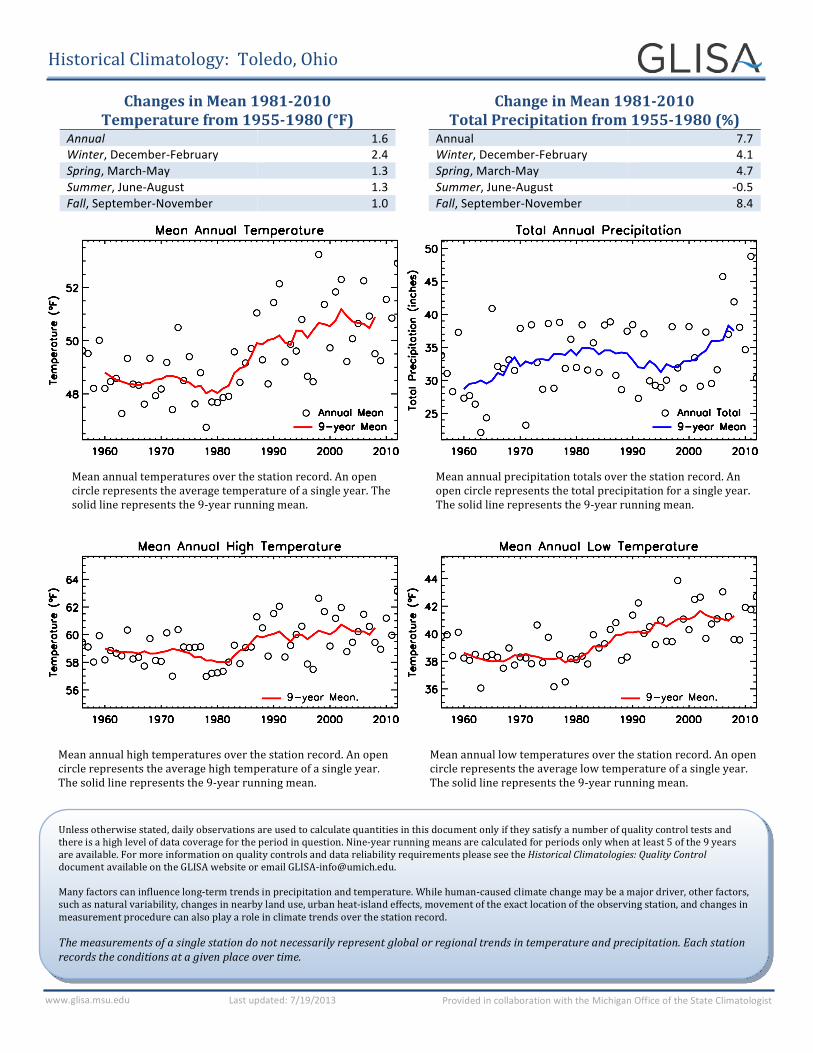
Changes in Mean 1981-‐2010 Temperature from 1955-‐1980 (°F)
Annual 1.6 Winter, December-‐February 2.4 Spring, March-‐May 1.3 Summer, June-‐August 1.3 Fall, September-‐November 1.0
Change in Mean 1981-‐2010 Total Precipitation from 1955-‐1980 (%)
Annual 7.7 Winter, December-‐February 4.1 Spring, March-‐May 4.7 Summer, June-‐August -‐0.5 Fall, September-‐November 8.4
Mean annual temperatures over the station record. An open circle represents the average temperature of a single year. The solid line represents the 9-‐year running mean.
Mean annual precipitation totals over the station record. An open circle represents the total precipitation for a single year. The solid line represents the 9-‐year running mean.
Mean annual high temperatures over the station record. An open circle represents the average high temperature of a single year. The solid line represents the 9-‐year running mean.
Mean annual low temperatures over the station record. An open circle represents the average low temperature of a single year. The solid line represents the 9-‐year running mean.
Unless otherwise stated, daily observations are used to calculate quantities in this document only if they satisfy a number of quality control tests and there is a high level of data coverage for the period in question. Nine-‐year running means are calculated for periods only when at least 5 of the 9 years are available. For more information on quality controls and data reliability requirements please see the Historical Climatologies: Quality Control document available on the GLISA website or email GLISA-‐[email protected]. Many factors can influence long-‐term trends in precipitation and temperature. While human-‐caused climate change may be a major driver, other factors, such as natural variability, changes in nearby land use, urban heat-‐island effects, movement of the exact location of the observing station, and changes in measurement procedure can also play a role in climate trends over the station record. The measurements of a single station do not necessarily represent global or regional trends in temperature and precipitation. Each station records the conditions at a given place over time.

Historical Climatology: Toledo, Ohio
www.glisa.msu.edu Provided in collaboration with the Michigan Office of the State Climatologist Last updated: 7/19/2013
Mean seasonal temperatures over the station record. An open circle represents the average seasonal temperature of a single year. The solid line is the 9-‐year running mean.
Open circles represent the first (left) and last (right) winter freeze of the year (daily low temperature < 32°F) from 1900-‐2010. The solid line is the 9-‐year running mean.
Open circles represent the number of days per year in which the daily high temperature exceeded 90°F (left) and where the daily low temperature dropped below 32°F (right) in a single year. The solid line is the 9-‐year running mean.

Historical Climatology: Toledo, Ohio
www.glisa.msu.edu Provided in collaboration with the Michigan Office of the State Climatologist Last updated: 7/19/2013
Mean total precipitation by season over the station record. An open circle represents the total seasonal precipitation for a single year. The solid line represents the 9-‐year running mean of the total seasonal precipitation.
Number of days per year that exceeded the indicated daily precipitation totals. The solid line represents the 9-‐year running mean. Days that exceeded a higher threshold are included in days exceeding lower thresholds.