Embed Size (px)
Citation preview
HISTORICAL RESEARCH REPORTResearch Report TM/88/11
1988
Investigations of the feasibility of using aerodynamic models for studying the local build – up of methane gas and risk of frictional ignition in mines. Final report on CEC Contract 7258 – 03/107/08 Aitken RJ, Vincent JH, Mark D, Botham RA

Copyright © 2006 Institute of Occupational Medicine. INSTITUTE OF OCCUPATIONAL MEDICINE No part of this publication may be reproduced, stored Research Avenue North, Riccarton, Edinburgh, EH14 4AP or transmitted in any form or by any means without Tel: +44 (0)870 850 5131 Fax: +44 (0)870 850 5132 written permission from the IOM e-mail [email protected]
Investigations of the feasibility of using aerodynamic models for studying the local build – up of methane
gas and risk of frictional ignition in mines. Final report on CEC Contract 7258 – 03/107/08
Aitken RJ, Vincent JH, Mark D, Botham RA This document is a facsimile of an original copy of the report, which has been scanned as an image, with searchable text. Because the quality of this scanned image is determined by the clarity of the original text pages, there may be variations in the overall appearance of pages within the report. The scanning of this and the other historical reports in the Research Reports series was funded by a grant from the Wellcome Trust. The IOM’s research reports are freely available for download as PDF files from our web site: http://www.iom-world.org/research/libraryentry.php
HISTORICAL RESEARCH REPORTResearch Report TM/88/11
1988

ii Research Report TM/88/11
Report No. TM/88/11UDC 622.411.3(086.5)
INVESTIGATIONS OFTHE FEASIBILITY OFUSING AERODYNAMICMODELS FOR STUDYINGTHE LOCAL BUILD-UPOF METHANE GAS ANDRISK OF FRICTIONALIGNITION IN MINES
RJ AitkenJH VincentD MarkRA Botham
August 1988
Price: £20.00 (UK£25.00 (Overseas)
I
Report No. TM/88/11CEC CONTRACT 7258-03/107/08
INSTITUTE OF OCCUPATIONAL MEDICINE
INVESTIGATIONS OF THE FEASIBILITY OF USING AERODYNAMICMODELS FOR STUDYING THE LOCAL BUILD-UP OF METHANE GAS AND
RISK OF FRICTIONAL IGNITION IN MINES
by
RJ Aitken, JH Vincent, D Mark, RA Botham
FINAL REPORT ON CEC RESEARCH CONTRACT 7258-03/107/08
Duration of project: January 1986 to December 1987
Institute of Occupational Medicine8 Roxburgh PlaceEDINBURGHEH8 9SU
Tel: 031 667 5131Telex: 9312100237 G August 1988

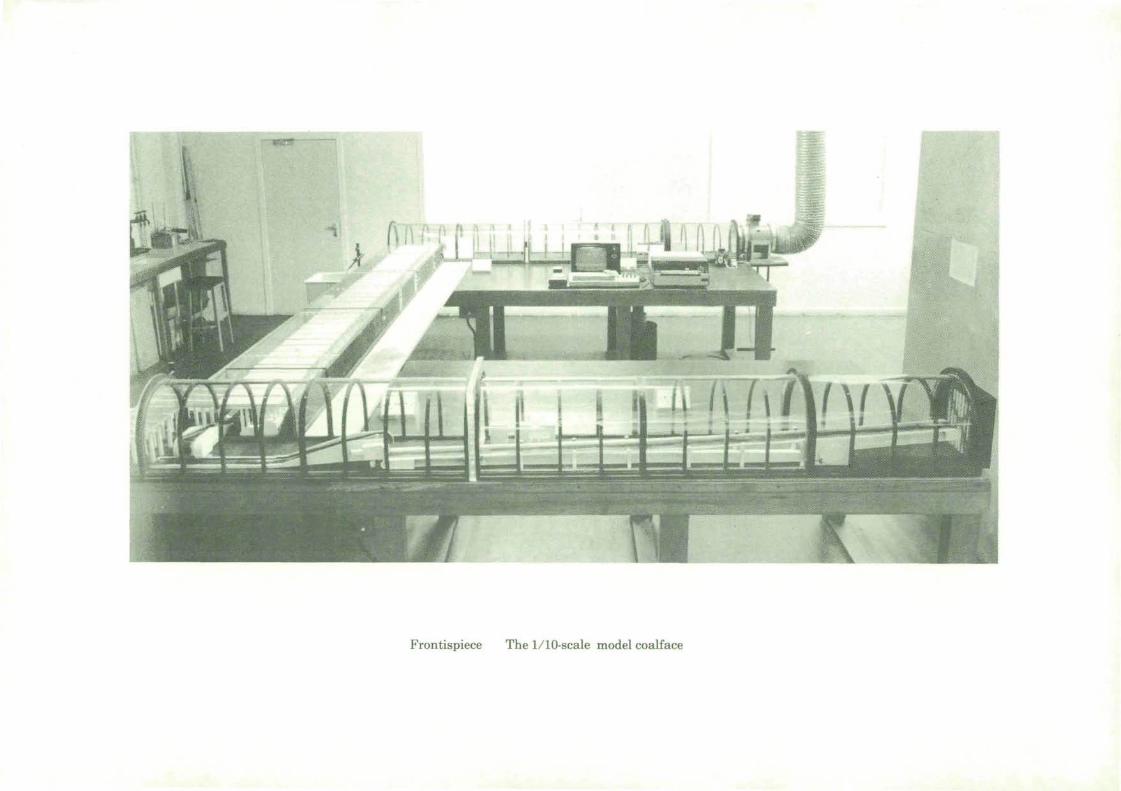
Frontispiece The 1/10-scale model coalface
This report is one of a series of Technical Memoranda (TM) published by theInstitute of Occupational Medicine. Current and earlier lists of these reports, andof other Institute publications, are available from the Librarian/Information Officerat the address overleaf.
For further information about the Institute's facilities for research,service/consultancy and teaching please contact the Librarian/Information Officer inthe first instance.
CONTENTS
Page No
SUMMARY 1
PRINCIPAL NOMENCLATURE 3
1. BACKGROUND 5
1.1 Introduction 5
1.2 Use of aerodynamic scale models in industrial 5engineering fluid mechanics in general
1.3 Use of scale models in mine aerodynamics studies 7
1.4 Problems of local build-up of methane in coalmines 8
1.5 Buoyancy 8
2. AIMS OF THE PROJECT 9
3. BASIC EXPERIMENTAL CONCEPTS 11
3.1 Introduction 11
3.2 Turbulent dispersion of airborne material in bulk 11airflow along the coalface
3.3 Ventilation of partially-enclosed regions 13
4. EXPERIMENTAL FACILITIES AND METHODS 15
4.1 The model coalface IS
4.2 Full-scale mine airway systems 15
4.3 Experimental protocols 16
4.4 Tracer generation and control 16
4.5 Smoke detection system 17
5. MEASUREMENTS OF OVERALL TURBULENT 19DIFFUSIVTTY (K) ON THE COALFACE
5.1 Laboratory experiments at 1/10-scale 19
5.2 Experiments at full-scale in the surface 20facility
5.3 Experiments at full-scale at an underground 20facility
5.4 Discussion 21
6. MEASUREMENTS OF RESIDENCE TIME 25PARAMETER (H) FOR THE CUT
6.1 Laboratory experiments at 1/10-scale 25
6.2 Experiments at full-scale in the surface facility 26
6.3 Discussion 27
7. MEASUREMENTS OF RESIDENCE TIME 29PARAMETER (H) FOR HEADINGS
7.1 Laboratory measurements at 1/10-scale 29
7.1.1 General heading experiments 297.1.2 Model studies to simulate the Lound Hall 30
return heading
7.2 Experiments on the Lound Hall surface facility 30at full-scale
8. GENERALISATIONS FROM THE RESEARCH SO FAR 33
8.1 Conclusions from the research 33
8.2 Scaling relationships 34
8.3 Future work 35
ACKNOWLEDGEMENTS 37
REFERENCES 39
FIGURES 41
INSTITUTE OF OCCUPATIONAL MEDICINE
Final Report on CEC Contract 7258-03/107/08
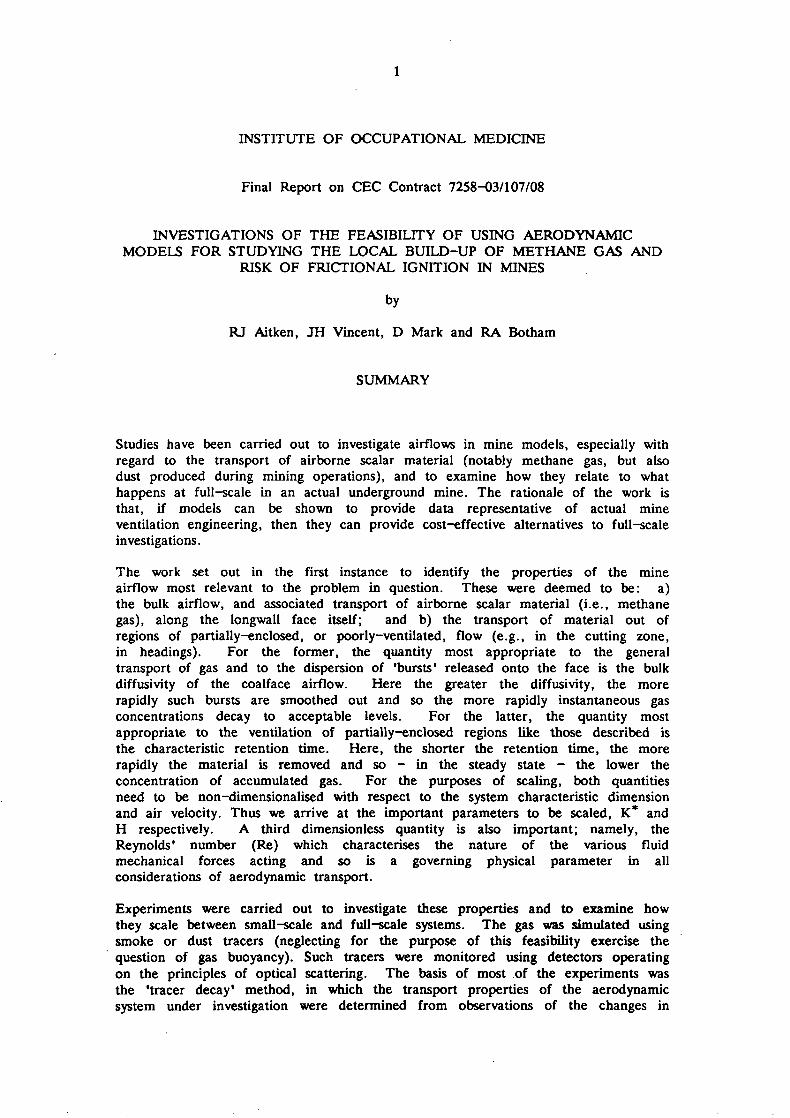
INVESTIGATIONS OF THE FEASIBILITY OF USING AERODYNAMICMODELS FOR STUDYING THE LOCAL BUILD-UP OF METHANE GAS AND
RISK OF FRICTIONAL IGNITION IN MINES
by
RJ Aitken, JH Vincent, D Mark and RA Botham
SUMMARY
Studies have been carried out to investigate airflows in mine models, especially withregard to the transport of airborne scalar material (notably methane gas, but alsodust produced during mining operations), and to examine how they relate to whathappens at full-scale in an actual underground mine. The rationale of the work isthat, if models can be shown to provide data representative of actual mineventilation engineering, then they can provide cost-effective alternatives to full-scaleinvestigations.
The work set out in the first instance to identify the properties of the mineairflow most relevant to the problem in question. These were deemed to be: a)the bulk airflow, and associated transport of airborne scalar material (i.e., methanegas), along the longwall face itself; and b) the transport of material out ofregions of partially-enclosed, or poorly-ventilated, flow (e.g., in the cutting zone,in headings). For the former, the quantity most appropriate to the generaltransport of gas and to the dispersion of 'bursts' released onto the face is the bulkdiffusivity of the coalface airflow. Here the greater the diffusivity, the morerapidly such bursts are smoothed out and so the more rapidly instantaneous gasconcentrations decay to acceptable levels. For the latter, the quantity mostappropriate to the ventilation of partially-enclosed regions like those described isthe characteristic retention time. Here, the shorter the retention time, the morerapidly the material is removed and so - in the steady state - the lower theconcentration of accumulated gas. For the purposes of scaling, both quantitiesneed to be non-dimensionalised with respect to the system characteristic dimensionand air velocity. Thus we arrive at the important parameters to be scaled, K* andH respectively. A third dimensionless quantity is also important; namely, theReynolds' number (Re) which characterises the nature of the various fluidmechanical forces acting and so is a governing physical parameter in allconsiderations of aerodynamic transport.
Experiments were carried out to investigate these properties and to examine howthey scale between small-scale and full-scale systems. The gas was simulated usingsmoke or dust tracers (neglecting for the purpose of this feasibility exercise thequestion of gas buoyancy). Such tracers were monitored using detectors operatingon the principles of optical scattering. The basis of most of the experiments wasthe 'tracer decay1 method, in which the transport properties of the aerodynamicsystem under investigation were determined from observations of the changes in
tracer concentration with time immediately following the removal of the tracersource.
For the bulk flow along the face itself, the experiments were conducted in a1/10-scale laboratory model, a full-scale surface model, and an actual undergroundmine respectively. These experiments showed that dispersion is controlled not onlyby turbulent diffusion but also by the entrapment of material into coherent vortexstructures in the wakes of roof supports and other blockage elements. This meansthat the flow cannot be regarded as equivalent to that through a 'rough pipe' (asearlier workers had suggested for flow in mine roadways). Thus scaling betweenlarge and small systems depends both on the characteristic Re for the coalface as aduct and on the corresponding Re for flow about the roof supports, etc..
For the ventilation of the cut and of headings, experiments were conducted in the1/10-scale model and in the full-scale surface system. For the flow cavity (oreddy) in the lee of the cut, ventilation was found to be influenced by'boundary-layer' effects introduced by the presence of the shearer itself. For theheadings, the removal of entrapped material was found to be faster at the returnend, due to the increased mixing associated with the "jet-effect" of the air exitingfrom the coalface. In addition, removal was faster for empty headings than forones containing equipment, etc..
During these experiments, the complex nature of the coalmine airflow becameapparent. Nevertheless, despite the limited scope of the study, the feasibility ofusing small-scale models to investigate ventilation problems was clearly indicatedand a set of scaling relationships relevant to the transport of methane (and otherairborne materials) was drawn up. These may be summarised as follows:-
* For the bulk airflow along the coalface, then scaling can be achieved forsystems from 1/10-scale up to full-scale provided that the mean air velocityexceeds 2 m/s.
* For the flow in the lee of the cut, direct scaling applies if the value of Re(for the cut) exceeds 50,000. Otherwise a correction factor must be applied.
* For non-ventilated headings, direct scaling applies for all practical values ofRe (for the heading) for systems from 1/10-scale up to full scale.
At this stage, however, these should be regarded as preliminary working guidelines.Further work is required to establish firm criteria for more complex, more realisticsituations (including the presence of moving machinery, falling coal and rock, watersprays, auxiliary air moving apparatus, etc.).
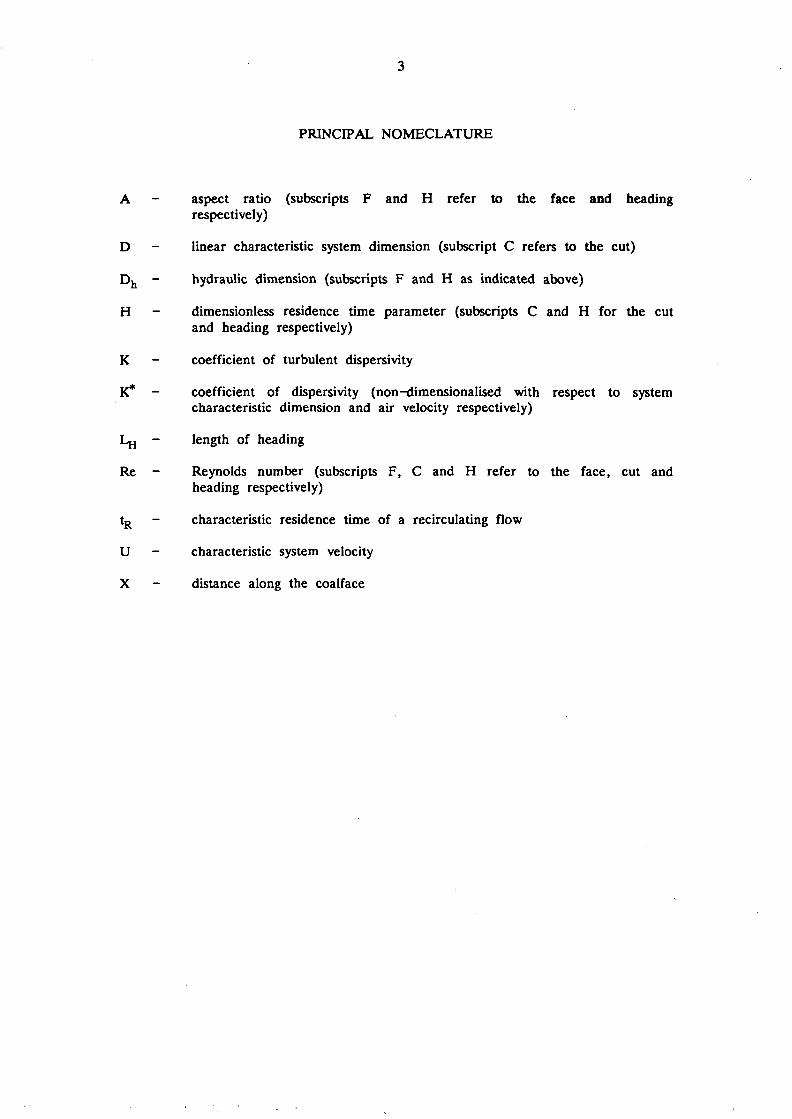
PRINCIPAL NOMECLATURE
A - aspect ratio (subscripts F and H refer to the face and headingrespectively)
D - linear characteristic system dimension (subscript C refers to the cut)
Dh - hydraulic dimension (subscripts F and H as indicated above)
H - dimensionless residence time parameter (subscripts C and H for the cutand heading respectively)
K - coefficient of turbulent dispersivity
K* - coefficient of dispersivity (non-dimensionalised with respect to systemcharacteristic dimension and air velocity respectively)
LH - length of heading
Re - Reynolds number (subscripts F, C and H refer to the face, cut andheading respectively)
tR - characteristic residence time of a recirculating flow
U - characteristic system velocity
X - distance along the coalface

1. BACKGROUND
1.1 Introduction
One of the objectives of mine ventilation is to ensure that the accumulation ofmethane gas does not reach the level where factional ignition (leading toexplosion) could occur. In British coal mines, maximum allowable methane levelsare set by Regulations under the Mines and Quarries Act, and considerable sumsare invested in air moving equipment and the necessary power to ensure that theseare not exceeded.
The airflow in a longwall mining system is extremely complicated, characterised inpart by the largely unidirectional movement of air through the main ducts(roadways and coalfaces) of the mine network and in part by the highlynon-uniform movement of air in partially-enclosed regions. In the latter categorywe have headings, stables and regions close to large underground equipment (forexample, on the coalface in the cutting zone of the coal-winning machine). It isparticularly difficult to ascertain the effectiveness of ventilation in such locations.Full-scale investigations of the problem are arduous, time-consuming and expensive,all the more so if they are carried out at actual underground locations.Small-scale studies in the laboratory can offer an attractive alternative, providedthat their results - appropriately scaled - can be shown to be valid.
1.2 Use of aerodynamic scale models in industrial engineering fluid mechanics ingeneral
In industrial engineering fluid mechanics, scale models have received widespreadapplication in, for example, architectural aerodynamics, design of automobiles,aircraft and ships, studies of the transport of air pollution in the atmosphericboundary layer, and so on. The general validity of the scale model approachdepends on a set of similarity relationships embodying the main physical processeswhich are involved in the simulation. In systems which are not complicated bythermal effects, such validity depends primarily on geometric and dynamicsimilarity. Geometrical similarity is straightforward and involves transforming alllength scales associated with the flow boundaries in the same proportion. Dynamicsimilarity needs more careful consideration.
Mathematically, the motion of a moving fluid is governed by the well-knownNavier-Stokes equations which reflect the forces acting due to pressure, viscosityand - where appropriate - body forces (such as buoyancy, etc.). It can be shownfrom these equations (Schlichting 1968) that, for a given set of flow boundaryconditions, unique solutions for the properties of the flow (e.g., flow pattern,friction losses, drag forces, etc.) are obtained if the dimensionless Reynolds number
Re = D U / 7 (1.1)
is constant, D being a characteristic dimension of the flow, U a characteristicvelocity and y the kinematic fluid viscosity (the ratio between actual viscosity anddensity). For flows in air under atmospheric conditions, it may usefully beapproximated by
Re ~ 7 x 10⁴DU (1.2)
where D is in [m] and U in [m/s].
What is the physical significance of Re? From simple physical and dimensionalarguments, it may be shown that it represents the characteristic ratio of inertialforces (derived from mass x acceleration for elementary packets of fluid) to viscousforces (derived from frictional forces associated with the viscous layers close to thesolid boundaries of the flow). For small Re, the behaviour of the boundary layersdominate the overall nature of the flow. Since the flow there is stronglydependent on Re, then so too is the overall nature of the flow. For large Re,the boundary layers exert relatively little influence and so the nature of the flow ismuch less dependent on Re. This is illustrated in Figure 1.1 by referring to somefamiliar, specific properties of a number of flow systems of general practicalinterest and describing them as functions of Re. These systems include bothexternal flows (i.e., flows about obstacles, and hence enclosing the flow boundaries)and internal flows (flows enclosed within the bounding surfaces). For example,Figure 1.1 a shows the dimensionless drag coefficient (CD) for the flow about abluff obstacle in the form of a flat disc placed normal to the freestream, given by
CD = Drag force per unit cross-sectional area/£ pU2 (1.3)
where the denominator is the pressure head associated with the freestream velocity.Figure l.lb shows the dimensionless Strouhal number (S) for describing theshedding of vortices in the near wake of a cylinder placed normal to the flow,given by
S = n D / U (1.4)
where n is the frequency of vortex shedding (Roshko 1954). Figure l.lc showsthe dimensionless friction factor (f) for turbulent flow in a rough-walled pipe,given by (Nikuradse 1933)
Static pressure drop x cross-sectional area"!/ , 2
Wall surface area J * P . -.
Finally, Figure l.ld shows the dimensionless residence time (H) for the entrainmentof airborne scalar entities in the wake of a two-dimensional flat plate placednormal to the freestream (MacLennan and Vincent 1982), given by
H = UtR/D (1.6)
where tR is the actual characteristic residence time. This example is particularlyrelevant to the present project, and we will return to the concept of residencetime later in the report.
Each of the examples given in Figure 1.1 indicates that the property in questionvaries sharply with Re at small Re, but tends to become constant at larger valuesof Re from 2,000 to 15,000 upwards. This observation provides valuable guidancewhen we come to consider the scale modelling of aerodynamic systems.
Strictly speaking, in the scale modelling of aerodynamic processes, in order topreserve dynamic similarity, the value of Re should be maintained between themodel and the real, full-scale system of interest. However, certain problems
become apparent as soon as we try to apply this rule to very large systems. Forexample, consider what happens for the simulation of flow near a building in theatmospheric boundary layer. For a typical high-rise building in the atmosphericboundary layer where D ~ 100 m and U ~ 5 m/s, we get Re ~ 35,000,000. Inorder to achieve strict dynamic similarity in a wind tunnel with a model with Dof, say, 0.5 m would require .U = 1000 m/s. This is clearly impracticable. Onealternative approach is to carry out experiments not in air but in some other,medium where the kinetic viscosity (7) is lower. For example, if water were tobe substituted for air, the fluid velocity in the 1/200-scale model could be reduced- by a factor of about 14 - to 70 m/s. This is still much too high for practicalpurposes. Based on such considerations, aerodynamicists have therefore set out toconsider under what conditions the requirement for equal Re can be relaxed.From Figure 1.1, it would appear that, at least as far as the 'bulk1 properties ofexternal and internal flows are concerned, dynamic similarity can be achieved overa wide range of Re provided that Re is greater than, say, from 1000 - 20,000.
1.3 Use of scale models in mine aerodynamics studies
Air flows in mine workings have been examined by a number of workers, including- in the early days - Cooke and Statham (1926/27), Smith (1935), Miller andBryan (1937/38) and many others. Notably, Professor Hinsley and his colleagues(Sales and Hinsley 1951/52, Jones and Hinsley 1958/9) examined the basis of scalemodel investigations for this application, in particular the role of Re. They notedthat, although most of the early workers used Re directly as the scaling parameter,this strictly holds for laminar flow only. For turbulent flow, it may be possible toachieve dynamic scaling by other means.
Hinsley and colleagues identified two possible types of model. The first is the'replica' type, built as an exact scale-reproduction of a particular mine system ofinterest, providing information relevant to - but restricted to - that system. Thesecond is the 'systematic* type, comprising simpler structures embodying theessential aerodynamic elements but without fine detail, providing information thatmay be more readily generalised and extended to other systems. The work ofHinsley's group was concerned with the latter type, using square ducts containingsupport constructions relevant to British mine airways in the 1950s. The effect ofthe supports on the broad nature of the flow was considered to be such that theduct could be regarded as aerodynamically 'rough*.
From measurements of pressure drop, the dimensionless friction factor (f) for theflow through the ducts was determined for ranges of support configurations.From these experiments, f was determined for each configuration as a function ofRe in the range from 40,000 to 700,000. Some typical results are given in Figure1.2. It is seen that changes in f are relatively small. This is broadly consistentwith Figure 1.1 c, and so supports the hypothesis of the mine airway as arough-walled pipe. Such changes as are present were thought to be associatedwith the changes in drag coefficient (CD) for the blockage elements which went tomake up the individual supports. For these, Re was much lower, in the rangefrom about 2,000 to 30,000 where changes in CD might have been expected.
The work of Hinsley and colleagues was concerned primarily with problemsassociated with flow resistance in mine airway systems which, largely, are no longerrelevant to modern mine systems. More recently, other workers have explored theuse of aerodynamic scale models for studies in ventilation and dust control in moreuptodate mining. Opinion seems to be mixed about whether scaling should take
place with respect to Re or whether this can be relaxed. Work at the US Bureauof Mines (e.g., Stein el al 1974) was carried out whilst maintaining scaling of Rewith respect to full-scale. On the other hand, in Germany atSteinkohlenbergbauverein (e.g., Renner and Reinhardt 1973 and other reports to theNorth Rhine Westphalia Parliament), it was concluded that the shape of the flowand propagation of tracer smoke near a shearer loader on a longwall coalface wasreasonably independent of both average air velocity and Re. In Britain, Fletcher(1977) reported model experiments to investigate the dispersion of contaminants ona longwall coalface, but did not comment on the validity of the modelling. Fromall such evidence, it appears that understanding of the scaling relationships for airflows between small-scale and full-scale models of mine airways has not yetreached the point where model studies can be used with confidence in the routineinvestigation of ventilation problems.
1.4 Problems of local build-up of methane in coal mines
The main control of methane levels in mines is carried out by the appropriatesetting of the volumetric flowrate of air through individual airways. This isachieved by means of a fan at the entry to the mine, by appropriate distributionof the total airflow between the various workings of the mine network, and by theuse of auxiliary fan systems. However, it has been recognised since the 1960s thatthere are regions in the mine where methane is being released but where theairflow is relatively stagnant so that ventilation is less effective. In particular theproblem was identified at face ends and stables (e.g., Harley 1964, Jones andClarke 1965) and in the vicinities of mining machines (e.g., Browning 1969, Kisselland Bielicki 1974). Engineering solutions have been proposed and put into practice,including air-jet scouring and - on the shearer - deployment of the Hollow DrumVentilator (HDV) (McKinlay 1974). Nevertheless the occurrence of frictionalignition of methane in such regions remains a practical problem which appearsfrom time to time. Further engineering control is therefore desirable.
1.5 Buoyancy
Methane gas is known to be lighter than air. As a result, in poorly-mixed flows,some separation (or 'layering') is to be expected. In fact, in coalmines, theproblem of layering is well-known. It is particularly important in face ends andheadings where effective ventilation is requires special attention.
2. AIMS OF THE PROJECT
The project examines the extent to which it is possible from small-scale modelstudies in the laboratory to obtain realistic indices relevant to the potential localaccumulation of methane gas in coal mines. Of particular interest are locationswhere methane may be released but where ventilation may be relatively inefficient;for example, on the longwall coalface in the cutting zone (in the lee of thewinning machine) and in headings. In these regions, the flow is partially enclosedso that ventilation is substantially influenced by turbulent mixing with the mainventilation airstream.
The aim was to carry out experiments to investigate how the appropriate indices ofventilation effectiveness scale between models in the laboratory (using 'systematic'models of longwall coalfaces at approximately 1/10-scale) and full-scale models ofthe surface and at actual underground locations. If the general feasibility ofscaling can be demonstrated, then it opens up the possibility of exploringengineering modifications to .improve specific problem situations by means of muchcheaper and more convenient models. Full-scale engineering trials can subsequentlybe carried out with greater confidence on any suggested improvements which lookpromising.
The scope of the work is deliberately confined to a limited range of processes andeffects representing broad areas of immediate interest. These include the nature ofthe bulk air movement along the coalface, the nature of air movement around thecutting zone (near the shearer drum), and the nature of air movement in headings.Specifically excluded at this stage are the effects of methane buoyancy, movingmachinery, falling coal and rock, water sprays, etc.. These aspects should form thebasis of future work. With this in mind, therefore, the recommendations aboutscale model relationships which will derive from the project will take the form ofpreliminary working guidelines.
The work described in this report is complementary to other projects carried out atBritish Coal's Headquarters Technical Department (Bretby) under CEC ContractsNos. 7255-11/08/068 and 7255-11/08/069.

10
11
3. BASIC EXPERIMENTAL CONCEPTS
3.1 Introduction
In the experimental investigation, two aspects of airflow in the mine airways wereidentified as of primary importance. The first concerns the nature of the overallbulk transport of airborne material along the coalface since any scaling of mineventilation systems must properly reflect such transport. The second is thetransport of airborne material in the partially-enclosed, relatively-stagnant regionsof interest. These two aspects formed the main basis of the experimentalprogramme. To investigate them, two versions of the so-called 'tracer-decay1 or'residence-time' method were employed.
3.2 Dispersion of airborne material in bulk airflow along the coalface
If an infinitesimally-short 'burst' of a tracer material is released at an upstreampoint on the coal face, and if the burst is observed as it subsequently passes adetector located at a downstream point, then the overall longitudinal dispersivity forthe length of the face in question is reflected in the broadening of the burst whichoccurs as it moves along the face. The simplest view of such dispersion is thatit is turbulent diffusion which is the predominant mechanism.
The coal face is treated initially as a rough, straight duct (or pipe). In theirstudies relevant to the dispersal in mines of short outbursts of methane, Hodkinsonand Leach (1957/58) and Airey (1968) followed the classical dispersion theory ofTaylor (1954). This had originally been developed in order to explain thedispersion of dissolved salt in water flowing through a pipe. From this theory, thedispersion of a short burst over a distance X of the duct is as illustratedschematically in Figure 3.1. For the downstream point, this shows the variation inconcentration of the tracer as a function of time. It satisfies the expression
C(t) = AH exp {-(x-Ut)2/4Kt) (3.1)
where C(t) is the tracer concentration at the detector as a function of the time (t)elapsed since the burst was released, K the dispersion coefficient, U the airvelocity averaged over the cross-section of the pipe, and A a constant.
The picture given in Figure 3.1 embodies the fact that, due to turbulent diffusionin the air flow along the coalface, some packets of the tracer material move aheadof the mean flow while a corresponding proportion lag behind. Thus the originalburst becomes broadened or 'smeared out'. The amount of broadening increasesthe longer the time since the burst was released; it also increases with K. It isinteresting to note that the 'smeared out* trace as shown in Figure 3.1 displays amarked asymmetry, with a 'tail* in the dispersion trace at larger values of t. Thisis because, when the trace is viewed in the time domain (as in Figure 3.1),packets of tracer which arrive at the detector later have therefore been diffusingfor longer. If the picture were to be transformed into the space domain (so thatthe 'smeared out* burst could be viewed as an instantaneous 'snapshot'), it wouldthen appear as symmetrical. In addition, it is relevant to note that, the longerthe time elapsed since the burst was released, the greater the tendency for thetrace hi the time domain to become symmetric.In the laboratory, it is often difficult to provide a burst of tracer (e.g., smoke)
12
which is both short enough and intense enough. Consider therefore the alternative'step-down* approach. Here, the initial burst is replaced by a continuous, steadyinjection of tracer which is abruptly removed at time t=0. Mathematically, thedifferential of the resultant step function is directly equivalent to the ideal burst.In turn, the differential of the resultant decay trace observed at the detector isequivalent to the 'smeared out* dispersion pulse. This is illustrated in Figure 3.2where
C( t ) - 1- /*C'( t)dt / /" C ' ( t ) d t (3.2)
in which C(t) is now the tracer concentration in the modified approach and C'(t)is a fictitious concentration corresponding to the original approach. In thisexpression, the denominator in the second term serves to normalise the integralover the dispersion pulse. From Equations (3.1) and (3.2) and experimental datalike those indicated in Figures 3.1 and/or 3.2, it is seen that the possibility existsto determine K. It remains to examine how this might be achieved in practice.
For a dispersion pulse of the ideal type shown in Figure 3.1, it is possible toobtain K directly by analytical means. This is achieved by plotting (C(t) ti} as afunction of t, thus transforming the trace into a symmetrical one. Now, bymanipulation of Equation (3.1), K may, in principle, be determined from the widthof the transformed trace at 1/e of its peak height. Unfortunately, for a trace ofthe form derived from the 'step-down1 approach (Figure 3.2), it is not possible toapply such direct analytical means. The reason is that the quantity of interest (K)is contained inside an integral which does not have an analytical solution. Onealternative is to numerically differentiate the trace in Figure 3.2 hi order to arriveat the form shown in Figure 3.1, and then to proceed as before. However, whenthis was attempted in preliminary experiments, it was found that relatively smalllevels of 'noise' on the original trace became amplified to unacceptable levelsduring the differentiation process. Another alternative approach, the one whichwas adopted, is to examine Equation (3.2) directly in relation to theexperimentally-obtained trace and to find - by the statistical method ofleast-squares - a value for K which gives the best fit.
We still have the problem of how to estimate U. It is not accurate enough tomeasure it by, say, anemometry since this does not take account of the distributionof velocity across the duct. It is therefore preferable to make use of theinformation contained in the trace itself since this embodies not only the influenceof K but also U. Taylor (1954) showed that the velocity can be read off fromthe time of the peak (and not the median) of the dispersion trace of the idealisedform displayed in Figure 3.1 (also knowing the distance between the source andthe detector). Unfortunately, this means that U cannot be obtained directly fromthe modified trace of the form displayed in Figure 3.2. The solution to thisproblem is to regard U as a second unknown (along with K as already identified)to be determined statistically from the data.
Some information is already available on how K scales between small andlarge-scale mine airway systems. It is based on the prediction from Taylor'stheory that, for flow in a rough pipe of diameter D, K is related to thedimensionless friction factor, f, by
K = 3.57 D U fi (3.3)Since, from the experimental work of Hinsley and his colleagues already referredto, f is seen to be reasonably constant for mine airways over a wide and relevant
13
range of Re (see Figure 1.2), then so too - from Equation (3.3) - should K alsobe constant. By means of the experimental method outlined above, it was oneintention of the present project to obtain more direct information in this respect.
3.3 Ventilation of partially-enclosed regions
Separated flow, such as that found in the wake of a bluff flow obstacle or in thelee of a sudden flow expansion or bend, is characterised by the 'cavity' ofrecirculating air (or enclosed eddy) which is divided from the main freestream flowby the turbulent shear layers at its boundary. Airborne material which is releasedinto such an eddy is conveyed into the freestream mainly by turbulent diffusionacross those layers and - in some instances - by the coherent shedding of vortices.The effectiveness of the removal of material from the cavity is therefore whollydependent on those fluid mechanical processes.
Experiments may be conducted to investigate the effectiveness of those processes bysuddenly switching off the source of material and monitoring the concentration ofwhat remains in the cavity as a function of time. Experience gained in relation toa wide range of types of flow cavity, including the near wakes of flat plates ofsimple shape, surface mounted blocks, perforated plates, etc., has revealed theshape of that decay to be consistently exponential. In such cases, we may writedown the dimensionless quantity
H = U tR / D (3.4)
where, as before, U and D are characteristic air velocity and dimensionrespectively. The quantity tR is the time constant of the decay, and ischaracteristic of the mean residence time of material in the cavity. The number His an overall fluid mechanical property that relates to the basic ability of materialto be transported (by turbulent diffusion or by vortex shedding and swirl) acrossthe shear layers which separate the cavity from the main airflow (Humphries andVincent 1976, MacLennan and Vincent 1982).
The experiment refers to a non-steady state situation. However, most importantly,it yields information relevant to the steady state situation. This has beenconsidered in relation to the transport of airborne pollution near buildings (Vincent1977, 1978). It was shown that, for a cavity within which there is a source ofairborne material of strength P (in units of [amount released per unit time]), thesteady state mean concentration (C^) which is achieved when the input contributiondue to the source is just balanced by the output due to turbulent diffusion, etc., isgiven by
Cj-s - P H / D2 U (3.5)
As already mentioned, H is reasonably constant provided that Re is high enough.From wind tunnel experiments with surface-mounted blocks representing buildings atsmall-scale, it has been shown that H lies in the range from about 7 to 10,depending somewhat on the level of freestream turbulence (Vincent 1977, 1978).Therefore Equation (3.5) is reasonably consistent with the predictions of Barry(1964) for the downwind concentrations of pollutants discharged near buildings,based on
GSS ~ k P / D2 U (3.6)
14
where k is a constant lying between 0.5 and 20.
In 1974, Drivas and Shair reported experimental measurements of residence time inthe near wake of a full-size three-storey rectangular building, and from theirpublished data, a figure of H ~ 6.5 may be arrived at. This is remarkablyconsistent with the value obtained from the (roughly) corresponding wind tunnelexperiments referred to, and supports the general view that small-scale modelstudies can provide useful fluid mechanical information about large-scale systems.
From the above, it would appear that the residence time parameter (H) is apotentially useful predictor for the effectiveness of ventilation of a particallyenclosed flow region. It has the advantage that it embodies a whole range ofcomplex aerodynamic processes within a single quantity (in the same way that theturbulent diffusivity K does for the main airflow) and it can be obtained using verysimple instrumentation. It remains to be seen to what extent it scales betweensmall-scale and full-scale mine airway systems.
15
4. EXPERIMENTAL FACILITIES AND METHODS
4.1 The model coalface
The 1/10-scale model used in the present study had been built under a previousproject (CEC Contract No. 7256-21/029/08) and is described in detail in thereport by Vincent et al (1983). Its original intention was to enable investigation ofthe structure of the turbulence of the airflow in longwall mineworkings so that theeffects on dust sampler performance could be assessed. It was designed to be ofthe 'systematic' (as opposed to 'replica') type, embodying only the principleaerodynamic features of an actual coalface. The model is shown hi thefrontispiece to this report and, schematically, in Figure 4.1. It incorporates theface itself, intake and return roadways, intake stable, advance headings, roofsupports, drum shearer, heading machine and appropriate transportation. It wasassumed in constructing the model that the roof of the coal face caves inimmediately behind the advancing roof supports. The model was designed to be asflexible as possible so that various features can be removed, added or changedaround as desired (including changing from the advancing to the retreating faceconfiguration). Air movement was supplied by means of a variable-speed, 2 kW,centrifugal fan, and was discharged to outdoors in order to dispose of the tracersmoke which was used in the experiments.
The actual length of the coal face itself - corresponding to about 40 m atfull-scale, incorporating 35 individual roof support units (or 'chocks') - is 'shorter'than would be normally found underground in practice. However, it is expectedthat turbulent flow conditions would become fully developed relatively quickly as airenters the face from the intake roadway. Therefore it was expected initially thatthe length of the face would not be a factor in the flow parameters of interest.As we shall see later, the results which were subsequently obtained suggest that thisview might have been somewhat oversimplistic.
The model was fabricated from perspex and wood, and designed to provide ease ofaccess for the insertion of instruments and for other experimental purposes.During the earlier project referred to, local measurements were made - usinghot-wire anemometry - of the mean air velocity, turbulence intensity andturbulence length scales. The results showed that, consistent with what is knownabout airflow along the coalface at full-scale, the windspeed is substantially higherin the machine track than in the travelling track. This is not surprising since thisis the flow path where there is least resistance due to the obstructions imposed byroof supports. Along the face, turbulence intensity ranged from about 10 to 40%,being highest in the regions of recirculating air in the near wakes of the individualcolumns of the roof supports. Turbulence length scale ranged from about about 20to 50 cm (when scaled up to relate to full-scale). In the roadways, turbulenceintensity ranged from 20 to 30% and turbulence length scale from 30 to 60 cm.
4.2 Full-scale mine airway systems
In addition to the main body of experiments carried out using the 1/10-scalemodel in the laboratory, a number of experiments were also carried out atfull-scale. This was an essential part of assessing the scaling relationships betweensmall and large-scale systems.
16
Full-scale experiments, closely reflecting many of those carried out in thelaboratory at 1/10-scale, were carried out using the surface facility at British Coal'sLound Hall Training Centre. Here, with the cooperation of the Manager and hisstaff, it was relatively easy to make modifications to the general arrangement.Also, because of the lack of intrinsic safety restrictions, it was possible to useinstrumentation similar to that used in our laboratory studies. The generalexperimental layout is shown schematically in Figure 4.2.
Full-scale experiments were also carried out on an actual coalface underground ata colliery in the North East of England (see Figure 4.3). Here, for obviousreasons, modifications to the face layout were not possible. However, oneadvantage of the underground facility - in addition to the fact that it representeda true mining situation - was that a much longer coalface (up to 200 m) wasavailable. Experiments were carried out at a time when no coal was beingproduced.
4.3 Experimental protocols
In the experiments carried out in the laboratory and in the full-scale surfacefacility, the distance (and hence time of travel) between the locations of tracerinjection and detection respectively for the bulk diffusivity studies was inevitablyshort. Therefore the experimental protocol for these studies involved the use ofthe 'step-down1 method outlined earlier. In the underground experiments,however, where the length of the coal face was so much greater, it becamefeasible to use the more-ideal 'burst' method.
4.4 Tracer generation and control
The ultimate purpose of the project was to examine the aerodynamictransport of methane. Since the aim was examine initial feasibility of applyingscale-model studies to the problems identified in the Introduction, itwas decided that the problem should be simplified by assuming that the methanewould behave essentially as the air itself. This meant that the well-knownbouyancy characteristic of methane (and the associated phenomenon of 'layering')could, at least in the present project, be placed to one side. This step enableda relatively simple experimental protocol to be drawn up, using an alternativetracer which is simple and safe to use in the laboratory and which can bemonitored in real-tune using relatively simple instrumentation.
The tracer chosen for the experiments, both in the laboratory and in the full-scalesurface model, was smoke. This has the advantage over other tracers that manyproperties of the flow phenomena of interest can be visualised. In the laboratory,a conventional wind tunnel smoke generator was used (TEM Engineering Ltd,System E). Smoke was delivered to a T-junction, one arm of which delivered thesmoke to the desired source point in the model and the other 'dumped' the smokeinto the exhaust on the downstream of the model. The experimental arrangementis shown in Figure 4.4. It shows a pair of fast, electro-activated valves, one ineach arm of the T-junction. These valves were actuated by commands from amicrocomputer (BBC Model B) so that the smoke delivered to the source pointcould be switched on and off according to any desired pattern, cyclical orotherwise. When smoke was not being delivered to the source point, it wasdumped to exhaust. By such an arrangement, it was found that the 'fall-time' ofthe rate of delivery of smoke to the airstream at the source was of the order of a
17
few milliseconds.
For the experiments using the full-scale surface model at Lound Hall, a muchlarger smoke generating system was employed (Rosco Type 8211). Since it provedimpracticable to use the solenoid valves to control the smoke, it was foundnecessary to switch the smoke manually whilst simultaneously triggering thedetection system program (by means of a small handswitch). Small errors insynchronisation which may have occured here were insignificant when comparedwith tracer decay times of the order of 30 sees.
In the experiments carried out at actual underground locations, it was not possible- for reasons of intrinsic safety - to employ the same tracer generation anddetection equipment that had been used hi the laboratory and Lound Hall studies.An alternative experimental system was therefore set up, based on simplerapparatus. Stone dust was used as the tracer where, for each test, a measuredamount (up to 5 kg) was released in a single burst (using a compressed airejector) at the upstream source point.
4.5 Smoke detection system
In the small-scale studies in the laboratory and in the large-scale studies in thesurface model at Lound Hall, the airborne smoke was detected by means of theoptical system shown in Figure 4.5. This employs a 0.5 mW He-Ne laser(Spectraphysics Inc., Model 155) arranged to illuminate the region where it isdesired to monitor the concentration of tracer smoke. Light is scattered by thevery fine (sub-micron) airborne smoke particles preferentially in the forwarddirection. A photodetector was therefore arranged to collected light scattered atabout 20 degrees from the forward direction, incorporating a collecting lens systemto receive only the light scattered from a small, 10-mm wide volume. Thesignal-noise ratio for the photodetector electronics was enhanced by mechanically'chopping* the laser beam (by means of a rotating split-disc arrangement) andelectronically sampling the signal from the scattered light at the 'chopping1
frequency. This enabled experiments to be carried out in the laboratory undernormal lighting conditions without significant interference. The response time ofthe photodetector system and associated electronics was sufficiently short in relationto the time scale of the fluid mechanical events of interest that monitoring of thetracer smoke concentration could reasonably be considered to be in 'real-time*.Output from the detection system therefore appeared as a voltage instantaneouslyproportional to the smoke concentration. This signal was directly delivered to thesame microcomputer used for controlling the smoke input, and the temporal historyof smoke concentration in each discrete event was recorded on-line. Analysis wascarried out, also on-line, using the 'step-down* approach embodied hi Figure 3.2.
In the underground experiments, the stone dust tracer was monitored as a functionof time at the downstream detection point using a SIMSLIN n optical detector toprovide a record of the respirable concentration of the tracer dust. With thisinstrument, a temporal record of the dust concentration was obtained, using anintrinsically-safe chart recorder (on loan from the Health and Safety Executive,Sheffield, courtesy of Mr. D. Lowe), in a form suitable for analysis later backon the surface. The results of the underground experiments were analysed hiterms of the 'burst* approach embodied in Figure 3.1. However, before the actualcalculation could be carried out as indicated, it was necessary to first correct themeasured trace to allow for the relatively slow response of SIMSLIN, it havingbeen found that the relationship between output and input for SIMSLIN exhibits a
18
first order characteristic with a time constant of as long as 16 seconds. Correctionof the measured output trace in order to obtain the true shape (undistorted by theSIMSLIN response) was carried out using the Fourier transformation numericalmethod for a transient signal as described by Doebelin (1966). An example of theeffect of this process on the shape of SIMSLIN trace is shown in Figure 4.6.
19
5. MEASUREMENTS OF OVERALL TURBULENT DIFFUSIVITY (K) ON THECOALFACE
S.I Laboratory experiments at 1/10-scale
As stated previously, the 1/10 scale laboratory model may be easily re-arranged tosimulate any of a range of possible mining configurations. The particulararrangement which was used for the bulk diffusivity measurements is shown inFigure 5.1. Its main features are: a) a 2.0-m long intake roadway of height0.33 m and base width 0.34 m, complete with a short advanced heading of 0.5 m;b) the face itself, 4.2 m in length and 0.135 m in height; and c) a returnroadway of the same dimensions as the intake, but without a heading. The modelwas set up as an advancing face in which the machine - with a single trailingdrum - was cutting against the ventilation. The width of the buttock of coal intowhich the machine was simulating a cut was 0.06 m. The face conveyor andchocks were laid out in order to simulate the 'snaking* effect behind the shearer asseen in actual mining situations. It was anticipated, however, that the detailedfeatures of the face arrangement would exert only limited influence on themeasured diffusivity of the airflow along the face, it being a 'bulk' property and solikely to be dependent primarily on general geometric features.
The smoke tracer was injected at a point corresponding to the centre of themachine track, 0.7 m from the intake end of the face. The volume of theinjected smoke was typically around 2 1/min, negligibly low when compared withthe volume of air drawn through the face during an experiment (in excess of 70001/min). The smoke concentration was measured, using the laser detection systemdescribed earlier, at the detection point located 0.47 m from the return end of theface, again at a point in the centre of the machine track. This gave alongitudinal distance between source and detector of 3.03 m.
In the experiments, a range of Reynolds' number for the airflow along the face(say, ReF) in the range from 17,000 to 130,000 was obtained by varying thewindspeed using the fan-speed controller. This is roughly equivalent to facewindspeeds in the range from about 1.5 to 12 m/s. For each value of ReF, thebulk dispersivity (K) was determined using the numerical method outlined previously(see Figure 3.3). Typically, because each individual decay curve was noisy, eachrecorded value of K was based on analysis of the composite decay curve obtainedby combining the data from between 50 and 100 separate decays. A typicalcomposite decay is shown in Figure 5.2.
From the K-value thus determined experimentally we obtained thenon-dimensionalised dispersivity from
K* = K/D^U (5.1)
where
f4 x cross-sectional area"| _ _^h " I 'wetted' perimeter J ( ' '
is the 'hydraulic* diameter of the coal face. This last quantity is the dimensionwhich is used in the calculation of ReF. A full set of results is shown in Figure5.3 where K* is plotted as a function of ReF. This plot shows that K* is indeed
20
independent of ReF over a wide range. Its mean value is 0.42.
5.2 Experiments at full-scale in the surface facility
The general layout of the face at the Lound Hall surface facility was arranged tosimulate as closely as possible that of the laboratory model face. This wasachieved by making 'mock up'-style modifications to the various components. Forexample, the machine normally used on the Lound Hall face is aconveyor-mounted trepanner quite dissimilar in shape and action to the shearermodelled in the laboratory. To achieve greater similarity, the trepanner wasmodified by adding blocks on top (covered with brattice cloth) to reduce themachine-to-roof clearance. Since the effect of the face machine was not the keyarea of interest in this section of the study, this was felt to have been sufficient.A false buttock of coal, of width 0.6 m, was constructed from brattice cloth andwood. By such means, the aim was to arrive at some degree of systematicsimilarity so that the results of aerodynamics studies between the two models couldreasonably be compared.
Face ventilation was provided by the two axially-mounted 17.5 kW fans mountedin the return roadway as shown in Figure 4.3. Brattice cloth was used to providea seal for the fans in the roadway. Two levels of ventilation were possible,corresponding to having both fans or just one fan running, enabling experiments tobe carried out at two windspeeds.
As in the 1/10-scale model the smoke injection point was located upwind of theshearer, 10 m in from the intake roadway, whilst the detection point was locateddownwind, 4 m from the return roadway. This gave a smoke path lengthequivalent to a longitudinal dimension (X) of 41 m. Because of the longer timescales associated with each decay (resulting from the much greater length of thecoal face as compared to that in the laboratory model) it was not possible to runsuch experiments in direct succession and so to accumulate and combine the resultssequentially. Rather, it was necessary to calculate K from single decays. Atypical such decay is shown in Figure 5.4, together with the theoretical curve(embodying the best-fit values of U and K respectively). The theoretical curveappears to represent the shape of the data quite well. Although the results overallexhibit a large spread when K* is plotted as function of ReF (see Figure 5.5),there does not appear to be any significant, systematic dependence of K* on ReF
in the range from 75,000 to 180,000. Qualitatively, this is consistent with whatwas found for the 1/10-scale model - also with the earlier experimental results ofKinsley and his co-workers. Here at full-scale, however, we were surprised tofind that the actual magnitude of K* was much greater; 1.25 as opposed to 0.42.
5.3 Experiments at full-scale at an underground coalface
In the underground experiments on an actual coalface, the stone dust tracer wasinjected at a point about 20 m along the face from the intake roadway.Measurements of the tracer (using the SIMSLIN optical detector) were performed atdownwind locations corresponding to longitudinal distances (X) of 50, 100, 150 and200 m respectively. A typical SIMSLIN trace is shown in Figure 5.6 where, itshould be noted, the time at which the tracer was released at the upstream pointwas marked manually (made possible by verbal contact between the operatives usingthe coalface inter-communication system).
21
The results for K* are shown in Figure 5.7. Since the windspeed on the coalfacewas beyond the control of the experimenters, it was not possible to plot K* as afunction of ReF. Here, ReF was approximately constant, of the order of 150,000.There is, however, a clear systematic - and unexpected - relationship between K*and X, with K* increasing as X increases. The actual magnitudes of K* whichrange from 1.1 to 5.6 are seen to be substantially greater than were found for thelaboratory 1/10-scale and surface full-scale models (0.42 and 1.25 respectively).
5.4 Discussion
The results of all three studies are plotted in Figure 5.8 in the form of K* versusface aspect ratio
("Longitudinal distanceAF - —
for various ReF. From this form of presentation it is clear that not only is K*(as determined experimentally) not constant for all ReF (contrary to what had beenexpected) but it is apparently not even uniquely defined by ReF. The strong -apparently linear - dependence of K* on AF is particularly surprising since there isno physical reason to suggest that turbulent diffusivity itself varies so systematicallyalong the length of the coalface.
To examine these results, it is necessary to consider the validity of Taylor's theoryupon which the experimental determinations of K* are based. How good is theassumption that the coalface, with its roof supports, etc., may be representedaerodynamically as a rough pipe (and hence that turbulent diffusion is thepredominant dispersion process)? One consequence of Taylor's theory is that thedispersion trace, as given by Equation (3.1), should become progressively lessasymmetric the further the tracer burst has travelled. From inspection of all thetraces obtained in the underground coalface study described above, this was foundto be clearly not the case. Indeed, the degree of asymmetry (as reflected in thelength of the 'tail' in each dispersion trace) actually increases for longer distancestravelled. This provides the first important clue that Taylor's theory may not beadequate for describing the dispersion traces we obtained.
A second clue comes from inspection of the values of mean wind speed (U) asobtained by fitting Equation (3.1) to the dispersion traces. It was found that Usystematically decreased as X increased. Clearly this is not realistic.
A third clue comes from consideration of the magnitude of K*. As far asturbulence is concerned, it may be estimated to a fair first approximation from thecharacteristic intensity (I) and longitudinal scale (C) of the turbulence in the airflowalong the face, using (Humphries and Vincent 1976)
K ~ C I U (5.4)
so that
K* ~ C I / D (5.5)
Since it is certain that Q. cannot exceed the characteristic dimension controlling thenature of the flow along the face (D ~ Dpjj) and estimating that I does not exceedof the order of 30% (based on measurements of turbulence in the model coalface
22
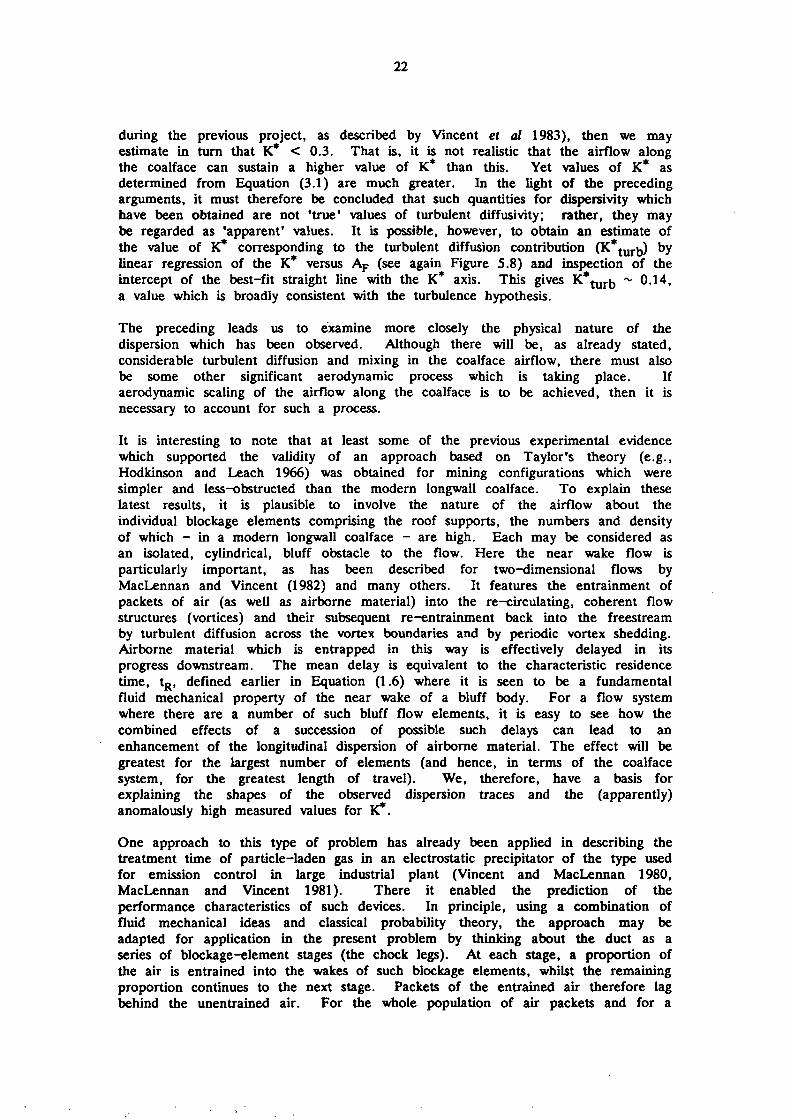
during the previous project, as described by Vincent el al 1983), then we mayestimate in turn that K* < 0.3. That is, it is not realistic that the airflow alongthe coalface can sustain a higher value of K* than this. Yet values of K* asdetermined from Equation (3.1) are much greater. In the light of the precedingarguments, it must therefore be concluded that such quantities for dispersivity whichhave been obtained are not 'true* values of turbulent diffusivity; rather, they maybe regarded as 'apparent' values. It is possible, however, to obtain an estimate ofthe value of K* corresponding to the turbulent diffusion contribution (K*turj.j) bylinear regression of the K* versus AF (see again Figure 5.8) and inspection of theintercept of the best-fit straight line with the K* axis. This gives K*turjj ~ 0.14,a value which is broadly consistent with the turbulence hypothesis.
The preceding leads us to examine more closely the physical nature of thedispersion which has been observed. Although there will be, as already stated,considerable turbulent diffusion and mixing in the coalface airflow, there must alsobe some other significant aerodynamic process which is taking place. Ifaerodynamic scaling of the airflow along the coalface is to be achieved, then it isnecessary to account for such a process.
It is interesting to note that at least some of the previous experimental evidencewhich supported the validity of an approach based on Taylor's theory (e.g.,Hodkinson and Leach 1966) was obtained for mining configurations which weresimpler and less-obstructed than the modern longwall coalface. To explain theselatest results, it is plausible to involve the nature of the airflow about theindividual blockage elements comprising the roof supports, the numbers and densityof which - in a modern longwall coalface - are high. Each may be considered asan isolated, cylindrical, bluff obstacle to the flow. Here the near wake flow isparticularly important, as has been described for two-dimensional flows byMacLennan and Vincent (1982) and many others. It features the entrainment ofpackets of air (as well as airborne material) into the re-circulating, coherent flowstructures (vortices) and their subsequent re-entrainment back into the freestreamby turbulent diffusion across the vortex boundaries and by periodic vortex shedding.Airborne material which is entrapped in this way is effectively delayed in itsprogress downstream. The mean delay is equivalent to the characteristic residencetime, tR) defined earlier in Equation (1.6) where it is seen to be a fundamentalfluid mechanical property of the near wake of a bluff body. For a flow systemwhere there are a number of such bluff flow elements, it is easy to see how thecombined effects of a succession of possible such delays can lead to anenhancement of the longitudinal dispersion of airborne material. The effect will begreatest for the largest number of elements (and hence, in terms of the coalfacesystem, for the greatest length of travel). We, therefore, have a basis forexplaining the shapes of the observed dispersion traces and the (apparently)anomalously high measured values for K*.
One approach to this type of problem has already been applied in describing thetreatment time of particle-laden gas in an electrostatic precipitator of the type usedfor emission control in large industrial plant (Vincent and MacLennan 1980,MacLennan and Vincent 1981). There it enabled the prediction of theperformance characteristics of such devices. In principle, using a combination offluid mechanical ideas and classical probability theory, the approach may beadapted for application in the present problem by thinking about the duct as aseries of blockage-element stages (the chock legs). At each stage, a proportion ofthe air is entrained into the wakes of such blockage elements, whilst the remainingproportion continues to the next stage. Packets of the entrained air therefore lagbehind the unentrained air. For the whole population of air packets and for a
23
succession of such blockage-element stages, there is a statistical distribution ofoverall delay times. However, to calculate this rigorously (especially if simultaneousturbulent diffusion is also to be taken into account) is a difficult theoreticalexercise which - although it will be subject of continued efforts - lies outside theimmediate scope of this report. For the present, it is sufficient to note that theeffect of the process indicated will be, qualitatively, to 'stretch* the 'tail' of thedispersion traces - and so to broaden the distribution of residence times - in theway which was observed experimentally.
One final aspect of the relationship between K* and K*turjj deserves mention. Ithas already been described how K involves the combined effects of both turbulentdiffusion and 'vortex-enhancement* contributions and that K* reduces to K*turbwhen the latter fall to zero. However, it should be noted that the K*turjj whichis obtained hi this way is still governed by the turbulence generated by theblockage elements. It is therefore not the same as the value which would beobtained if those blockage elements were to be removed.

24
25
6. MEASUREMENTS OF RESIDENCE TIME PARAMETER (H) FOR THE CUT
6.1 Laboratory experiments at 1/10-scale
The 1/10 scale model face arrangements for this part of the study were essentiallyidentical to that described for the measurments of diffusivity (as described inSection 5.1). That is, the single-drum shearer was cutting against the ventilation.In this configuration, a relatively-quiescent standing eddy is formed downwind ofthe shearer (as reported by Browning 1969). This is similar in principle to thewakes (or 'cavities') found in the lees of bluff bodies and downwind-facing steps,as described by many other workers.
The nature of the flow in such regions - including the ventilation rate of the floweddy - is well described in terms of the residence time of airborne materialreleased into the eddy. For a steady state concentration inside the eddy and itssource switched off at time t=0, ventilation is described (to a good approximationfor a wide range of types of flow) by an exponential decay curve whose timeconstant is tR. As described earlier in Chapter 3, this quantity, whennon-dimensionalised with respect to the characteristic freestream air velocity (U)and system dimension (D = DC) respectively, leads to
HC = U tR / Dc (6.1)
where Hc is a fluid mechanical bulk property of the transport processes in thenear wake (where the subscript C refers it specifically to the region of the cut)and is closely related to other near wake properties (such as base pressurecoefficient, etc.). In previous experiments to investigate H, it has been found tobe relatively independent of Re over very wide ranges (> 2,000) and of theposition at which tracer was either released or being measured within the cavity.
In the present study, in the experiments to investigate ventilation in the cuttingzone, it was decided not to inject tracer smoke directly into the eddy since it wasthought that the addition of up to 2 1/min of excess ah* might influence thestability of the standing eddy. Instead, therefore, smoke was injected into the'freestream1 coalface flow upwind of the shearer, enabling some to enter the eddyby turbulent diffusion. Once a steady concentration had been achieved in thecavity, the smoke supply was interrupted and the subsequent decay measured usingthe same laser detection system as for the dispersion studies. Here, the detectionpoint was located 3 cm downwind of the shearer, 3 cm in from the face wall at aheight of 9 cm. As expected from the large amount of previous experience, thedecays exhibited good single exponential behaviour which allowed us to evaluate tR,and hence Hc, directly. From 50 to 100 individual such decay curves werecombined (in much the same way as for the dispersion traces described in Chapter5) before this evaluation was performed. A typical composite decay is shown inFigure 6.1.
At this stage, it was necessary to define an appropriate measure of U since, inthis case - unlike that for the dispersion traces - it could not be estimated fromthe decay curve itself. Furthermore, for the coalface, the 'freestream1 is notstrictly described by a single velocity, since the velocity varies considerably over theflow cross-section. To overcome these difficulties, it was decided to use values forU obtained from the bulk volumetric flowrate of air through the system and theunblocked cross-sectional area of the coalface immediately behind the shearer. For
26
this purpose, the volumetric flowrate was determined from velocity distributionmeasurements (using hot-wire anemometry) in the return roadway and integratingaccordingly. In practice, once this procedure had been calibrated, it was possible toobtain the required value of U from a single, fixed-point measurement of velocityin the return roadway using a pilot-static tube. During the actual experiments, theoutput from the micromanometer used with this instrument was logged directly intothe computer. The range of mean face velocites investigated was from 1.4 to 6.9m/s, equivalent to a range of Reynolds' number for the cut (Re^ from 5,500 to28,000 where here, as in the calculation of Hc, Dc is taken to be the depth ofthe cut ( = 6 cm).
The results are shown in Figure 6.2 in the form of Hc versus Rec. It is seenthat, somewhat surprisingly, HC is not independent of Rec, even for Rec exceedingabout 2000. Instead, Hc is seen to be a steadily falling function of Rec as Rec
increases over the whole range of the experiment. Once again, as in thepreceding chapter, such an unexpected result requires some fluid mechanicalexplanation if measurements of this type are to be used as the basis for derivingrelationships for scaling between small and large systems. This time, a clue to theobserved behaviour lies in the complex shape of the flow boundaries hi the cuttingzone. Here the role played by the main shearer body just upstream of the cut isparticularly important. As the flow approaches the cutting drum, the boundary layerover the surface of the main shearer body develops in much the same way as itwould over a flat plate (see Schlichting 1968). That is, it grows in thickness andbecomes increasingly turbulent, the rate of growth - and hence the level ofturbulence - increasing with the windspeed and system dimension. The higher thelevel of turbulence in the shear layers enclosing the near wake region of the cut(at the cutting drum end of the shearer), then the greater the rate of ventilationof that region by turbulent diffusion and so the smaller the value of HC. Thuswe may explain the observed steady decline in Hc as Rec increases for the presentcase (in contrast to what had previously been found in other studies reported byVincent and co-workers for other types of flow cavity where the boundary layereffect was absent). Eventually, it is expected that a situation wll be reachedwhere the boundary layer can develop no further and so no further increase inturbulence levels can take place. This will occur if Re becomes large enough,either by increasing the velocity or by increasing the dimensional scale of thesystem. When this stage is reached, then the decline in Hc should cease and itshould level off to some constant value. Clearly in the experiments just described,this point was not reached.
6.2 Experiments at full-scale in the surface facility
From the preceding argument, decay values associated with the shearer cavity arelikely to be affected by the shape of the shearer. For this reason it wasimportant that the shearer in the surface model coalface at Lound Hall should bean accurate representation of that which was used in the scale model study. Wetherefore constructed a full scale replica of the latter from metal framing, coveredin brattice cloth. A cable drum which was used to simulate the shearer drum.This is shown in place in Figure 6.3. This photograph also shows the detectorsystem which, in this case, had to be mounted within the wake itself. The actualdetection position was 0.2 m behind the drum, 0.38 m in from the face at aheight of 0.6 m. The laser detection system was set further down the face,isolated from the aerodynamic region of interest. All other face features werebroadly similar to those described in Section 5.2.
27
The mean air velocity was assessed from measurement of the bulk volumetric flowand the effective face cross-sectional area, essentially the same approach as thatadopted for the small-scale model but with the flow in this case measured using ahand-held vane-type anemometer. Bulk flowrates were measured at the intakeface entry and in the return roadway for both ventilation levels (single fan and twofans). For each set of runs, these flowrates were referred (for calibrationpurposes) to velocities measured in the centre of the return roadway. The twovalues of U corresponding to the one- and two-fan modes of operation of thefacility were 4.5 and 9 m/s, giving Rec values of 50,000 and 94,000 respectively.
One discrepancy does deserve mention. It was noted that there was a differencebetween the intake and return volumetric flows, the return being some 15% higherfor both ventilation levels. This was attributed to leakage on the face which, inthe absence of any obvious holes was assumed to be linearly distributed along theface. With this in mind, the final bulk flow was calculated from the mean ofthese two results. Later, during studies of heading ventilation (see Chapter 7), itwas considered more appropriate to base velocity measurement on just the returnroadway bulk flow measurement.
As before in this facility, the scale of the experiment was again such that is wasimpracticable to perform successive repeating and overlaying of results. Instead,therefore, single decays were collected. They were so noisy, however, that theyhad to be batched in groups of 5 or 10 before analysis was performed, hence therelative paucity of results for these particular tests. A typical 'batched' decay isshown in Figure 6.4. Two values of Hc were obtained corresponding to the twoRec~values referred to. These are plotted hi Figure 6.2 alongside the earlierresults from the 1/10-scale model study. It is seen that there is little difference inthese last two Hc-values, but that they are both substantially lower than the onesobtained for the 1/10-scale model.
6.3 Discussion
The overall picture of how Hc varies with Rec may be be viewed in the light ofthe earlier argument about the behaviour of HC for this particular flow system andthe effect of the presence of the machine housing. From this, although there isno overlap between the ranges of Rec covered by the two sets of data, it isnonetheless reasonable to infer that the data from the 1/10-scale and full-scalesystems respectively may be described in terms of a single function, Hc = f(Reo).Thus the empirical expression
HC = 23 { 1 - 0.85 exp (- 17500 / Rec) } (6.3)
is a fair working model for scaling purposes (to which we shall return later). Thisis the curve shown alongside the data in Figure 6.2.
The nature of the flow near the shearer has already been discussed in broadterms. A more detailed examination of the 1/10-scale model system (by flowvisualisation under intense slit illumination during smoke tracer injection) revealedsome further interesting features. In particular, it was found that the shearer wakeflow consists of a 'double-wake' system, one wake behind the shearer body andthe other behind the cutting drum. Their lengths (in the downwind direction) wereapproximately 6 and 27 cm respectively, relatively independent of freestreamvelocity. No doubt there will be interaction between these two eddies which wouldeffect Hc, but the extent of this cannot be determined from such experiments. In
28
experiments where the shearer body was removed from the system, the drum wakewas reduced to 22 cm in length and appeared to be somewhat more dependent onfreestream velocity.
29
7. MEASUREMENTS OF RESIDENCE TIME PARAMETER (H) FORHEADINGS
7.1 Laboratory experiments at 1/10-scale
This section describes a number of complementary investigations. These includemeasurements of H in idealised headings (both intake and return), and includeenquiries into the effects of smoke tracer input position and detection position.The studies also involved some specific investigations at small-scale which relateddirectly to the full-scale model at the Lound Hall surface facility. For simplicity atthis stage, none of these systems incorporated auxiliary ventilation.
In order to determine H for the heading (say HH) from measurements of residencetime, we chose as the characteristic heading dimension the equivalent 'hydraulic1
diameter of the heading as defined earlier by Equation (5.2). Thus for all themodel headings, D^ = 0.32 m. To obtain a value for Re (say ReH) relevant tothe aerodynamic transport of material out of the heading! (and hence back into themain coalface airflow), the mean air velocity across the intake or exit to the face- as measured by the bulk volumetric flow and the coalface equivalent 'hydraulic'diameter (Dpi, = 0.157m) - was used.
7.1.1 General heading experiments
Consider first the effect of smoke input position. To do this, values of HH wereobtained from a number of experiments for smoke injection at a 'standard' position(taken to be at the end of the heading, near to its base at a point one third infrom the face side) and compared with those obtained from other smoke inputpositions. This was done both for intake and return headings. As seen in Figure7.1, there is clearly no effect. A similar exercise was carried out in order toexamine the effect of detection position. In this case, the 'standard* detectionposition was chosen to be halfway along the heading, in the centre of the headingat a height of 0.09 m. Again, this time from the results shown in Figure 7.2,there is no effect. These two results are consistent with the earlier findings ofVincent and co-workers, on other, related flow systems, and enable the use of theresults for different smoke or sampler positions interchangably.
From these two sets of preliminary results, it is obvious that a wide range ofvalues of HH could be obtained. We therefore set out to consider the possible keyfactors. The most obvious was the heading length (Ljj). This was examinedexperimentally for both intake and return headings for a range of LH and for ReH
varying from about 15,000 to 90,000. The headings for these experiments wereidealised and were empty of the sort of equipment which would be found in anactual heading. The results are given for both headings in Figure 7.3, where HH
is plotted as a function of the heading aspect ratio
AH = In / Dm (7.1)
Both show clear, similar trends with HH increasing steadily with LJJ. There is noclear systematic variations with ReH. To a fair first approximation, they followsimple relationships which, from linear regression, may be represented by
30
In H^ = 0.83 A^ + 2.22 (7.2)
In HH^ = 0.89 A^et + 0.95 (7.3)
independently of ReH, where the subscripts 'in' and 'ret' refer to the intake andreturn headings respectively.
It is noted here that, although the slopes of the relationships in Equations (7.2)and (7.3) are approximately the same, the magnitude of HH is generally less forthe return than for the intake heading. This is reasonable since, at the return endof the face, the air leaves the face (and so enters the return roadway) in the formof a turbulent jet. The degree of mixing at the return end of the face willtherefore be greater than at the intake end. This means in general that, for agiven volumetric flowrate of main air (and without auxiliary ventilation), the returnheading ventilates more effectively than the intake heading.
7.1.2 Model studies to simulate the Lound Hall return heading.
In these studies, the model was re-arranged to simulate the layout of the headingat Lound Hall which, although its specific arrangement would be unlikely to befound in a real mining environment, neverthless contained many of the featureswhich would be found there. The arrangement is shown in Figure 7.4. Thelongwall coalface was set up in the retreating mode, with just a short returnheading of length (LH) 0.31 m and aspect ratio (AH) 0.97. A 'pack' waspositioned in the waste which had the effect of reducing the area of the returnface end. The heading end contained a step of height ~0.1 m and depth ~ 0.1m. It also contained the end of a conveyer plus its motor, a main roof support,a bridge and several minor supports.
The tracer smoke was injected into the air on the face itself (beside the pack) andallowed to bleed into the heading. The detection position was located at a pointcorresponding to a central position (with respect to width, length and depth) in theheading. HH was determined for a range of ReH up to ~ 84,000. The resultsare shown in Figure 7.5, along with some results for an empty heading withcomparable aspect ratio. It is seen immediately that values of HH for theequipped heading are much higher than for the empty one of equivalent length.This is because, due to the equipment residing inside the heading, the overall rateof ventilation was deduced by the aerodynamic entrapment of air in flow cavitiesassociated with the presence of such equipment.
7.2 Experiments on the Lound Hall surface facility at full-scale
The experimental parameters for this part of the work were set in order toachieve (as far as possible) geometrical similarity in relation to the small-scalemodel study. Thus the layout was the same as that described in the precedingsection. So too were the relative locations of the smoke input and detectionsystems. The experimental rig was essentially the same as that shown in Figure7.4.
As described in Chapter 6, two levels of ventilation only were again possible, usingthe two-fan arrangment. On this basis, the values of ReH for the heading(equivalent to those for the model in the preceding section) were about 118,000and 231,000 respectively.
31
As before, it was necessary to 'batch1 the decay traces in groups of 5 or 10(because of the high levels of noise associated with individual decays). As aresult, relatively few results were obtained. Those for the lower windspeed areeven scarcer due to the long timescales required for these experiments. Theresults for HH are plotted as a function of ReH in Figure 7.5 alongside the onesfor the corresponding small-scale model. Those for the higher ReH (correspondingto both fans operating) are in good agreement with the trend exhibited by theresults for the small-scale model. However, those for the lower ReH (just one fanoperating) is markedly lower. It is felt that the trend of the combined small-scaleresults and full-scale results for higher ReH is the more likely. The trend in HH
for the full-scale system between low and higher ReH is not plausible in the lightof any previous experience in this or any other sort of flow system. Possibly theoutlying data had been influenced by modifications in the airflow distributionassociated with the use of only one fan for those particular runs. The mostreasonable conclusion from this work taken overall, is that HH is independent ofReH. Perhaps at this stage, however, it should be regarded as preliminary untilfurther studies have been carried out to confirm it (or otherwise).

32
\
33
8. GENERALISATIONS FROM THE RESEARCH SO FAR
The generalisations from this work fall into two main categories. In the first,there are scientific conclusions arising directly out of the research itself and thephysical interpretation of what was observed. In the second, and perhaps mostimportantly in the light of the initial objectives, there are the practical scalingrelationships which have been developed for describing how what is observed insmall-scale model studies can be applied to solving ventilation problems infull-scale mining systems. In addition, we have the development of methodologyby which such practical studies might be carried out in the future.
8.1 Conclusions from the research
From the study described above, we may draw together the following mainconclusions :-
1) The dimensionless quantity K*, the longitudinal dispersivity, is a usefulproperty for describing the nature of the bulk flow of air and airbornematerial (e.g., methane gas) along the coal face. It relates to the dispersionof 'bursts' of concentration as they are transported along the face. In thecase of methane, K* (together with other measurable properties of the face)can provide information about the instantaneous concentration which mightoccur at any place on the face due to the release of a 'burst1 of definedstrength at some upstream location.
2) The dimensionless quantity H is a useful property for describing the nature ofthe aerodynamic ventilation of regions of partially-enclosed flow (e.g., wakesand cavities). It relates to the processes by which material trapped in suchregions is mixed back into the main mine airflow. From knowledge of Htogether with knowledge of the rate at which material (e.g., methane gas) isbeing released into the cavity, the steady state concentration which builds upin the cavity may be obtained. In the case of methane, it is an index bywhich the effectiveness of practical measures for local ventilation control maybe assessed.
3) For the airflow along the coal face, the dispersivity (the dimensionlessquantity, K*) is independent of Reynolds' number (ReF) for a given modelarrangement. However, the results suggest a substantial, monotonic increase inK* with length of coalface traversed (X). Neither this nor the apparentlylarge magnitudes of the values of K* obtained are sustainable by physicalarguments involving turbulent diffusion alone. Therefore it is concluded thatTaylor's dispersion model based on pure turbulent diffusivity is not appropriatefor describing dispersion of airborne material along the coal face. The 'true'value of K* (K*turj,) for turbulent diffusivity, however, may be obtained byextrapolating the data for K* versus ReF back to ReF = 0. This leads tothe estimate K*turjj=0.14, which is broadly consistent with estimates based onmeasurements of turbulence intensity and length scale in the coalface model(Vincent et al 1983).

34
4) A likely alternative to the Taylor theory is that most of the dispersion derivesfrom the entrapment and slow release of material into standing eddies in thewakes of the many flow obstacles which are found along a modern longwallcoalface. This can account for the observed trends. It follows that, forscaling dispersion in coalface flows between small and large-scale systems, thenature of the wake flows in question is the property that should be preserved.From all that is known about such flows, this means that Re for the flowabout each blockage element should not be less than about 2,000. Here,processes governing near wake ventilation processes (e.g., turbulent diffusionand vortex shedding) retain similarity.
5) For the cut, the ventilation parameter (H^ is independent of Rec only forRec> 50,000. At lower Rec, Hc decreases as Rec increases. This limit ismuch higher than that found by other workers for other flow systems andmay well be a consequence of the much more complex airflow here inparticular boundary layer effects at the main shearer body upwind of theshearer drum itself.
6) For empty headings, the ventilation parameter (HH) increases linearly withheading aspect ratio (AH) and is less for the return than for the intakeheading. This is due to the jet effect of the airflow leaving the coalface atthe return end. For both headings, HH is relatively independent of ReH.
7) For short, equipped headings without auxiliary ventilation, HH seems to beindependent of ReH (although the presence of some outlying data suggeststhat, at some stage, this conclusion needs to be examined further).
8) Measurements of ventilation parameter for both the cut and for the headingsare independent of the positions within the cavity of either the tracer input ordetector.
8.2 Scaling relationships
In this study, much has been learned about the nature of the ventilation airflowspertaining to modern coalmines. The better understanding which has been gainedwill be of general value to ventilation engineers. The main importance of thework, however, is in relation to the scaling relationships which exist between whathappens in the small-scale models in the laboratory and what happens atfull-scale.
From the results of the present research, taken in the light of the earlier findingsof Hinsley and his colleagues for coalmines and of other workers for other types offlow system, the following set of simple scaling guidelines may be proposed:-
1) For the main airflow along the coalface, dispersion processes may be scaleddirectly provided that:-
* ReF for the coalface airflow exceeds 15,000.
* Re for the airflow about chock legs, etc. exceeds 2000.
Both of these criteria lead to the condition that, for a 1/10-scale model,mean wind speed along the coalface should not be less than about 2 m/s.
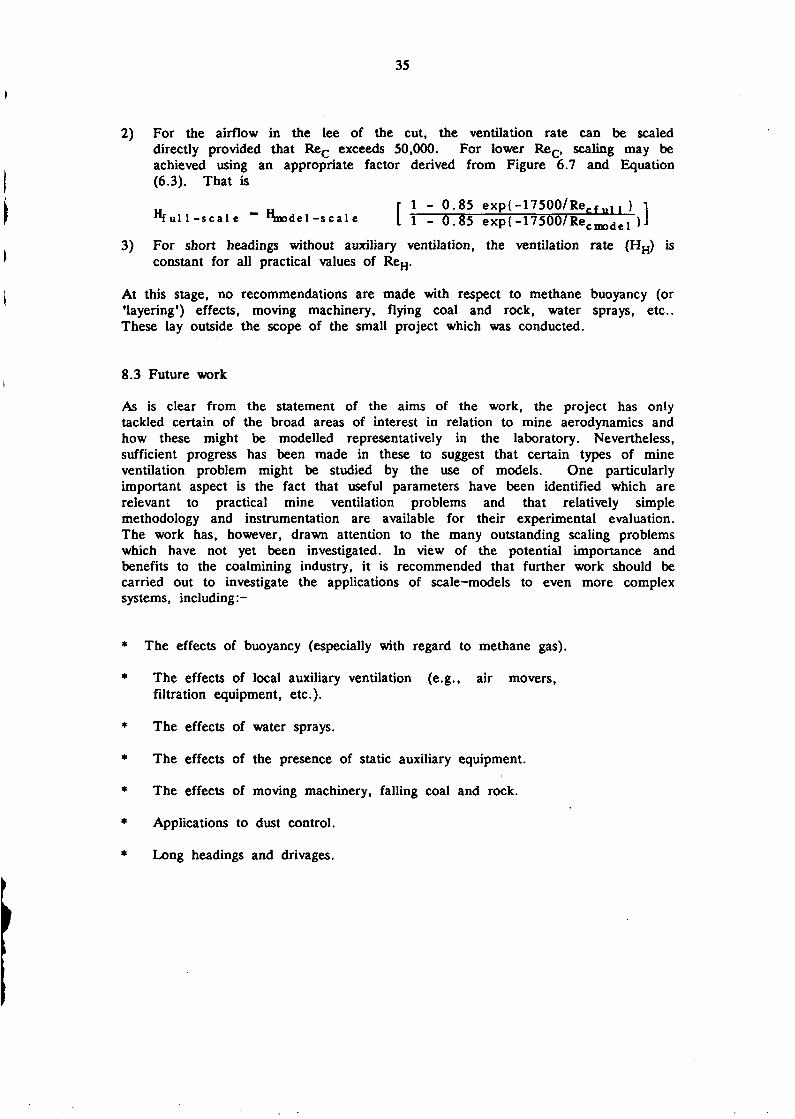
35
2) For the airflow in the lee of the cut, the ventilation rate can be scaleddirectly provided that Rec exceeds 50,000. For lower Rec, scaling may beachieved using an appropriate factor derived from Figure 6.7 and Equation(6.3). That is
r 1 - 0.85 exP{-17SOO/Rec fu11 } i" f u l l - s c a l e ^del-scale [ 1 - 0.85 exp{-175007 Rec|no<lel }J
3) For short headings without auxiliary ventilation, the ventilation rate (HH) isconstant for all practical values of ReH.
At this stage, no recommendations are made with respect to methane buoyancy (or'layering') effects, moving machinery, flying coal and rock, water sprays, etc..These lay outside the scope of the small project which was conducted.
8.3 Future work
As is clear from the statement of the aims of the work, the project has onlytackled certain of the broad areas of interest in relation to mine aerodynamics andhow these might be modelled representatively in the laboratory. Nevertheless,sufficient progress has been made in these to suggest that certain types of mineventilation problem might be studied by the use of models. One particularlyimportant aspect is the fact that useful parameters have been identified which arerelevant to practical mine ventilation problems and that relatively simplemethodology and instrumentation are available for their experimental evaluation.The work has, however, drawn attention to the many outstanding scaling problemswhich have not yet been investigated. In view of the potential importance andbenefits to the coalmining industry, it is recommended that further work should becarried out to investigate the applications of scale-models to even more complexsystems, including:-
* The effects of buoyancy (especially with regard to methane gas).
* The effects of local auxiliary ventilation (e.g., air movers,filtration equipment, etc.).
* The effects of water sprays.
* The effects of the presence of static auxiliary equipment.
* The effects of moving machinery, falling coal and rock.
* Applications to dust control.
* Long headings and drivages.
36
1
37
ACKNOWLEDGEMENTS
The authors wish to thank the Commission of European Communities and BritishCoal Corporation for their financial support of the work described in this report.The generous assistance and cooperation of the Manager and his staff at BritishCoal's Lound Hall Training Centre in connection with the full-scale surface modelstudies is also gratefully acknowledged; so too is the help provided by theManager and his staff at the colliery in carrying out the underground studies. Ourthanks are also due to the many colleagues at the Institute of OccupationalMedicine who assisted in this work, and staff at British Coal's HeadquartersTechnical Department who encouraged us prior to and during its conduct.
38
39
REFERENCES
AIREY EM. (1968). Diffusion of firedamp in mine airways. Report No. 2324.Isle worth: Mining Research Establishment.
BARRY PJ. (1964). Estimation of downwind concentration of airborne effluentsdischarged in the neighbourhood of buildings. Report No. AECL-2043. AtomicEnergy of Canada limited.
BROWNING EJ. (1969). Preliminary studies to reduce the explosion hazardaround a1 shearer power loader. Mining Engineer; No. 100: 225-226.
COOKE WE, STATHAM ICF. (1926/1927). Experiments on the flow of air inducts (Fifth report of the Midland Institute Committee on the ventilation of mines).Transactions of the Institution of mining Engineers; 73: 78-103.
DOEBEL1N E. (1966). Measurement Systems: Application and Design. New York:MrGraw-Hill.
DRIVA& PJ, SHAIR FH. (1974). Probing the air flow within the wake downwindof a building by means of a tracer technique. Atmospheric Environment; 8:1165-li75.
FLETCHER B. (1977). Dispersion of contamination on model coal faces. CollieryGuardian; December 1977:892-895.
HARLEY A. (1964). The ventilation of stable holes. Mining Engineer; November1964: 97-117.
HODKINSON JR, LEACH SJ. (1957/1958). The longitudinal dispersion of pulses ofrespirable dust and gas in ventilated mine workings, studied by a radioactive traceetechnique. Transactions of the Institution of Mining Engineers; 117: 684-701.
HUMPHRIES W, VINCENT JH. (1976). An experimental investigation of thedetention of airborne smoke in the wake bubble behind a disc. Journal of FluidMechanics; 73: 453-463.
JONES C, CLARKE IE. (1965). The ventilation of stable holes, face ends andripping lips by air jets. Mining Engineer; August 1965: 660-675.
JONES JD, KINSLEY FB. (1958/1959). The use of models in the prediction ofmine airway resistance. Transactions of the Institution of Mining Engineers; 118:723-733.
KISSELL FN, BEILICKI RJ. (1974). Ventilation eddy zones at a model coal mineworking face. Bureau of Mines Report of Investigations RI 7991. US Department ofthe Interior.
McKINLAY KW. (1974). The effects on dust dispersion from shearer drums ofusing various air-to-water ratios through a hollow shaft ventilator. Report No. 50.Bretby: Mining Research and Development Establishment.
40
MacLENNAN ASM, VINCENT JH. (1981). Particle motion in electrostaticprecipitators. Gasborne Particles. Papers from the Conference held in Oxford, June30-July 1, 1981. Bury St. Edmunds: Institution of Mechanical Engineers. 111-116.
MacLENNAN ASM, VINCENT JH. (1982). Transport in the near aerodynamicwakes of flat plates. Journal of Fluid Mechanics; 120: 185-197.
MILLER W, BRYAN AM. (1937/1938). The effect of standing tubs on theresistance of mine airways by tests on models. Transactions of the Institution ofMining Engineers; 95: 413-425.
NIKURADSE J. (1933). Stromungsgesetze in rauhen Rohren. Forsch. Arb.Ing.-Wes. No. 361.
RENNER K, REINHARDT M. (1973). Investigations in a coalface model about theoptimum dust extraction from drum-type shearer loaders. SilikoseberichtNordrhein-Westfalen. Band 9: 35-43.
ROSHKO A. (1954). On the development of turbulent wakes from vortex streets.Report 1191. Washington: National Advisory Committee for Aeronautics.
SALES TJR, KINSLEY FB. (1951/1952). The use of models in the study ofair-flow in mines. Transactions of the Institution of Mining Engineers; 111:773-791.
SCHLICHTING H. (1968). Boundary Layer Theory. New York: McGraw-Hill.
SMITH CM. (1935). The resistance of mine timbers to the flow of air, asdetermined by models. Unversity of Illinois Engineering Experiment Station, BulletinNo. 279. Urbana: University of Illinois.
STEIN RL, BRESLIN JA, STRAZISAR AJ. (1974). Investigation of dust controlusing a scale model. American Industrial Hygiene Association Journal; 35: 815-824.
TAYLOR GI. (1954). the dispersion of matter in turbulent flow through a pipe.Proceedings of the Royal Society of London; A223: 446-468.
VINCENT JH. (1977). Model experiments on the nature of air pollution transportnear buildings. Atmospheric Environment; 11: 765-774.
VINCENT JH. (1978). Scalar transport in the near aerodynamic wakes ofsurface-mounted cubes. Atmospheric Environment; 12: 1319-1322.
VINCENT JH, MacLENNAN ASM. (1980). Aerodynamic considerations inelectrostatic precipitation. Journal of Electrostatics; 8: 325-342.
VINCENT JH, MARK D, GIBSON H, BOTHAM RA, EMMET PC,WITHERSPOON WA, ATTKEN RJ, JONES CO, MILLER B. (1983). Measurementof inhalable dust in wind conditions pertaining to mines. Final Report on CECcontract 7256-21/029/08. Edinburgh: Institute of Occupational Medicine (IOMReport No. TM/83/7).
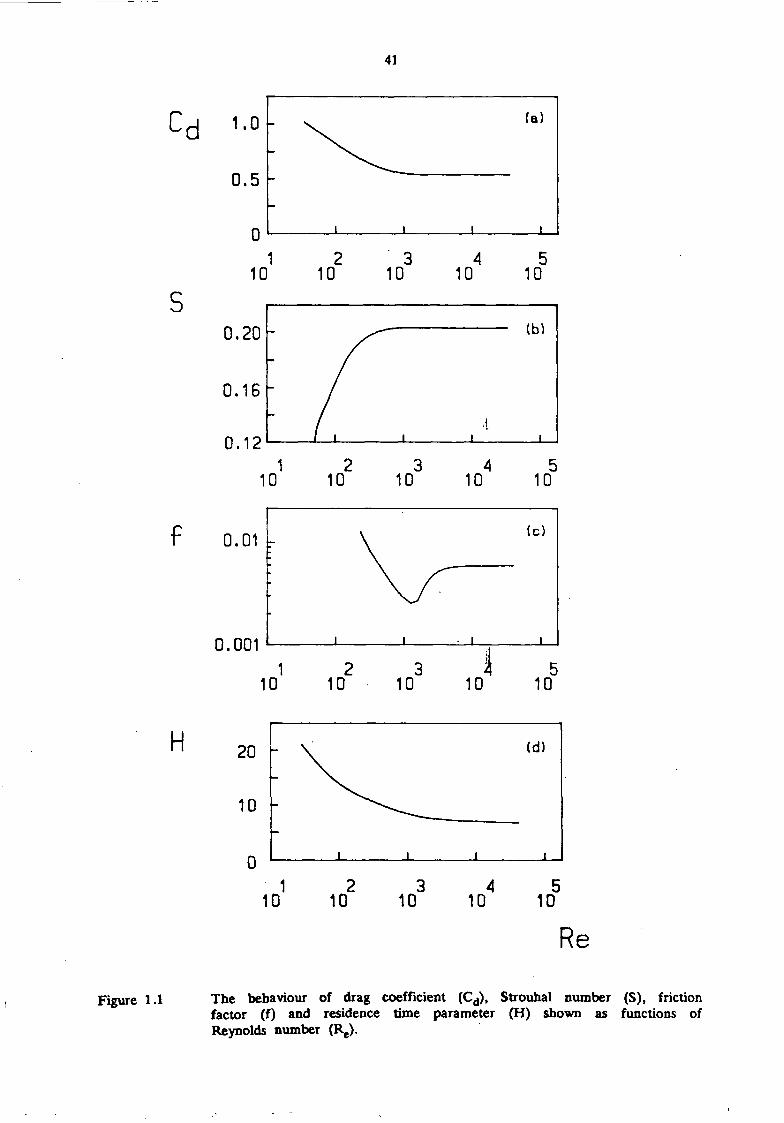
41
Cd 1.0 (a)
0.5
10 10 10 10 10
0.20 (b)
0.16
0.121 2 3 4 5
10 10 10 10 10
f 0.01
0.001
10 10 10 10
(c)
10
H 20
10
0
10 10 10 10
(d)
10
Re
Figure 1.1 The behaviour of drag coefficient (Cd), Strouhal number (S), frictionfactor (f) and residence time parameter (H) shown as functions ofReynolds number
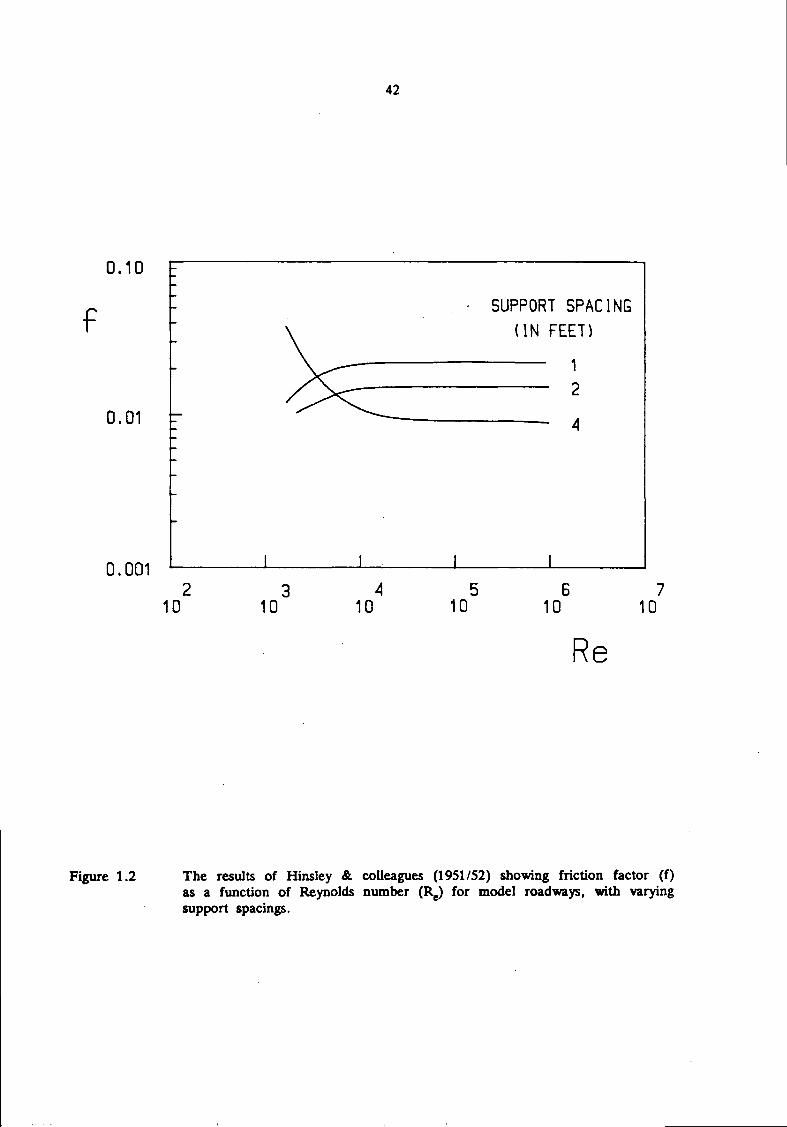
42
0.10
f
0.01
SUPPORT SPACING
(IN FEET)
0.001
10 10 10 10
1
2
10 10
Re
Figure 1.2 The results of Kinsley & colleagues (1951/52) showing friction factor (f)as a function of Reynolds number (R^ for model roadways, with varyingsupport spacings.
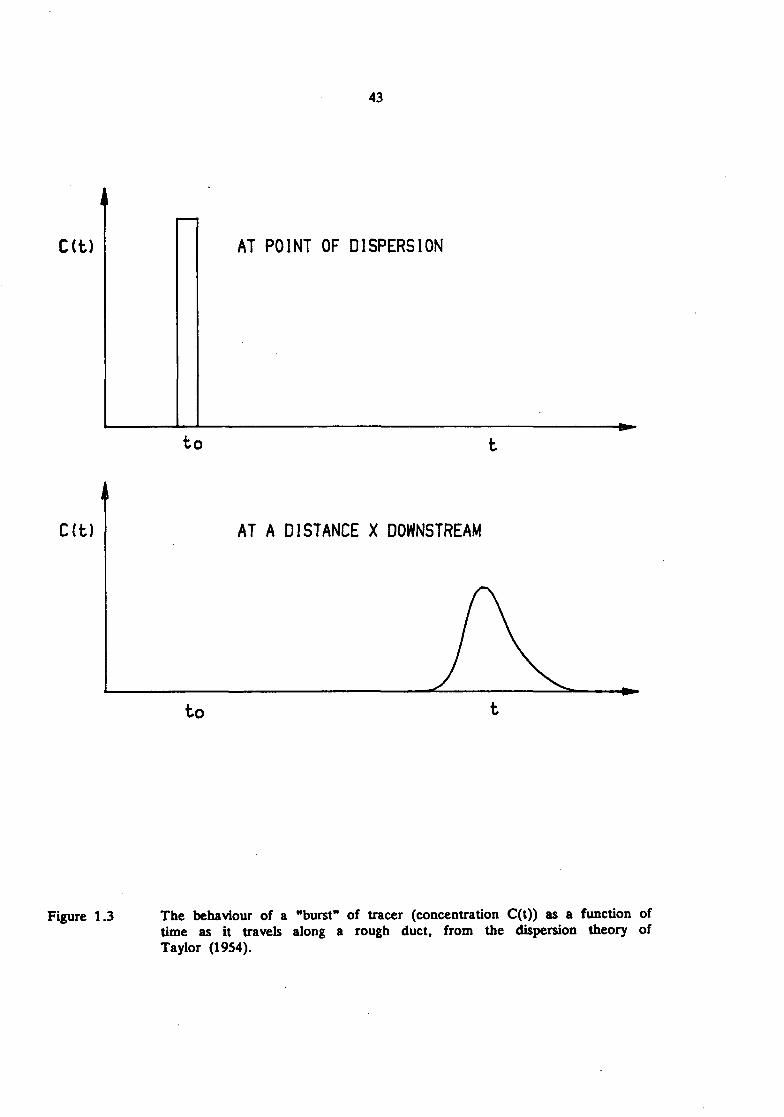
43
C(t) AT POINT OF DISPERSION
to
C(t) AT A DISTANCE X DOWNSTREAM
to
Figure 1.3 The behaviour of a "burst" of tracer (concentration C(t)) as a function oftime as it travels along a rough duct, from the dispersion theory ofTaylor (1954).
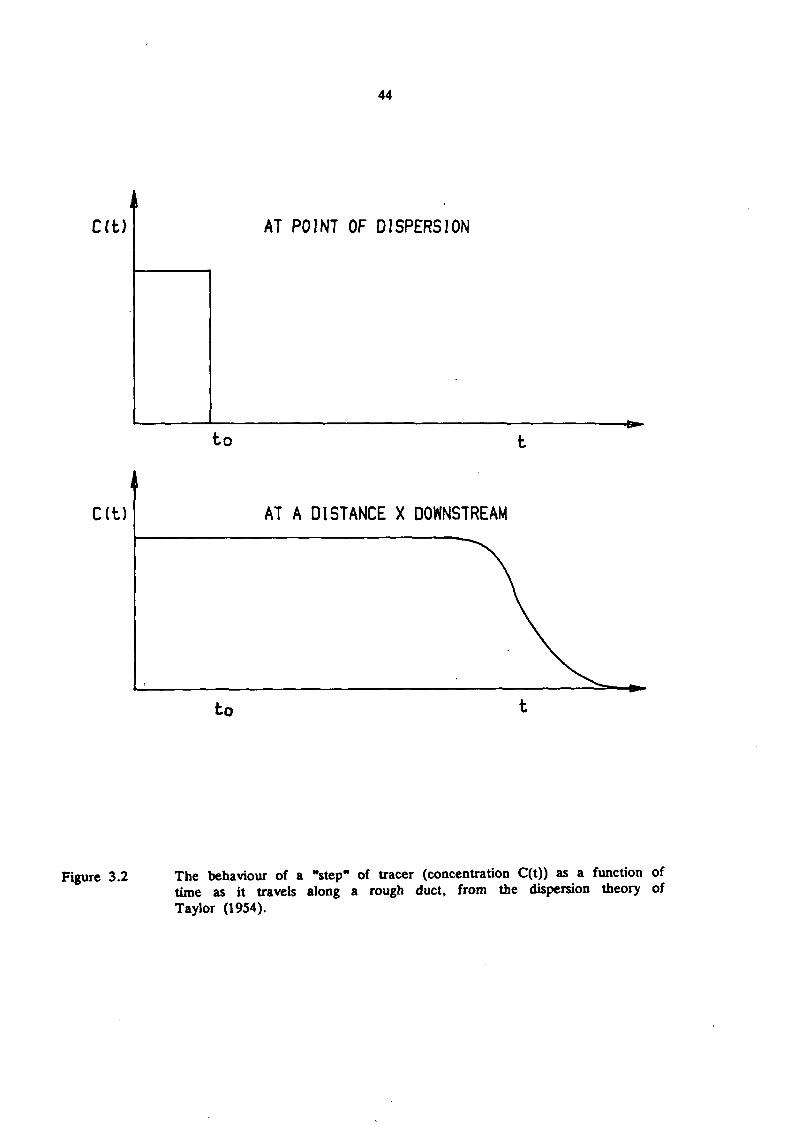
44
C(t) t AT POINT OF DISPERSION
to
C(t) AT A DISTANCE X DOWNSTREAM
to
Figure 3.2 The behaviour of a "step" of tracer (concentration C(t)) as a function oftime as it travels along a rough duct, from the dispersion theory ofTaylor (1954).
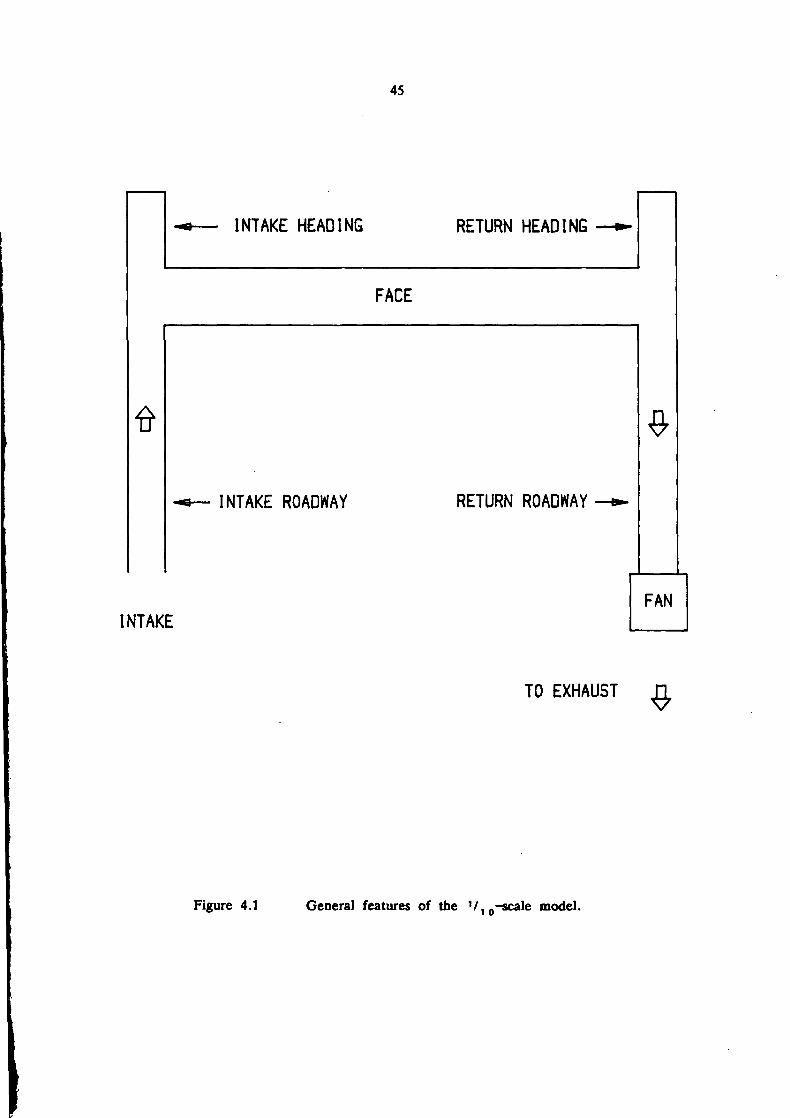
45
INTAKE HEADING RETURN HEADING
FACE
INTAKE ROADWAY RETURN ROADWAY
INTAKE
TO EXHAUST
Figure 4.1 General features of the '/10-scale model.
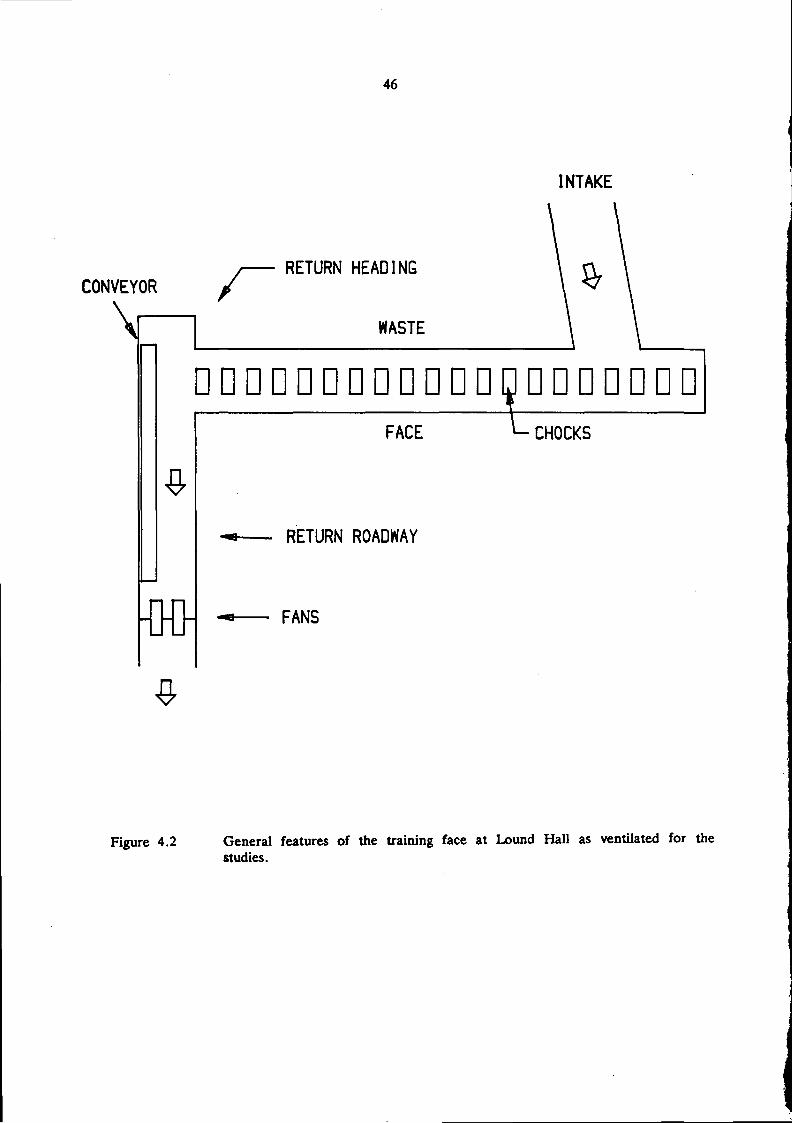
46
INTAKE
CONVEYORRETURN HEADING
WASTE
D D D D D D D D D D D D D
m
FACE CHOCKS
RETURN ROADWAY
FANS
Figure 4.2 General features of the training face at Lound Hall as ventilated for thestudies.
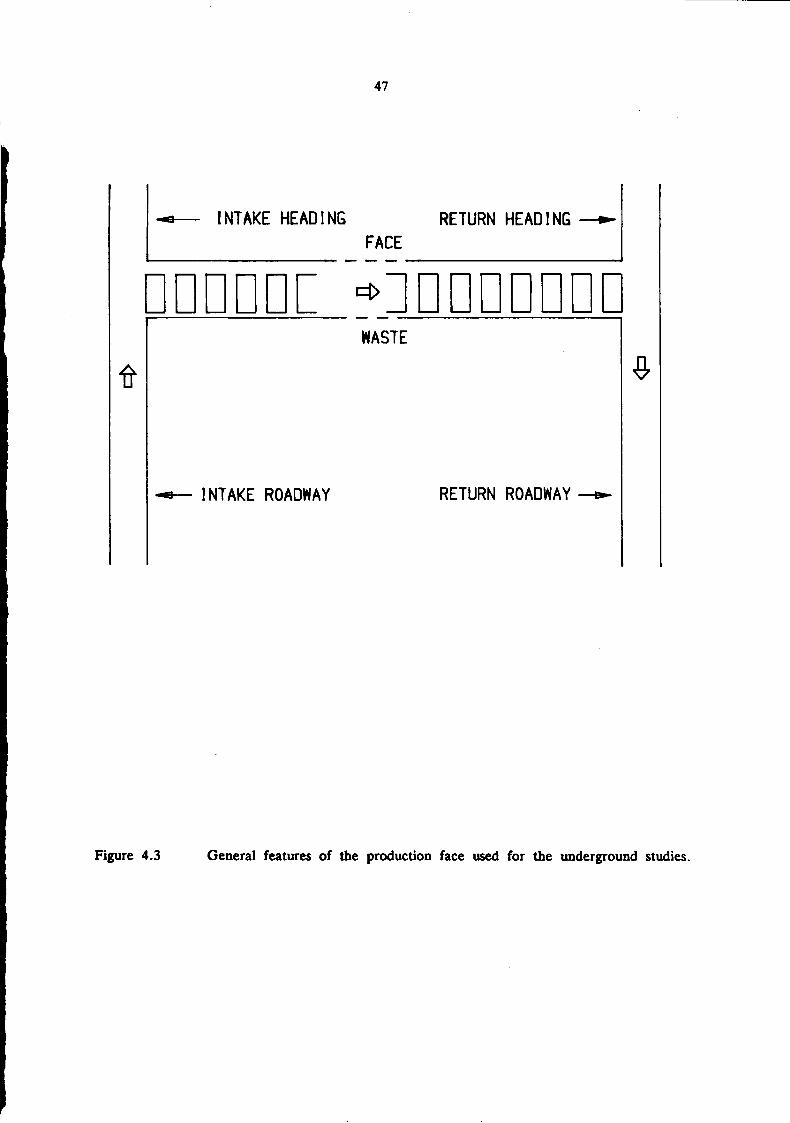
47
INTAKE HEADING RETURN HEADINGFACE
3DDDDC *:DDDDDDDWASTE
INTAKE ROADWAY RETURN ROADWAY
Figure 4.3 General features of the production face used for the underground studies.
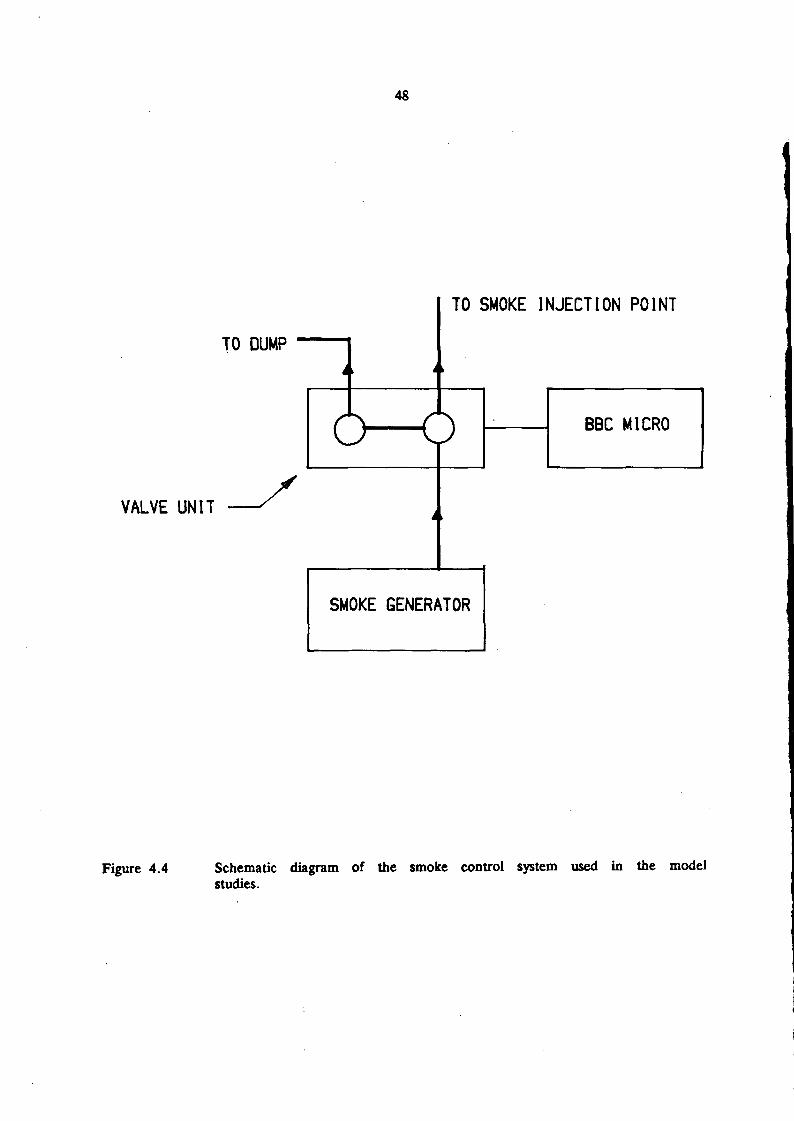
48
TO DUMP
TO SMOKE INJECTION POINT
VALVE UNIT
BBC MICRO
SMOKE GENERATOR
Figure 4.4 Schematic diagram of the smoke control system used in the modelstudies.
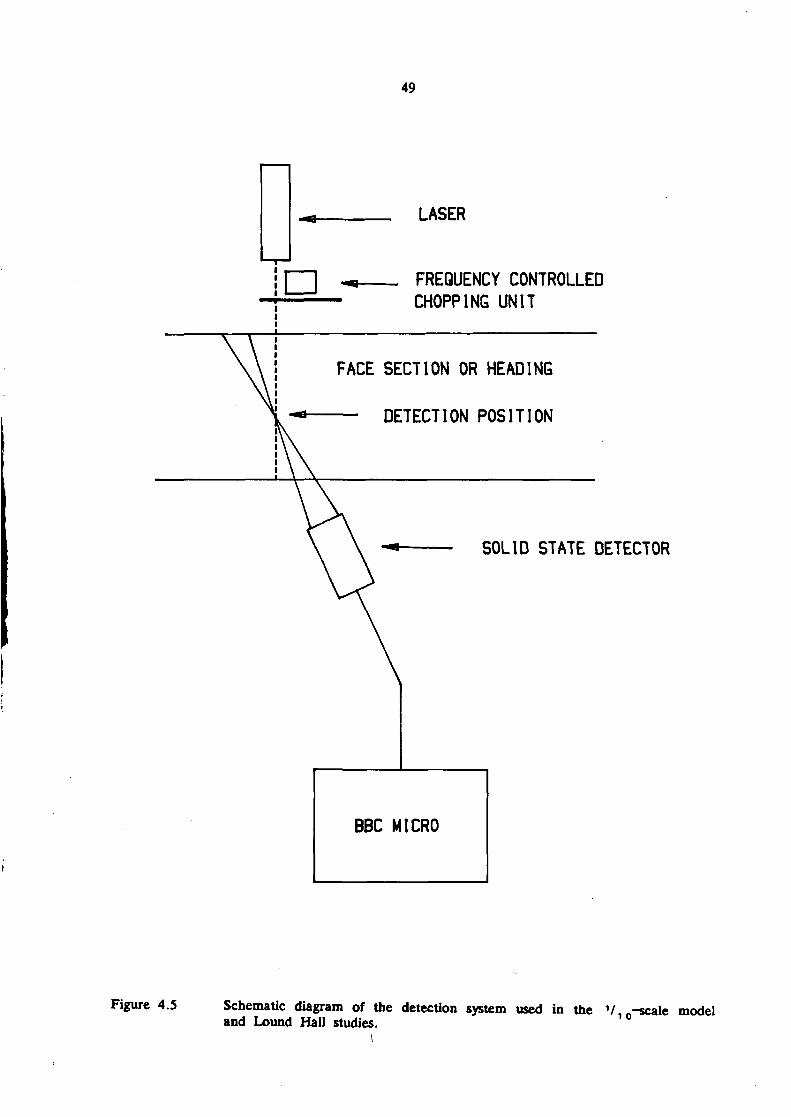
49
LASER
FREQUENCY CONTROLLEDCHOPPING UNIT
FACE SECTION OR HEADING
DETECTION POSITION
SOLID STATE DETECTOR
BBC MICRO
Figure 4.5 Schematic diagram of the detection system used in the V. .-scale modeland Lound Hall studies.
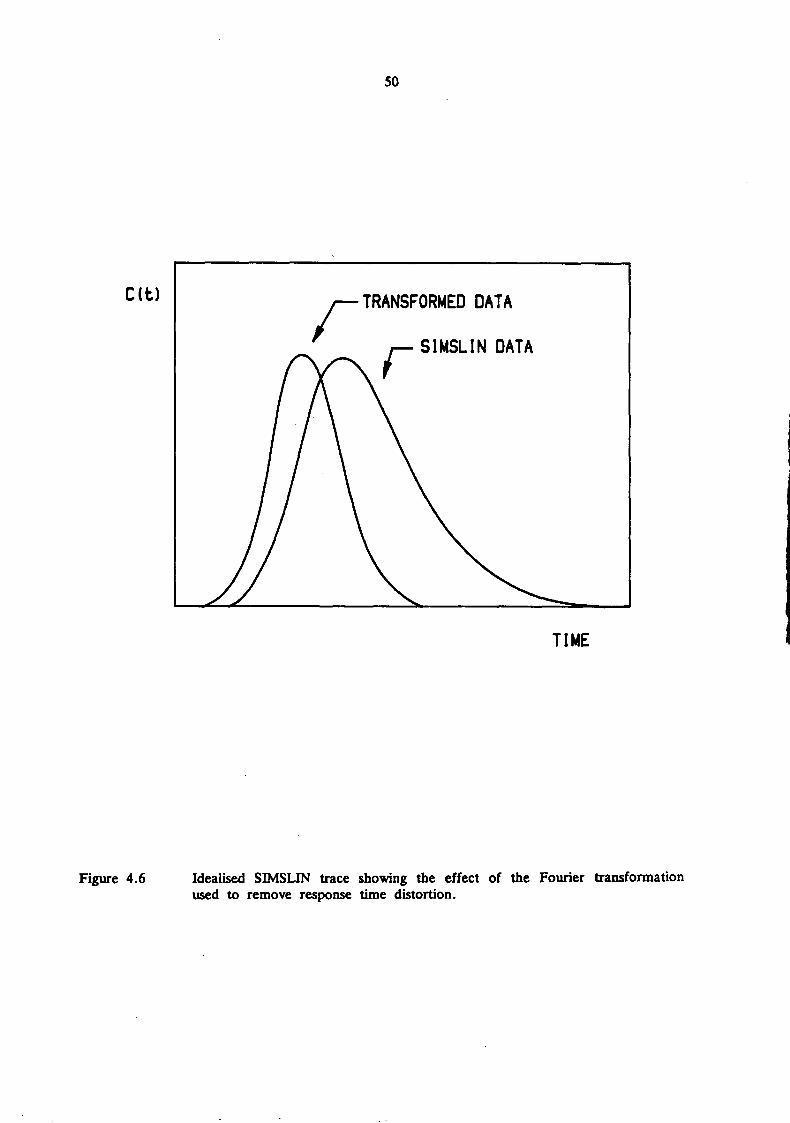
50
C(t) TRANSFORMED DATA
S1MSLIN DATA
TIME
Figure 4.6 Idealised SIMS LIN trace showing the effect of the Fourier transformationused to remove response time distortion.
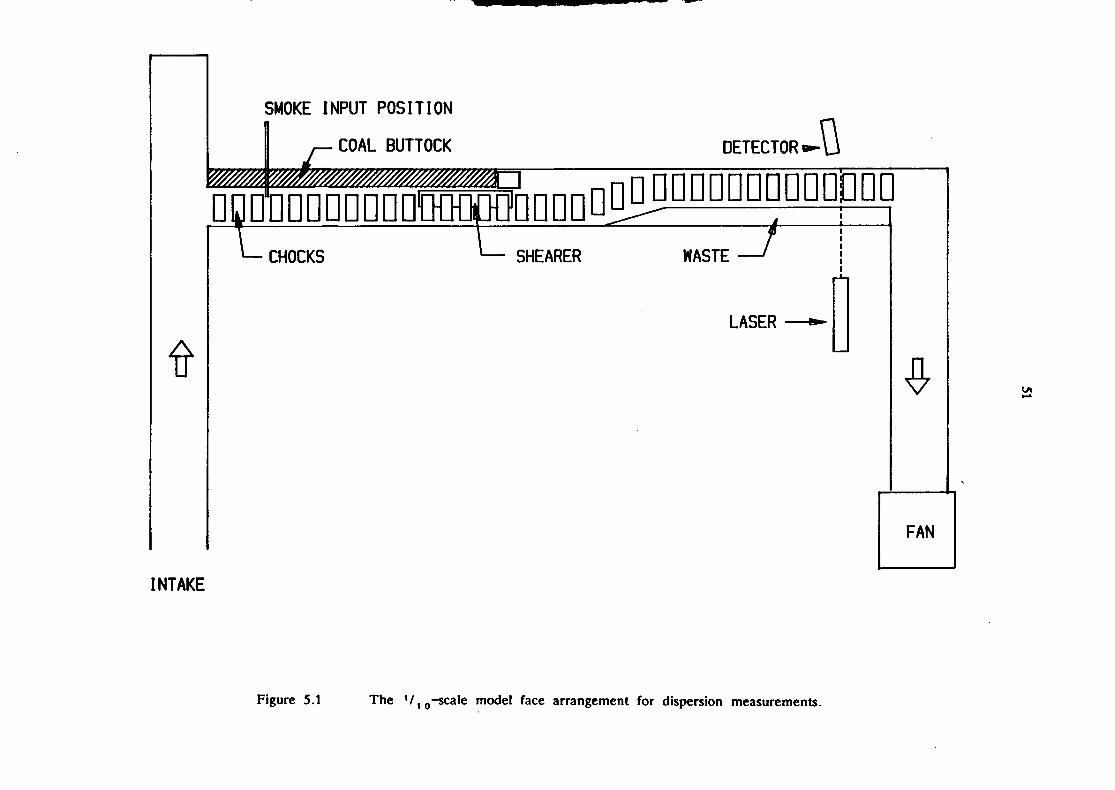
SMOKE INPUT POSITION
COAL BUTTOCK DETECTOR*-
DDDDDDDDDnDCHOCKS
INTAKE
SHEARER WASTE
LASER
Figure 5.1 The V10-scale model face arrangement for dispersion measurements.
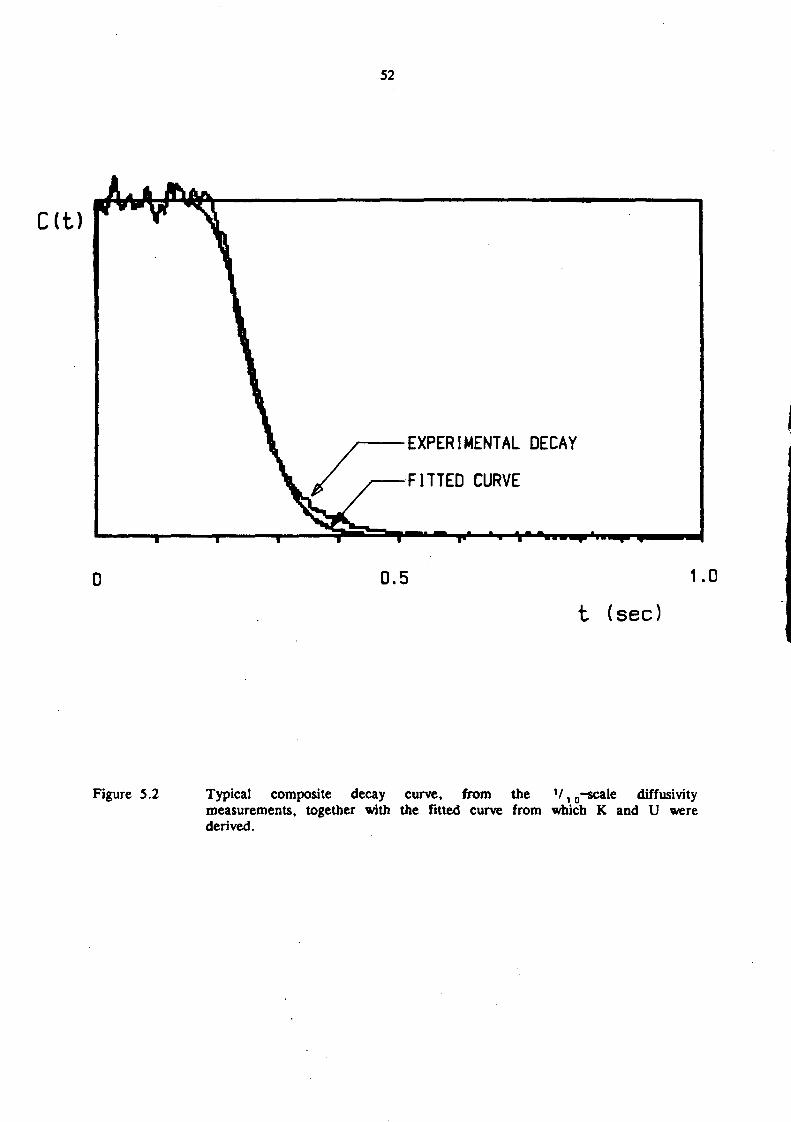
52
C(t)
EXPERIMENTAL DECAY
FITTED CURVE
0.5 1.0
t (sec)
V,0-*caleFigure S.2 Typical composite decay curve, from themeasurements, together with the fitted curve from which Kderived.
diffusivityand U were
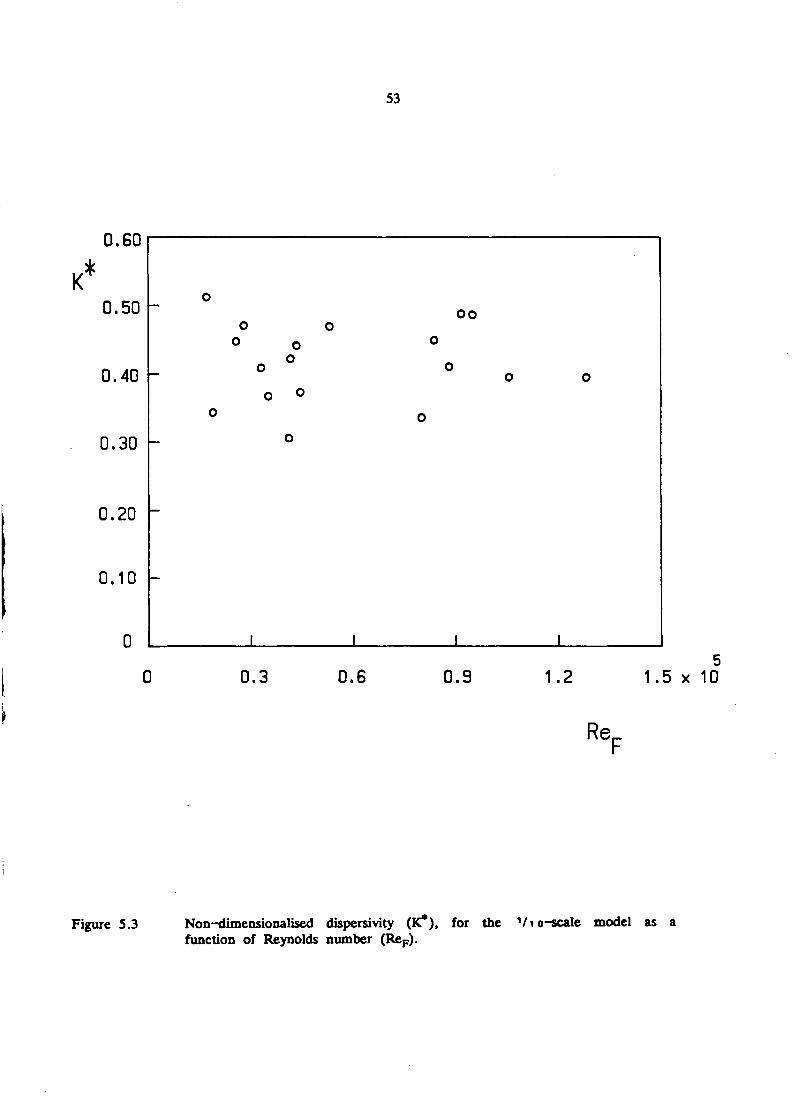
53
K
0.60
0.50
0.40
0.30
0.20
0.10
oo
00
0.3 0.6 0.9 1.2 1.5 x 10
Re,
Figure 5.3 Non-dimensionalised dispersivity (K*), for the Vio-scale model as afunction of Reynolds number (ReF).
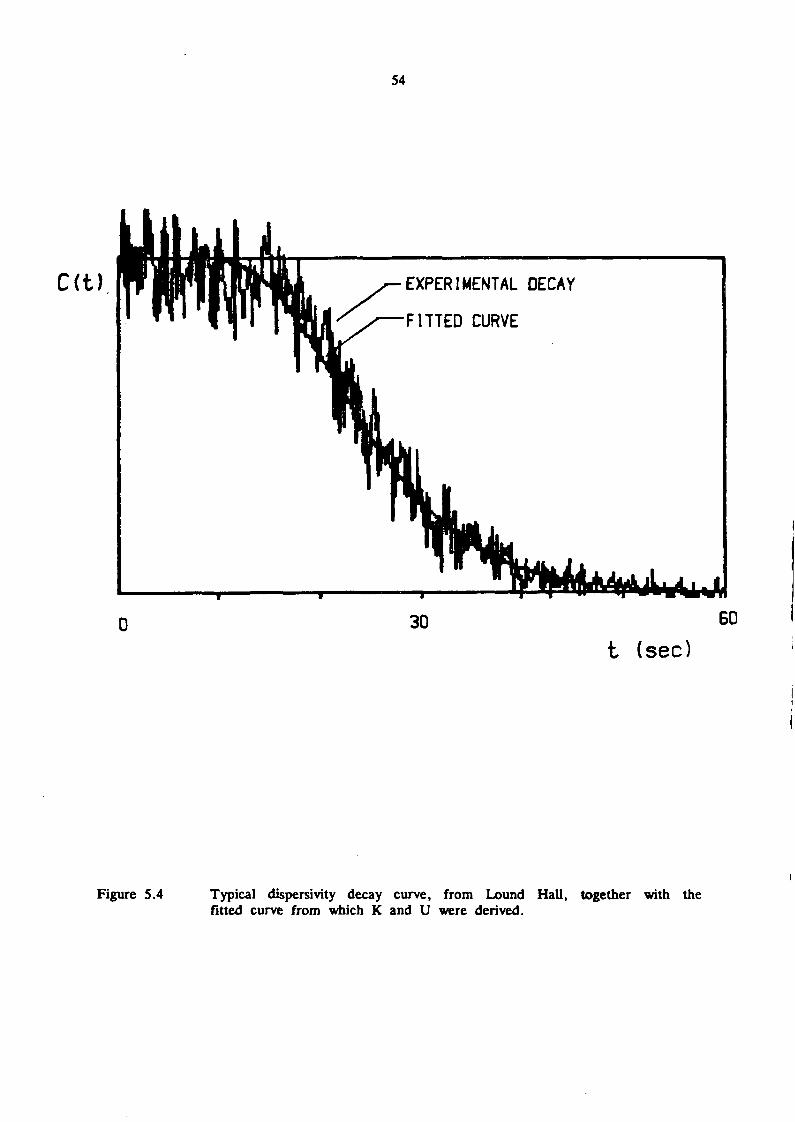
54
C(t) EXPERIMENTAL DECAY
FITTED CURVE
30 60
t (sec)
Figure 5.4 Typical dispersivity decay curve, from Loundfitted curve from which K and U were derived.
Hall, together with the
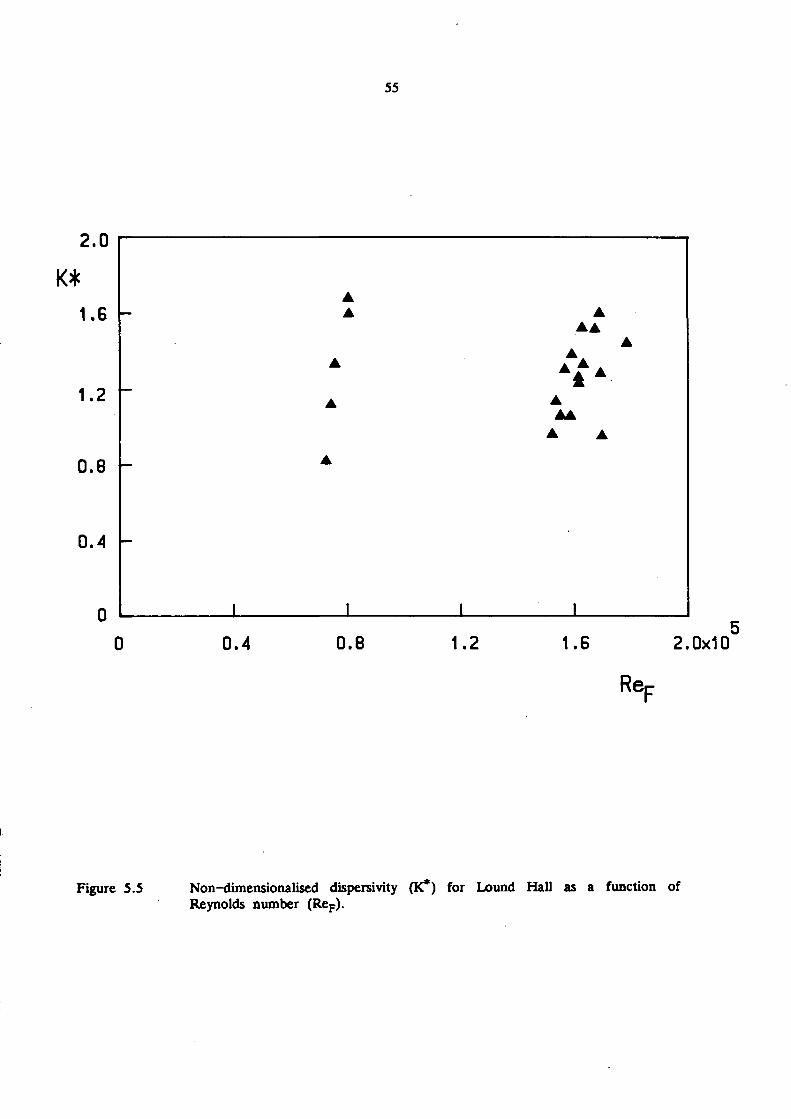
2.0
K*1.6
1.2
0.8
0.4
0.4
55
AA
A
A
0.8 1.2
AAA
A A
1.6 2.0x10
Rep
Figure 5.5 Non-dimensionalised dispersivity (K*) for Lound Hall as a function ofReynolds number (ReF).
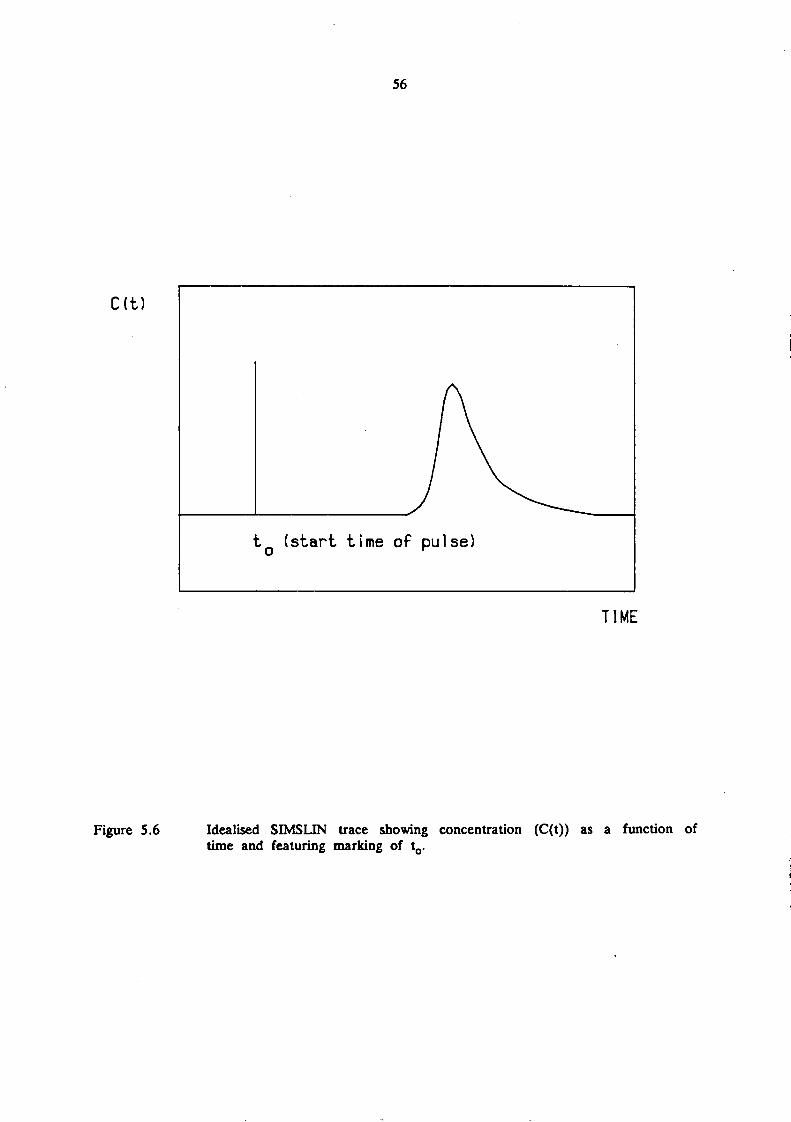
C(t)
56
t (start time of pulse)
TIME
Figure 5.6 Idealised SIMSLIN trace showing concentration (C(t)) as a function oftime and featuring marking of t0.
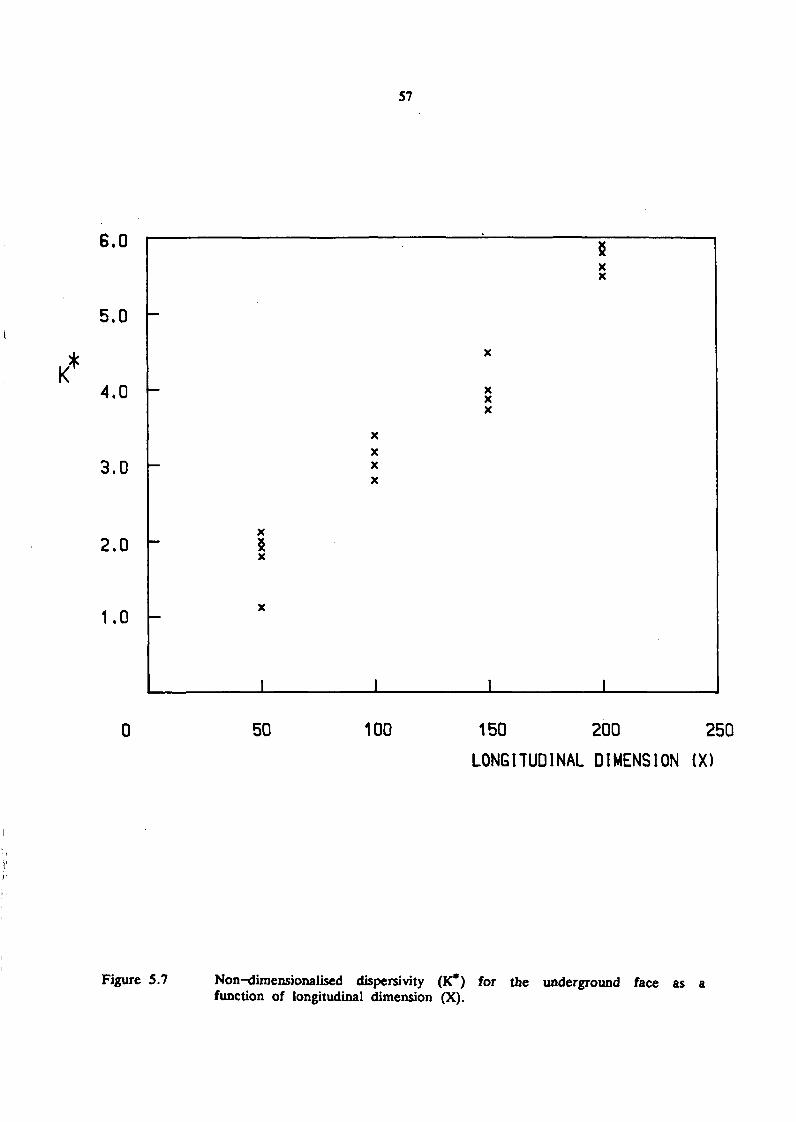
6.0
5,0
57
xx
K4.0
3.0
XXXX
XXX
2.0X
XX
1.0
I I
50 100 150 200 250
LONGITUDINAL DIMENSION (X)
Figure 5.7 Non-dimensionalised dispersivity (K*) for the underground face as afunction of longitudinal dimension (X).
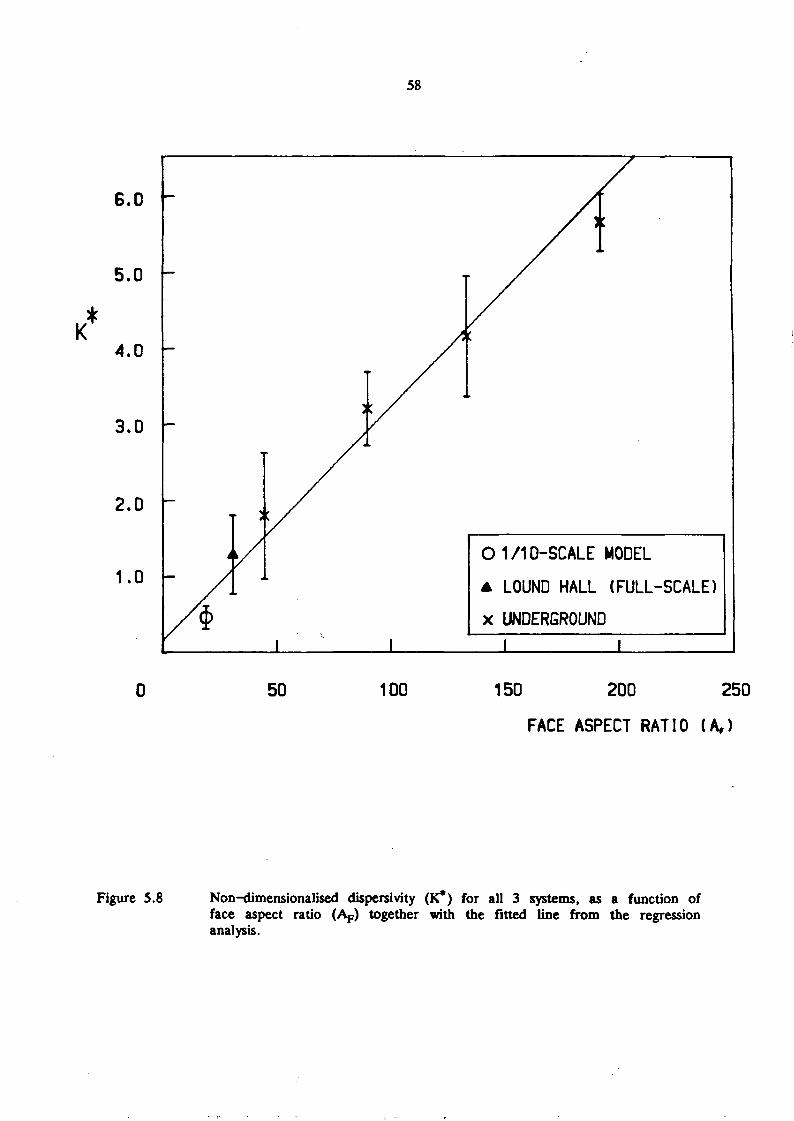
58
K
6.0
5.0
4.0
3.0
2.0
1.0
50 100
O1/10-SCALE MODEL
A LOUND HALL (FULL-SCALE)
x UNDERGROUND
I I
150 200 250
FACE ASPECT RATIO (A,)
Figure 5.8 Non-dimensionalised dispersivity (K*) for all 3 systems, as a function offace aspect ratio (AF) together with the fined line from the regressionanalysis.
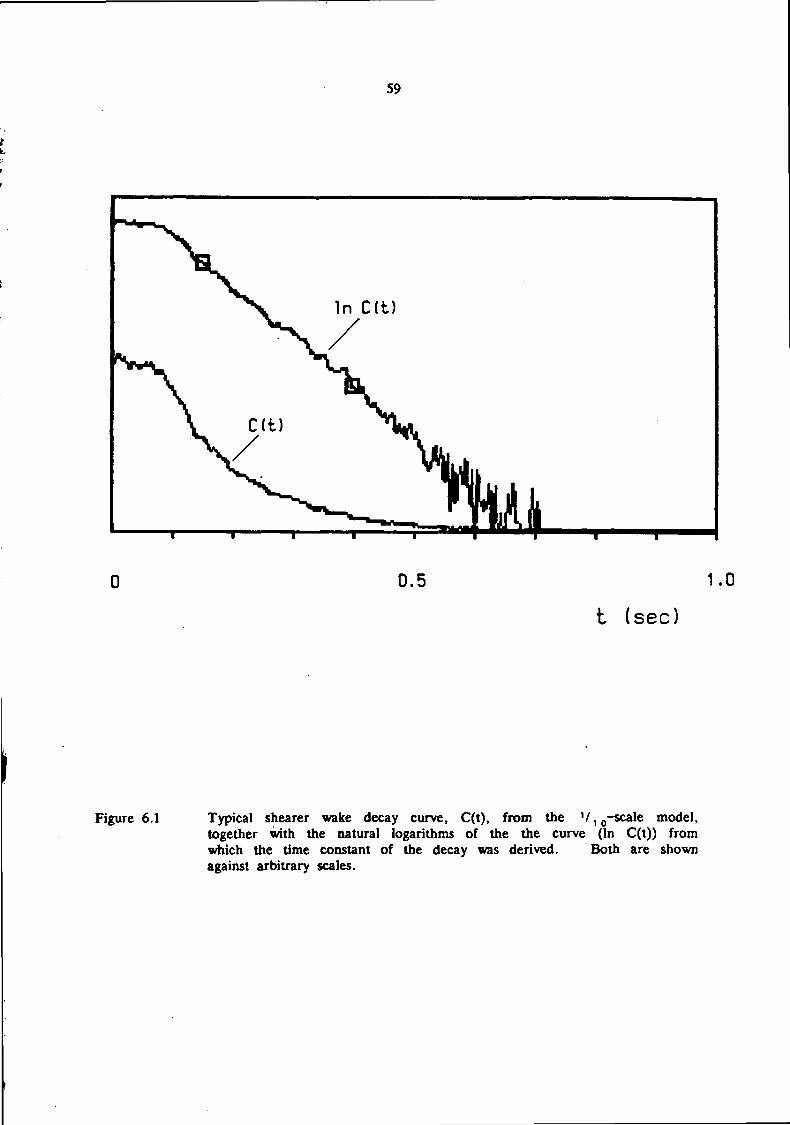
59
In C(t)
0.5 1.0
t (sec)
Figure 6.1 Typical shearer wake decay curve, C(t), from the V^-scale model,together with the natural logarithms of the the curve (In C(t)) fromwhich the time constant of the decay was derived. Both are shownagainst arbitrary scales.
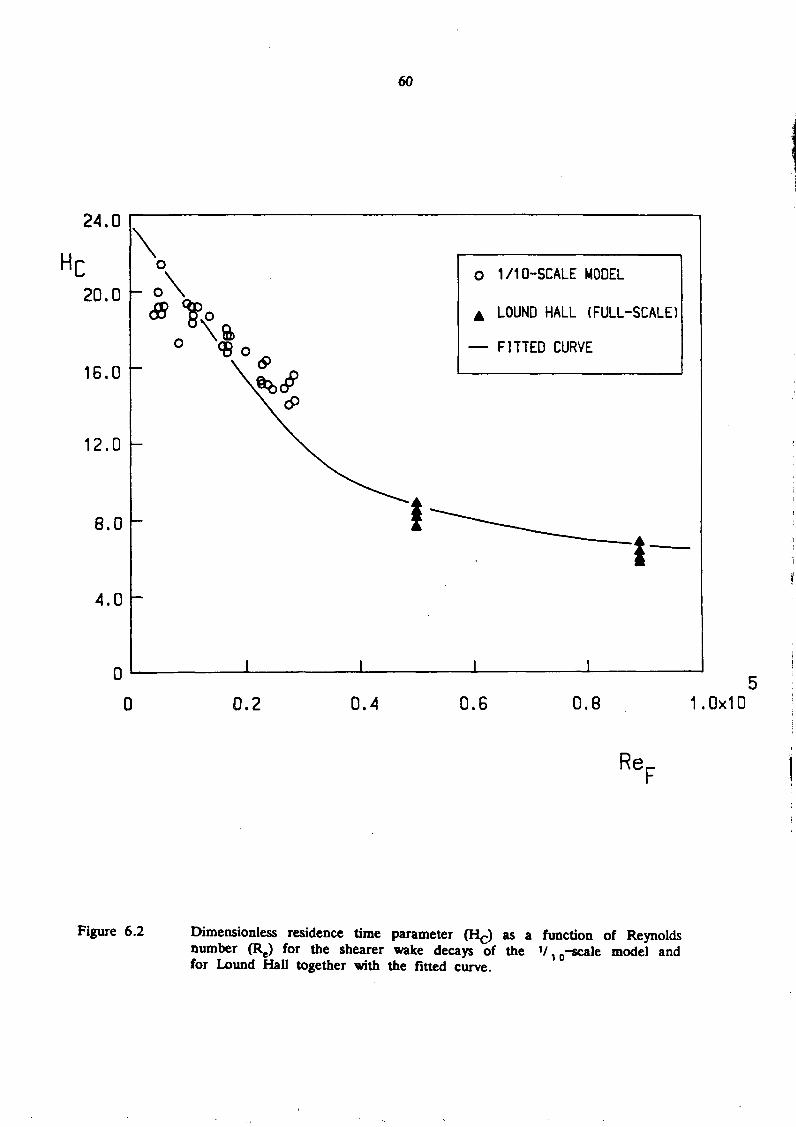
60
24.0
20.0
16.0
12.0
8.0
4.0
O 1/10-SCALE MODEL
A LOUND HALL (FULL-SCALE)
— FITTED CURVE
0.2 0.4 0.6 0.8 1.0x10
Rer
Figure 6.2 Dimensionless residence time parameter (Hc) as a function of Reynoldsnumber (Re) for the shearer wake decays of the V10-scale model andfor Lound Hall together with the fitted curve.
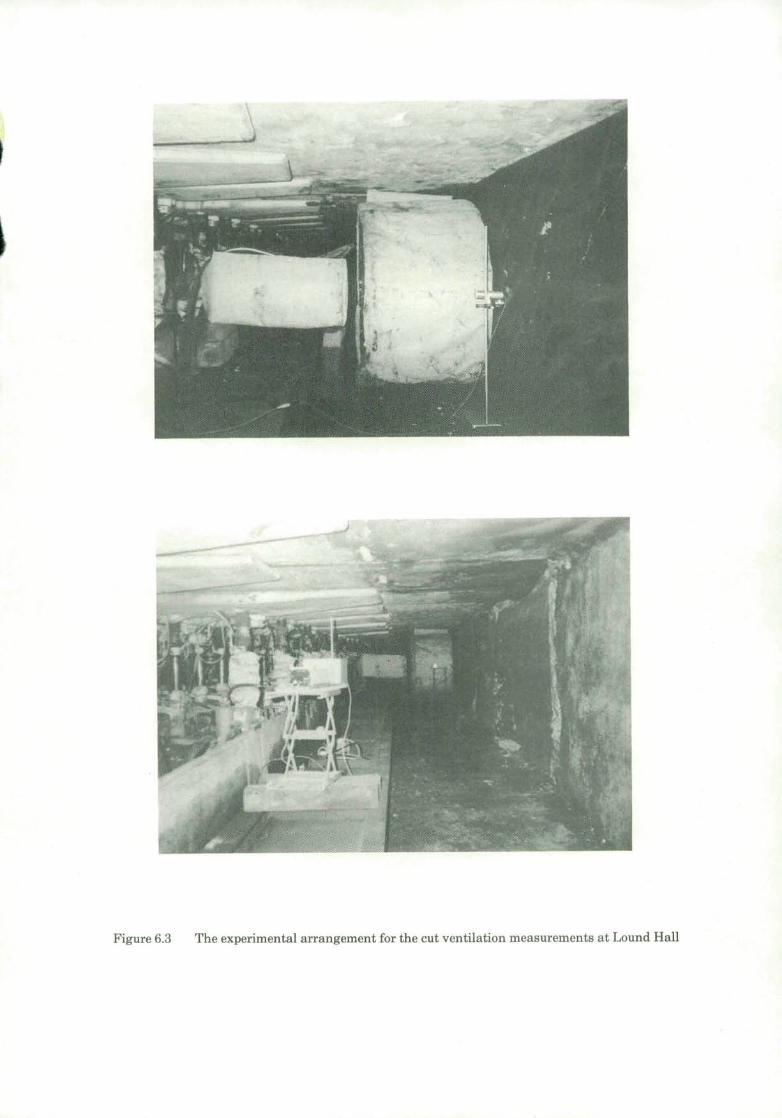
Figure 6.3 The experimental arrangement for the cut ventilation measurements at Lound Hall
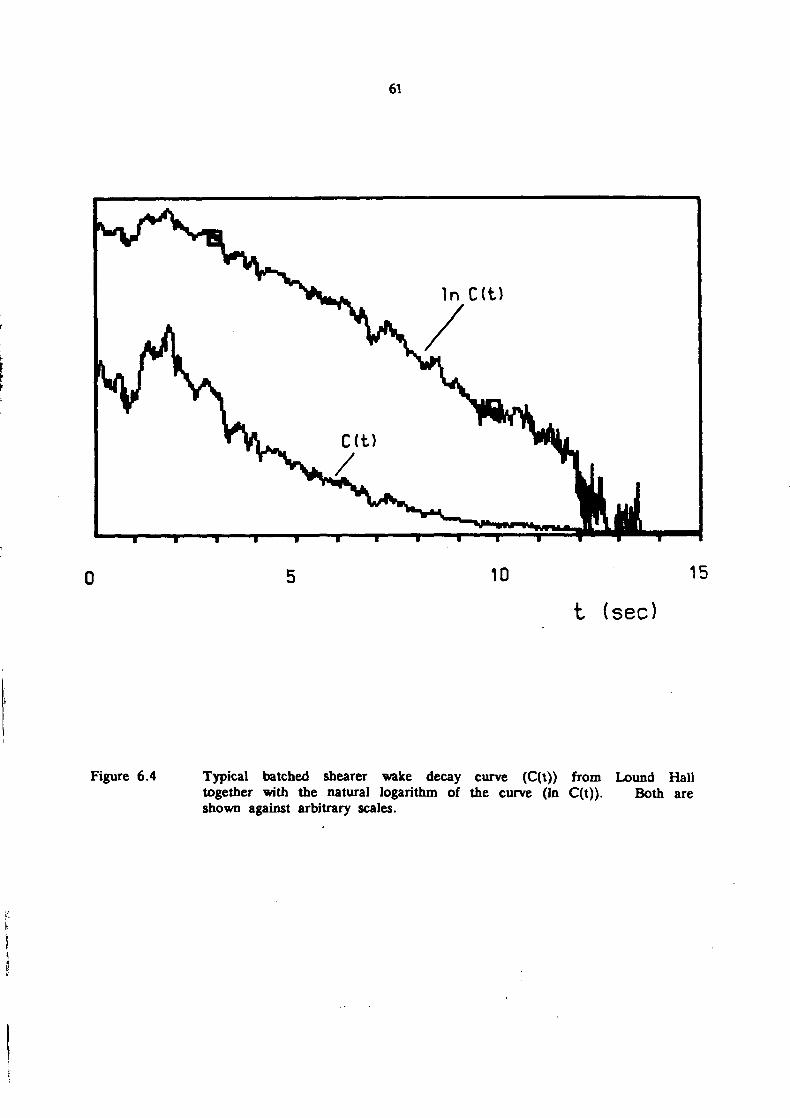
61
In C(t)
10 15
t (sec)
Figure 6.4 Typical batched shearer wake decay curve (C(t)) fromtogether with the natural logarithm of the curve (In C(t)).shown against arbitrary scales.
Lound HallBoth are
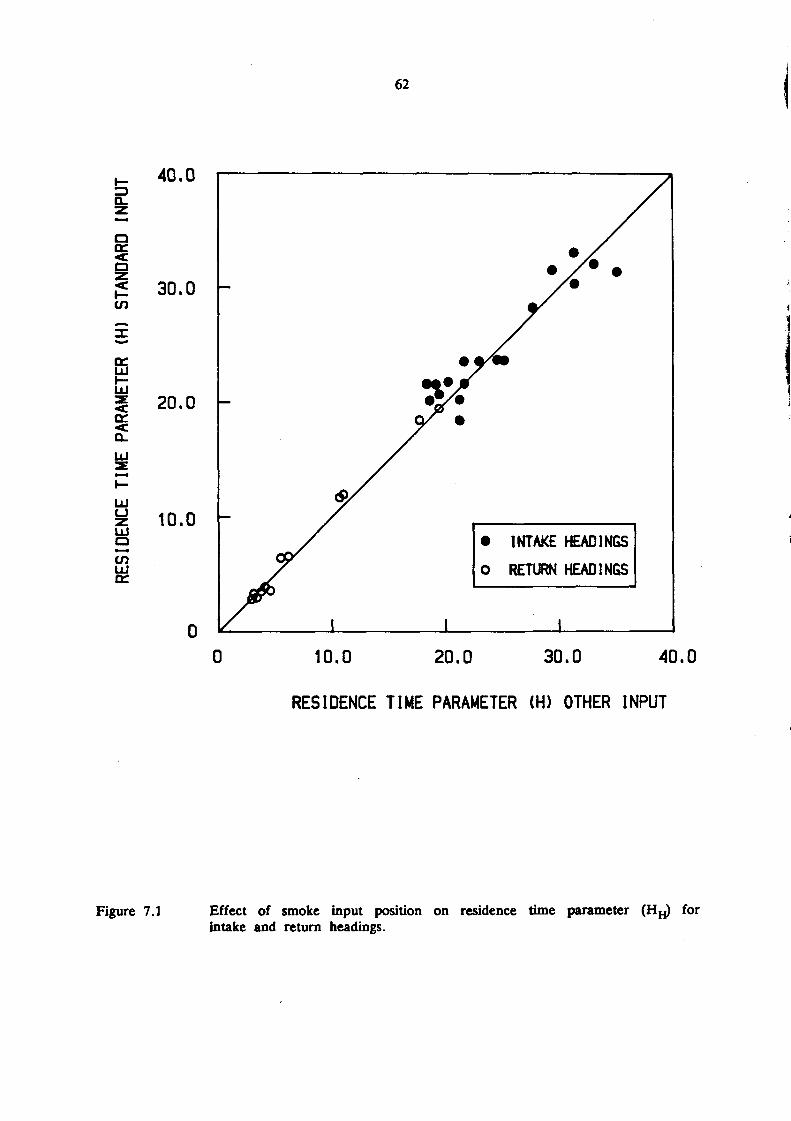
62
Q.
1
40.0
orUJ
LU
LU
LUaCOUJcr
30.0
20.0
10.0• INTAKE HEADINGS
O RETURN HEADINGS
10.0 20.0 30.0 40.0
RESIDENCE TIME PARAMETER (H) OTHER INPUT
Figure 7.1 Effect of smoke input position on residence time parameterintake and return headings.
for
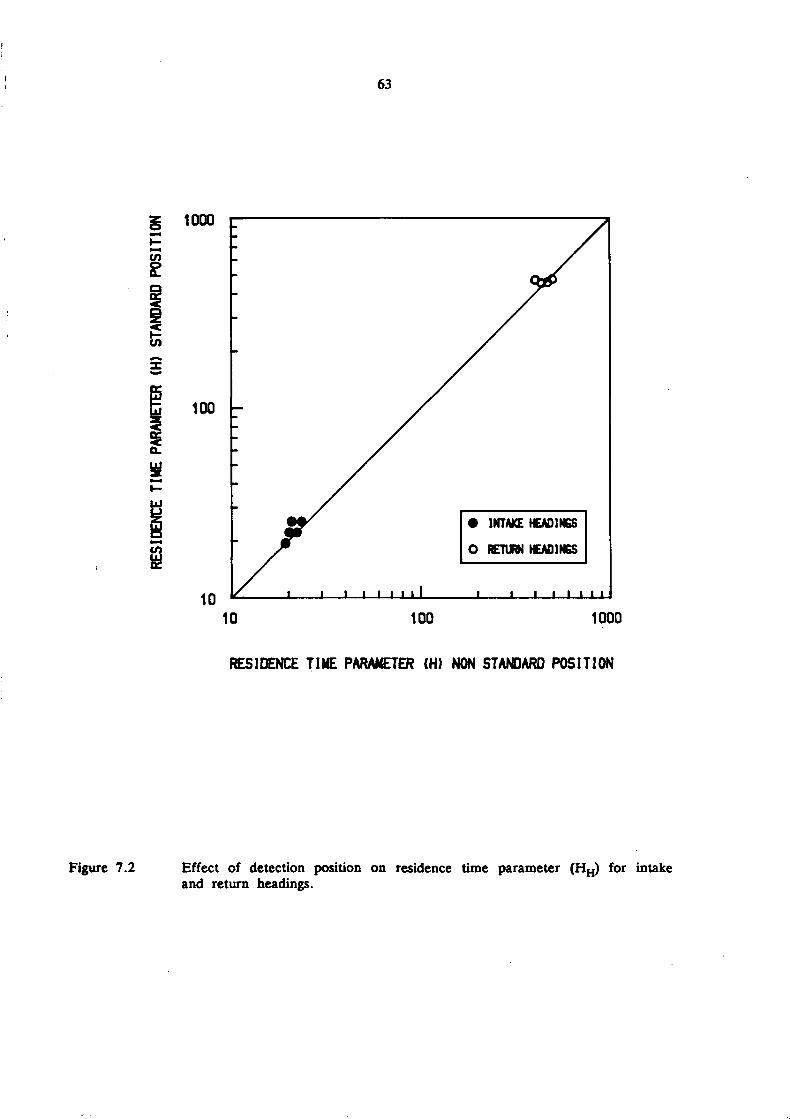
63
g 1000
100
I
10
• INTAKE HEADINGS
O RETURN HEADINGS
i i i i i
10 100 1000
RESIDENCE TIME PARAMETER (H) NON STANDARD POSITION
Figure 7.2 Effect of detection position on residence time parameter (HH) for intakeand return headings.
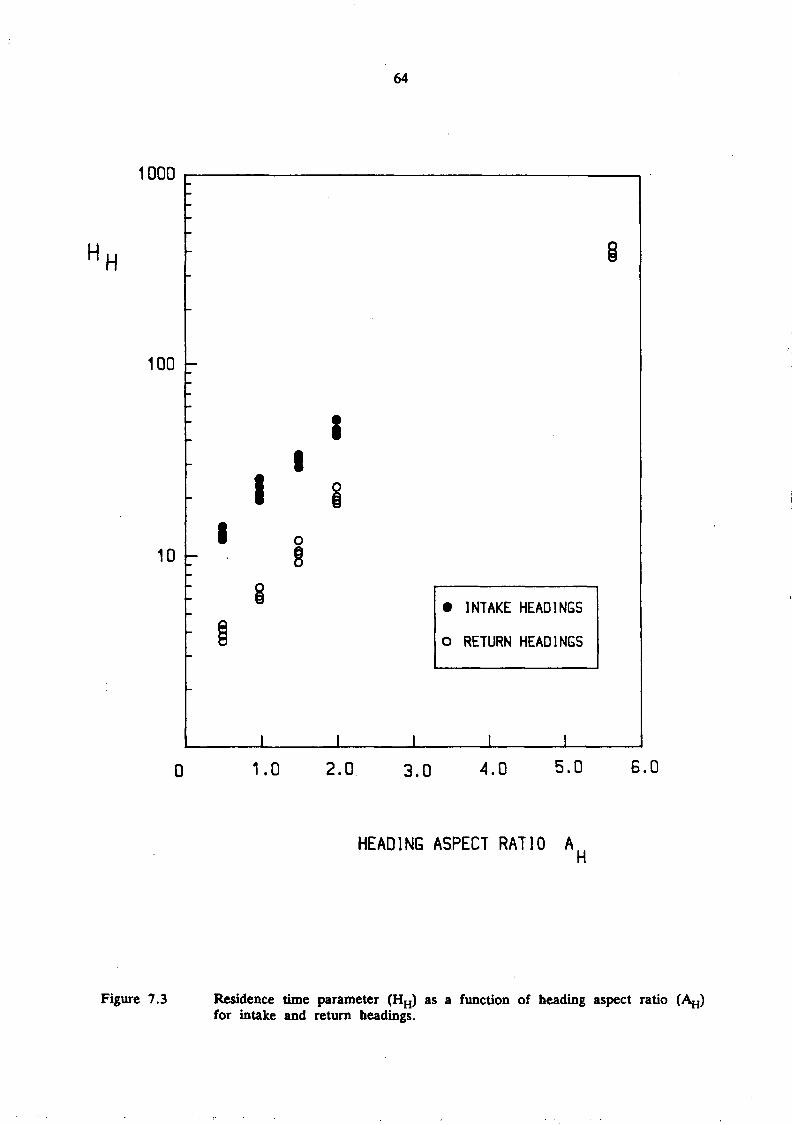
1000
H H
100
10
I
I
64
• INTAKE HEADINGS
O RETURN HEADINGS
I I
1.0 2.0 3.0 4.0 5.0 6.0
HEADING ASPECT RATIO AH
Figure 7.3 Residence time parameter (HH) as a function of heading aspect ratio (AH)for intake and return headings.
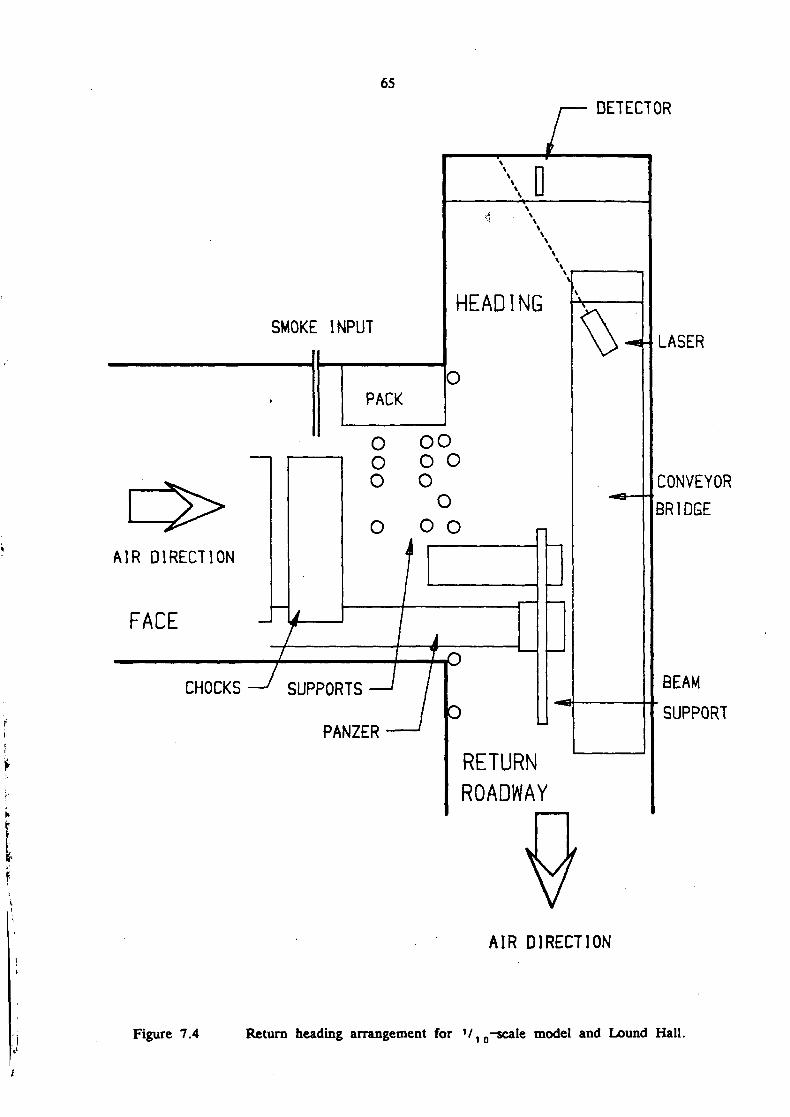
65
DETECTOR
SMOKE INPUT
\ D
HEADING
SUPPORTS
PANZER
RETURN
ROADWAY
V
•4J LASER
CONVEYORBRIDGE
BEAM
SUPPORT
AIR DIRECTION
Figure 7.4 Return heading arrangement for V1Q-scale model and Lound Hall.
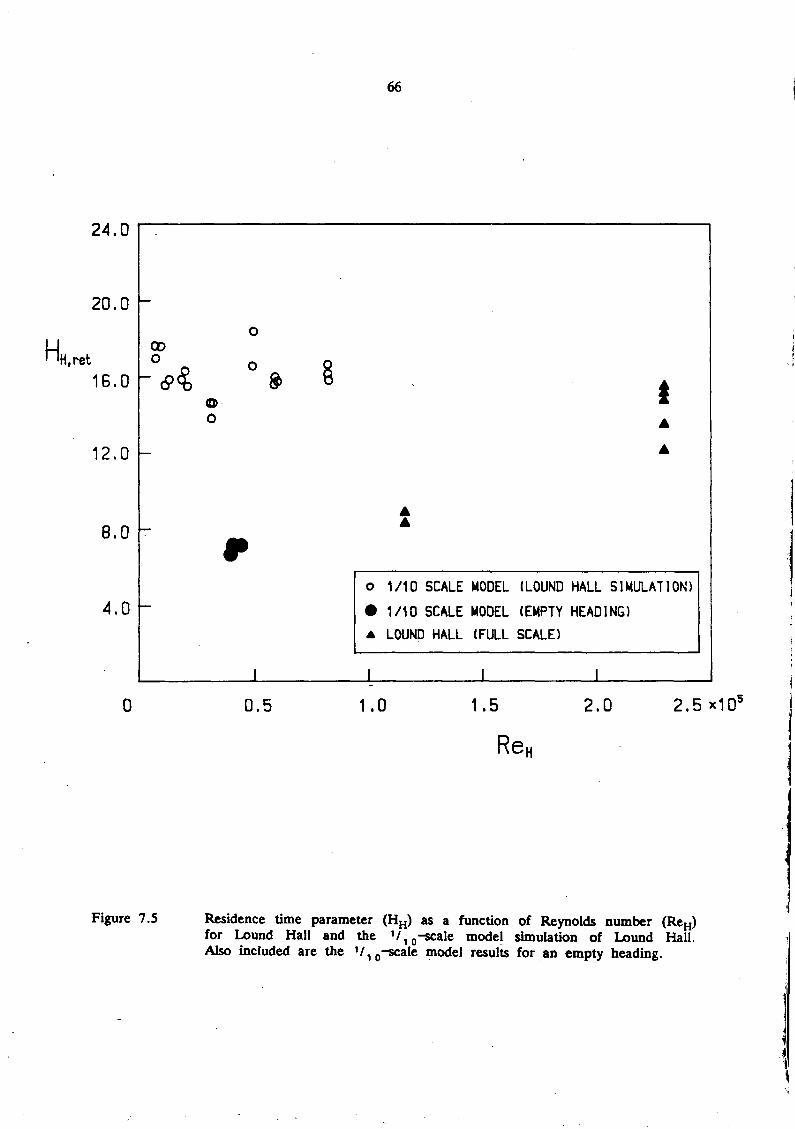
24.0
66
20.0
HH.retQDO
16.0
o
o
t
12.0
8.0
4.0o 1/10 SCALE MODEL (LOUND HALL SIMULATION)
•1/10 SCALE MODEL (EMPTY HEADING)
* LOUND HALL (FULL SCALE)
I
0.5 1.0 1.5 2.0
Re,
2.5
Figure 7.5 Residence time parameter (HH) as a function of Reynolds number (ReH)for Lound Hall and the V10-scale model simulation of Lound Hall.Also included are the V,0-scale model results for an empty heading.

HEAD OFFICE:
Research Avenue North,Riccarton,Edinburgh, EH14 4AP, United KingdomTelephone: +44 (0)870 850 5131Facsimile: +44 (0)870 850 5132
Email: [email protected]
Tapton Park Innovation Centre,Brimington Road, Tapton,Chesterfield, Derbyshire, S41 0TZ, United KingdomTelephone: +44 (0)1246 557866Facsimile: +44 (0)1246 551212
Research House Business Centre,Fraser Road, Perivale, Middlesex, UB6 7AQ,United KingdomTelephone: +44 (0)208 537 3491/2Facsimile: +44 (0)208 537 3493
Brookside Business Park, Cold Meece, Stone, Staffs, ST15 0RZ,United KingdomTelephone: +44 (0)1785 764810Facsimile: +44 (0)1785 764811
(A20115) IOM (R) ReportCov art 3/15/06 12:32 PM Page 2