Embed Size (px)
Citation preview

HISTORICAL RESEARCH REPORTResearch Report TM/71/10
1971
A study of the noise conditions in the Rotary Testing Laboratory at the Mining Research and Development Establishment, Bretby Scott C


Copyright © 2006 Institute of Occupational Medicine. INSTITUTE OF OCCUPATIONAL MEDICINE No part of this publication may be reproduced, stored Research Avenue North, Riccarton, Edinburgh, EH14 4AP or transmitted in any form or by any means without Tel: +44 (0)870 850 5131 Fax: +44 (0)870 850 5132 written permission from the IOM e-mail [email protected]
A study of the noise conditions in the Rotary Testing Laboratory at the Mining Research and Development
Establishment, Bretby
Scott C This document is a facsimile of an original copy of the report, which has been scanned as an image, with searchable text. Because the quality of this scanned image is determined by the clarity of the original text pages, there may be variations in the overall appearance of pages within the report. The scanning of this and the other historical reports in the Research Reports series was funded by a grant from the Wellcome Trust. The IOM’s research reports are freely available for download as PDF files from our web site: http://www.iom-world.org/research/libraryentry.php
HISTORICAL RESEARCH REPORTResearch Report TM/71/10
1971

ii Research Report TM/71/10

NOT FOR PUBLICATION Report No. TM/71/10
I N S T I T U T E OF O C C U P A T I O N A L M E D I C I N E
A STUDY OF THE NOISE CONDITIONS IN THEROTARY TESTING LABORATORY AT THE
MINING RESEARCH AND DEVELOPMENT ESTABLISHMENT, BRETBY
by
G. Scott
Physiology Branch, /Institute of Occupational Medicine,Roxburgh Place,Edinburgh, EH8 9SU(Tel. 031-667 5131) MARCH 1971

Report No. TM/71/10
A STUDY OF THE NOISE CONDITIONS IN THEROTARY TESTING LABORATORY AT THE
MINING RESEARCH AND DEVELOPMENT ESTABLISHMENT, BRETBY
byG. Scott
C O N T E N T S
SUMMARY1. INTRODUCTION
1.1 Purpose of study1.2 Sound and its measurement
2. DESCRIPTION OF SOUND LEVEL MEASURING EQUIPMENT3. LAYOUT AND WORK ARRANGEMENTS IN THE LABORATORY4. MEASUREMENT PROCEDURES5. RESULTS AND DISCUSSION
5.1 Observed sound levels5.2 Expo sure and risk of personnel
6. REMEDIAL MEASURES6.1 Source of noise6.2 Transmission6. 3 Ear defenders
7. CONCLUSIONS8. ACKNOWLEDGEMENTSREFERENCESFIGURES 1 to 5TABLES 1 to 8APPENDICES 1 and 2 ,

Report No. TM/71/10
I N S T I T U T E OF O C C U P A T I O N A L M E D I C I N E
A STUDY OF THE NOISE CONDITIONS IN THEROTARY TESTING LABORATORY AT THE
MINING RESEARCH AND DEVELOPMENT ESTABLISHMENT, BRETBY
by
G. Scott
S U M M A R Y
A detailed survey of the noise levels within the laboratory was madeduring the months of May, June and July 1970. The average exposure ofindividual workers was estimated from observations of their work programme,
A prediction of the expected hearing loss of the men in the absence of hearingprotection was calculated.
Reduction of the noise at source in the main laboratory might be achievedby design features in the machinery under test. This is the responsibilityof the individual manufacturers and should be brought to their attention.Transmission of noise through the structural members of the floor could bereduced by the use of vibration damping alloys. It is impractical to reduceair transmission in the laboratory by enclosing individual items of machinery.
The noise level in the enclosed engine testing cells within the mainlaboratory could be reduced by suitable changes in their design. Specific
proposals for these changes are made.Since major reductions in the noise levels in the main laboratory cannot
easily be achieved it is recommended that the men wear hearing defenders.Their use is only necessary when the noise reaches a dangerous intensity.It is pointed out that the main difficulty in the adaption of such a system isin ensuring that the men appreciate the fact that the noise has reached a highlevel. Instruction on the subject should be given to the staff at an early stage,
A system which will give visual warning of dangerous noise levels shouldbe installed.
Physiology Branch,Institute of Occupational Medicine,Roxburgh Place,Edinburgh, EH8 9SU(Tel. 031-667 5131) MARCH 1971
, A STUDY OF THE NOISE CONDITIONS IN THEROTARY TESTING LABORATORY AT THE
MINING RESEARCH AND DEVELOPMENT ESTABLISHMENT, BRETBY
' - . ' _ ' - . b y • . • . • • • • • • _ • ,: G. Scott *''"'."
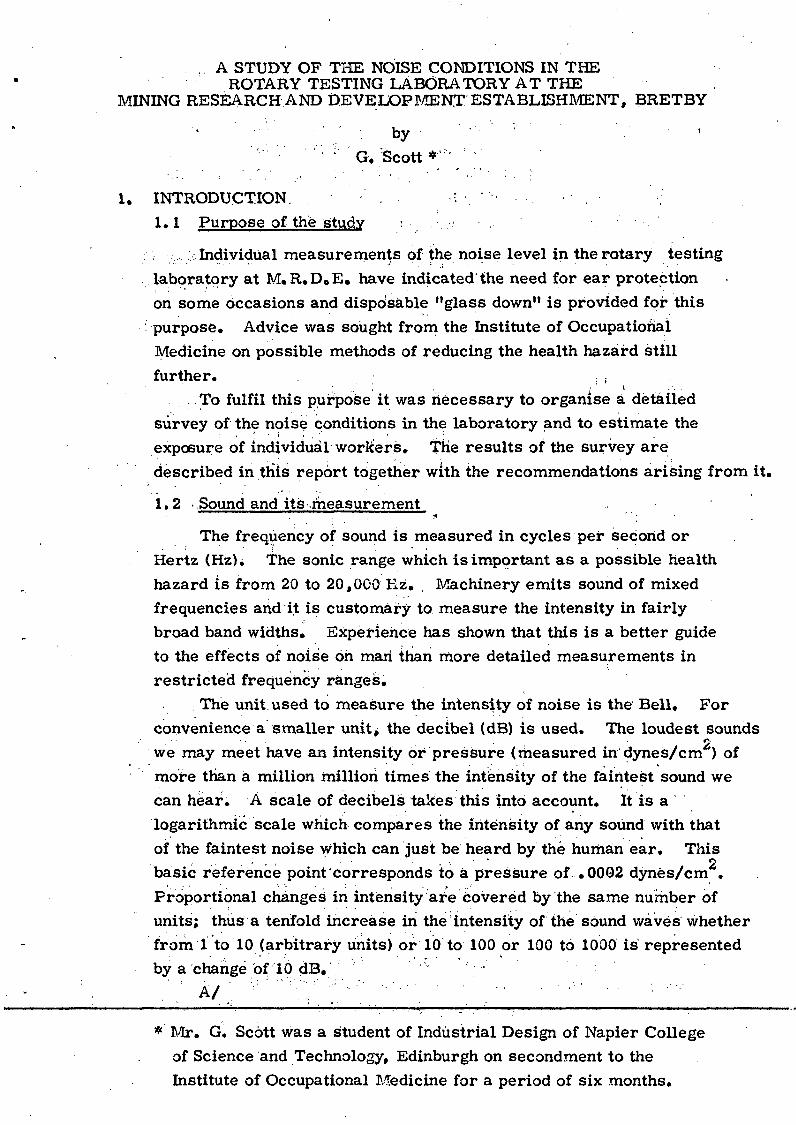
1. INTRODUCTION. . ;1.1 Purpose of the study : ,
:.•: Individual measurements of the noise level in the rotary testinglaboratory at M.R, Do E, have indicated'the need for ear protectionon some occasions and disposable "glass down" is provided for thispurpose. Advice was sought from the Institute of OccupationalMedicine on possible methods of reducing the health hazard stillfurther. • ; ;
To fulfil this purpose it was necessary to organise a detailedsurvey of the noise conditions in the laboratory and to estimate theexposure of individual workers. The results of the survey aredescribed in this report together with the recommendations arising from it.
1.2 .Sound and its measurement7* '
The frequency of sound is measured in cycles per second orHertz (HzU The sonic range which is important as a possible healthhazard is from 20 to 20,000 Hz. . Machinery emits sound of mixedfrequencies and it is customary to measure the intensity in fairlybroad band widths. Experience has shown that this is a better guideto the effects of noise oh man than more detailed measurements inrestricted frequency ranges.
The unit used to measure the intensity of noise is the Bell. Forconvenience a smaller unitj the decibel (dB) is used. The loudest sounds
:'' " ' • • • ' 2we may meet have an intensity or pressure (measured in dynes/cm ) ofmore than a million million times the intensity of the faintest sound wecan hear. A scale of decibels takes this into account. It is alogarithmic scale which compares the intensity of any sound with thatof the faintest noise which can just be heard by the human ear. This
• • • ' • • ' ' ' • • • ' ' 2basic reference point'cor responds to a pressure of. .0002 dynes/cm .Proportional changes in intensity are covered by the same number ofunits; thus a tenfold increase in the'intensity of the sound waves whetherfrom 1 to 10 (arbitrary units) or 10 to 100 or 100 to 1000 is representedby a change of 10 dB.
. ' . ' . A / • ' ' : ' ' ' '" ! ' ' . \ : \ •;.'•"'' - '•••. ' ; . •• • ' • '" • • : •"•'*' Mr. G. Scott was a student of Industrial Design of Napier College
of Science and Technology, Edinburgh on secondment to theInstitute of Occupational Medicine for a period of six months.
2.
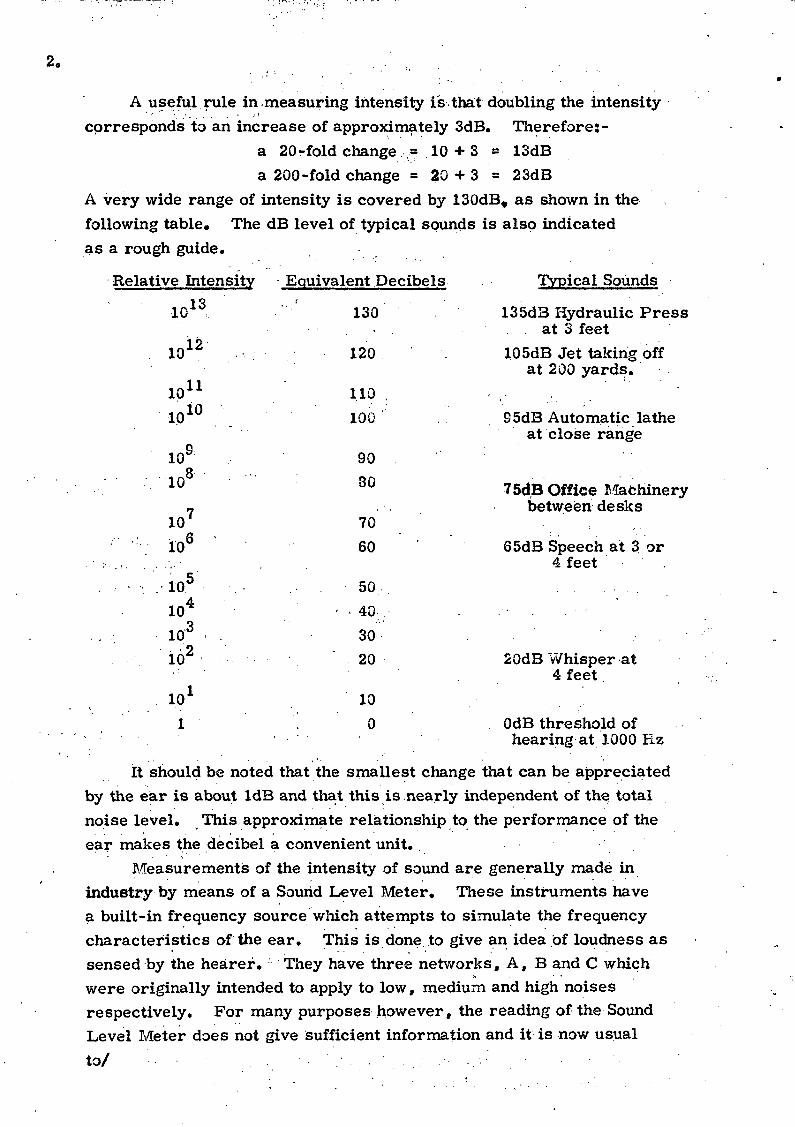
A useful rule in measuring intensity is that doubling the intensity
corresponds to an increase of approximately 3dB. Therefore:-
a 20-fold change = 10 + 3 » 13dB
a 200-fold change = 20 + 3 = 23dB
A very wide range of intensity is covered by ISOdB, as shown in the
following table* The dB level of typical sounds is also indicated
as a rough guide.
Relative Intensity4310J
10
1010
12
11
10
109:
10'
10
10.'10'10'10'
101
6
Equivalent Decibels
130
120
1.10 .100
9080
70
60
50
• . 40; ..'
30
" 2 0
10
''. 0
Typical Sounds
135d3 Hydraulic Pressat 3 feet
105dB Jet taking offat 200 yards.
95dB Automatic latheat close range
75dB Office Machinerybetween desks
65dB Speech at 3 or4 feet .
20dB Whisper at4 feet
OdB threshold ofhearing at 1000 Hz
It should be noted that the smallest change that can be appreciatedby the ear is about IdB and that this is nearly independent of the totalnoise level. This approximate relationship to the performance of the
ear makes the decibel a convenient unit.Measurements of the intensity of sound are generally made in
industry by means of a Sound Level Meter. These instruments havea built-in frequency source which attempts to simulate the frequencycharacteristics of the ear. This is done to give an idea of loudness assensed by the hearer. They have three networks, A, B and C whichwere originally intended to apply to low, medium and high noisesrespectively. For many purposes however, the reading of the SoundLevel Meter does not give sufficient information and it is now usual
t o / ' . . • • . . . - • ' . - . • ' . . . . . ' • . . • • • ' • - • - •

to use an Octave Wave-band Analyser in conjunction with the meter*This gives readings of the spund intensity in decibels for theinternationally standardised octave band centre frequencies of 31.5,S3, 125., 150, 500, 1000, 2000, 4000, 8000,46000, and 31500 Hz.
- • ' • •' : • * * • '. • • ' \ . •• .. ," '
Reverberation time is another technical term which is used inthis report and is defined as the time taken for the sound level,originally in a steady state, to fall by 60dB after the source is stopped.It is used as a measure of the degree to which a room reflects sound.A room with highly reflective surfaces will have a long reverberationtime and a room with highly absorbent surfaces will have a shortreverberation time.
2. DESCRIPTION OF SOUND LEVEL MEASURING EQUIPMENT .The equipment used in this survey was manufactured by Bruel and
Kjaer. The instruments used .were:-(1) Type 4131 Microphone with type 2613 Cathode Follower(2) Type 2603'Microphone Amplifier(3) Type 1612 Band Pass Filter set(4) Type 2304 Level Recorder with sapphire stylus and
waxed paper
The equipment was set up and used as recommended in the Brueland Kjaer handbook 'Acoustic Noise Measurements1. Reference wasalso made to the handbooks of each piece of equipment (Photograph 1shows the arrangement of the equipment used).
As well as the above equipment a type 4220 Pistonphone was usedfor calibration and an extension lead was used to allow a number ofmeasurements to be made from one position.
The microphone was mounted on a photographic tripod andadjusted so that the diaphragm was at the constant height of 1.6510 metres.(Dreyfuss 1968).. This height was selected as it is the average earheight.
3. LAYOUT AND WORK ARRANGEMENTS IN THE LABORATORYTwo general Views of the laboratory are shown in Photographs
2 and 3, and a plan is shown in Fig. 1. The photographs show twoviews of the main workspace looking East. At the far end ofBiotograph 2 can be seen the companionway and door which lead to theoffices through a sound lock. There is a passage on the North side ofthe laboratory behind the electrical cabinets towards the top leftcorner of the picture: This passage is also used for storage cabinetsfor equipment used in the laboratory, such as meters arid fittings. Atthe extreme top left of both pictures can be seen the ventilation louvresand/
4.
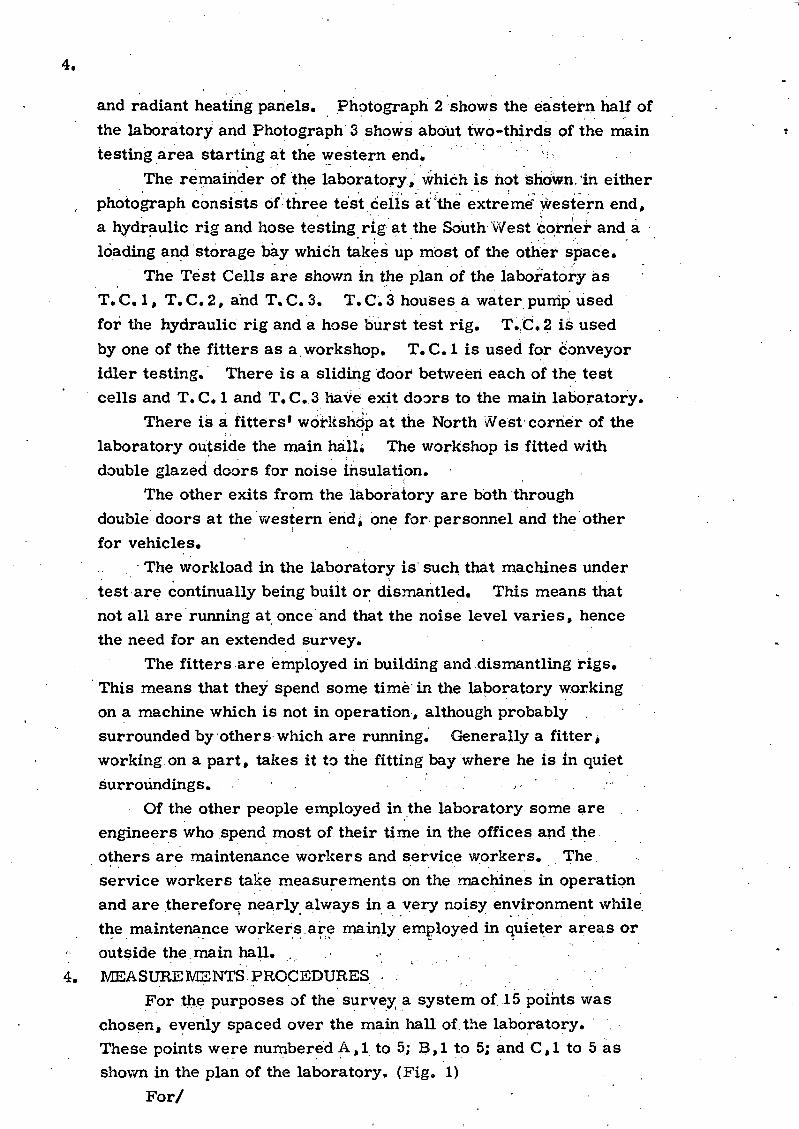
and radiant heating panels. Photograph 2 shows the eastern half ofthe laboratory and Photograph 3 shows about two-thirds of the maintesting area starting at the western end. :
The remainder of the laboratory, which is hot Shown, in either, photograph consists of three test cells at 'the extreme" yirestern end,
a hydraulic rig and hose testing rig at the South West corner and aloading and storage bay which takes up most of the other space.
The Test Cells are shown in the plan of the laboratory asT.C.I, T.C.2, and T.C.S. T.C.3 houses a water pump usedfor the hydraulic rig and a hose burst test rig. T. C. 2 is usedby one of the fitters as a workshop. T. C, 1 is used for conveyoridler testing. There is a sliding door between each of the testcells and T.C. 1 and T.C.3 have exit doors to the main laboratory.
There is a fitters1 workshop at the North West corner of thelaboratory outside the main halli The workshop is fitted withdouble glazed doors for noise insulation.
The other exits from the laboratory are both throughdouble doors at the western end; one for personnel and the otherfor vehicles.. The workload in the laboratory is such that machines undertest are continually being built or dismantled. This means thatnot all are running at once and that the noise level varies, hencethe need for an extended survey.
The fitters are employed in building and dismantling rigs.This means that they spend some time in the laboratory workingon a machine which is not in operation, although probablysurrounded by others which are running. Generally a fitter>working on a part, takes it to the fitting bay where he is in quietsurroundings. ,
Of the other people employed in the laboratory some areengineers who spend most of their time in the offices and theothers are maintenance workers and service workers. Theservice workers take measurements on the machines in operationand are therefore, nearly always in a very noisy environment whilethe maintenance workers are mainly employed in quieter areas oroutside the main hall. . .
4. MEASUREMENTS PROCEDURES •For the purposes of the survey a system of 15 points was
chosen j evenly spaced over the main hall of the laboratory.These points were numbered A,l to 5; B,l to 5; and C,l to 5 asshown in the plan of the laboratory. (Fig. 1)
For/

5.
For each set of readings an octave band analysis of the sound level
was made at each point. The readings were translated from the waxed
paper trace into a table of results.At a time chosen randomly during the recording of each set of
readings a note was taken of the number of men who were working ateach point in the laboratory. This was done so that an estimate of the
exposure of the men to the noise could be made.At first these measurements were taken on a daily basis but because
of several setbacks the rate was later increased to two sets of readingsper day in order that the survey would be completed in the allotted time.This change in no way affects the validity of the results as the noiselevels during the day varied randomly.
Advantage was taken of a,day when the laboratory was closed downto measure the background noise due to the ventilation fans and the watercooling services. At the same time the average reverberation time was
measured for each octave band and overall. The noise source used forthis purpose was a large oil drip tray hit by a piece of wood. Thereverberation time was calculated by using the special protractorprovided by Bruel and Kjaer with the level recorder. .
Another series of measurements concerned the test cells.Measurements were taken in each of the test cells and just outsideT. C. 3 with various combinations of the doors open and closed to findthe effectiveness of the sliding doors which separated the test cells.
Measurements below SOdB were not recorded except those ofbackground noise. This was done because the range of the recorderwas such that the base had to be set on the paper trace at SOdB to aildwthe higher values to appear. In measuring the background noise thelevel could be set lower and in this case a base line of SOdB was used.
RESULTS AND DISCUSSION5.1 Observed sound levels.
5.1.1 Main laboratoryThe sound levels in the main laboratory varied from day to
day and position to position. The complete table of results forthe 50 readings is contained in Appendix 2 which is available onrequest. Various methods, such as the mean or median values,could be used to present the results, but Burns & Robinson (1970)have found that for calculation of expected hearing loss the mostpractical is the 93th percentile value. This is the noise levelwhich is exceeded for 2% of the time and will be referred to asLAg. Figures 2 and 3 show plans of the laboratory with typicalsound level contours superimposed. Figure 2 shows a noisy dayand Figure 3 a quiet day. The readings shown are in dBA. Thisis/

6.
is the sound level measured with the A weighting network of the
'• the noise measuring apparatus in operation.
5.1.2 Noise levels in te.et cellsA series of measurements were taken in the test
• bells. The results of these are shown in Table 2. Thesemeasurements were taken with various combinations of the
sliding doors between the test cells open and closed; Atthe time of taking these readings there were two sources of
noise. The hydraulic pump was in operation in T. C. 3 and
three conveyor idler rigs filled with slurry were working in
T.C.I. " • ' ' " " ' ' • • 'The first column shows the noise level inside T.C.I
with all doors closed. The second column shows that whenthe door of this cell leading to the main laboratory is opened
the level drops by IdB overall. This is due to the total
absorption of the noise incident at the door since there is
no surface from which it may be reflected.The third ccllumn is the noise level in T. C. 2 with
the sliding door communicating with TiC. 3 open and the
large fibreboard screen, which the fitter laid against the
door to T.'Ci 1> in place. The figures in the fourth column
show that removal of this screen was not very effective and
merely gave the fitter a sense of security.The fifth colurriri shows the level when the door .
between T.C.2 and TiC/3 was closed. The overall levelis reduced by 3dBA. Probably the reduction would be
greater if there was ai better seal on the door*The sixth column shows the values obtained in T. C.3
where the pump is situated and the last column shows the soundlevel outside the door of T ,C. 3 where the operator stands
during work carried out when the pump is in operation.5.1.3 Background noise and reverberation ..
Advantage was taken of a day when all the machinesunder test were switchedoff, to. measure the-background
noise and the reverberation time in the laboratory. These
results are shown in Tables 3 and .4.The first column in Table .3 shows the level when there
was nothing in operation inside the laboratory. It can be seen
that most of the noise is in the low frequency bands and thelevel above 1kHz is less than 30dB. The overall level is
35dBA. Switching on the ventilation fans increased this
level to. 49dBA and the water cooling service further raised
the/ • ' . : • • •

7.
level to SldBA. Obviously the ventilation system is the greatest
contributor to background noise although the background noise
level is very low in comparison with the noise in the laboratory
during normal operation.
Table 4 shows the average reverberation times at the
various frequencies and the average of these times. The values
vary from two seconds in the 250Hz and 16000 Kz bands to one
second in the 8000 Kz band. These reverberation times seem to
be very low but it must be remembered that a large proportion ofthe wall area of the laboratory is covered with absorbent material.5.1..4 Measurement on Individual Machines
' An attempt was made to measure the noise level around the
individual machines since previous work seemed to suggest that
this was directional in character. This failed because the noisefrom nearby rigs was too loud for it to be ignored in the measure-
ments. It is possible that the directional properties of thesound were due to other machines in operation nearby.
5.2 Exposure and risk of personnelA note was taken of the number of men working at each point ,
during the taking of each set of readings. This was done so that anestimate of exposure could be made* Table 5 shows the percentageexposure time per day at each point. Assuming that 28 men work atsome time or another in the laboratory the figures show that on average
each man spent 18.04% of his time in the laboratory and 81. 96% outside.If these figures are used with the LAg noise level referred to above>an estimate of hearing loss can be made using the equation developed
by Robinson (Op.Cit. 1970, p. 105).
H = 27. 5 (l + tanh{LA2 + 10 log (T/To) + Up -\i \ /15J + Up
Where H is the noise induced hearing loss in dBLA., is the 98 percentile noise level in dB A^ ' *T is the exposure duration calculated on the basis of 8 hours,
per day, 5 days per week. The unit is one year.
To is a reference duration time in years.Up is a constant depending on selected percentage p (Table 6)
- - ' . ' • ' ' • ' . i . . . . * •A is a constant depending on the frequency (Table 7)
Using the median LA0.from Table 1 (94dB) and the exposure time of• £t _ . .
18..04% the expected hearing loss for various frequencies calculated for
durations of 1, 5, 10 and 40 years. These are shown in Table 8.The frequency bands .5, 1 and 2 kHz were used because these are the
bands used in normal speech. .It can be seen that after working in the. laboratory for one year the
average hearing loss over the frequency bands . 5, 1 and 2 kHz for the
most sensitive 2% of the population would be 15. IdB, but if we look atthe/

8 , _ . . • " • ' . ' . '
50th percentile we see that half of .the.population would be expectedto have hearing losses of O.SdB after,one year, 0.9dB after fiveyears, 1. IdB after 10 years and 4. IdB after 40 years.
A graph was drawn of risk curves for the 2, 5, 10 and 50percentile hearing losses. This is.shown in Figure 4. Age andexposure duration are on the same axis as it was assumed for thesepurposes that the noise exposure started at age 20 years. Thedotted line at 25dB hearing loss is considered "The beginning ofslight impairment for the. understanding of Spoken English"(Amer.Acad. of Ophthalmology and Otqlaryngology, 1964).
Of course these figures are only a rough guide to what lossesmight be expected. The actual loss which might be found woulddepend on the age of man and his hi story, of noise exposure. Forinstance there are several men working in the laboratory who havehigher exposure than eighteen per cent of the day and several withlower exposure rates. .
6 . REMEDIAL MEASURES • . . ' . , . .6.1 Source of noise,
The source of the noise-with which this report is concerned is,of course, the machines under test. The noise which issues fromthe machines is due to gear noise, fan noise and other factors.
Harris (1957) has shown that machines can be made quieter- by the better design and production of gear wheels, and King (1965)discusses how source noise can be reduced by modifications inthe design of ventilation fans, armatures and gear teeth*
These factors, however, are the responsibility of themanufacturers of the machine but in view of the fact that • • •.legislation is likely to be introduced concerning noise in machinesit may be advisable to discuss improvements with the makers.
It is recommended that the measurement of noise emissionshould be one of the requirements in testing machinery.6.2 Transmission
Many of the machines in the laboratory use the floor as astructural member and are mounted on steel channels andsections. These members are a source of noise and thevibration is transmitted to the building through the floor. Thereare several vibration damping alloys which could be used forthese sections and their properties are discussed by Kane,Richmond and Robb (1966). These alloys have good structuralproperties and can be used as structural members on the machines.If these alloys were used the vibration transmitted to the floorwould/

9..
would be reduced greatly. It is not at present possible to give an
exact figure for this reduction, although discussions with manufacturers
of these alloys are proceeding.Although structural transmission plays a part in the noise problem
most of the noise heard is due to transmission through the air. The usual
method of reducing airborne noise is by enclosures of insulating material.
This method is impracticable in the main laboratory due to the fact that
most of the rigs occupy a large irregular area and the lay-out of the
laboratory is constantly changing. Other difficulties with complete
enclosure is that there must be crane access to the rigs and also
complete enclosure poses thermal problems with the likelihood of rigsoverheating.
Partial enclosures are sometimes used but it seems that they areineffective and the small reduction in noise is far outweighed by the
inconvenience of using them.This, of course, does not apply to the three test cells. Much could
be done for them. The rigs in T.C. 1 can be enclosed with acousticpanels and the walls of the cell lined with absorbent material. Thedoors of all the test cells should be panelled and an effective seal usedbetween the door and the surround.
The pump in T. C. 3 should be placed on vibration damping mountingsand should be enclosed with acoustic material. This cell should also bepanelled as should T. C. 2. .
It may be advantageous to fit a counterweight system on these slidingdoors to ensure that they would normally stay closed.
6.3 Ear defenders
All of these previous measures are concerned with preventing theproduction or transmission of noise. The other aspect of the problem
is the use of ear defenders to prevent the noise reaching the ear. Atthe moment there is provision in the laboratory for the use of glass down
which is a form of very fine glass wool. The advantage of this method
is that the glass down is cheap and disposable and there is no problem ofstorage or cleaning. The main disadvantage is that the down must befolded according to the instructions to be effective and to prevent piecesbeing left in the ear canal. Other disadvantages of any form of ear plug
are that many people have a built-in aversion to putting tilings into the earcanal and also in the case of glass down that it takes time to prepare the
plug. • •The,other form of ear protection is ear muffs. These are head-
phone type instruments which cover the whole ear. They have theadvantages that they are more easy to use than earplugs and do not
entail putting anything in the ear canal. Modern designs are very lightand/

10.
and comfortable in use. Ear muffs are more expensive than glass
down but are also more efficient. A comparison of the attenuation
characteristics of a typical earmuff and glass down is shown in Figure 5,
(Piesse,1962). *
Although most people realise that a noise can harm their hearing
if it IB sufficiently loud, they usually think in terms of some quite
exceptionally violent sound. Deafness can, in fact, be produced in a
much more insidious way by continual exposure to noise which might
well be regarded as acceptable in ordinary industrial life. Men must
therefore be alerted to the dangers of noise and the wearing of
protectors should be enforced in high noise levels. Since it is very
difficult to determine a high level, especially if one has some hearing
loss already, it is recommended that a warning system is installed
which will indicate when the noise level is dangerous.
It is possible to build at a cost of less than £100 a system which
would do this. It would consist of three microphones, and a sound level
meter with a switching device which would switch on a'number of
illuminated panels instructing the men to wear ear protection.
The microphones should be mounted on the walls above positions .
A2, A4 and C3. The warning signs should be placed inside the
door of the fitters1 workshop, inside the sound lock leading to the
corridors and on the East and South walls of the laboratory. The
switching level should be set at 90dBA and if this level is reached
at any of the microphones the warning would come on.
The use of such a warning system will assist the management
to take care of the hearing of the fitters and engineers in the :
laboratory.
7. CONCLUSIONS .
The noise level survey has shown that the noise level in the
laboratory can reach dangerously high levels. Calculation of
expected hearing loss, using noise level and exposure time,
provided figures for these losses for exposure times of 1, 5, 10 and
40 years.
Although treatment of the test cells with absorbing material
will reduce the noise levels this would be difficult in the main
laboratory. It may be possible to use vibration damping alloys
in supports to reduce the level.
The most effective way of reducing the risk of hearing loss
is by the use of ear defenders. These are very rarely used by
the men. It is recommended that a system be implemented v/hich
would give warning when the noise reached dangerous levels and
would/

11.v/ould tell the men to wear ear protection.
The management should take action to enforce the use of earprotection equipment. This will be facilitated by the use of the warningsystem.
3. ACKNOWLEDGEMENTSI wish to thank Mr. G. C. Knight and Mr. R. Butler of Proving and
Acceptance Branch, M«,R,D.E. for their help in carrying out thisproject at Bretby;
Mr. A. Marshall of Physics Laboratory, Wath-on-Dearne for hisadvice on the use of the equipment;
Mr. G,W. Smith of Instrumentation Branch, MeR.D.E, for hishelp in setting up and servicing the equipment;
Dr. A. A. Knight of the Institute of Occupational Medicine,Edinburgh, for his guidance and advice in all parts of the project and inthe writing of this report.
APPENDICESAppendix I shows the fifty sets of readings of sound levels which
were recorded in the laboratory. (Available on "request).Appendix II shows the numbers of men working at each point and the
totals. This part of the survey was not started at once so there areonly 47 readings.

R E F E R E N C E S
AMERICAN ACADEMY OF OPTHALMOLOGY AND OTOLARYNGOLOGY(1964). Guide for conservation of hearing in noise.
BRUEL & KJAER (1967). Acoustic noise measurements.
DREYFUSS, K. (1968). The measure of man : code on human factors indesign. 2nd ed. New York, Kill & Wang (Whitney Library of Design).
HARRIS, C. M. Editor (1957). Handbook of noise control. New York (etc.),McGraw-Hill.
KANE, J., RICHMOND, T.D0 & ROBB, D.N. (1965/66). Noise inhydrostatic systems and its suppression. Proc. Instn.mech. Engrs.180 (3D.
KING, A. J. (1965). The reduction of noise of mechanism and machines.In; P. E.R.A. Conton Noise Control. Melton Mowbray, ProductionEngineering Research Association.
PIESSE, R.A. (1962). Ear protectors. Sydney (Australia), CommonwealthAcoustic Laboratories, Report No. 21.
ROBINSON, D.E. (1970). Appendix 10. Relations between hearing lossand noise exposure: analysis of results of retrospective study.In; Hearing and noise in industry. Editors : W. Burns & D.E. Robinson,London, H. M. Stationery Office, pp. 100-151.

N
— .
1 I
w
<§.
B3B55
E*
FasHswicri
CD
DT.C.ID
LJ
m
CD
T__JT.C.2
T.C.3
Id I
• •
A 1
»- —
k.
C,2
B,2
^ V.
A, 2
i f^n FT
>c
E
/
:-:'! 1. !lH!ibs•HJW'
,3
,3
^,3
If
s
_ 154 Ft.
•i..flan of the Laboratory Shovdng Measuring Points and Dteensions
C
B
A
,4
Y
A
t
-1 r-i f I 1 1 1 11^
C,5
F*
1! 'w
! 1 1• ,
1 ;: j
B,5
A,5
*r
\ — i n r"^r =Jlr~i i
r
i
1 i
3 Ft
J •*
Figure 1

w
CD
IV)Typical Noise Contours for a 'Quiet Day1
Figure 2.

w E
Typical Noise Contours for a "Quiet Day1
Figure J.

30-
£20
i/)inO_i
(D
LUI
20
O
50%
30
10
4O
20
50
30
TIME IN YEARS
AGE
EXPOSUREDURATION
GRAPH SHOWING THE RISK CURVES FORTHE ROTARY ENGINE TESTING
LABORATORY.
FIGURE 4

o-
CD IO-
z020
z30UJh-
50
GLASS DOWN
EAR MUFFS
25O 5OO IOOO 2OOO 4OOOFREQUENCY Hz. *
A COMPARISON OF THE PURE TONEATTENUATION CHARACTERISTICS OFGLASS DOWN AND EAR MUFFS,
FIGURE 5

TABLE 1
Sound Level Chart - Rotary Testing Laboratory-5 2Readings in dB ref. 2 x 10 N/m
98th Percentile Noise Levels (L^2)
POSITION
Frequency.Rating
31. 5 Hz
63 Hz
125 HzH
250 Hz
500 Hz
1000 Hz
2000 Hz
4000 Hz
8000 Hz
16000 Hz
32000 Hz
A
B
C
Linear
78
77
86
88
99
86
82
78
68
-
-94
97
98
98
A, 2
73
75
87
90
88
97
90
72
73
67
97
97
97
97
A, 3
77
75
79
98
89
90
86
79
73
69
97
99
99
100
A, 4
69
77
80
87
93
92
87
79
75
67
95
96
97
98
A, 5
77
76
84
92
87
84
81
73
69
-
90
93
93
94
B.I
74
73
80
87
87
85
80
72
67
60
92
95
95
95
!
B,2
80
74
81
94
90
87
79
72
65
-
92
95
96
96
B,3
79
79
79
86
85
96
89
74
67
-
97
97
97
97
B.4
80
79
88
95
96
91
88
81
76
65
97
98
99
100
B,5
76
77
78
87
87
89
85
78
74
71
94
95
95
95
C, 1
75
73
75
83
89
88
74
66
60
-
89
90
90
91
C,2
77
75
85
86
91
83
81
76
62
-
91
93
95
95
m O
73
73
80
84
96
98
90
80
74
72
99
100
101
103
C.4
75
78
90
86
91
94
86
77
72
63
96
97
97
97
C,5
73
73
83
87
87
90
83
75
70
65
92
93
94
94
Table 1i

TABLE 2
Sound Level Chart.- Rotary Testing Laboratory
Readings in dB ref. : .0002u bar
Mid bandFrequency
Hz
31.5
63125
250
500
1000
2000
4000
8000
16000
31500
A
B
CLin.
T.C.IDoorClosed
74
66
82
9797
98
94
8981
66-
101
102
102
102
T.C.IDoorOpen
70
68
81
9596
97
93
88
80
66-
100
101
101
101
T.C.2Pumpon
DoorOpen
7683858687
87
86
84
75
67-
9292
93
94
T.C.2DoorOpenScreen
off
758384
8787
87
86
84
75
67-
92
9394
94
T.C.2Door
ClosedScreenoff
74
82
82
8586
8583
7764-
-
89
91
9192
T.C.3Pumpon
82
93
93
9195
95
94
93
83
69-
100
100
101101
Doorof
T.C.3
78
85
84
8589
9089
9983
74
-
95
95
9596 i
i
Table 2

TABLE 3
Sound Level Chart - Rotary Testing Laboratory
Readings in dB ref. : . 0002u bar
Mid BandFrequency
Hz
31.5
63
125
- 250500
1000
2000A
B
CLin.
All off
62
62
47
40
40
35
5061
64
Fans on
676152
4747
46
4955
65
67
Fan andWater Pump
67
62
53
52
50
47
4051
57
66
68
TABLE 4Sound Level Chart - Rotary Testing Laboratory
Readings in dB ref. : . 0002>i bar
Mid Band FrequencyHz Reverberation Time
31.5
63
125
250
500
1000
20004000300016000Lin.
1.4
1.5
1.51.5
2
1.5
1.51.3
1
21.55 )
average.)
Tables 3 & 4-

TABLE 5Average percentage exposure of men at eachposition assuming 28 men are exposed in the
laboratory at the same time
Position
% exposure
A.I
.90
A.2
.76.
A, 3
.69
A,4
.30
A, 5
.53
B,l
.34
B,2
.69
B,3
3.36
B,4 B,4JC,1
2.82i 0.0813.2 7! i
C,2
.91
C,3
.84
C,4JC,5 j
1.22J.84J
This means that on average a man is exposed to the noise in thelaboratory for 18.04% of the time and is out of the noise for81.96% of the time.
TABLE 6Frequency parameter jMn H Function
Frequency (RH )z
.5 132.3128.7122.2
Robinson (1970)
Tables 5 & 6

TABLE 7
Gentile parameter U in H Function
1 Gentile P
Susceptible ears
2
5
10
20
25
40
50
60
75
80
90
95
98
Resistant ears
U(dB)
12.1
9.8
7.6
5.0
4.0
U5
0
1.5
4
5
7.6
9.8
12.1
(Robinson 1970)
Table 7

TABLE 8Calculated Hearing Loss for 18.04% exposure and = 94dB
T = 1 year
AgeCorrection = 0
T = 5 years
AgeCorrection= . 1
T = 10 years
AgeCorrections , 5
T = 40 years
AgeCorrections 1.9
"\ Freq.
P.^^V.•v
o
51050
25
10
50
2
5
10
50
2i
5
10
50
t\
500Hz
13.7
10.9
8.4
.3
13.9
11.2
3; 4.3
14.6
11.6
9.0
.6
17.31 13.9
10.4
1.1
lOOOHz
14.4
11.4
8.9
.5
14.6
11.7
9.0.6
15.712.09.5.8
19.315.312.01.7
2000Hz
17.3
13.6
10.6
1.1
17.9
14.2
10^9
1.4
19,0
15.8
12.3
1.9
26.9
21.3
17.0
3.9!
Average
15.1
12.0
9.3
.6
15.5
12.4
10.0
.8
16.4
13.1
10.3
1.1
21.2
16.8
13.1
2.2
A
Correction
15.112,09.3.6
15.612.510.1
.9
16.913.610.81.6
23.118.715.04.1
Table 8

Appendix 2
Numbers of Men at each point during each cet of readings
Date
May18
19
20
21
22
23
27
28
June9
10
11
12
25
26
20
30
July
1
2
3
6
7
8/!
1
1
1
1
3
i2
1
1
1
3
2
1
2
1
2
I
4
1
1
g
1
4
2
G
1
21
1
2
3
7
1
1
i
8
1o
3
1
1a
2
4
2
2
4r,
4
4
21
1
9
2
1
1
11
1
2
2
2
21
1S
2
r>
10
1
11
1
3
3
2
2
31
1
4
1c*,
22
4
12
3
1
3
3
2
!
13
2
1
1
3
1
14
1
1
1
11
1
!
15
1
~.
__
1of.,
11
„.. ....,.-i., ,, „._«-!.. . - r --.'

- 2 -•
Date
July8
Q
13
14
15
13
17
1
1.
1
1
3
12i j
2
2
4
10
3
1
g
4
1
!
5
i
4 7
6
J.
11
7
r\
1
4
i 91 ,
3
2̂i
ci
1
AA
9
13
2
0
1
1
2
1
1,
37
10
,
11
3
2
2
1
2
r-.
43
12
12i
13
1
11
11
14
11
2
2
1
11
1
16
15
1
oCJ
1
1.i.
11
Point
47 Readings
Average Number in Laboratory during each set of readings = -^j^•£ S
Average number of men at each point is;-
123 4 5 S 7 8 9 10 11 12 13 14 15
12 10 E 7 11 9 44 37 11 1C 1147 47 47 47 47 47 47 41 47 47 47 47 47 47 47

H£r0)Ifioe
rre
tD£J01
crq
3(D
V)0)CL
aoHOO
CO
re

oCDzn>-iP
rtsi
rt>
raCTO>-
t
trCDl-j
oCD
CD
P
0)
ffioHOO
trfD
rP
o
Pr*
Ol-j

HEAD OFFICE:
Research Avenue North,Riccarton,Edinburgh, EH14 4AP, United KingdomTelephone: +44 (0)870 850 5131Facsimile: +44 (0)870 850 5132
Email: [email protected]
Tapton Park Innovation Centre,Brimington Road, Tapton,Chesterfield, Derbyshire, S41 0TZ, United KingdomTelephone: +44 (0)1246 557866Facsimile: +44 (0)1246 551212
Research House Business Centre,Fraser Road, Perivale, Middlesex, UB6 7AQ,United KingdomTelephone: +44 (0)208 537 3491/2Facsimile: +44 (0)208 537 3493
Brookside Business Park, Cold Meece, Stone, Staffs, ST15 0RZ,United KingdomTelephone: +44 (0)1785 764810Facsimile: +44 (0)1785 764811
(A20115) IOM (R) ReportCov art 3/15/06 12:32 PM Page 2