Embed Size (px)
Citation preview

Historical Life Cycle Costs of Steel &
Concrete Girder BridgesDr. Michael Barker, PE
Professor, University of Wyoming
Director of Education, SSSBA
Steel Bridge Essentials
Summer Webinar Series
June 23, 2021

SSSBA, Short Span Economic
Overview
The Short Span Steel Bridge Alliance (SSSBA)
Initial Costs
County & State Case Studies
Life Cycle Costs

A group of bridge and buried soil structure industry leaders who have joined together to provide educational information on the design and construction of short span steel bridges in installations up to 140 feet in length.
Rolled Beam & Plate
Girder Girders
Buried Bridges Truss
Press Brake & Folded Plate
Short Span Steel Bridge Alliance – Who We Are

Producers
Coaters
ContractorsBridge Owners Universities
Service Centers
Fabricators
Fasteners
Trade Organizations
Design Firms
SSSBA – Our Members
Initial Costs – Steel vs Concrete
Preconception that Concrete is Less
Expensive than Steel for Typical Bridges
Many Times Steel is Not Even Considered
Owners Paying More Than They Could for Bridges
Unwarranted Lack of Competition Not Good
Case Studies from County & State Bridges

Case Study Bridges: Audrain County, MO
MO Bridge 411
– Built 2012
– 4 Steel Girders
– 47.5 ft Span
– 24 ft Roadway Width
– 2 ft Structural Depth + Slab
MO Bridge 336
– Built 2012
– 6 Precast Hollowcore Slabs
– 50.5 ft Span
– 24 ft Roadway Width
– 2 ft Structural Depth + Slab
County Crew
Built Bridges

Side-by-Side Comparison of Total Cost of Bridge
Steel:
– Total Bridge Costs:
• Material = $41,764
• Labor = $24,125
• Equipment = $21,521
• Guardrail = $7,895
• Rock = $8,302
• Engineering = $8,246
• TOTAL = $111,853
TOTAL= ($97.48/ft2)
Concrete:
– Total Bridge Costs:
• Material = $67,450
• Labor = $26,110
• Equipment = $24,966
• Guardrail = $6,603
• Rock = $7,571
• Engineering = $21,335
• TOTAL = $154,035
TOTAL= ($120.83/ft2)
19.3% Total
Cost
Savings w/
Steel

Superstructure Only Cost Comparison
Steel:
– Superstructure Only:
• Time = 10 days
• Girders = $21,463
• Deck Panels = $7999
• Reinf. Steel = $3135
• Concrete = $4180
• Labor = $5522
• Equipment* = $500
• TOTAL = $42,799
TOTAL $37.54 / ft2
Concrete:
– Superstructure Only:
• Time = 13 days
• Slab Girders = $50,765
• Deck Panels = $0
• Reinf. Steel = $724
• Concrete = $965
• Labor = $4884
• Equipment* = $4000
• TOTAL = $61,338
TOTAL $50.61 / ft2
Material Considerations:
• Added cost to use galvanized steel ≈ $0.22/lb (includes est. 10% fabrication fee)
• Added cost to use weathering steel ≈ $0.04/lb (already included in cost in example)
Equipment Considerations:
• County crane (30-ton) used for steel; Larger rented crane required for concrete
• Equivalent county crane cost is $1520 (would result in steel cost of $38.88 / ft2)

True Steel vs Concrete Cost Comparison
Steel:
– Superstructure total cost of
$37.54 per ft2
Concrete:
– Superstructure total cost of
$50.61 per ft2
Same bridge conditions:
• Structural Depth = 2 ft + Slab (No Difference in Approaches)
• Roadway Width = 24 ft
• Same Abutments for Both Can be Used (Steel Could Use Lighter)
• Same Guard Rail System
• Same Work Crew
25.8%
Superstructure
Cost Savings

Advantages of Steel Bridge
Lighter cranes required
– Owner cranes can save costs
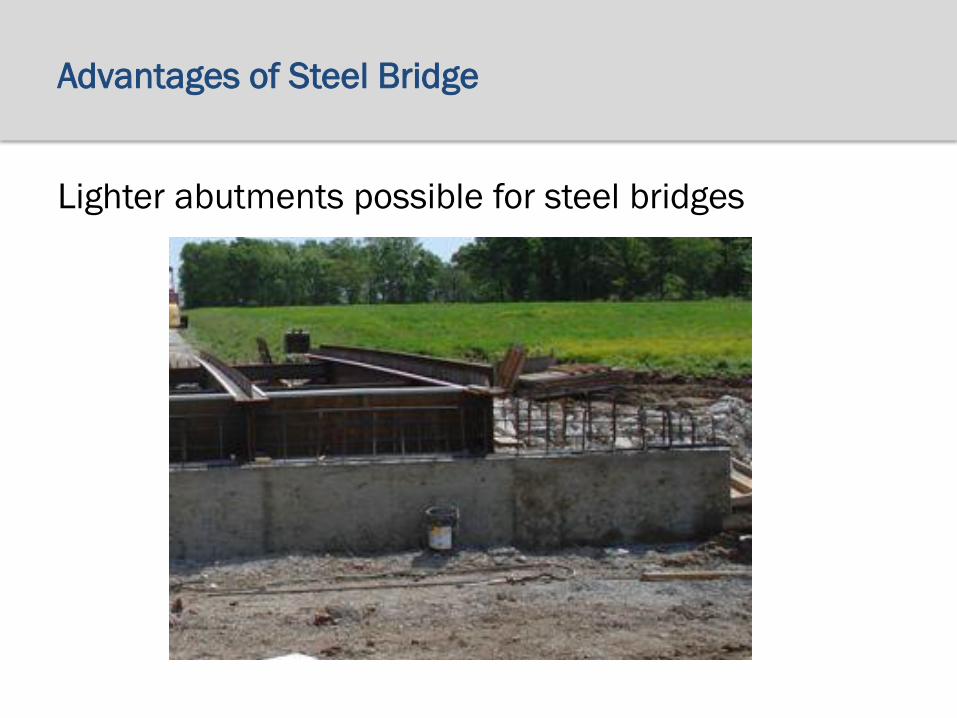
Advantages of Steel Bridge
Lighter abutments possible for steel bridges

Efficiencies of Steel Bridge
Cast-in-place deck on prestressed concrete deck panels
or corrugated metal decking

Efficiencies of Steel Bridge
Simple and practical details
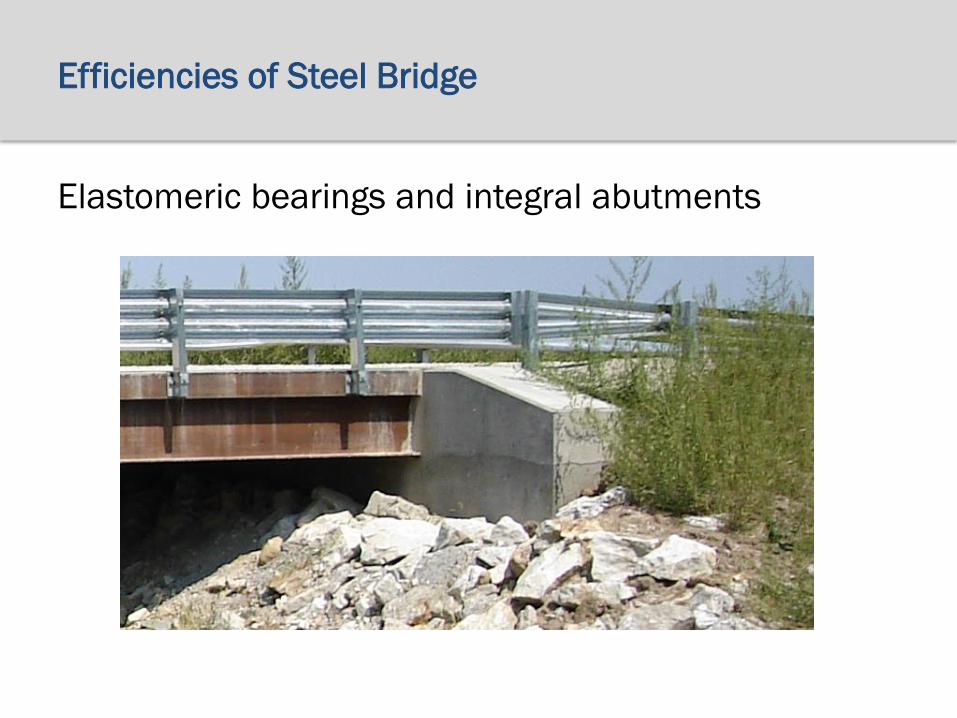
Efficiencies of Steel Bridge
Elastomeric bearings and integral abutments

Efficiencies of Steel Bridge
Use of weathering steel

Case Study Bridges: Additional Bridges in MO
Superstructure Steel Concrete
Bridge Number 061 140 149 152 710 AVG 028 057 069 520 AVG
Year Built 2008 2008 2008 2009 2010 AVG 2009 2010 2011 2006 AVG
Span Length 50 50 40 62 64 53.2 36 36 38 40 37.5
Skew 0 0 0 30 35 13 0 15 20 30 16.25
Cost Summary
- Labor $14,568 $21,705 $15,853 $24,765 $31,949 $21,768 $12,065 $15,379 $14,674 $19,044 $15,291
- Material $56,676 $53,593 $46,282 $92,821 $69,357 $63,746 $51,589 $54,450 $50,576 $46,850 $50,866
- Rock $6,170 $6,216 $3,694 $8,235 $6,501 $6,163 $5,135 $7,549 $5,378 $3,621 $5,421
- Equipment $7,487 $12,026 $7,017 $19,579 $15,266 $12,275 $5,568 $10,952 $11,093 $14,742 $10,589
- Guardrail $4,715 $7,146 $3,961 $7,003 $7,003 $5,966 $4,737 $4,663 $5,356 $3,323 $4,520
Construction Cost $89,616 $100,686 $76,807 $152,403 $130,076 $109,918 $79,094 $92,993 $87,077 $87,580 $86,686
CONST. COST PER FT2 $74.68 $83.91 $80.01 $102.42 $84.68 $86.09 $91.54 $107.63 $95.48 $91.23 $96.32

Concrete P/S: 92 ft – 92 ft Steel Plate Girder: 98 ft – 98 ft
Route H (Columbia Airport) Discovery Parkway (Columbia)
Built 2011 Built 2007
Two Near Identical MoDOT State Bridges Crossing US 63

Letting Date 5/27/2011 Letting Date 9/28/2007
1800 206-10.00 Class 1 Excavation 85 CUYD $1,700.00 1560 206100 Class 1 Excavation 130 CUYD $4,420.00
1810 702-10.12 Structural Steel Piles (12 in.) 737 LF $33,533.50 1580 7021012 Structural Steel Piles (12 in.) 1850 LF $64,750.00
1820 702-60.00 Pre-Bore for Piling 240 LF $9,600.00 1570 6071066 Pedestrian Fence 470 LF $33,840.00
1830 702-70.00 Pile Point Reinforcement 22 EA $2,420.00 1590 7027000 Pile Point Reinforcement 60 EA $5,700.00
1840 703-20.03 Class B Concrete (Substructure) 76.2 CUYD $45,339.00 1600 7032003 Class B Concrete (Substructure) 171.7 CUYD $60,095.00
1850 703-42.13 Slab on Concrete I-Girder 630 SQYD $160,650.00 1610 7034212 Slab on Steel 1835 SQYD $308,280.00
1860 703-42.15 Safety Barrier Curb 438 LF $27,156.00 1620 7034215 Safety Barrier Curb 387 LF $17,415.00
1870 705-60.03 Type 6 (54in.), Prestressed Concrete I-Girder731 LF $120,615.00 1650 7121121 Fabricated Structural Low Alloy Steel (Plate Girder) A709, Grade 50439610 LB $518,739.80
1880 706-10.60 Reinforcing Steel (Bridges) 7860 LB $9,039.00 1630 7061060 Reinforcing Steel (Bridges) 15820 LB $15,029.00
1890 707-10.00 Conduit System on Structure L.S. $5,500.00 1640 7071000 Conduit System on Structure L.S. $7,000.00
1900 712-33.01 Steel Intermediate Diaphragm for P/S Concrete Girders6 EA $3,900.00 1660 7123610 Slab Drains 12 EA $2,400.00
1910 715-10.01 Vertical Drain at End Bents 2 EA $3,000.00 1700 7151001 Vertical Drain at End Bents 2 EA $4,000.00
1920 716-10.02 Laminated Neoprene Bearing Pad 8 EA $1,200.00 1720 7162000 Laminated Neoprene Bearing Pad 9 EA $10,800.00
1930 716-10.03 Laminated Neoprene Bearing Pad (Tapered)8 EA $2,480.00 1710 7161003 Laminated Neoprene Bearing Pad (Tapered) 18 EA $6,750.00
1940 725-10.00 Corrugated Metal Pipe Pile Spacers 10 EA $20,000.00 1730 7251000 Corrugated Metal Pipe Pile Spacers 20 EA $5,000.00
1670 7125365A Intermediate Field Coat (System G) 22100 SQFT $30,940.00
1680 7125370A Finish Field Coat (System G) 2800 SQFT $3,220.00
1690 7129911 Misc. Fab. Struc. Low Alloy Steel (Aesthethics) 24330 LB $54,742.50
Total Bridge Cost = $440,632.50 Total Bridge Cost = $1,057,538.80
Cost/ft2 = $77.71 Cost/ft
2 = $64.04
Cost/ft2 with ENR CCI Adjustment of 1.139 = $72.94
Concrete P/S: 92 ft – 92 ft Steel Plate Girder: 98 ft – 98 ft
Route H (Columbia Airport) Discovery Parkway (Columbia)
Built 2011 Built 2007
Costs for Concrete & Steel Bridges

Summary on Initial Costs
Preconception is Wrong
Steel & Concrete Bridges Are Competitive
Both Steel & Concrete Bridges Should Be
Considered for Bridge Projects

As owners replace their bridge infrastructure, the question of
Life Service and Life Cycle Costs routinely comes up
between concrete and steel bridge options
The bridge industry does not have a good answer:
Both steel and concrete bridge advocates claim an advantage
Anecdotal information is not convincing
What About Life Cycle Costs?

Examine Historical Life Service (Performance
and Maintenance) and Agency Life Cycle Costs
(True Agency Costs for a Bridge) of Steel and
Concrete Bridges in Pennsylvania
Report on www.ShortSpanSteelBridges.org
Thank You to PennDOT professionals for their participation.
Thanks to SMDI, NSBA and AGA for supporting the work.
Historical life Cycle Costs of Steel & Concrete Bridges

Start with a Comprehensive Inventory of Bridges
Initial Costs & Date Built
Maintenance Costs and Date Performed
End of Service Date – End of Life Model
0 20 30 40 50 60 70 years
Replace with
Identical Bridge
Every 70 years
Initial Cost
Contract Maintenance Maintenance
0 20 30 40 50 60 70 years
Replace with
Identical Bridge
Every 70 years
Initial Cost
Contract Maintenance Maintenance
Life Cycle Cost Data Collection

Criteria to Develop LCC Bridge Database
Modern typical bridge structures
Precast I-Beam, Box Adjacent, and Box Spread bridges
Steel Rolled Shape and Welded Plate Girder bridges
Bridges built between 1960 and 2010
Bridges with complete and accurate department maintenance records
Consider any maintenance cost that is equal to or greater than $0.25/ft2
Bridges with known initial costs
Bridges with complete and accurate external contractor maintenance and
rehabilitation
PennDOT Database Development
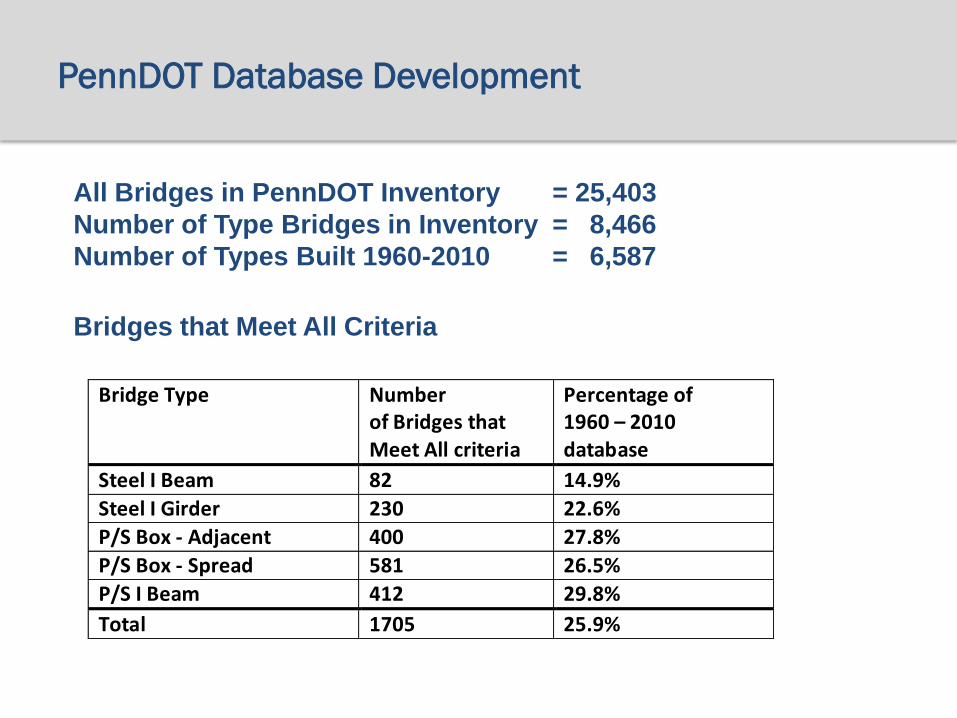
All Bridges in PennDOT Inventory = 25,403
Number of Type Bridges in Inventory = 8,466
Number of Types Built 1960-2010 = 6,587
Bridges that Meet All CriteriaTable 8: Final LCC Database that Meets All Criteria
Bridge Type Number of Bridges that Meet All criteria
Percentage of 1960 – 2010 database
Steel I Beam 82 14.9%
Steel I Girder 230 22.6%
P/S Box - Adjacent 400 27.8%
P/S Box - Spread 581 26.5%
P/S I Beam 412 29.8%
Total 1705 25.9%
PennDOT Database Development

Bridge Life Model uses Average Deterioration Rates of Total
PennDOT Inventory𝐷𝑒𝑡𝑒𝑟𝑖𝑜𝑟𝑎𝑡𝑖𝑜𝑛 𝑅𝑎𝑡𝑒 =
2014 𝐶𝑜𝑛𝑑𝑖𝑡𝑖𝑜𝑛 𝑅𝑎𝑡𝑖𝑛𝑔 − 9
2014 − (𝑌𝑒𝑎𝑟 𝐵𝑢𝑖𝑙𝑡)
𝑅𝑒𝑚𝑎𝑖𝑛𝑖𝑛𝑔 𝐿𝑖𝑓𝑒 =3 − 2014 𝐶𝑜𝑛𝑑𝑖𝑡𝑖𝑜𝑛 𝑅𝑎𝑡𝑖𝑛𝑔
(𝐴𝑣𝑒𝑟𝑎𝑔𝑒 𝐷𝑒𝑡𝑒𝑟𝑖𝑜𝑟𝑎𝑡𝑖𝑜𝑛 𝑅𝑎𝑡𝑒)
𝐵𝑟𝑖𝑑𝑔𝑒 𝐿𝑖𝑓𝑒 = 2014 − 𝑌𝑒𝑎𝑟 𝐵𝑢𝑖𝑙𝑡 + 𝑅𝑒𝑚𝑎𝑖𝑛𝑖𝑛𝑔 𝐿𝑖𝑓𝑒 Table 9: Average Deterioration Rates
Bridge Type Number of Bridges 1960 - 2010
Deterioration Rate (Condition Rating
Loss/Year)
Steel I Beam 550 -0.07114
Steel I Girder 1017 -0.08144
P/S Box - Adjacent 1440 -0.08125
P/S Box - Spread 2196 -0.07988
P/S I Beam 1384 -0.08383
Super Structure Condition Rating Used
Assume Bridge Replacement
at Condition Rating = 3
PennDOT Database Bridge Life Model
Steel Rolled
Precast Box SpreadAll are “similar” with None “Way Out” of Balance

Precast Spread Box-Beam Bridge
BrKey: 30570 Bridge Type: P/S, Box Beam (Spread) County: Shuylkill Location: 0.75 mi. N of Exit 107(33) Year Built: 1969 Spans: 3 Length: 176 ft Deck Area: 7621 ft2
Super Cond Rating: 5 Average Precast Box Beam – Spread bridge deterioration rate = -0.07988
𝑅𝑒𝑚𝑎𝑖𝑛𝑖𝑛𝑔 𝐿𝑖𝑓𝑒 =(3 − 5)
−0.07988= 25 𝑦𝑒𝑎𝑟𝑠
𝐵𝑟𝑖𝑑𝑔𝑒 𝐿𝑖𝑓𝑒 = 2014 + 25 − 1969 = 70 𝑦𝑒𝑎𝑟𝑠
Agency Life Cycle Costs – An Example
Schuykill

Example Bridge Costs
2014 𝐷𝑜𝑙𝑙𝑎𝑟𝑠 =𝐶𝐶𝐼 2014
𝐶𝐶𝐼 19𝑋𝑋19𝑋𝑋 𝐷𝑜𝑙𝑙𝑎𝑟𝑠
Initial Cost: Year = 1969 Cost = $141475 ($18.56/ft2) Work: Bridge Construction
External Contract: Year = 1988 Cost = $58401 ($7.66/ft2) Work: Latex Overlay
Maintenance 1: Year = 2009 Cost = $1891 ($0.25/ft2) Work: Repair Concrete Deck
Maintenance 2: Year = 2013 Cost = $2510 ($0.33/ft2) Work: Repair Concrete Deck
Transform the costs to constant 2014 dollars using Construction Cost
Initial Cost: Year = 0 Cost = $18.56/ft2(9806/1269) = $143.45/ft2
External Contract: Year = 19 Cost = $7.66/ft2(9806/4519) = $ 16.63/ft2
Maintenance 1: Year = 40 Cost = $0.25/ft2(9806/8570) = $ 0.28/ft2
Maintenance 2: Year = 44 Cost = $0.33/ft2(9806/9547) = $ 0.34/ft2
ENR Construction Cost Indices
Costs for the Life Cycle Cost Analysis

Example Bridge Life Cycle
Present Value Cost for 1 Cycle
Perpetual Present Value Cost = Capitalized Cost
With Capitalized Costs, Can Compare Bridges Directly
0 20 30 40 50 60 70 years
Replace with
Identical Bridge
Every 70 years
Initial Cost
Contract Maintenance Maintenance
𝑃𝑉𝐶 = $143.45 + $16.63(1.023)−19 + $0.28(1.023)−40 + $0.34(1.023)−44 = $154.49/𝑓𝑡2
𝑃𝑃𝑉𝐶 = $154.49 1 + 0.023 70
1 + 0.023 70 − 1 = 1.256 $154.49 = $193.97/𝑓𝑡2
OMB Circular A-94 2011 30 yr Discount Rate = 2.3%
Life Cycle Costs

Additional Bridges Removed Based on PPVC/Capitalized Costs
To Consider “Typical” Bridges, Keep Bridges with
PPVC within +/- 1 Standard Deviation of Overall Average
Bridges in the Life Cycle Cost AnalysesTable 13: Final Life Cycle Cost Database
Bridge Type Number of Bridges in Table 11 Database
Number of Bridges in LCC Study Database
Steel I Beam 82 54
Steel I Girder 230 144
P/S Box - Adjacent 400 282
P/S Box - Spread 581 397
P/S I Beam 412 309
1705 1186
Typical Bridge Life Cycle Costs

The Steel Plate Girder Bridge Data Base
General Information Maintenance & Contract Work Initial & LCC
The full history of the bridgeLocation, year built, spans, length, area, geometry, materials
Department and contractor maintenance performed
Initial, perpetual present value, and future maintenance costs
Life Cycle Costs Analysis Database

Analysis and Variables Examined in Report
Bridge Life
PPVC/Capitalized Costs
Number of Spans
Bridge Length
PVC Future Costs
Department Maintenance
External Contracts
For Steel Bridges
Curved vs. Straight
Fracture-Critical
Protection (Painted, Weathering, Galvanized)
For the entire report:
www.ShortSpanSteelBridges.org
Additional LCC report on Galvanizing:
www.ShortSpanSteelBridges.org
Life Cycle Cost Report

Table 10: Final LCC Database that Meets All Criteria
Bridge Type Number of Bridges in Final LCC Database
Average Year Built
Average Bridge Life (years)
Steel I Beam 82 1981 81.3
Steel I Girder 230 1977 79.2
P/S Box - Adjacent 400 1985 74.0
P/S Box - Spread 581 1984 79.9
P/S I Beam 412 1984 74.5
Steel Rolled
Precast Box - Spread
All are “similar” with None “Way Out” of Balance
Results for Bridge Life

Cumulative Density Function on Bridge Life

Table 14: Life Cycle Cost Results Using Total Database
# Bridges PPVC Initial Cost Future Cost Avg Length Avg # Spans Avg Year Built Avg Life
Steel I Beam 54 $232.78 $194.78 $0.42 166 2.19 1980 82
Steel I Girder 144 $273.71 $226.10 $0.21 406 4.07 1976 80
P/S Box - Adjacent 282 $278.30 $223.74 $0.96 89 1.31 1987 74
P/S Box - Spread 397 $256.11 $210.65 $2.06 89 1.56 1986 79
P/S I Beam 309 $217.50 $174.10 $0.20 212 2.43 1985 73
Precast I Beam
Steel Rolled
All are “similar” with None “Way Out” of Balance
Capitalized Costs (Perpetual Present Value) – All Bridges
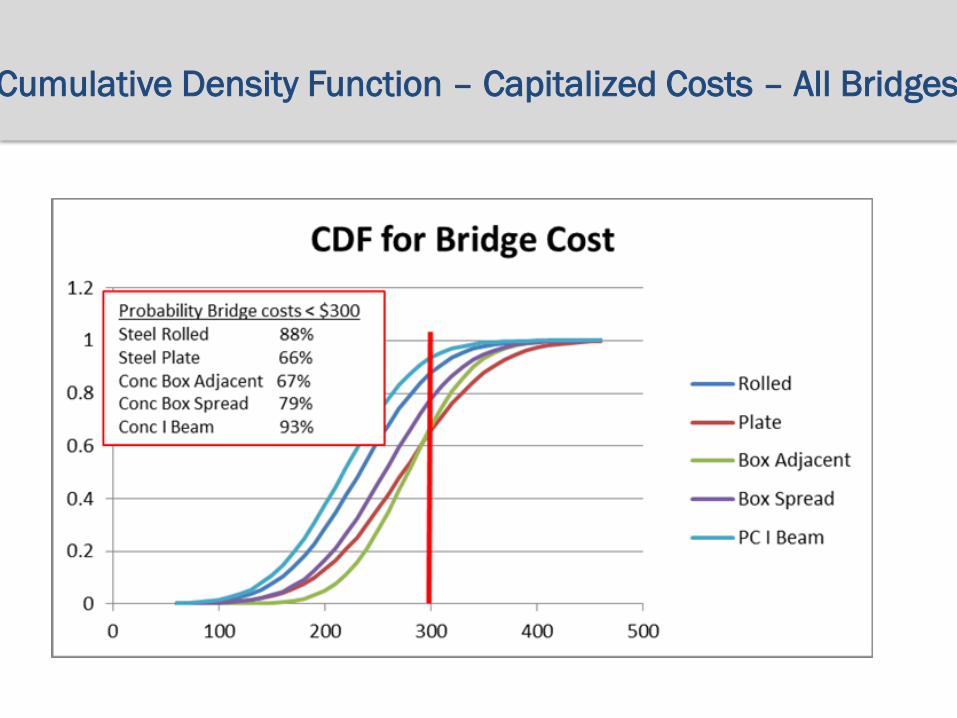
Cumulative Density Function – Capitalized Costs – All Bridges

Perpetual Present Value Cost – Length<140 ft
Steel Rolled
Precast Box Spread
Short Length Bridges for Short Span Steel Bridge Alliance
All are “similar” with None “Way Out” of Balance
Table 20: Life Cycle Cost Results for Bridge Length Maximum = 140 ft
# Bridges PPVC Initial Cost Future Cost Avg Length Avg # Spans Avg Year Built Avg Life
Steel I Beam 27 $266.24 $222.08 $0.16 84 1.26 1978 82
Steel I Girder 18 $311.26 $257.19 $0.29 119 1.00 1977 81
P/S Box - Adjacent 240 $292.38 $235.03 $0.95 69 1.09 1987 74
P/S Box - Spread 325 $272.20 $225.14 $2.16 64 1.23 1986 81
P/S I Beam 98 $281.64 $231.20 $0.05 104 1.08 1987 77
Capitalized Costs (Perpetual Present Value) – Short Span

Steel Rolled Beam
Precast I Beam
Precast Box Spread
Precast Box Adjacent
Steel Plate Girder
Which Type of Bridge is Best?

All are “similar” with None “Way Out” of Balance
Overall Weighted Average PPVC = $252.40/ft2 – Capitalized Costs
Bridge Types within 14% of
Weighted Average
Standard Deviation Range
$48.02/ft2 - $65.60/ft2
[COV ≈ 20% - 25%]
Any One Type of Bridge May Be
Most Economical for a Given
Bridge Project
There is No One Type of Bridge That Clearly Beats the Others
Which Type of Bridge is Best?
Probability Density Function Capitalized Costs

Typical Concrete and Steel Bridges are Competitive on Initial Cost, Future
Costs, Life Cycle Costs and Bridge Life
For any Given Bridge Project, Concrete or Steel Bridge Types May Be the
Most Economical
Preconception that Concrete is Always Less Expensive is a Misconception
Owners Should Consider Both Steel and Concrete Alternatives for
Individual Bridge Projects
Conclusions
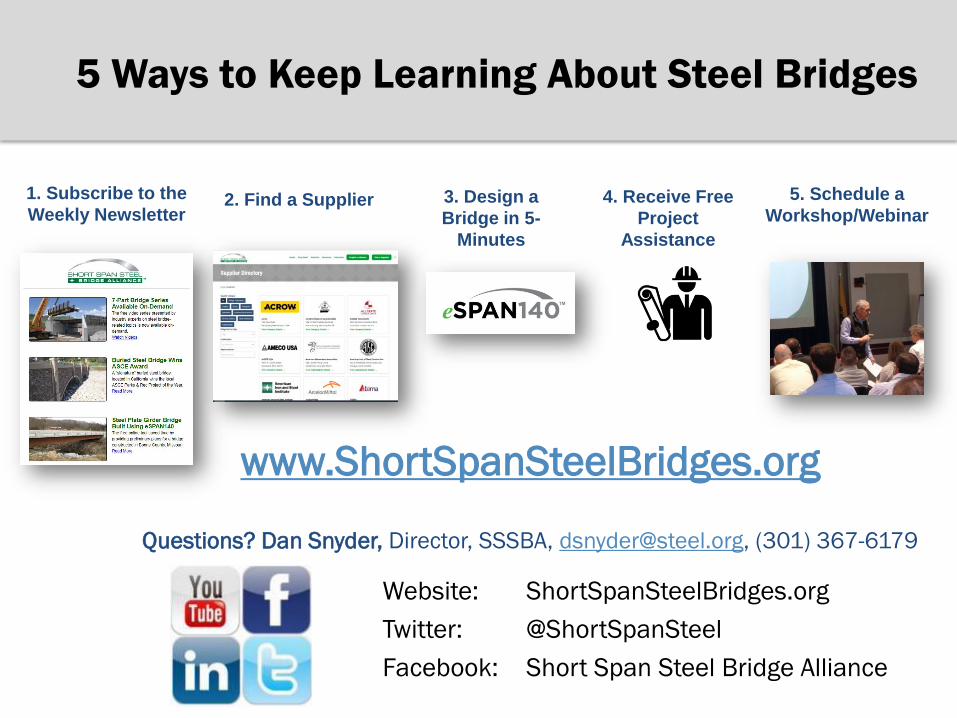
5 Ways to Keep Learning About Steel Bridges
www.ShortSpanSteelBridges.org
Questions? Dan Snyder, Director, SSSBA, [email protected], (301) 367-6179
1. Subscribe to the
Weekly Newsletter 2. Find a Supplier 4. Receive Free
Project
Assistance
3. Design a
Bridge in 5-
Minutes
5. Schedule a
Workshop/Webinar
Website: ShortSpanSteelBridges.org
Twitter: @ShortSpanSteel
Facebook: Short Span Steel Bridge Alliance


![USS Box Girder Bridges a Construction Manual[1]](https://img.pdfslide.us/doc/110x75/552720ee4979598a178b4583/uss-box-girder-bridges-a-construction-manual1.jpg)