Embed Size (px)
Citation preview
Historical Climatology: St. Cloud, Minnesota
Provided in collaboration with the Michigan Office of the State Climatologist www.glisa.msu.edu Last updated: 3/27/2013
Map generated with Google Maps
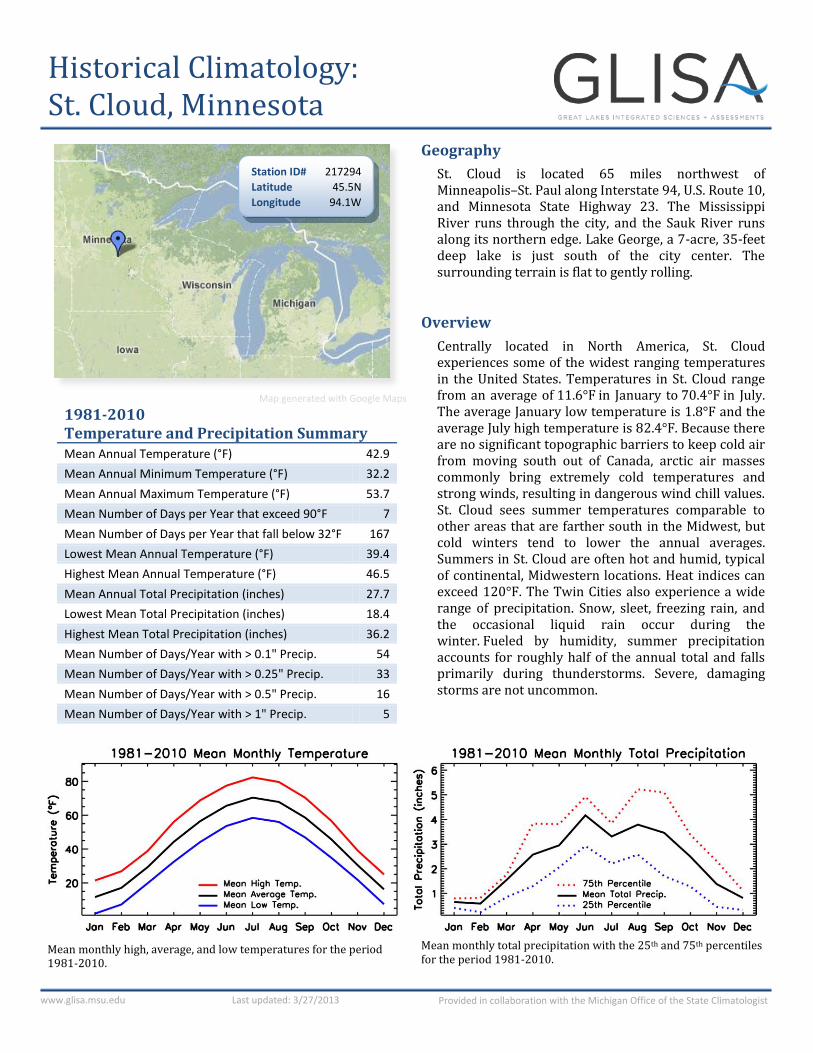
Geography
St. Cloud is located 65 miles northwest of Minneapolis–St. Paul along Interstate 94, U.S. Route 10, and Minnesota State Highway 23. The Mississippi River runs through the city, and the Sauk River runs along its northern edge. Lake George, a 7-acre, 35-feet deep lake is just south of the city center. The surrounding terrain is flat to gently rolling.
Overview
Centrally located in North America, St. Cloud experiences some of the widest ranging temperatures in the United States. Temperatures in St. Cloud range from an average of 11.6°F in January to 70.4°F in July. The average January low temperature is 1.8°F and the average July high temperature is 82.4°F. Because there are no significant topographic barriers to keep cold air from moving south out of Canada, arctic air masses commonly bring extremely cold temperatures and strong winds, resulting in dangerous wind chill values. St. Cloud sees summer temperatures comparable to other areas that are farther south in the Midwest, but cold winters tend to lower the annual averages. Summers in St. Cloud are often hot and humid, typical of continental, Midwestern locations. Heat indices can exceed 120°F. The Twin Cities also experience a wide range of precipitation. Snow, sleet, freezing rain, and the occasional liquid rain occur during the winter. Fueled by humidity, summer precipitation accounts for roughly half of the annual total and falls primarily during thunderstorms. Severe, damaging storms are not uncommon.
1981-2010 Temperature and Precipitation Summary Mean Annual Temperature (°F) 42.9
Mean Annual Minimum Temperature (°F) 32.2
Mean Annual Maximum Temperature (°F) 53.7
Mean Number of Days per Year that exceed 90°F 7
Mean Number of Days per Year that fall below 32°F 167
Lowest Mean Annual Temperature (°F) 39.4
Highest Mean Annual Temperature (°F) 46.5
Mean Annual Total Precipitation (inches) 27.7
Lowest Mean Total Precipitation (inches) 18.4
Highest Mean Total Precipitation (inches) 36.2
Mean Number of Days/Year with > 0.1" Precip. 54
Mean Number of Days/Year with > 0.25" Precip. 33
Mean Number of Days/Year with > 0.5" Precip. 16
Mean Number of Days/Year with > 1" Precip. 5
Mean monthly high, average, and low temperatures for the period 1981-2010.
Mean monthly total precipitation with the 25th and 75th percentiles for the period 1981-2010.
Station ID# 217294 Latitude 45.5N Longitude 94.1W
Historical Climatology: St. Cloud, Minnesota
www.glisa.msu.edu Provided in collaboration with the Michigan Office of the State Climatologist Last updated: 3/27/2013
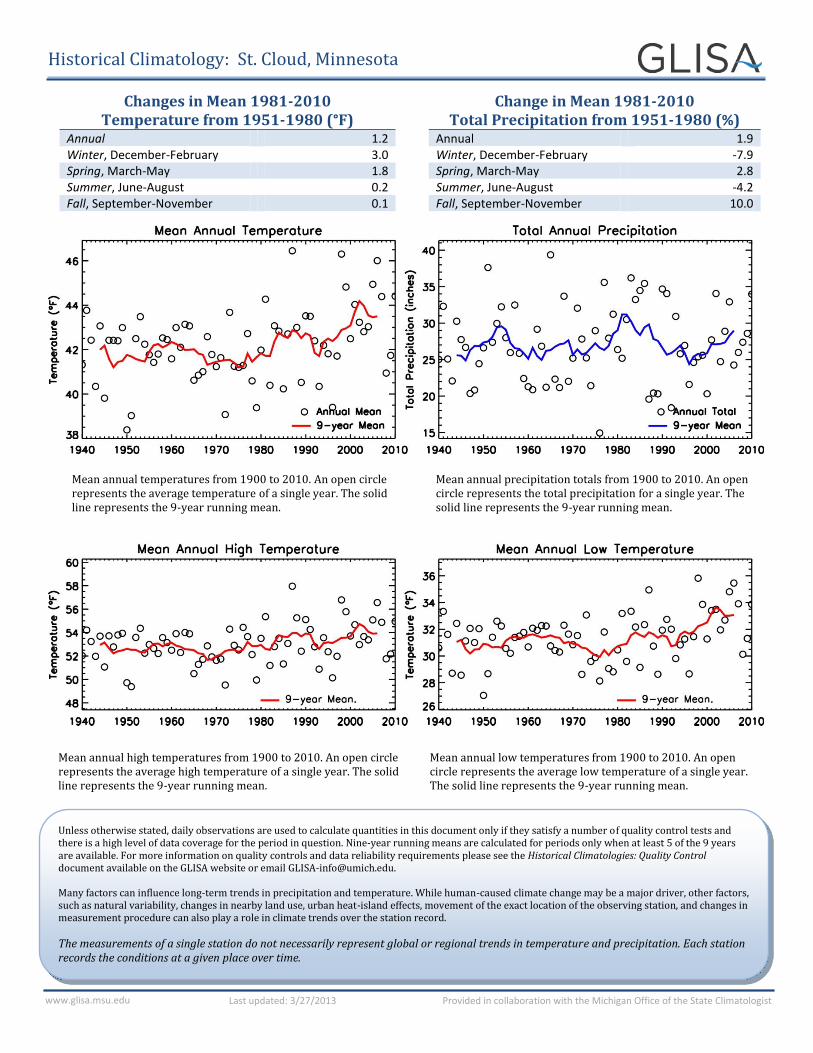
Changes in Mean 1981-2010 Temperature from 1951-1980 (°F)
Annual 1.2 Winter, December-February 3.0 Spring, March-May 1.8 Summer, June-August 0.2 Fall, September-November 0.1
Change in Mean 1981-2010 Total Precipitation from 1951-1980 (%)
Annual 1.9 Winter, December-February -7.9 Spring, March-May 2.8 Summer, June-August -4.2 Fall, September-November 10.0
Mean annual temperatures from 1900 to 2010. An open circle represents the average temperature of a single year. The solid line represents the 9-year running mean.
Mean annual precipitation totals from 1900 to 2010. An open circle represents the total precipitation for a single year. The solid line represents the 9-year running mean.
Mean annual high temperatures from 1900 to 2010. An open circle represents the average high temperature of a single year. The solid line represents the 9-year running mean.
Mean annual low temperatures from 1900 to 2010. An open circle represents the average low temperature of a single year. The solid line represents the 9-year running mean.
Unless otherwise stated, daily observations are used to calculate quantities in this document only if they satisfy a number of quality control tests and there is a high level of data coverage for the period in question. Nine-year running means are calculated for periods only when at least 5 of the 9 years are available. For more information on quality controls and data reliability requirements please see the Historical Climatologies: Quality Control document available on the GLISA website or email [email protected]. Many factors can influence long-term trends in precipitation and temperature. While human-caused climate change may be a major driver, other factors, such as natural variability, changes in nearby land use, urban heat-island effects, movement of the exact location of the observing station, and changes in measurement procedure can also play a role in climate trends over the station record.
The measurements of a single station do not necessarily represent global or regional trends in temperature and precipitation. Each station records the conditions at a given place over time.
Historical Climatology: St. Cloud, Minnesota
www.glisa.msu.edu Provided in collaboration with the Michigan Office of the State Climatologist Last updated: 3/27/2013
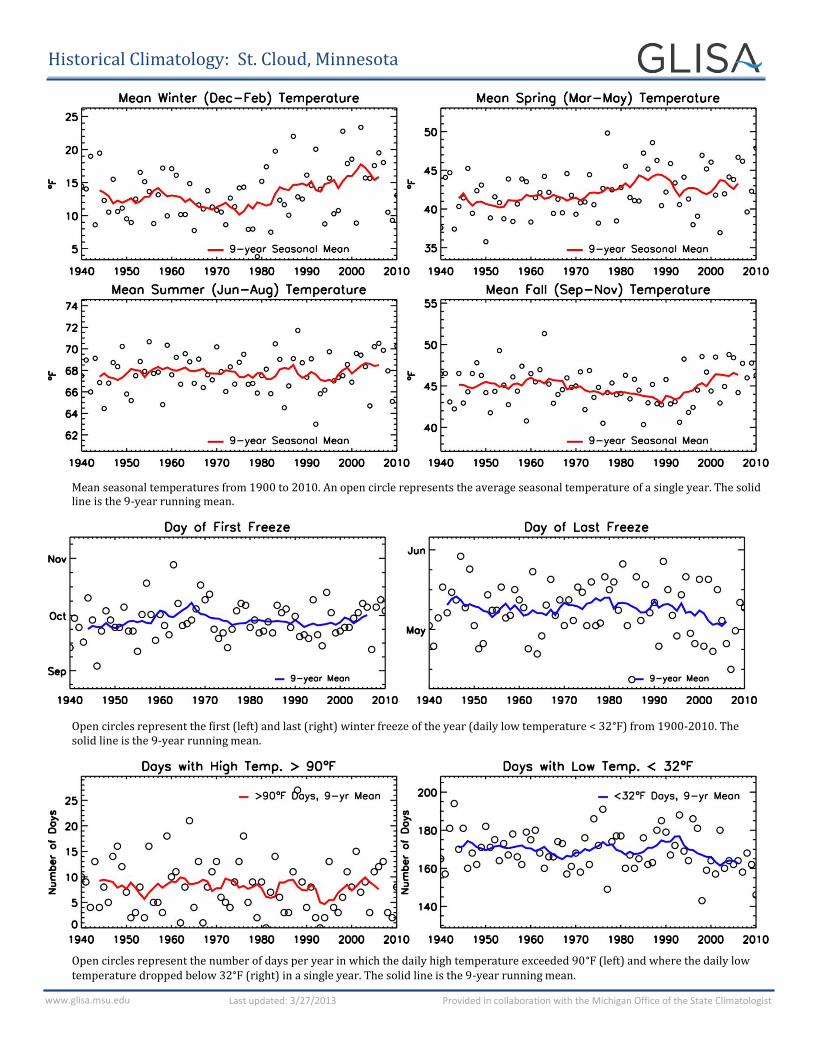
Mean seasonal temperatures from 1900 to 2010. An open circle represents the average seasonal temperature of a single year. The solid line is the 9-year running mean.
Open circles represent the first (left) and last (right) winter freeze of the year (daily low temperature < 32°F) from 1900-2010. The solid line is the 9-year running mean.
Open circles represent the number of days per year in which the daily high temperature exceeded 90°F (left) and where the daily low temperature dropped below 32°F (right) in a single year. The solid line is the 9-year running mean.
Historical Climatology: St. Cloud, Minnesota
www.glisa.msu.edu Provided in collaboration with the Michigan Office of the State Climatologist Last updated: 3/27/2013
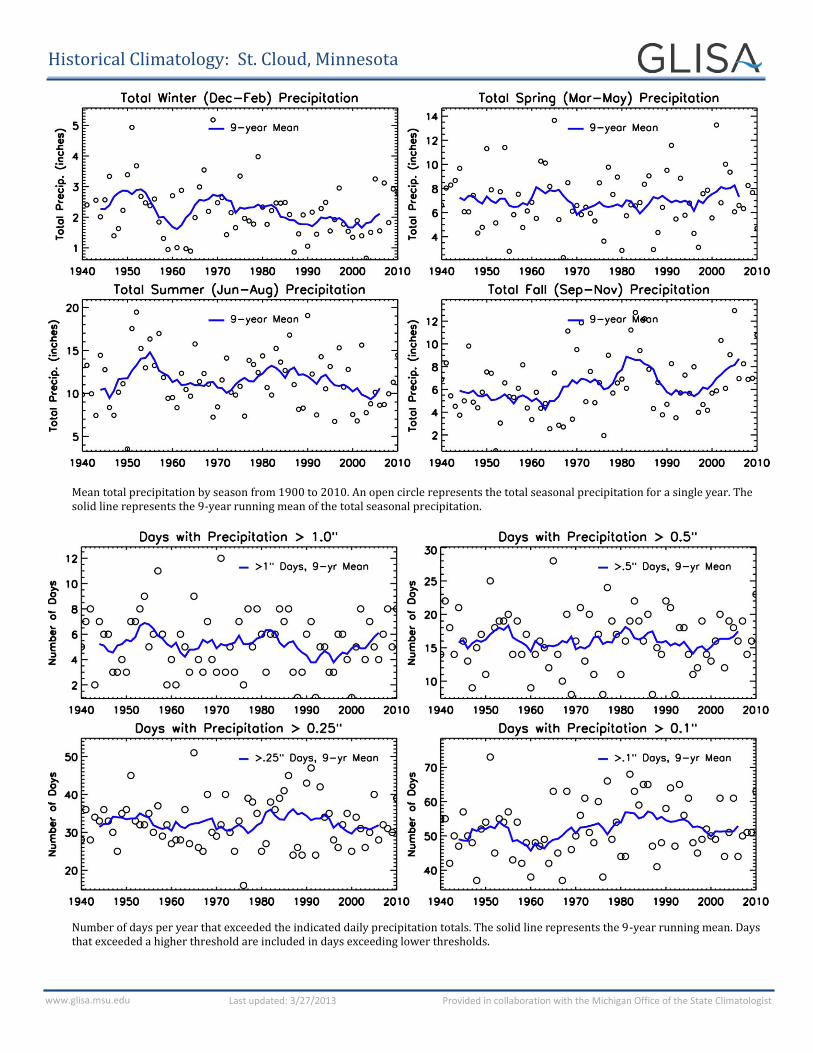
Mean total precipitation by season from 1900 to 2010. An open circle represents the total seasonal precipitation for a single year. The solid line represents the 9-year running mean of the total seasonal precipitation.
Number of days per year that exceeded the indicated daily precipitation totals. The solid line represents the 9-year running mean. Days that exceeded a higher threshold are included in days exceeding lower thresholds.


![Climatology [Autosaved]](https://img.pdfslide.us/doc/110x75/577cd2e91a28ab9e78964bc6/climatology-autosaved.jpg)